Digging for Britain – Cerne Abbas

Introduction

In a recent instalment of Digging for Britain, Alice Roberts stirred the archaeological debate by asserting that the Dorset Chalk Giant at Cerne Abbas had Saxon origins rather than prehistoric roots. This added a layer of intrigue, especially from a landscape archaeology perspective. At first glance, the giant’s features appear to echo a much earlier connection, reminiscent of other chalk figures found elsewhere in Britain, where their placement within the landscape suggests a deeper, functional context.

Curiosity led to a closer look at the methods used to date this iconic figure, and the findings raise several important questions. While the programme presents a clear and confident conclusion, a deeper inspection reveals fundamental issues and omissions that call into question its reliability. This is not just about one site but about broader methodological problems in archaeology, particularly the uncritical acceptance of dating approaches that underpin many historical assumptions.
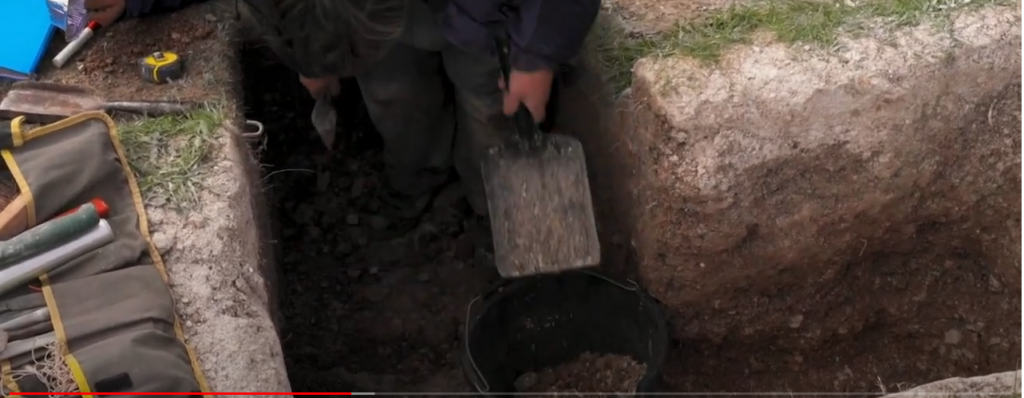
Small trenches for dating evidence

The primary technique involved excavating four small trenches and penetrating approximately 1 m into the topsoil to extract samples. The underlying assumption is that the surface beneath the chalk line represents the original ground level and therefore provides the latest possible date for the figure’s creation. While the theory itself is not unreasonable, the reliance on just four sampling points raises serious concerns about the representativeness of the results.

To fully support such a method, variations across the entire area beneath the figure would need to be taken into account. Limited sampling introduces the risk of missing key variations in the soil and sediment, which could significantly alter the dating outcome. Scientific investigation depends on comprehensive data, and without it, conclusions remain open to question.
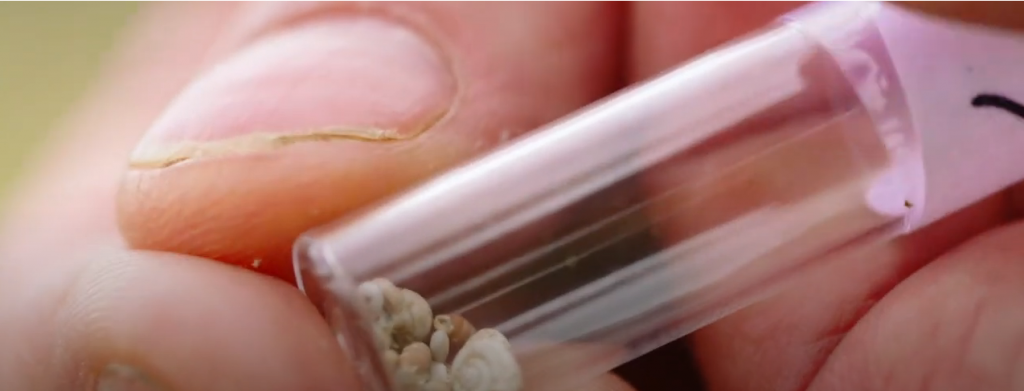
 (Digging for Britain - Cerne Abbas)
Snail used to date the chalk figuare

In addition, the programme does not fully explore alternative interpretations or the potential impact of environmental processes on the site. This becomes particularly important when considering evidence from other studies, in which larger datasets have shown a wide range of dates from similar contexts. In one such case, forty-two samples produced dates ranging from the ninth millennium BCE through to the historic period, yet only a subset was used to support the final interpretation. This raises an obvious question about the selection and exclusion of data.

The reliance on a very small number of samples for OSL dating introduces a substantial margin of uncertainty. Across a large area such as this, variation is expected. With such limited data, the resulting data range cannot be considered definitive. The methodology, including how samples are collected and interpreted, does not meet the level of precision expected in modern scientific analysis.

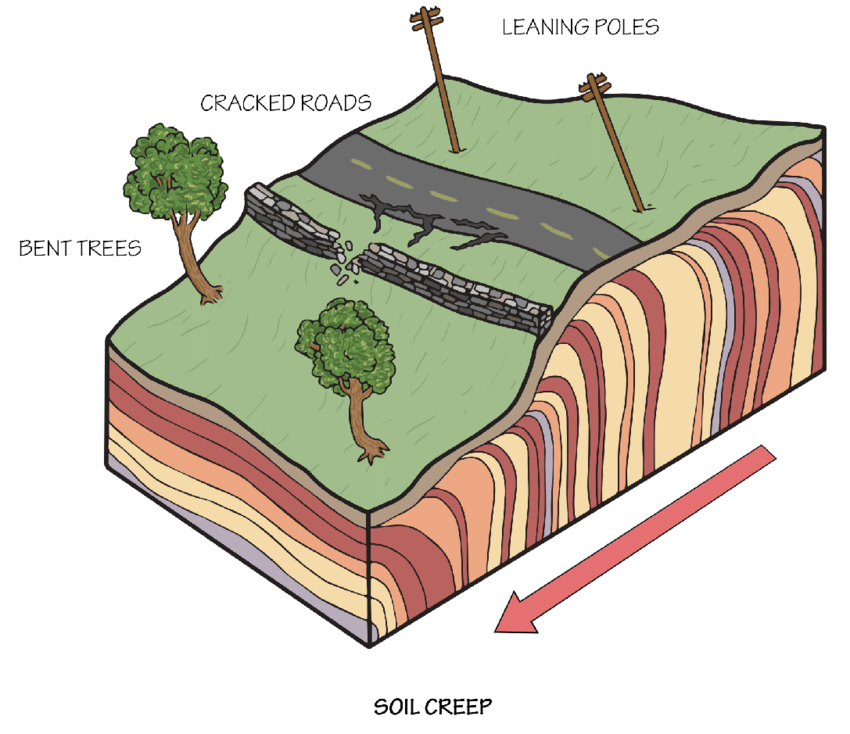
There is also a fundamental geological factor that appears to have been overlooked. The site sits on a steep slope, where soil creep is an ongoing process. Even at a conservative rate, soil can move approximately one metre over a thousand years. This means that materials such as snails and sediments beneath the figure are not necessarily in their original position. Over long periods, they can be displaced downslope, disconnecting them from the original context to which they were dated.

The physical construction of the figure itself also raises questions. The current form sits within topsoil rather than being cut directly into the underlying chalk bedrock. From a practical perspective, a prehistoric construction would be more logically cut into solid chalk to ensure durability and reduce maintenance needs. The fact that the figure requires ongoing upkeep suggests a different history, potentially involving phases of covering and reworking.
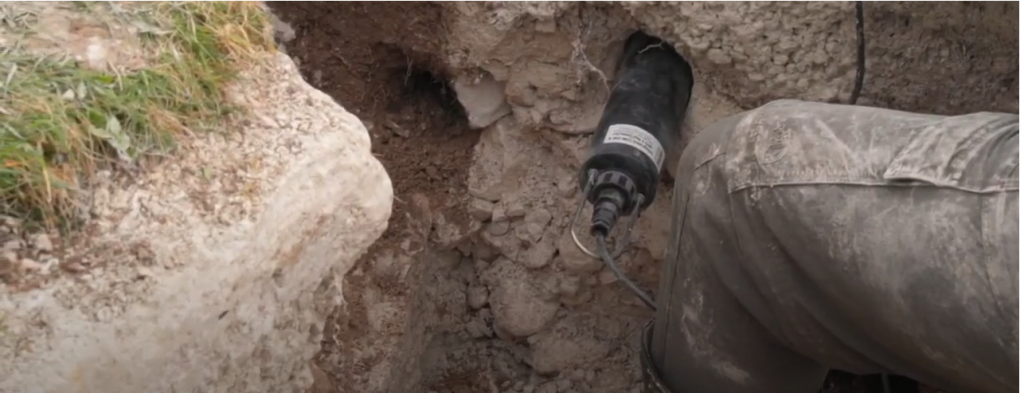
 (Digging for Britain - Cerne Abbas)

Historical accounts suggest that subsequent activity may have altered or preserved the figure, raising the possibility that what is visible today is not the original construction. This opens the question of whether an earlier figure existed beneath the current one, potentially modified or replaced at a later date.

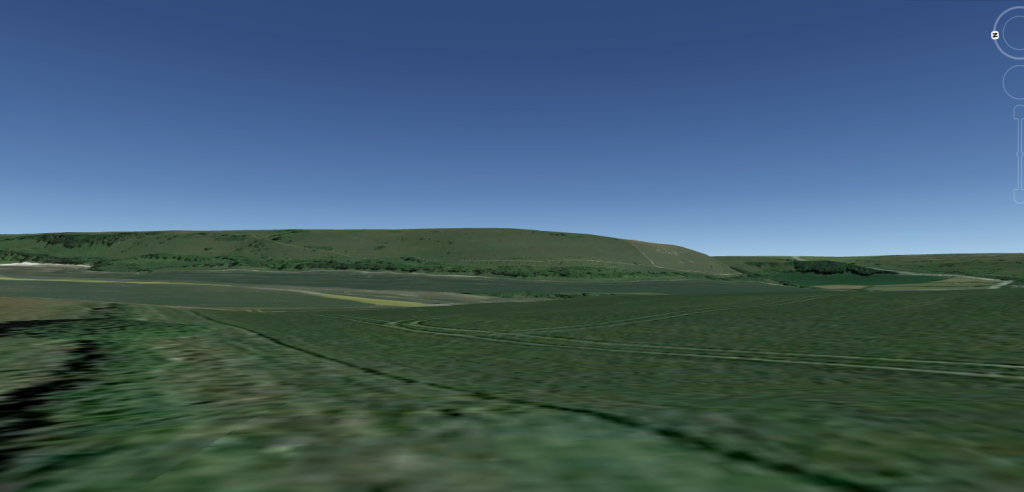
The landscape context adds further complexity. The figure is positioned at the edge of a range of hills rather than at its highest point, and its full form is clearly visible only from elevated viewpoints. This challenges the idea of it functioning as a simple ground-level marker and instead suggests that its placement may relate to a broader landscape system that is no longer immediately visible.
 (Digging for Britain - Cerne Abbas)

When all of these factors are considered together, the conclusion presented in the programme appears far less certain than initially suggested. The evidence does not point to a simple, single-phase construction, but rather to a more complex history influenced by geological processes, environmental change, and possible later modification.

Archaeological interpretation must remain grounded in robust, testable methods. When conclusions rely on limited data, untested assumptions, or incomplete consideration of environmental factors, they risk presenting certainty where uncertainty remains.
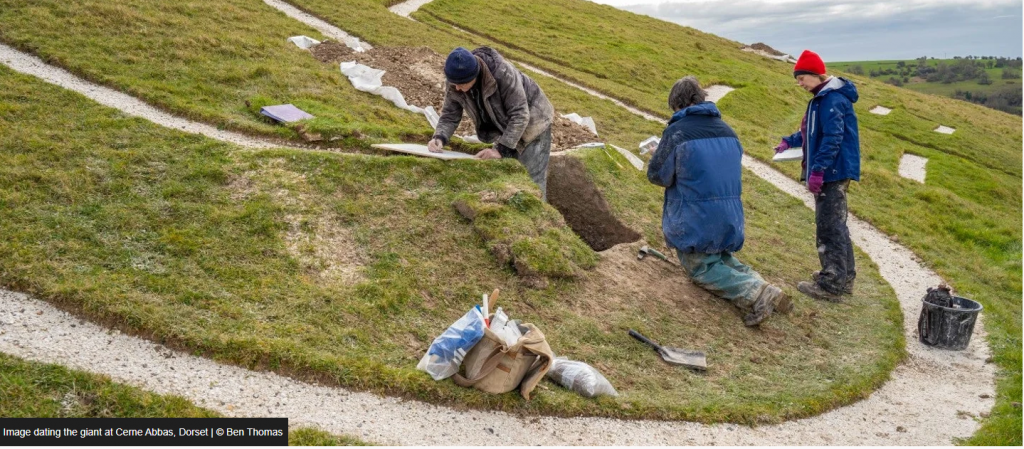
 (Digging for Britain - Cerne Abbas)
The current Figuare sits on top of the soil with broken chalk that needs constant maintenance

The Dorset Chalk Giant is not a straightforward case. It is a reminder that understanding the past requires not just data, but careful evaluation of how that data is gathered, interpreted, and applied.

The next stage of analysis will examine the wider landscape using LiDAR data, with the aim of reconstructing how this site functioned in a prehistoric environment and what it may originally have represented.
Digging for Britain - Cerne Abbas
The Giant is to the far right of the Hill Range and near the bottom – why not at the top of the middle if it’s a marker?

Part 2

Now, in this second part, our focus shifts to the professionalism of archaeologists involved in such endeavours and, by extension, the broader state of the archaeological profession in the 21st century. A critical lens is turned towards the National Trust’s excavation efforts, particularly the four trenches dedicated to OSL dating. Despite the extensive timeframe of over two years for this undertaking, the conspicuous absence of an official report raises concerns about transparency and the ability of other knowledgeable individuals to conduct scrutiny. This delay in producing and sharing findings with the wider community calls into question the efficiency and accessibility of archaeological information.

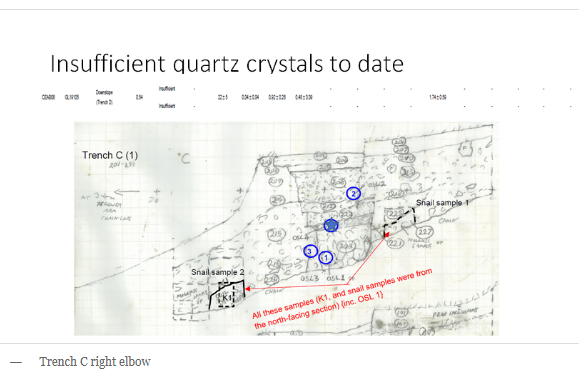
The quality of documentation further comes into question, as hand-drawn cross-sections, seemingly rushed and lacking the meticulous detail expected in rigorous scientific practices, were presented. This not only reveals an apparent ‘back of an envelope’ approach but also underscores a profound oversight by the experts. Despite having two years for scrutiny and examination, critical questions were left unexplored, a shortcoming magnified by the collaboration with the BBC for the televised program.
Digging for Britain Debunked - Cerne Abbas
Digging for Britain Debunked – Cerne Abbas

Cerne Abbas

The absence of a comprehensive and timely report, coupled with the apparent lack of attention to detail in documentation, casts doubt on the thoroughness and professionalism of the archaeological efforts surrounding Cerne Abbas. The urgency to present findings to the media and create a documentary may have compromised the meticulousness required in archaeological endeavours.

This prompts a broader reflection on the state of the archaeological profession itself. The slow pace of report publication, potential gaps in expertise, and a seeming reluctance to subject findings to rigorous scrutiny raise concerns about the discipline’s agility and accountability in contemporary times.

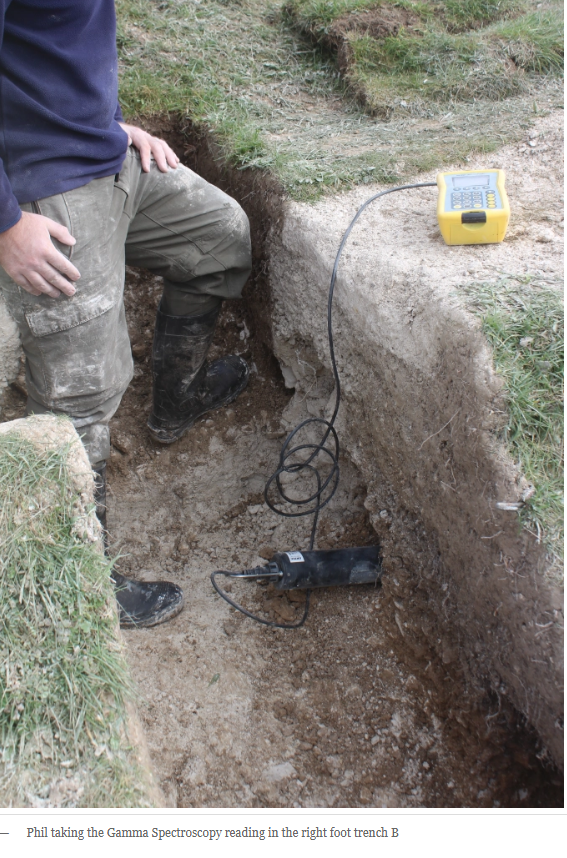
The deficiencies in the excavation process around Cerne Abbas become more apparent when we scrutinise the placement of the trenches and the sampling locations. The hand-drawn illustrations (which I consider ‘outdated’ in an era of affordable, widely available 3D high-definition cameras) indicate that samples were taken from the topsoil just above the chalk bedrock. However, a photograph reveals a more accurate location at the bottom of the topsoil, near the chalk bedrock, leading to the conclusion that it is Saxon.
Digging for Britain Debunked - Cerne Abbas

Poor Conclusions

A critical oversight emerges when we consider the implications of the Saxon date. If accurate, the absence of topsoil dating back thousands of years raises intriguing questions. Three plausible scenarios are explored: the deliberate removal of soil before the construction of Cerne Abbas, the initial absence of soil, or inaccuracies in OSL dating.

Option one, soil removal, implies an intention to obliterate what was originally present, raising logistical questions about the necessity for such an extensive process compared to the simplicity of laying new lines on existing chalk.

Option two speculates on the absence of soil due to something atop the bedrock, a theory we will delve into further.

Option three questions the accuracy of OSL dates, which, if proven, could cast doubt on the entire OSL science.

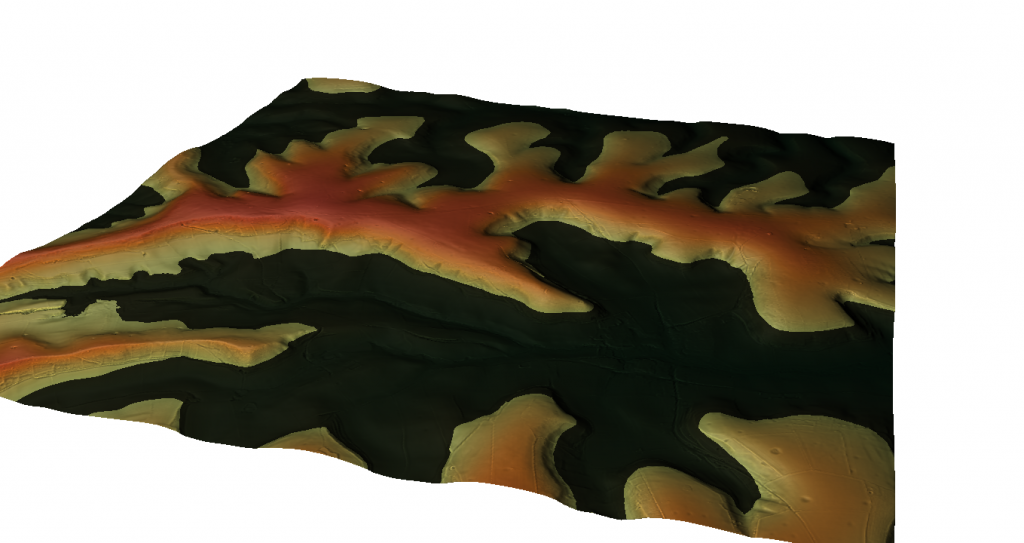
Option two gains credence when exploring the Post-Glacial Hypothesis, which is grounded in the notion of elevated sea levels in prehistoric times. LiDAR imagery of the site reveals a landscape shaped by Mesolithic waters, with identified natural harbours and Neolithic camps indicating the higher historical river levels. Archaeological findings, including tools and earthworks, support the hypothesis that the river running parallel to the figure was significantly higher during the Neolithic period.
Digging for Britain Debunked - Cerne Abbas
Mesolithic Coastline – Digging for Britain Debunked – Cerne Abbas

Prehistoric Landscape

This scenario accounts for approximately 7,000 years with no topsoil in the figure. Examining the bedrock reveals signs of extensive water weathering, consistent with chalk erosion over thousands of years. The excavation report and photographs reveal broken chalk at the base of the topsoil, indicating water-induced erosion and redeposition. The darkened appearance, a result of drying after being broken and re-laid on top, mirrors the common impact of water on solid chalk.
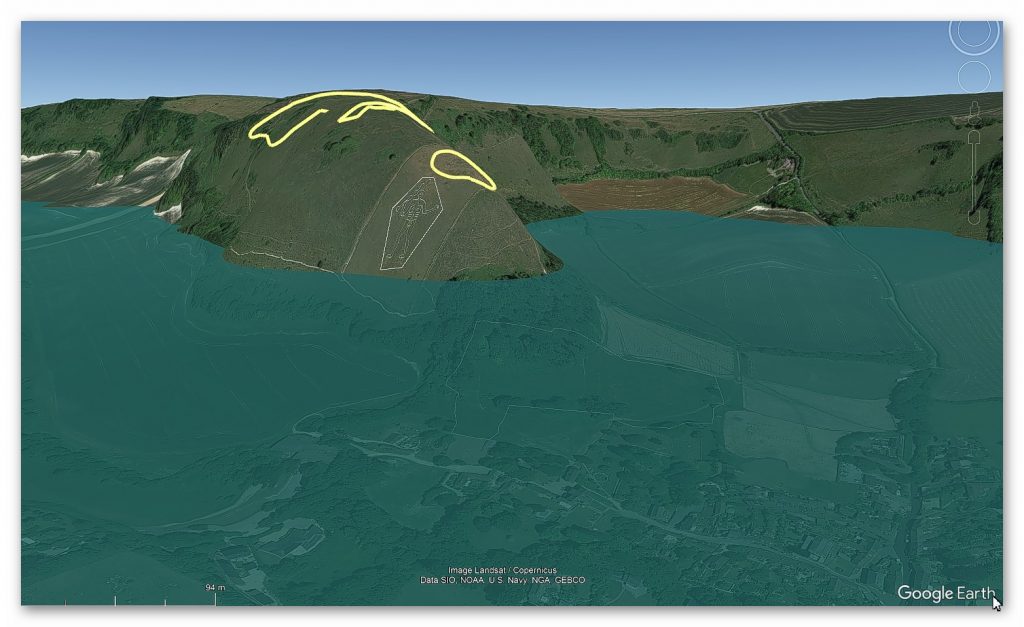
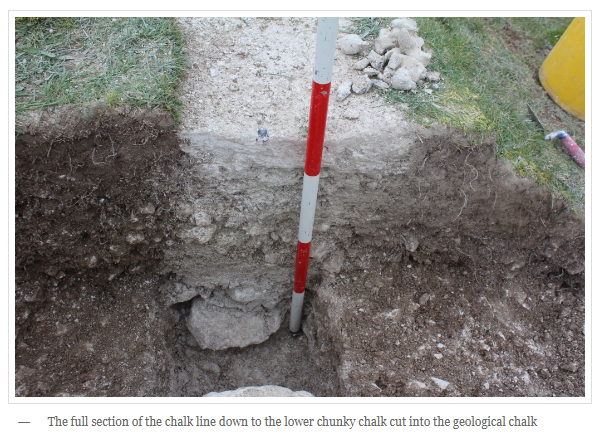
Digging for Britain Debunked - Cerne Abbas
Digging for Britain Debunked – Cerne Abbas

Further evidence points to Post-Glacial Flooding and a Neolithic origin of the figure, which strategically marks the entrance to the harbour. LiDAR maps suggest a man balancing a load on his shoulders or head, potentially representing a trading centre surrounded by quarries and mining pits.
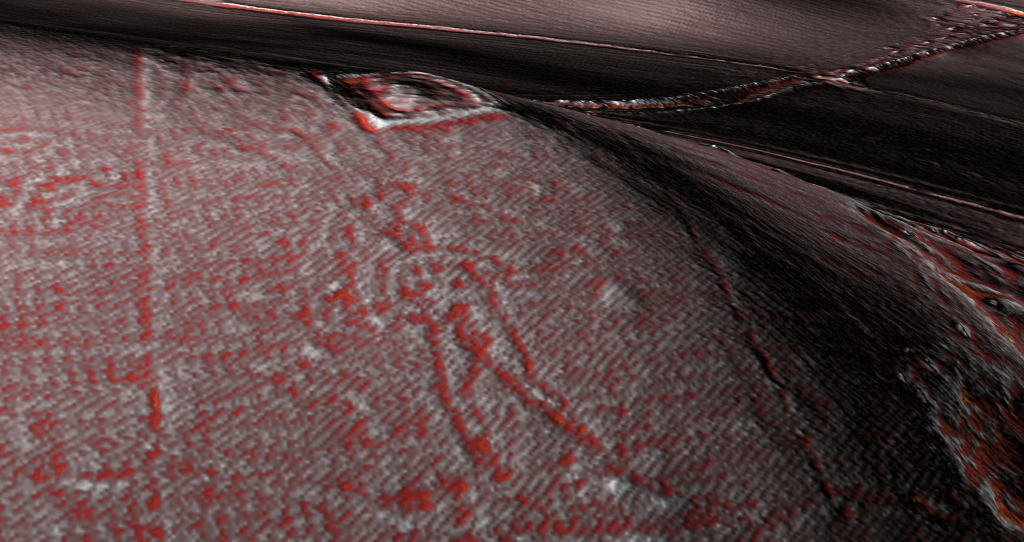

Digging for Britain Debunked - Cerne Abbas
Lidar showing the deep chalk cuttings – Digging for Britain Debunked – Cerne Abbas
Original Cerne Abbas figure according to AI – Digging for Britain Debunked – Cerne Abbas

The intricacies of Cerne Abbas, when viewed through the lens of geological processes and archaeological evidence, unfold a narrative of ancient landscapes shaped by water, a figure emerging from millennia of erosion, and a Neolithic trading hub leaving its mark on the chalky canvas of history.

Long Man of Wilmington

NB. The findings at The Long Man of Wilmington by Prof. Martin Bell show very similar findings and geology as Cerne Abbas –
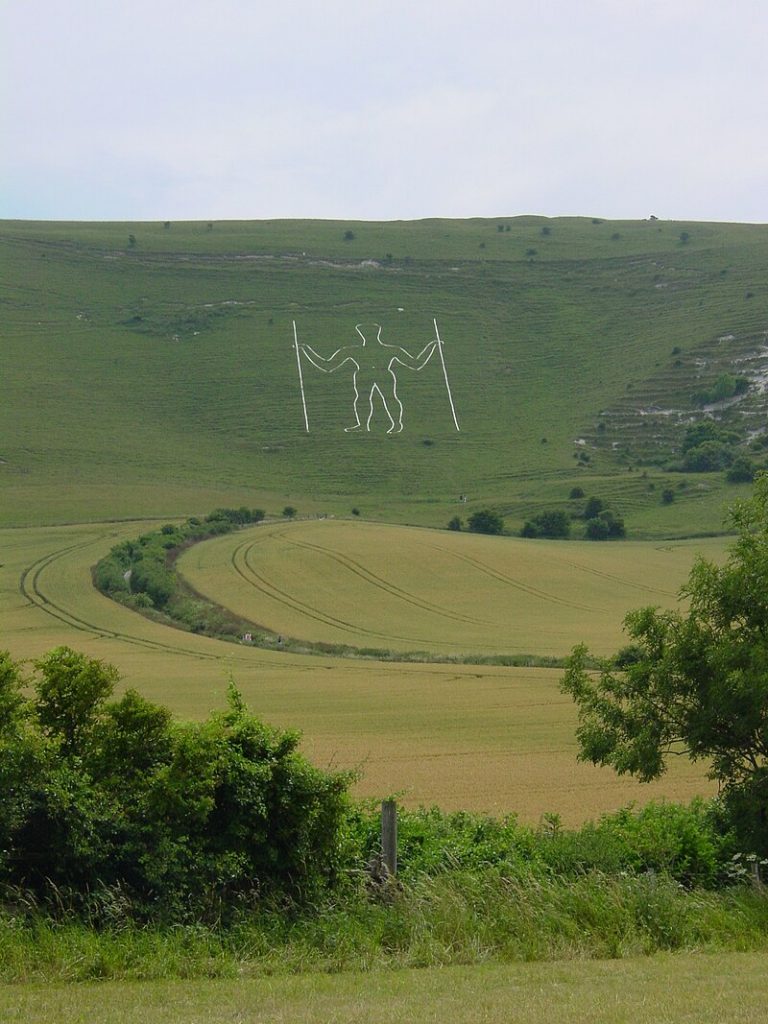
“Our method was to machine cut a trench at the base of the slope to look at the sediment sequence, then carefully hand excavate an adjoining strip, recording in three dimensions the positions of all artefacts, no matter how modern, in order to date each layer.

At the base of our trench, there were chalk meltwater muds from a time of rapid physical weathering at the end of the last Ice Age. Above these were bowl-shaped features, perhaps tree-throw pits, because they contained land snails from woodland habitats, indicating that this part of the slope had been wooded earlier in the Postglacial. They also contained some flint flakes, so they could be archaeological features.

Over this was a buried soil. Ed Rhodes, formerly of the Research Laboratory for Archaeology at Oxford, now of the Australian National University, has used OSL to date this soil to the mid-2nd millennium BC. The snails show that by this time, the landscape was open. Later in the Bronze Age, the soil was buried by more soil derived from cultivation at the base of the slope. Snails show that the escarpment above was grassland. Many sites on the South Downs show evidence for quite extensive Bronze Age soil erosion. Bronze Age and Neolithic pottery and flints from the basal soil and the colluvium indicate that a settlement was nearby.”

They called the broken chalk we saw in these excavations ‘chalk meltwater muds’, and he is correct, but this kind of deposit can only be produced by thousands of years of water erosion, not a couple of hundred, and his OSL dates confirm this, as just above this level is an OSL date of 2,000 BCE. We have 8,000 years of topsoil missing as the site, like Carne Abbass, was covered with river water, creating another natural harbour – and would you believe it – it also has a Neolithic.

PODCAST

Author’s Biography

Robert John Langdon, a polymathic luminary, emerges as a writer, historian, and eminent specialist in LiDAR Landscape Archaeology.

His intellectual voyage has been interwoven with stints as an astute scrutineer in government and grand corporate bastions, a tapestry spanning British Telecommunications, Cable and Wireless, British Gas, and the esteemed University of London.

A decade hence, Robert’s transition into retirement unfurled a chapter of insatiable curiosity. This phase saw him immerse himself in Politics, Archaeology, Philosophy, and the enigmatic realm of Quantum Mechanics. His academic odyssey traversed the venerable corridors of knowledge hubs such as the Museum of London, University College London, Birkbeck College, The City Literature Institute, and Chichester University.

In the symphony of his life, Robert is a custodian of three progeny and a pair of cherished grandchildren. His sanctuary lies ensconced in the embrace of West Wales, where he inhabits an isolated cottage, its windows framing a vista of the boundless sea – a retreat from the scrutinising gaze of Her Majesty’s Revenue and Customs, an amiable clandestinity in the lap of nature.

Exploring Prehistoric Britain: A Journey Through Time

My blog delves into the fascinating mysteries of prehistoric Britain, challenging conventional narratives and offering fresh perspectives grounded in cutting-edge research, particularly LiDAR technology. I invite you to explore some key areas of my research. For example, the Wansdyke, often cited as a defensive structure, is re-examined in light of new evidence. I’ve presented my findings in my blog post Wansdyke: A British Frontier Wall – ‘Debunked’, and a Wansdyke LiDAR Flyover video further visualises my conclusions.

My work also often challenges established archaeological dogma. I argue that many sites, such as Hambledon Hill, commonly identified as Iron Age hillforts, are not what they seem. My posts Lidar Investigation Hambledon Hill – NOT an ‘Iron Age Fort’ and Unmasking the “Iron Age Hillfort” Myth explore these ideas in detail and offer an alternative view. Similarly, sites like Cissbury Ring and White Sheet Camp receive re-evaluations based on LiDAR analysis in my posts “Lidar Investigation Cissbury Ring through time” and “Lidar Investigation White Sheet Camp,“ revealing fascinating insights into their true purpose. I have also examined South Cadbury Castle, often linked to the mythical Camelot56.

My research also extends to ancient water management, including the role of canals and other linear earthworks. I have discussed the true origins of Car Dyke in multiple posts, including Car Dyke – ABC News Podcast and Lidar Investigation Car Dyke – North Section, which suggest a Mesolithic origin 2357. I also explore the misidentification of Roman aqueducts, as seen in my posts on the Great Chesters (Roman) Aqueduct. My research has also been greatly informed by my post-glacial flooding hypothesis, which has helped explain landscape transformations over time. I have discussed this hypothesis in several posts, including AI now supports my Post-Glacial Flooding Hypothesis and Exploring Britain’s Flooded Past: A Personal Journey

Finally, my blog also investigates prehistoric burial practices, as seen in Prehistoric Burial Practices of Britain and explores the mystery of Pillow Mounds, often mistaken for medieval rabbit warrens, but with a potential link to Bronze Age cremation in my posts: Pillow Mounds: A Bronze Age Legacy of Cremation? and The Mystery of Pillow Mounds: Are They Really Medieval Rabbit Warrens?. My research also includes astronomical insights into ancient sites, for example, in Rediscovering the Winter Solstice: The Original Winter Festival. I also review new information about the construction of Stonehenge in The Stonehenge Enigma.

Further Reading

For those interested in British Prehistory, visit www.prehistoric-britain.co.uk, a comprehensive resource featuring an extensive collection of archaeology articles, modern LiDAR investigations, and groundbreaking research. The site also includes insights and excerpts from the acclaimed Robert John Langdon Trilogy, a series of books that explore Britain during the Prehistoric period. Titles in the trilogy include The Stonehenge Enigma, Dawn of the Lost Civilisation, and The Post-Glacial Flooding Hypothesis, which offer compelling evidence of ancient landscapes shaped by post-glacial flooding.

To further explore these topics, Robert John Langdon has developed a dedicated YouTube channel featuring over 100 video documentaries and investigations that complement the trilogy. Notable discoveries and studies showcased on the channel include 13 Things that Don’t Make Sense in History and the revelation of Silbury Avenue – The Lost Stone Avenue, a rediscovered prehistoric feature at Avebury, Wiltshire.

In addition to his main works, Langdon has released a series of shorter, accessible publications, ideal for readers delving into specific topics. These include:

For active discussions and updates on the trilogy’s findings and recent LiDAR investigations, join our vibrant community on Facebook. Engage with like-minded enthusiasts by leaving a message or contributing to debates in our Facebook Group.

Whether through the books, the website, or interactive videos, we aim to provide a deeper understanding of Britain’s fascinating prehistoric past. We encourage you to explore these resources and uncover the mysteries of ancient landscapes through the lens of modern archaeology.

For more information, including chapter extracts and related publications, visit the Robert John Langdon Author Page. Dive into works such as The Stonehenge Enigma or Dawn of the Lost Civilisation, and explore cutting-edge theories that challenge traditional historical narratives.

Other Blogs

s

t

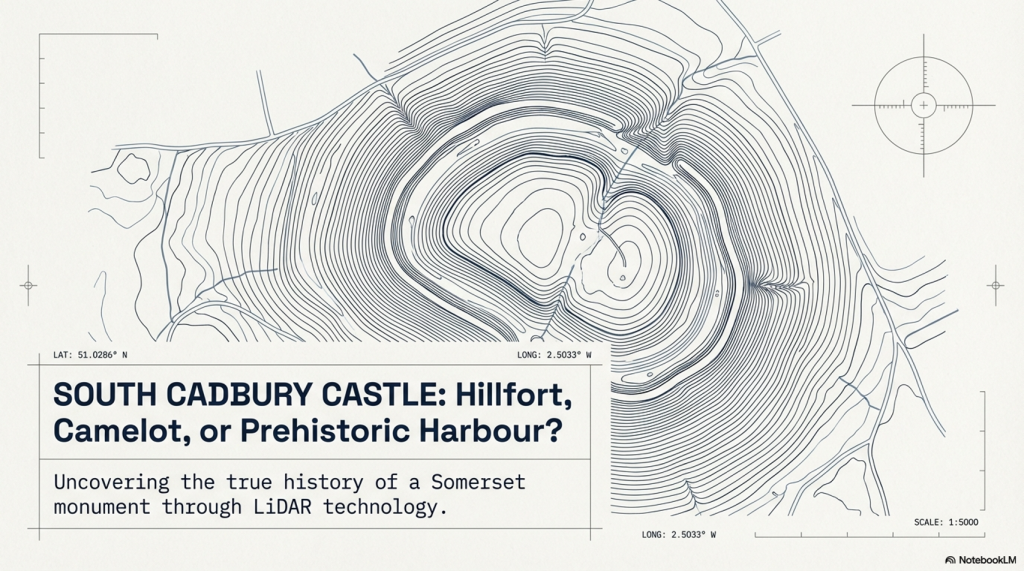
South Cadbury Castle – Camelot

Introduction

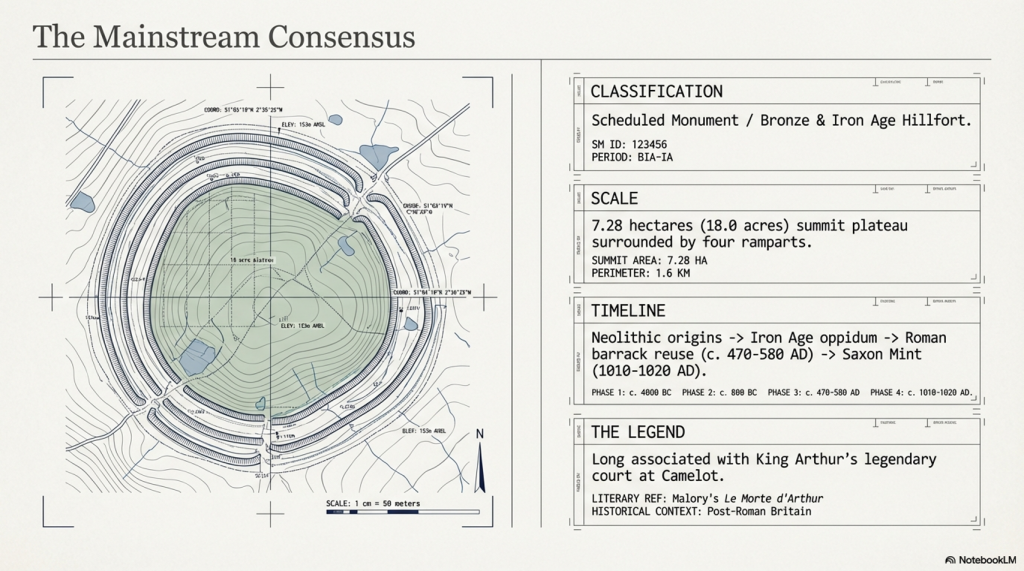
In the traditional archaeological interpretation, Cadbury Castle represents a long-lived settlement that developed gradually over several millennia. The earliest evidence of activity dates to the Neolithic period, where pits and postholes associated with pottery and flint finds suggest a small, unenclosed agricultural community. Radiocarbon dating places this early occupation around 3500–3300 BC, indicating that the hill was already being utilised long before the construction of its later defences.(South Cadbury Castle – Camelot)

The site continued to be occupied into the Bronze Age, where evidence of ovens and metalworking activity points to an increasingly organised settlement. By the Iron Age, Cadbury Castle had developed into a substantial fortified enclosure. Around 300 BC, a stone-built enclosure with timber reinforcements was constructed, later expanded into a complex hillfort with multiple ramparts and elaborate defensive systems. Excavations have revealed both roundhouses and rectangular structures, alongside evidence of industrial activity and possible ritual features, suggesting a permanent and socially complex community—often described as “oppidum-like” in character.

South Cadbury Castle - Camelot
South Cadbury Castle – Camelot

During the 1st century BC and into the early Roman period, the defences were further strengthened. Archaeological evidence indicates that the site may have been violently attacked during the Roman conquest of Britain, around AD 43, with signs of burning and destruction uncovered at key प्रवेश points. Following this, the Romans appear to have reused the hilltop, possibly establishing a military presence and later constructing a temple during the 3rd or 4th century AD.

After the end of Roman administration, Cadbury Castle was reoccupied in the post-Roman period, between approximately AD 470 and 580. Excavations led by Leslie Alcock revealed a large timber “Great Hall,” interpreted within the traditional framework as the residence of a high-status Brittonic ruler. The discovery of imported Mediterranean pottery from this phase suggests long-distance trade connections and reinforces the idea of the site as a regional power centre. It is this phase of occupation that has led to long-standing associations with the legendary Camelot of King Arthur.

South Cadbury Castle - Camelot
South Cadbury Castle – Camelot

The site saw later reuse in the early medieval period, including the establishment of a temporary Saxon mint in the 11th century. Across its long history, Cadbury Castle is therefore understood, in conventional terms, as a multi-period fortified settlement—evolving from a Neolithic farming site into a major Iron Age stronghold, later adapted by Roman and post-Roman communities, and ultimately woven into both historical and legendary narratives.

The Problem with the Traditional Interpretation

The conventional explanation of Cadbury Castle presents a familiar story: a hilltop settlement that gradually evolves from a Neolithic farm into a Bronze Age community, then into an Iron Age hillfort, later reused by Romans and post-Roman elites.

It sounds neat. It reads well. But when examined critically, it raises more problems than it solves.

South Cadbury Castle - Camelot
South Cadbury Castle – Camelot

The core issue is methodological.

The site is treated as a continuous “occupation sequence,” yet the evidence presented is not continuous—it is fragmentary, intermittent, and separated by significant spans of time. A pit here, a posthole there, a later rampart above it—all are grouped together and interpreted as a single evolving settlement. In reality, what is being described is not continuity, but repeated reuse of a prominent landscape feature over thousands of years.

This is a fundamental distinction.

Finding Neolithic pits does not prove a Neolithic settlement in the sense implied. It proves activity. The same applies to Bronze Age ovens, Iron Age ramparts, or post-Roman halls. Each represents a moment in time, not necessarily a continuous tradition of occupation.

Archaeology, however, routinely compresses these separate events into a single narrative—effectively averaging the past into a story that feels coherent but is not supported as a continuous process.

South Cadbury Castle - Camelot
South Cadbury Castle – Camelot

Elevation and Function — The Missing Variable

What is consistently overlooked in the traditional model is the most obvious physical characteristic of Cadbury Castle:

Its elevation.

At approximately 153 metres above sea level, the site sits well above the surrounding lowlands, particularly the Somerset Levels to the north. In the conventional interpretation, this is explained purely in terms of defence—height equals visibility, therefore height equals protection.

But this assumption is never tested.

It is simply inherited.

If we step back and apply a physical framework rather than a cultural one, a different question emerges:

Why are the earliest activities consistently located on elevated ground?

This is not unique to Cadbury. Across Britain, early prehistoric activity frequently appears at higher elevations, with later activity progressively occupying lower ground. This pattern is measurable, repeatable, and not dependent on interpretation.

South Cadbury Castle - Camelot
South Cadbury Castle – Camelot

The simplest explanation is not a defence.

It is an environment.

As demonstrated in the broader hydrological model of post-glacial Britain, early Holocene landscapes were characterised by significantly higher groundwater levels and expanded river systems. In such a system, low-lying areas—such as the Somerset Levels—would not have been stable, dry land in the way they are today. They would have been wetlands, floodplains, or standing water environments for extended periods.

Under these conditions, elevated sites like Cadbury Hill are not “defensive choices.”

They are the only viable ground.

South Cadbury Castle - Camelot
South Cadbury Castle – Camelot

Reframing the “Hillfort”

Once elevation is understood as an environmental constraint rather than a defensive preference, the entire interpretation of the site shifts.

The term “hillfort” becomes problematic.

It assumes:

  • conflict
  • territorial defence
  • permanent settlement

Yet none of these are directly proven by the physical evidence alone.

The ramparts, for example, are interpreted as defensive structures—but this is an assumption based on form, not function. Earthworks can serve multiple purposes: hydraulic control, stock management, boundary demarcation, or even phased landscape modification.

At Cadbury, the presence of multiple ramparts is often cited as evidence of increasing conflict. But an alternative explanation is equally plausible: staged construction responding to changing environmental conditions, particularly shifting water levels and drainage patterns.

South Cadbury Castle - Camelot
South Cadbury Castle – Camelot

The traditional model selects one interpretation—warfare—without excluding others.

The Illusion of Continuity

Perhaps the most significant issue is the illusion of continuity created by archaeological phasing.

Cadbury Castle is presented as:

Neolithic → Bronze Age → Iron Age → Roman → Post-Roman → Saxon

But this is not a continuous timeline of occupation.

It is a list of disconnected events.

South Cadbury Castle - Camelot

Between these phases lie gaps—sometimes centuries, sometimes longer—where no evidence of sustained activity exists. These gaps are rarely emphasised, because they disrupt the narrative of an “important settlement.”

Instead, the site is framed as persistently occupied, when the evidence more accurately supports periodic reuse of a prominent, strategically located landscape feature.

In other words, the hill is important.

Not necessarily the settlement.

South Cadbury Castle - Camelot
South Cadbury Castle – Camelot

A Simpler Model

If we remove the assumption and focus only on physical constraints, a more economical explanation emerges:

  • Early activity occurs on high ground because low ground is unstable or flooded
  • Sites are reused over time because elevated locations remain reliable as conditions change
  • Earthworks reflect adaptation to landscape conditions, not necessarily warfare
  • Later cultures reinterpret and reuse earlier features without preserving the original function
South Cadbury Castle - Camelot

This model requires fewer assumptions and aligns with measurable environmental behaviour.

It also explains why sites like Cadbury Castle appear repeatedly in the archaeological record across different periods without requiring continuous occupation.

South Cadbury Castle - Camelot
South Cadbury Castle – Camelot

Maps

1800s OS Map

South Cadbury Castle – 1800s OS Map

GE Satellite Map

South Cadbury GE Map

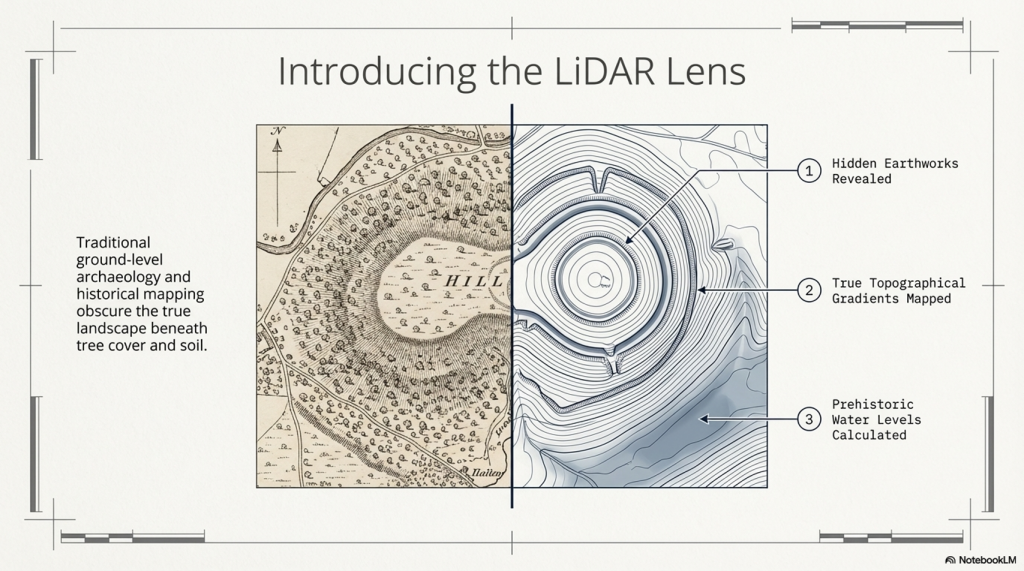
LiDAR Map

South Cadbury Castle – LiDAR Map

Investigation

Site Flyaround

South Cadbury Castle Flyaround

Site Flyover

South Cadbury Castle Fly Over

Lidar Map showing Bronze Age

South Cadbury Castle – with Bronze Age Water Levels

LiDAR Map showing Mesolithic Period

South Cadbury Castle with Mesloithic Water levels

Defence Strategy 101

Roman Defence System

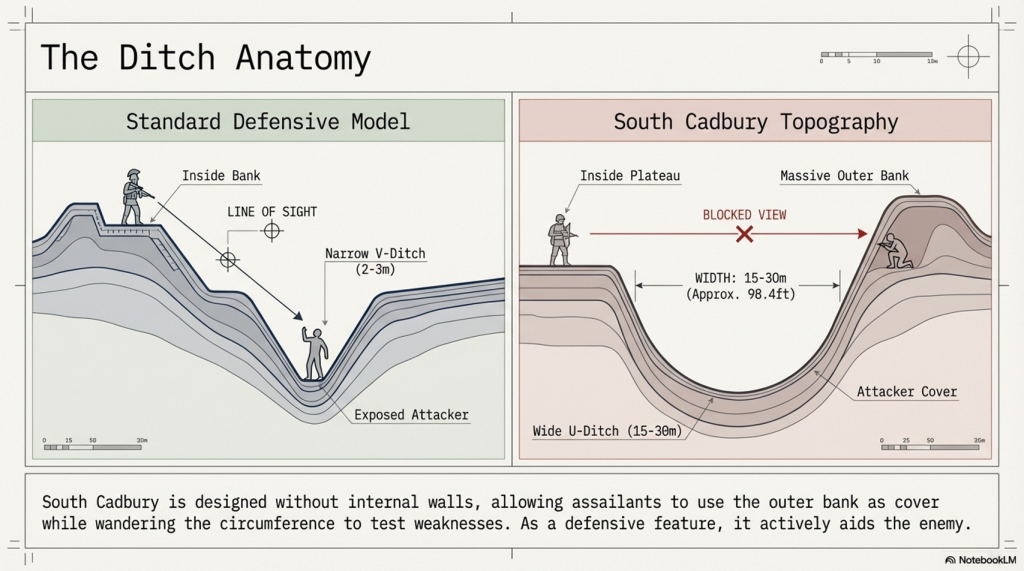
Roman defences (of the same period as the ‘Iron Age’ ), we notice the ditches were relatively small and narrow. These ditches were called ‘Ankle Breaker’ as the purpose was for the assailant to fall into the ditch (usually containing pointed wooden stakes to either injure or kill the assailant) or to at least break their ankle from the fall, making them immobile. These ditches would be 3 to 4 m wide and about 2m deep and could be dug quickly.

Roman Ankle Breaker

The soil excavated from the ditch would be placed on the defensive side to elevate the defenders, allowing them to look down and fight their attackers from a higher position. Simply standing on elevated ground without a barrier would make defenders easy targets. Therefore, they built fortifications using wooden stakes or stone for more permanent and substantial defences. These fortifications provided cover from spears, arrows, or stones while looking down into the conflict zone. This basic defensive strategy has remained unchanged for thousands of years, as seen with the Normans, who used castles and moats. The moats slowed down assailants, allowing defenders to use crossbows effectively against anyone attempting to cross the deep waters.

Classic Roman Fort With Ditch and Palisade

Lidar Maps of Sth Cadbury Castle Show No Defences

Banks

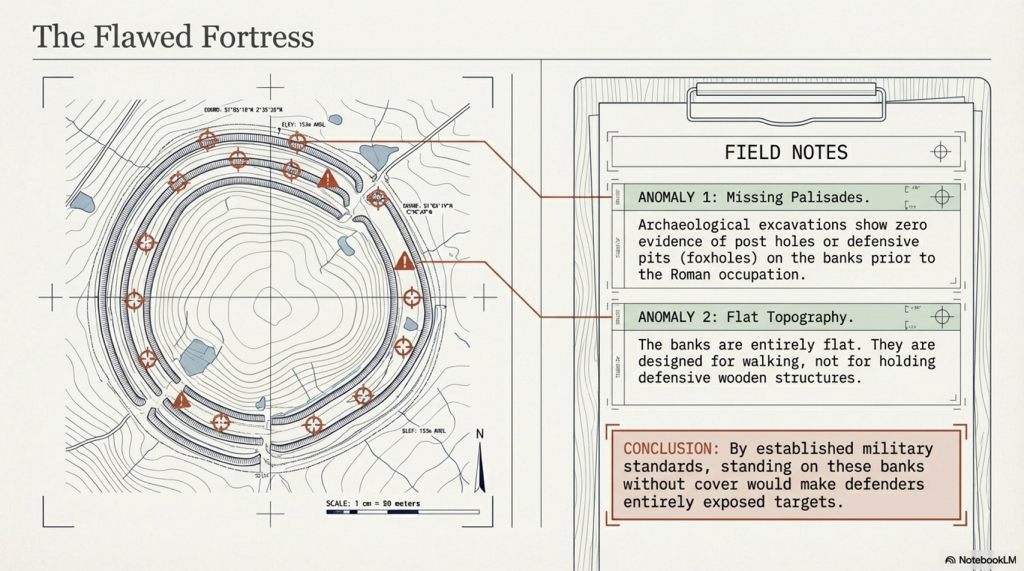
The banks at South Cadbury Castle show no signs of palisades on top of the bank at any stage before the Roman occupation, which brought stone to the very top of the site. The other four banks appear to be quite flat, as if they have been used for walking upon rather than holding any defensive wooden structures or ‘foxholes.’

Importance and Use of Foxholes in Defense

Concealment and Protection: Foxholes are small, dug-out trenches or pits used by soldiers to provide cover and concealment. They protect defenders from enemy fire and other dangers. By being below ground level, soldiers can remain hidden and minimize their exposure to enemy attacks.

Historical Use: Throughout history, foxholes have been a crucial part of defensive strategies in various military contexts: While the term “foxhole” is modern, the concept of digging protective pits or trenches has been used in various forms throughout history. In ancient battles, soldiers would dig pits to defend against archers and other ranged weapons.

Advantages of Foxholes

  • Reduced Visibility: Soldiers in foxholes are less visible to the enemy, making it harder for attackers to target them.
  • Protection from Spears, Rocks and Arrows: Being below ground level the size of the target is greatly reduced.
  • Stability for Firing: Foxholes provide a stable firing position, allowing soldiers to fire and use their weapons more accurately.

South Cadbury Castle Context

The absence of evidence for palisades or foxholes at South Cadbury Castle before the Roman occupation suggests a different use or purpose for the banks. Instead of being purely defensive, the flat banks must have served other functions.

Ditches

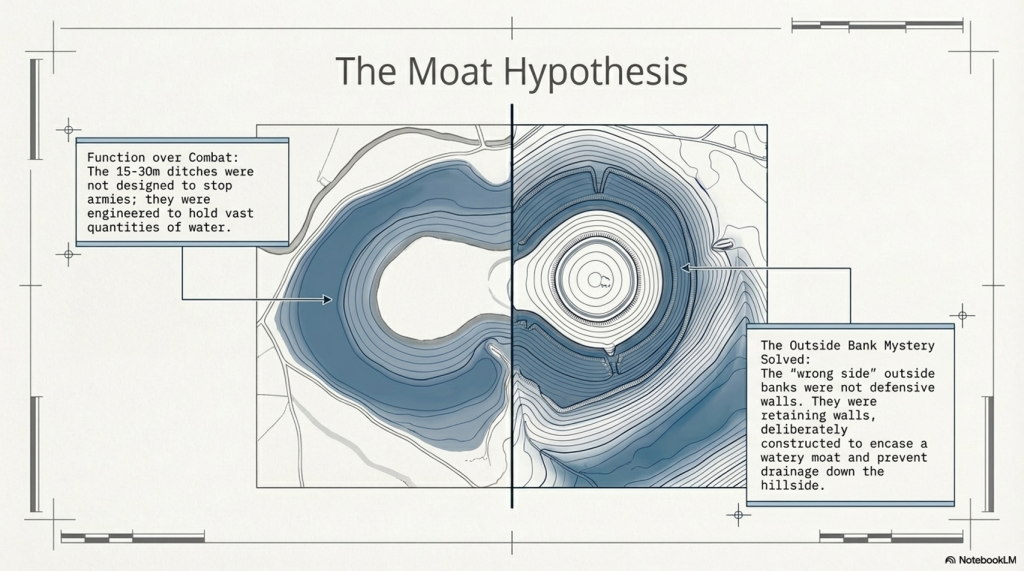
Looking at the construction of the ditches at South Cadbury Castle, we notice that it has no defensive features as expected from a so-called ‘Iron Age Fort’. The ditches are far too broad to be defensive (15m to 30m wide) compared to Roman ‘Ankle Breaker’ of 2m to 3m. The maps show no sign of a wooden or stone barrier, and archaeological excavations have found no evidence of post holes or defensive pits on the banks. Moreover, the Ditch is banked on the wrong side to be defensive, as if it has been built to encase a watery moat. This outside bank would protect any assailants attacking, giving them ample bank coverage. The internal aspect of the Ditch shows no sign of any wooden defensive poles or post holes as seen in Roman Ditches and is designed without internal walls allowing assailants from using the Ditch as cover and the facility to wander around the circumference undercover, testing the weaknesses in the defence. Therefore, as a defensive feature, these types of ditches on so-called ‘Iron Age Forts’ are fundamentally flawed and commonplace.

Ditch is banked on the wrong side

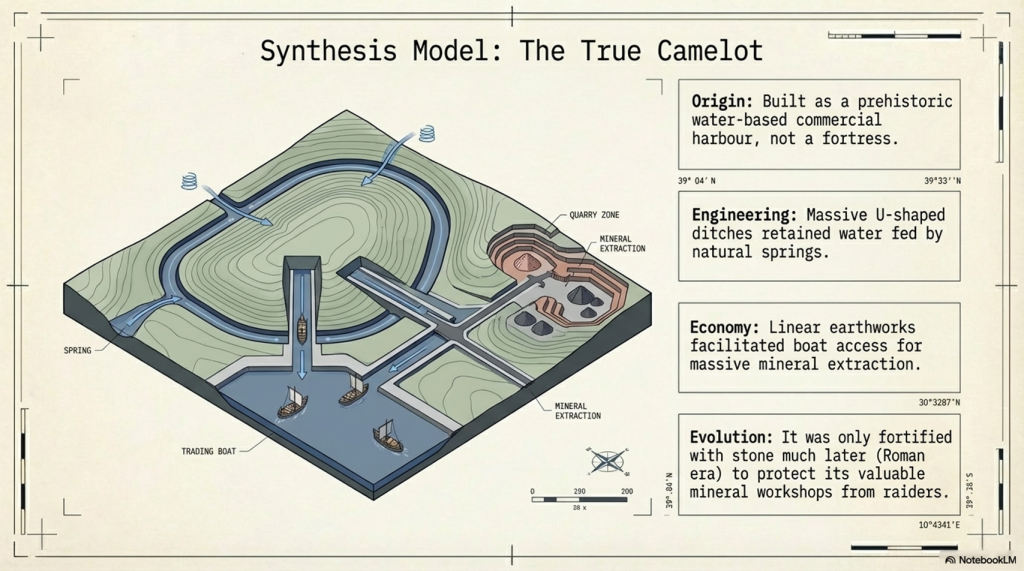
The LiDAR Maps also show that the ditch of the ditches indicate that they were built for water, as shown by the blue on these images – this then allows us to look at the design of the earthwork in detail, which shows that the banks have been cut by not roads but other ditches. These ditches that cut across the circumference moats cut into them that, suggest that if water had been contained in these ditches, then the vertical dykes could have been used to gaol boats up from the bottom of the dyke ditch to one of these upper moat levels. These same LiDAR maps also show how the soil was distributed to the outside of the moats to enhance and make the feature deeper.

South Cadbury Castle – Banks on the outside to keep in the Water

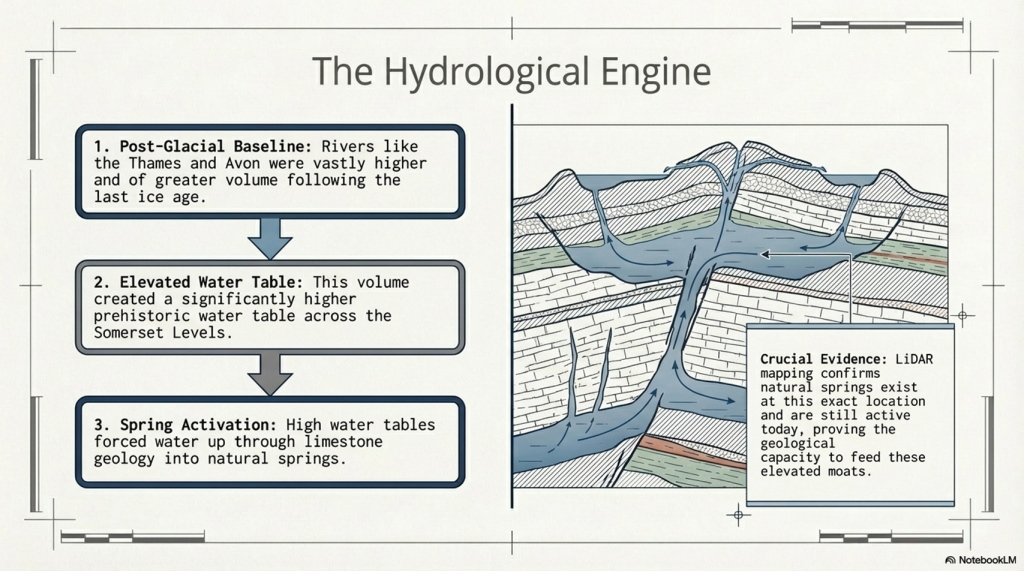
Water Table

This hypothesis of using these ditches as moats can only be proven if we find the natural springs that could have fed these earthworks in the past. We know from our studies into rivers, such as The Thames and Avon, that they were both much higher and of greater volume in the past, and this height was retained for thousands of years after the last ice age. This enhanced height and volume is reflected and caused by a higher water table. Within these water tables, natural springs are formed, and water leaks into the land, creating rivers and streams. Although we do not have geological information that allows us to trace past springs, we find existing springs in this location (still active today), which suggests our hypothesis is correct.

South Cadbury Castle showing Springs still in existence

Dykes

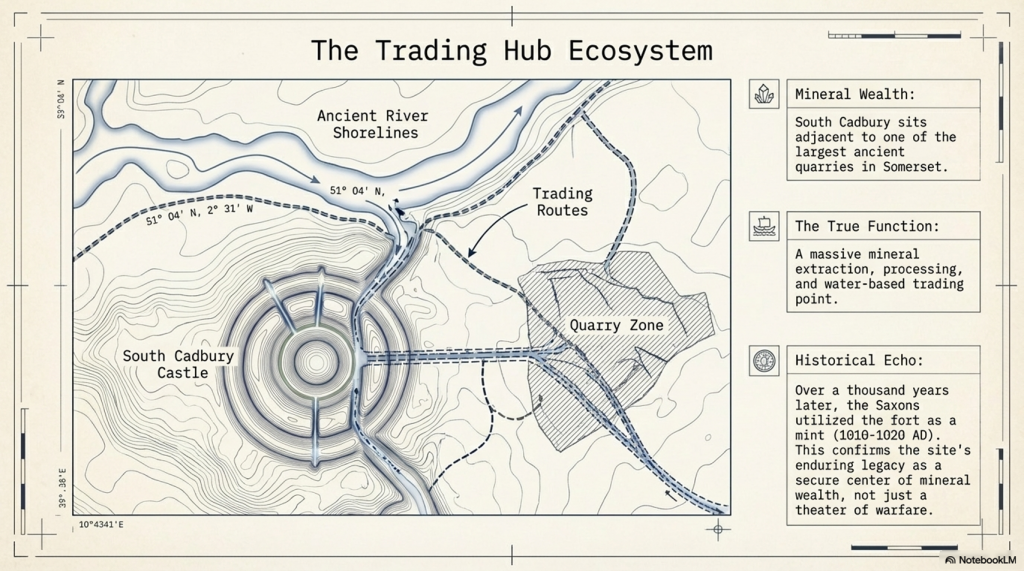
As we have already suggested, the lack of defensive features shows that this is far from being a fortification; instead, it was used as a trading site with moats to facilitate the mooring of boats. The transportation to these moats was achieved by other earthworks called Linear Earthworks (also known as Dykes). Dykes were introduced when the river shorelines of the Prehistoric fell with the water table, and they wanted to continue to use these established trading sites rather than having to build new sites at a lower level. So, Dykes were built (like roads) to transport goods to market and also minerals extracted from the many quarries which uncommonly surround these Dykes. Here in South Cadbury Castle, we see not only Dykes feeding the local quarry sites but also placed on the side of this Trading site to allow access to the moats for the boats coming off the rivers, ready for unloading/loading.

Slipway built to feed the moats in the upper levels with trading boats
Two Possible Slipways – one connecting directly to a Dyke

To reinforce the use of this site as a trading The site as a trading place has a second vertical earthwork identified through LiDAR technology. This secondary slipway is distinguishable from the initial structure by its lack of connection to a dyke or river. The slipway appears to traverse from the lowest moat up to the top of the site. While photographs may provide a visual reference, the full extent and significance of this feature are best understood through LiDAR models, which enhance the landscape to reveal these historical elements with greater clarity.place, a second verticle earthwork has been identified via LiDAR technology is a secondary slipway, distinguishable from the initial structure by its lack of connection to a dyke or river. This slipway appears to traverse from the lowest moat up to the top of the site. While photographs may provide a visual reference, the full extent and significance of this feature are best understood through LiDAR models, which enhance the landscape to reveal these historical elements with greater clarity.

The Dykes seen on the LiDAR map are concentrated on the quarry in the East of the Site

Dating the Site

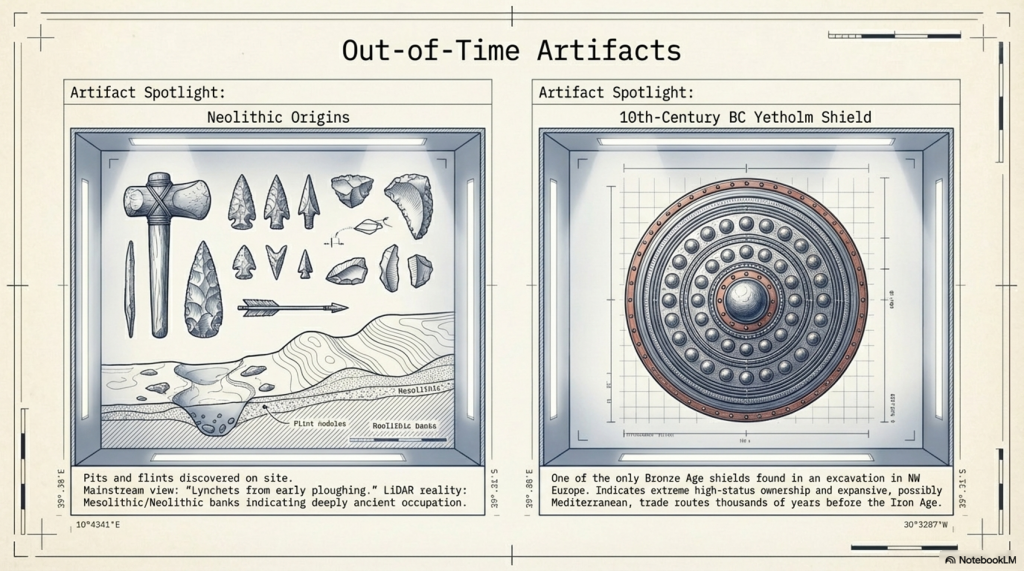
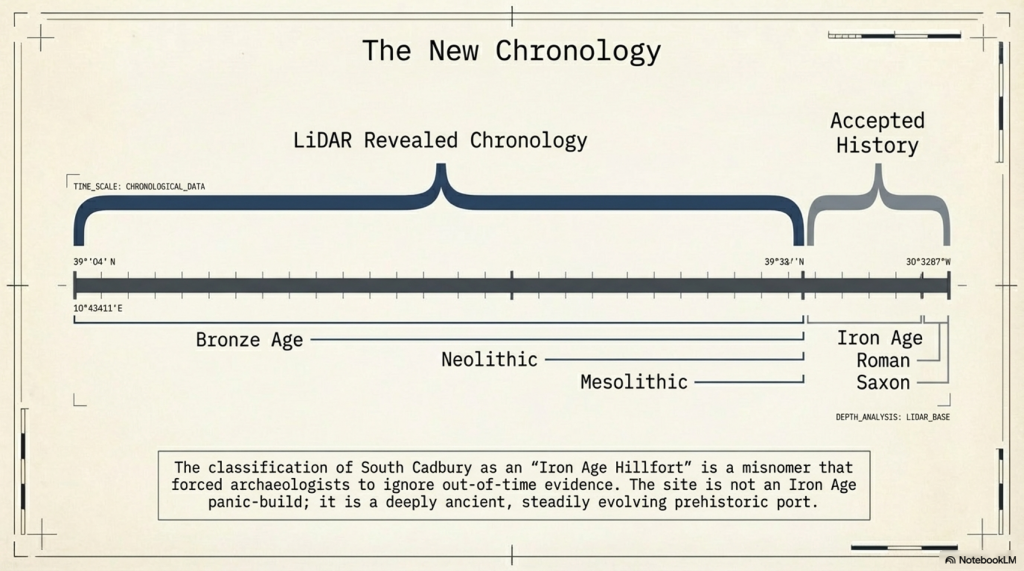
Archaeologists are puzzled by the unexpected dates of this site at South Cadbury Castle, the site that was originally thought to be Iron Age from its classification. Therefore, the discovery of Neolithic pits at the site challenges their previously held beliefs about its functions. However, instead of reconsidering their perceptions, they instead provided speculative explanations for these out-of-time artifacts and features. For example, they have described a bank beneath the Iron Age defenses as a “lynchet or terrace derived from early ploughing,” even though there is no carbon dating evidence to support this claim. In reality, this site is likely to be Neolithic, and the ‘lynchets’ could be Mesolithic banks, indicating its true age.

The discovery of the Bronze Age shield is also an indication of the status of the site and its trading routes – as only one has been found, this would indicate that it was part of the trading or personal ownership of someone in the 10th Century BC at this site. This suggests that this was trading could have been at a much earlier date than current archaeologists suggest, which could too have been with the Mediterranean and a possible source of this unusual artefact, as indicated by the other finds from the late saxon period.

Function of the site

The fact that in the East of this site is one of the largest quarries in Somerset and that the Saxons used the fort as a mint just over a thousand years ago proves that the site’s function was a mineral extraction and trading point. This extraction goes back to the Mesolithic period shown on LiDAR maps with a natural harbour by the Quarries and then Dykes to the Trading site as the prehistoric waters fell. No doubt (as the banks are found not to be defensive), the fort was fortified later during the Roman period with Stone as it was to keep the valuable minerals safe but not as a defensive barrier of warfare as suggested. This would explain the minor disturbances and deaths at a single gate as raiders would have attempted to steal the valuable minerals it contained in its workshops, as described by archaeologists.

PodCast

Author’s Biography

Robert John Langdon, a polymathic luminary, emerges as a writer, historian, and eminent specialist in LiDAR Landscape Archaeology.

His intellectual voyage has been interwoven with stints as an astute scrutineer in government and grand corporate bastions, a tapestry spanning British Telecommunications, Cable and Wireless, British Gas, and the esteemed University of London.

A decade hence, Robert’s transition into retirement unfurled a chapter of insatiable curiosity. This phase saw him immerse himself in Politics, Archaeology, Philosophy, and the enigmatic realm of Quantum Mechanics. His academic odyssey traversed the venerable corridors of knowledge hubs such as the Museum of London, University College London, Birkbeck College, The City Literature Institute, and Chichester University.

In the symphony of his life, Robert is a custodian of three progeny and a pair of cherished grandchildren. His sanctuary lies ensconced in the embrace of West Wales, where he inhabits an isolated cottage, its windows framing a vista of the boundless sea – a retreat from the scrutinising gaze of Her Majesty’s Revenue and Customs, an amiable clandestinity in the lap of nature.

Exploring Prehistoric Britain: A Journey Through Time

My blog delves into the fascinating mysteries of prehistoric Britain, challenging conventional narratives and offering fresh perspectives grounded in cutting-edge research, particularly LiDAR technology. I invite you to explore some key areas of my research. For example, the Wansdyke, often cited as a defensive structure, is re-examined in light of new evidence. I’ve presented my findings in my blog post Wansdyke: A British Frontier Wall – ‘Debunked’, and a Wansdyke LiDAR Flyover video further visualises my conclusions.

My work also often challenges established archaeological dogma. I argue that many sites, such as Hambledon Hill, commonly identified as Iron Age hillforts, are not what they seem. My posts Lidar Investigation Hambledon Hill – NOT an ‘Iron Age Fort’ and Unmasking the “Iron Age Hillfort” Myth explore these ideas in detail and offer an alternative view. Similarly, sites like Cissbury Ring and White Sheet Camp receive re-evaluations based on LiDAR analysis in my posts “Lidar Investigation Cissbury Ring through time” and “Lidar Investigation White Sheet Camp,“ revealing fascinating insights into their true purpose. I have also examined South Cadbury Castle, often linked to the mythical Camelot56.

My research also extends to ancient water management, including the role of canals and other linear earthworks. I have discussed the true origins of Car Dyke in multiple posts, including Car Dyke – ABC News Podcast and Lidar Investigation Car Dyke – North Section, which suggest a Mesolithic origin 2357. I also explore the misidentification of Roman aqueducts, as seen in my posts on the Great Chesters (Roman) Aqueduct. My research has also been greatly informed by my post-glacial flooding hypothesis, which has helped explain landscape transformations over time. I have discussed this hypothesis in several posts, including AI now supports my Post-Glacial Flooding Hypothesis and Exploring Britain’s Flooded Past: A Personal Journey

Finally, my blog also investigates prehistoric burial practices, as seen in Prehistoric Burial Practices of Britain and explores the mystery of Pillow Mounds, often mistaken for medieval rabbit warrens, but with a potential link to Bronze Age cremation in my posts: Pillow Mounds: A Bronze Age Legacy of Cremation? and The Mystery of Pillow Mounds: Are They Really Medieval Rabbit Warrens?. My research also includes astronomical insights into ancient sites, for example, in Rediscovering the Winter Solstice: The Original Winter Festival. I also review new information about the construction of Stonehenge in The Stonehenge Enigma.

Further Reading

For those interested in British Prehistory, visit www.prehistoric-britain.co.uk, a comprehensive resource featuring an extensive collection of archaeology articles, modern LiDAR investigations, and groundbreaking research. The site also includes insights and excerpts from the acclaimed Robert John Langdon Trilogy, a series of books that explore Britain during the Prehistoric period. Titles in the trilogy include The Stonehenge Enigma, Dawn of the Lost Civilisation, and The Post-Glacial Flooding Hypothesis, which offer compelling evidence of ancient landscapes shaped by post-glacial flooding.

To further explore these topics, Robert John Langdon has developed a dedicated YouTube channel featuring over 100 video documentaries and investigations that complement the trilogy. Notable discoveries and studies showcased on the channel include 13 Things that Don’t Make Sense in History and the revelation of Silbury Avenue – The Lost Stone Avenue, a rediscovered prehistoric feature at Avebury, Wiltshire.

In addition to his main works, Langdon has released a series of shorter, accessible publications, ideal for readers delving into specific topics. These include:

For active discussions and updates on the trilogy’s findings and recent LiDAR investigations, join our vibrant community on Facebook. Engage with like-minded enthusiasts by leaving a message or contributing to debates in our Facebook Group.

Whether through the books, the website, or interactive videos, we aim to provide a deeper understanding of Britain’s fascinating prehistoric past. We encourage you to explore these resources and uncover the mysteries of ancient landscapes through the lens of modern archaeology.

For more information, including chapter extracts and related publications, visit the Robert John Langdon Author Page. Dive into works such as The Stonehenge Enigma or Dawn of the Lost Civilisation, and explore cutting-edge theories that challenge traditional historical narratives.

Other Blogs

s

t

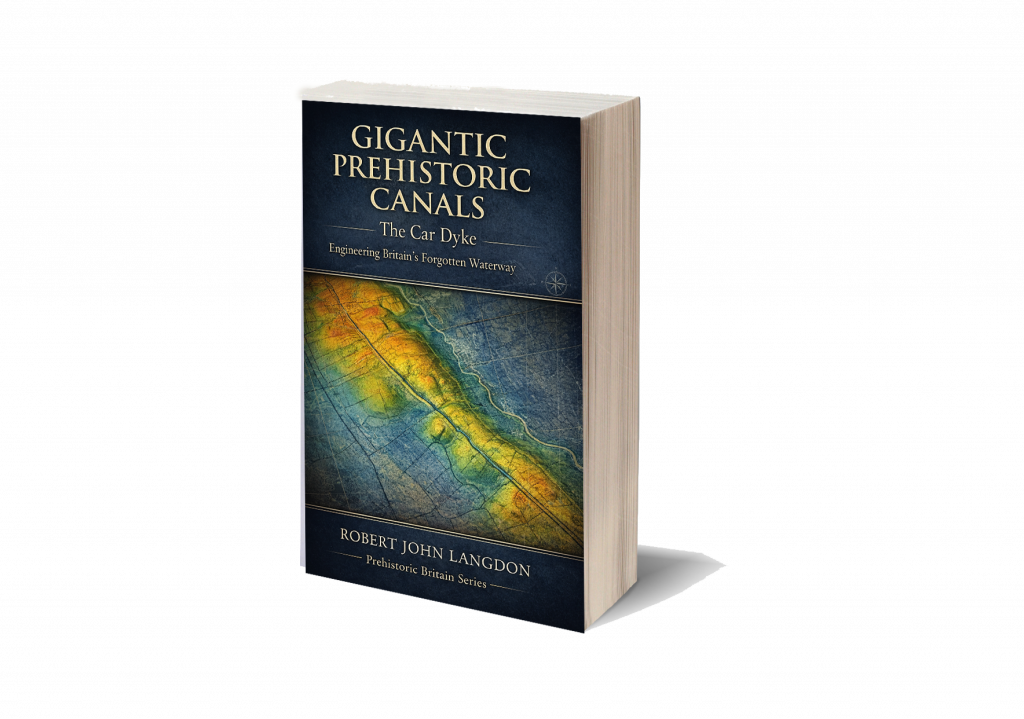
Car Dyke Atlas – Prehistoric Canals – FREE Flipbook

Introduction

Step into a new era of historical exploration where cutting-edge technology meets centuries-old mysteries. Our latest publication not only redefines the story of one of Britain’s most enigmatic earthworks but also transforms the way you experience a book. Welcome to the launch of the groundbreaking Car Dyke Atlas and the innovative FusionBook 360 concept—a fusion of traditional scholarship and next-generation multimedia interactivity.


Unmasking the True Origins of Car Dyke

For centuries, Car Dyke was regarded as a relic of Roman engineering—a mere canal or drainage system that facilitated military logistics and agricultural management. However, our first-ever comprehensive LiDAR investigation has completely rewritten that narrative. By employing state-of-the-art laser scanning, we have penetrated the dense vegetation and hidden soil layers to reveal a much more complex story. The data, bolstered by advanced mathematical dating methods and AI-assisted analysis, demonstrate that Car Dyke is not Roman but prehistoric in origin, with roots dating to the Mesolithic and Neolithic periods.

Inside the Investigation

  • LiDAR Mapping: Our high-resolution scans provide unprecedented detail, capturing the full 103-mile span of Car Dyke. The imagery reveals intricate construction details and natural variations that traditional methods have overlooked.
  • Mathematical Dating: Utilising a novel approach that integrates archaeological finds with advanced algorithms, our team has applied mathematical theorems to establish a definitive timeline. This breakthrough challenges centuries of conventional wisdom and suggests a multi-phased construction history long before the Roman era.
  • Archaeological Integration: The Atlas includes comprehensive data from archaeological excavations—pottery shards, tools, and other artefacts—that further support the prehistoric origin of the Dyke.

LiDAR mapping reveals Car Dyke’s hidden prehistoric layers, challenging the Roman narrative.”
LiDAR mapping reveals Car Dyke’s hidden prehistoric layers, challenging the Roman narrative

The Car Dyke Atlas: A Deep Dive into History

Car Dyke Atlas is not merely a book—it is a complete digital and print repository of our groundbreaking research. With over 140 meticulously crafted illustrations, 58 audio files, 22 360° interactive maps, and 120 flyover video clips, the Atlas offers a multidimensional view of this ancient earthwork.

Key Sections of the Atlas

  • Preamble & Introduction: Sets the stage by summarising decades of archaeological debate and introducing our revolutionary LiDAR findings.
  • Methodology: Explains the innovative techniques, including advanced AI and mathematical models, that enabled us to accurately map and date Car Dyke.
  • Detailed Mapping & Analysis: Interactive maps and flyover videos allow readers to explore Car Dyke in minute detail—from its northern, central, and southern sections to the subtle variations in its elevation and course.
  • Comparative Archaeology: Chapters that juxtapose traditional interpretations with our new findings, offering a compelling case for re-evaluating Britain’s ancient landscape.
  • Multimedia Content: Beyond static images, the Atlas integrates audio narrations, expert discussions, and interactive elements that provide context and bring the research to life.
The Car Dyke Atlas offers a panoramic view of history—where detailed maps meet immersive multimedia.”
The Car Dyke Atlas offers a panoramic view of history—where detailed maps meet immersive multimedia.

FusionBook 360: A New Paradigm in Storytelling

In today’s fast-paced digital age, traditional books are evolving. FusionBook 360 represents the future of reading—a concept that reimagines the boundaries between print and digital media. This revolutionary format brings historical scholarship into the 21st century by seamlessly integrating interactive and multimedia elements into the reading experience.

What Makes FusionBook 360 Unique?

  • Dual Format Availability: Choose between a digital edition loaded with interactive features and a beautifully designed printed edition enhanced with QR codes that unlock a wealth of supplementary content.
  • Realistic Page-Turning Effects: Experience the nostalgic feel of flipping pages, complete with authentic sound effects, yet enjoy the benefits of digital enhancements.
  • Embedded Interactive Content: Access video introductions, expert panels, detailed audio narrations, and 360° maps—all within the book’s pages. Each chapter invites readers to engage more deeply with the content.
  • Cloud-Based Updates: Stay current with ongoing research. As new discoveries emerge, the book updates automatically, ensuring that your copy remains at the cutting edge of historical scholarship.
  • Smart Chatbot Integration: Have a question while reading? Our integrated chatbot provides instant answers and additional context, making your exploration seamless and interactive.
FusionBook 360 transforms your reading experience, merging the tactile pleasure of print with the limitless possibilities of digital interactivity.”

Bridging the Past and Future: The Impact of Our Research

The implications of our findings extend far beyond Car Dyke itself. By challenging the long-held view of Car Dyke as a Roman construct, we open up new avenues of research into prehistoric engineering and land management. Our work sets a new standard for historical inquiry, combining rigorous scientific analysis with the creative potential of modern multimedia technology.

Why This Matters

  • Rewriting History: Our research forces historians, archaeologists, and the public to reconsider the origins of Car Dyke and, by extension, the broader narrative of Britain’s ancient past.
  • Innovative Methodologies: The integration of LiDAR technology, AI, and mathematical analysis provides a blueprint for future studies in archaeology.
  • Enhanced Engagement: FusionBook 360 invites a wider audience—from academic experts to curious enthusiasts—to engage with history in a more dynamic, interactive way.
The Car Dyke Atlas
Where ancient mysteries meet modern innovation—redefining our understanding of the past.


Join Us on This Journey

Be part of a transformative moment in historical research and digital publishing. Whether you are a scholar, a technology enthusiast, or simply passionate about uncovering the secrets of our past, the Car Dyke Atlas and FusionBook 360 offer an unparalleled journey into history.


By merging rigorous scientific inquiry with immersive multimedia technology, we’re not just telling history—we’re experiencing it. Step into a world where every page turns into a window to the past, and where the future of historical research is unfolding right before your eyes.

For more exclusive content, behind-the-scenes insights, and regular updates, visit our website and follow us on social media.


Car Dyke – ABC News Podcast

Summary

The book ‘The Car Dyke LiDAR Atlas’ presents a thorough investigation of the Car Dyke, a large ancient waterway in Britain. Using LiDAR technology, the author argues that the Dyke is much older than previously thought, dating back to the Mesolithic/Neolithic periods, and was likely used for transportation and water management rather than simply as a Roman drainage channel or defensive barrier. The book features detailed maps and analysis of the Dyke’s construction and course, including insights into the surrounding landscape and archaeological finds, to support the author’s conclusions.


Car Dyke Audio Book

Britain’s first-ever LiDAR investigation and mapping project of Car Dyke.

Downloadable audio file: https://drive.google.com/file/d/1z17XHVqzTVc8mrtk7Wkx7d-5uI_8tQuD/view

Unveiling the Truth: The Real History of Britain’s Dykes

For over a century, conventional archaeology has promoted the idea that Britain’s great Dykes—such as Offa’s Dyke and Wansdyke—were built by the Saxons as defensive barriers. These theories, based on limited fieldwalking evidence and subjective interpretation, have gone largely unchallenged. But what if this widely accepted narrative is completely wrong?

Car Dyke: The Key to a Forgotten Past

Car Dyke has long stood apart, defying the traditional explanations of Saxon territorial defence. When a boat laden with goods was discovered at the bottom of Car Dyke—dating back hundreds of years before the Saxons arrived in Britain—it should have rewritten history. Yet, mainstream archaeology dismissed this evidence, continuing to support outdated theories.

Revolutionary New Findings with LiDAR Technology

Using cutting-edge LiDAR mapping, our research has uncovered undeniable proof that Car Dyke and similar Dykes are not Saxon or even Roman constructions. Instead, they are intricately linked to ancient paleochannels, suggesting an advanced transportation and water management system that predates recorded history. Our new maps have corrected the estimated length of Car Dyke from 85 miles to 103 miles, aligning with the theories proposed by William Stukeley nearly 300 years ago. His claim that the Dyke supported the Roman occupation of Lincolnshire by facilitating troop and resource movements has now been scientifically validated.

Redefining Britain’s Longest Dyke

This research now positions Car Dyke as Britain’s longest Dyke, surpassing Offa’s Dyke, previously believed to be 177 miles long. Our survey reveals that Offa’s Dyke is, in fact, a series of smaller Dykes, totalling just 59.2 miles. Like Car Dyke, these ancient waterways were repurposed by the Romans for transportation and resource extraction, fundamentally shifting our understanding of Britain’s infrastructure.

A Groundbreaking Discovery: The Mesolithic and Neolithic Origins of the Dykes

Our mathematical analysis reveals that Car Dyke, Offa’s Dyke, and Wansdyke predate both the Romans and Saxons, tracing their origins back to the Mesolithic and Neolithic periods. This breakthrough challenges the established archaeological timeline and presents a compelling case for an advanced prehistoric civilisation. Could these ancient canals have been used to transport the massive stones of Britain’s megalithic structures? Our findings suggest they very well could have.

Rewriting the History of Britain’s Past. This book uncovers the real purpose and origins of Britain’s enigmatic Dykes, using cutting-edge technology and rigorous analysis to challenge centuries of academic assumptions. If you’re ready to explore the truth behind Britain’s forgotten past, this book will change everything you thought you knew about history.

NB. The tile references relate to their site’s FREE DEFRA LiDAR surveys, which are available on their site: .https://environment.data.gov.uk/survey


Car Dyke LiDAR Flyover


Softback B/W Edition for Amazon – with QR codes to the interactive website links

The Car Dyke Atlas
The Car Dyke Atlas

Softback Colour Edition for Amazon – with QR codes to the interactive website links

The Car Dyke Atlas
The Car Dyke Atlas

Further Reading

For those interested in British Prehistory, visit www.prehistoric-britain.co.uk, a comprehensive resource featuring an extensive collection of archaeology articles, modern LiDAR investigations, and groundbreaking research. The site also includes insights and extracts from the acclaimed Robert John Langdon Trilogy, a series of books exploring Britain during the Prehistoric period. Titles in the trilogy include The Stonehenge Enigma, Dawn of the Lost Civilisation, and The Post Glacial Flooding Hypothesis, offering compelling evidence about ancient landscapes shaped by post-glacial flooding.

To further explore these topics, Robert John Langdon has developed a dedicated YouTube channel featuring over 100 video documentaries and investigations that complement the trilogy. Notable discoveries and studies showcased on the channel include 13 Things that Don’t Make Sense in History and the revelation of Silbury Avenue – The Lost Stone Avenue, a rediscovered prehistoric feature at Avebury, Wiltshire. (The Great Farming Hoax – Einkorn Wheat)

In addition to his main works, Langdon has released a series of shorter, accessible publications, ideal for readers delving into specific topics. These include:

For active discussions and updates on the trilogy’s findings and recent LiDAR investigations, join our vibrant community on Facebook. Engage with like-minded enthusiasts by leaving a message or contributing to debates in our Facebook Group.

Whether through the books, the website, or interactive videos, we aim to provide a deeper understanding of Britain’s fascinating prehistoric past. We encourage you to explore these resources and uncover the mysteries of ancient landscapes through the lens of modern archaeology.

For more information, including chapter extracts and related publications, visit the Robert John Langdon Author Page. Dive into works such as The Stonehenge Enigma or Dawn of the Lost Civilisation, and explore cutting-edge theories that challenge traditional historical narratives. (The Great Farming Hoax – Einkorn Wheat)


Other Blogs

s

t

Professor Bonkers and the mad, mad World of Archaeology

Introduction

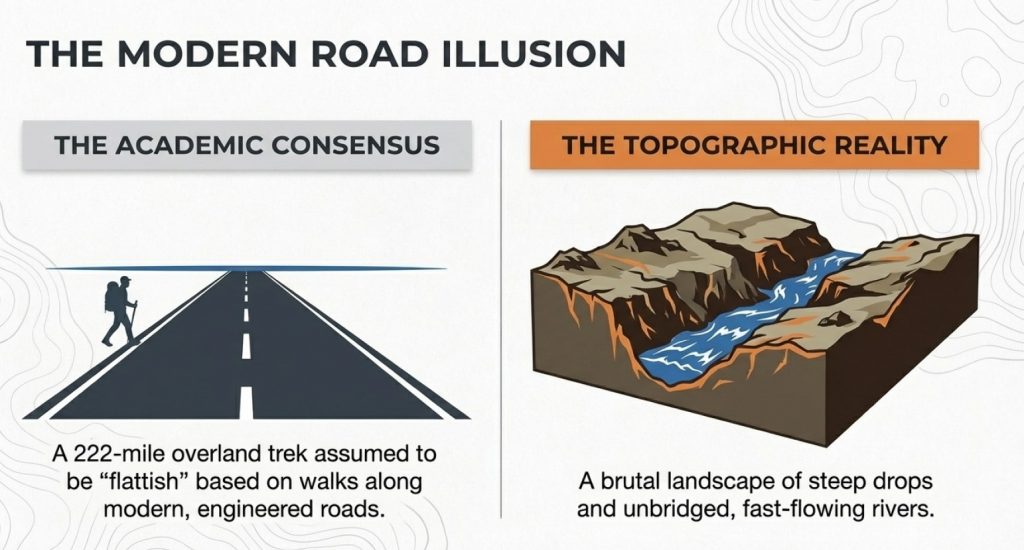
We have examined Professor Ray’s efforts to prove that transporting bluestones by land to Stonehenge using sledges and dragging is feasible. He believes the journey is relatively flat, with gentle gradients, based on his walk along modern roads engineered over the last thousand years to maintain gradual steepness. However, he failed to consider the reality of the steep drops and river valleys the original journey would have encountered. (Professor Bonkers and the mad, mad World of Archaeology)

Even if his assumptions about the terrain were correct, the logistics of such an endeavour were not considered. He is not alone in this oversight, as other established professors have maintained over the years that the ‘ox cart’ route was feasible.

(Professor Bonkers and the mad, mad World of Archaeology)

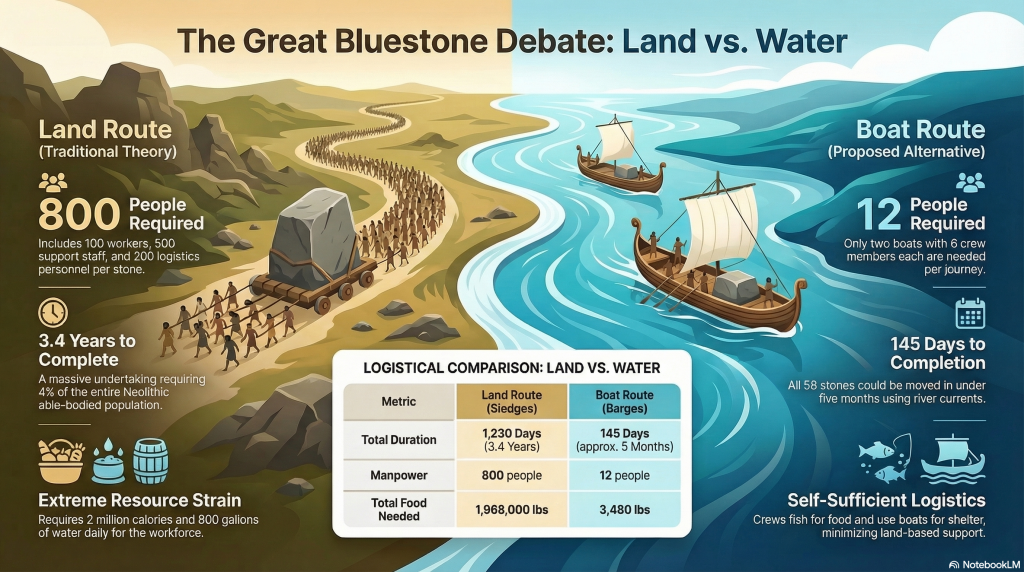
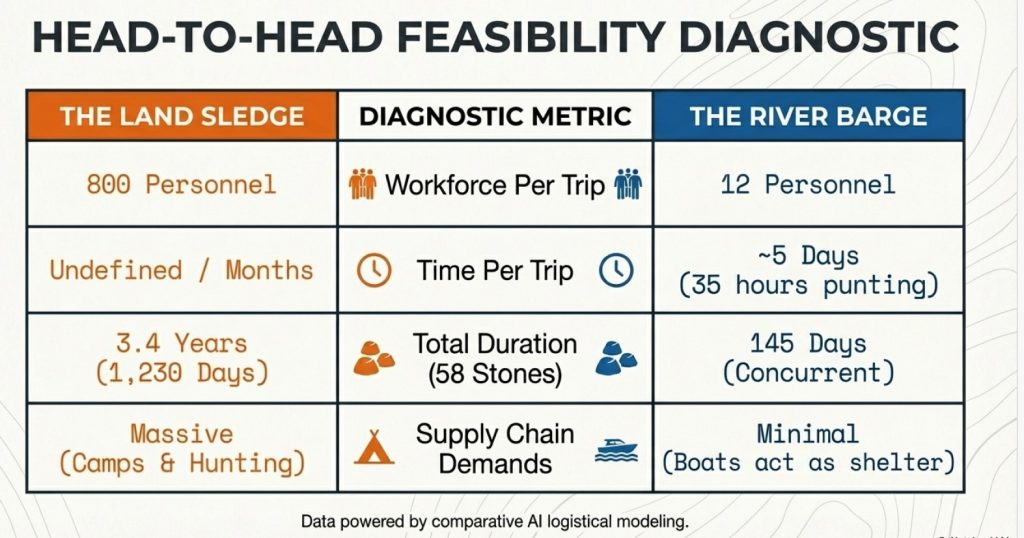
We employed AI to calculate the logistics of this project. It revealed that such a task would have required recruiting 4% of the able-bodied men of the Neolithic period and taking 3.4 years to complete. This calculation does not include the carbon-dating evidence, suggesting that additional stones were taken to replenish the old stock that had lasted a millennium.

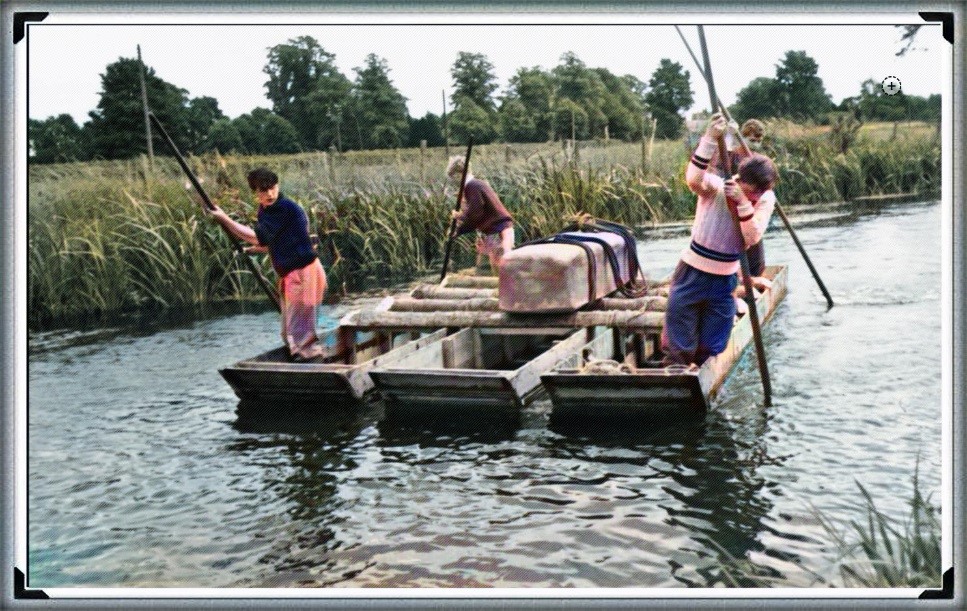
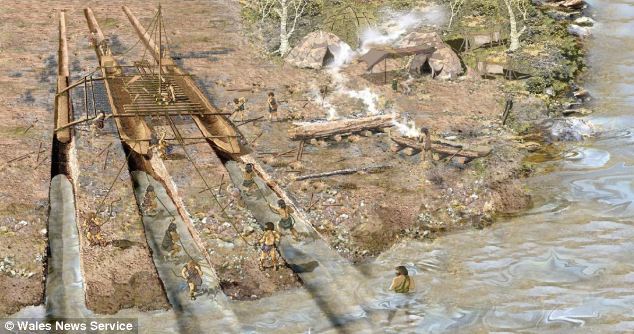
In stark contrast, we asked AI to calculate the logistics and feasibility of using a boat from the quarry to Stonehenge. The results showed that the journey could be completed in just 5 days with a team of 12 people per trip—6 people per boat (a total of 145 days). This approach seems far more feasible, as the river provides a fixed direction with minimal need for navigation markers, unlike the land route.

Professor Bonkers

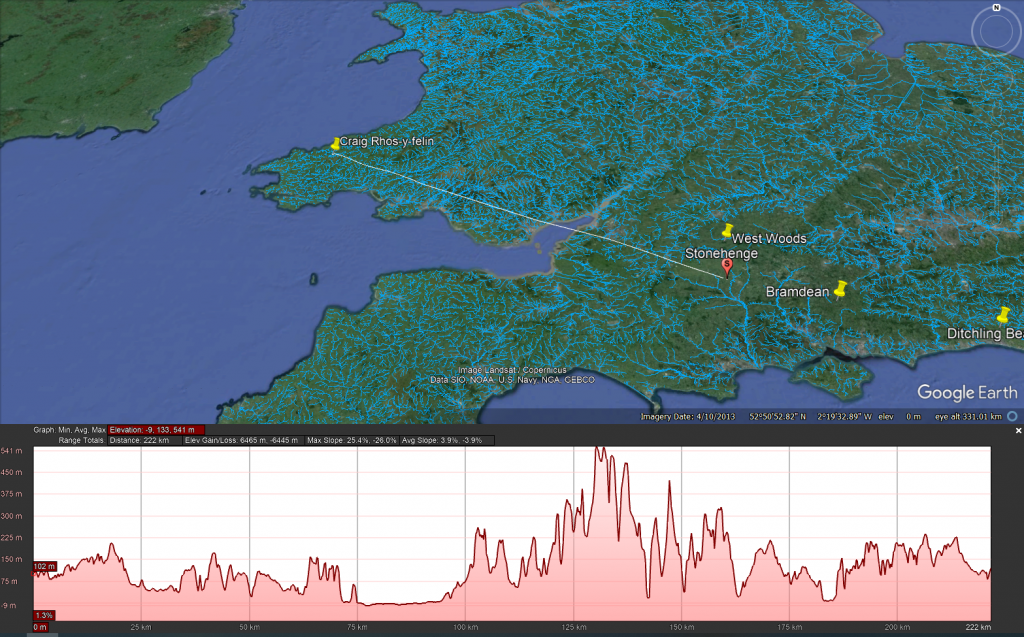
I was recently asked to share my thoughts on Professor Keith Ray’s ambitious 222-mile journey from the quarries of the Preseli Mountains to Stonehenge. He undertook this trek to gather information and generate publicity for his upcoming book. Initially, I thought he was quite mad; anyone reasonable would recognise that modern roads didn’t exist during the original bluestone journey, making his trek rather pointless. Moreover, I doubt he would wade through rivers, especially the Severn, to demonstrate how “easy” the journey was, particularly given his age.

(Professor Bonkers and the mad, mad World of Archaeology)
Prof Keith Ray approaching Stonehenge – Professor Bonkers and the mad, mad World of Archaeology

What I didn’t know was that Professor Ray had previously completed a similar journey along Offa’s Dyke. His forthcoming book, “Offa’s Dyke: Encounters and Explanations,” caught my interest, primarily since I had recently published my book on Offa’s Dyke. I was curious if he had incorporated any findings from the first-ever LiDAR survey of the Dyke. Unfortunately, it seems his research missed crucial aspects. His press release claimed that the Dyke was built in the eighth century, a notion the LiDAR survey conclusively disproves. (Professor Bonkers and the mad, mad World of Archaeology)

Even more puzzling is his reliance on outdated information from Sir Cyril Fox’s earlier work on the Dyke. In my book, I showed that Fox’s observations were misinterpreted, such as the “defensive banks” being on the wrong side of the Dyke and the “non-existent” evidence buried underground, which LiDAR proved never existed.

(Professor Bonkers and the mad, mad World of Archaeology)

Professor Ray also suggested that the boundary doesn’t align with the modern one because it has shifted over time, yet he provided no evidence. A glance at the conclusions in my book, freely available to anyone doing basic research, would reveal that 60% of the Dyke no longer exists, with much of it now being rivers. Why not the rest if rivers account for 60% of the boundary? The fact that the river and the Dyke run parallel in some parts, with less than 50 meters separating them, makes the idea of a boundary completely illogical. This brings us back to his Stonehenge walk—another exercise in futility, in my opinion.

The conclusion of Professor Ray’s press release certainly raised my eyebrows, particularly regarding his qualifications and position as an Honorary Professor of Archaeology in the School of History, Archaeology, and Religion at Cardiff University. This is new to me, but it might explain the recent trend among archaeologists to excessively refer to ceremonies, religious sites, offerings, and beliefs, which have no place in scientific discourse. Cardiff seems to regard archaeology as a social science rather than a hard science, as evidenced by Ray’s subjective observations of Offa’s Dyke.

 (Professor Bonkers and the mad, mad World of Archaeology)
First Every LiDAR Survey of Offa’s Dyke -Professor Bonkers and the mad, mad World of Archaeology

Regarding his 222-mile hike to Stonehenge, he has yet to reveal the exact route, likely keeping it a secret for his future £30 book. However, the problems with this endeavour are manifold, demonstrating how impractical and impossible the journey would have been. This is the same professor who walked 209 miles without realising that 60% of the Dyke is not visible, relying instead on Fox’s outdated observations, which LiDAR has since proven false.

Ray’s qualifications include a PhD in the archaeology of Igbo Ukwu, eastern Nigeria, from Cambridge, which some might consider a mark of infallibility. However, this background does little to validate his flawed conclusions. Previous peer-reviewed works have perpetuated the same mistakes, making them socially acceptable in archaeology. (Professor Bonkers and the mad, mad World of Archaeology)

(Professor Bonkers and the mad, mad World of Archaeology)

His Stonehenge trek raises fundamental questions. If one is leaving the Preseli mountains, which way is Stonehenge? The notion that a group of men picked up stones and followed a straightforward path to Stonehenge is illogical. The people of Stonehenge must have come to the quarry first, perhaps leaving breadcrumbs to find their way back. Maybe Professor Ray has stumbled upon a theory involving a long string to guide their return, reminiscent of a prehistoric paper chase.

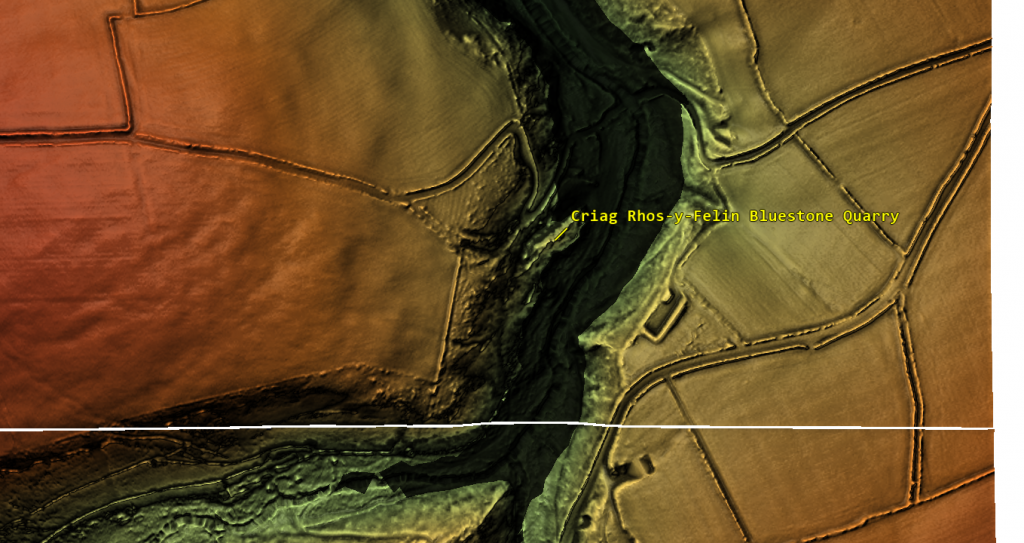
Had the renowned professor consulted my recent LiDAR map of the quarry (though it’s unclear which quarry he started from), he would have seen that, in ancient times, starting from the primary quarry required crossing a much larger river. However, photos of him setting off show him on an excellent, flat road. There are only two roads from the site: one leading the wrong way to the coast and the other heading northeast, while Stonehenge is southeast. Thus, he begins his journey in the wrong direction unless he plans to invent a non-existent pathway (untraceable by LiDAR) or start incorrectly to return home quickly via modern roads that go around the country the wrong way…. But they are flattish!

 (Professor Bonkers and the mad, mad World of Archaeology)
Stonehenge is to the South East – No roads in that Direction -Professor Bonkers and the mad, mad World of Archaeology

Overall, his hike to Stonehenge appears to be another exercise in pure folly, much like his observations of Offa’s Dyke, an exercise to sell books rather than discover the true history of Britain. (Professor Bonkers and the mad, mad World of Archaeology)

The logistics

Even if it was feasible, the professor may have overlooked the logistics of such an endeavour:

Grand Plan for Transporting Stones from Craig Rhos-y-Felin to Stonehenge

Preparation:

Reconnaissance:

Visit Stonehenge: Key planners visit Stonehenge to understand its location and surroundings.

Route Planning: Identify the best route using natural landmarks, rivers, and terrain features.

Navigation Techniques:

Sun and Stars: Use the sun for daytime navigation and stars at night.

Landmarks: Identify and memorise prominent natural landmarks.

Oral Tradition: Rely on oral tradition to maintain route guidance.

Surveying Techniques: Use basic surveying to align the route with known points.

Execution:

 (Professor Bonkers and the mad, mad World of Archaeology)
Not Exactly Flat as the Professor Suggests -Professor Bonkers and the mad, mad World of Archaeology

Quarrying:

Extract Stones: Quarry the 4-tonne bluestones using available tools and techniques.

Transportation:

Initial Movement: Use wooden sledges and rollers to move stones from the quarry to the nearest waterway.

Water Transport: Construct rafts to float the stones along rivers, utilising the natural flow.

Land Transport: Use sledges and manpower to move stones overland to Stonehenge.

Logistics:

Food and Shelter:

Temporary Camps: Establish camps along the route.

Food Supplies: Organise a supply chain with regular intervals for food and water.

Shelter: Construct temporary shelters using materials from the surrounding environment.

Manpower:

Workers and Support Staff: 100 workers for moving stones and 500 support staff per 100 workers, totalling 600 people per stone.

Additional Manpower for Supply Chain: Assuming a further 200 people dedicated to supply logistics.

Support Personnel:

Ratio: 5 support people per worker.

Total Support Workers: For 100 workers, 500 support workers are required.

Total Workforce: 800 people (100 workers + 500 support workers + 200 logistics personnel).

River Crossings:

Rivers Along the Route:

Key Rivers: Transporting the stones from Craig Rhos-y-Felin to Stonehenge would likely involve crossing several major rivers, including the River Teifi, River Wye, River Severn, and River Avon.

Tree Felling for Rafts:

Number and Size of Trees: Constructing a raft to float a 4-tonne stone requires several large trees.

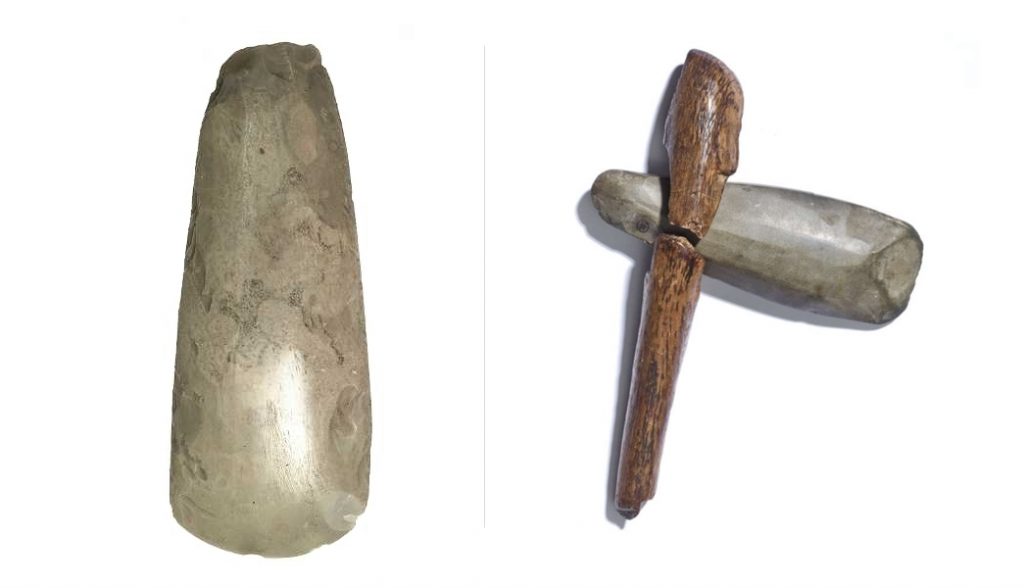
Felling Time: Cutting down trees with stone axes is a time-consuming process. Each tree may take several days to cut down and shape.

Crossing Procedure:

 (Professor Bonkers and the mad, mad World of Archaeology)
The number of Rivers are immense and would have been larger than today! -Professor Bonkers and the mad, mad World of Archaeology

Arrival at River:

Disassemble Sledges: Temporarily dismantle sledges for transport.

Build Rafts: Construct sturdy rafts using timber and other materials.

Loading Stones:

Lift Stones: Use manpower and leverage techniques to carefully load stones onto rafts.

Secure Stones: Ensure stones are securely fastened to prevent shifting during transport.

Crossing the River:

Navigate Rafts: Use poles and paddles to guide rafts across the river.

Monitor Weather: Choose optimal weather conditions for safe crossing.

Disembarkation:

Unload Stones: Carefully unload stones on the opposite bank.

Reassemble Sledges: Reconstruct sledges for continued overland transport.

Supply Chain Logistics:

Food Consumption:

Daily Requirements: Assuming an average consumption of 2,500 calories per person per day.

Food: 2,500 calories/person/day x 800 people = 2,000,000 calories/day.

Weight: Approximately 2 pounds of food per person per day.

Total Weight: 2 pounds/person/day x 800 people = 1,600 pounds of food/day.

Water Consumption:

Daily Requirements: Assuming an average consumption of 1 gallon of water per person daily.

Water: 1 gallon/person/day x 800 people = 800 gallons/day.

Clothing and Shelter:

Clothing: Seasonal clothing would be required for the workforce, likely made from wool, leather, and woven plant fibres.

Shelter: Temporary shelters made from local materials like wood, thatch, and animal hides.

 (Professor Bonkers and the mad, mad World of Archaeology)
You will need to chop down a number of trees every time you come to a river with stone tools -Professor Bonkers and the mad, mad World of Archaeology

Feasibility Based on Population:

Neolithic Population Estimates:

The population of Southern Britain during the Neolithic period is estimated to be around 100,000 people.

Assuming that approximately 20% of the population were able-bodied adults fit enough for this kind of labour, that gives us about 20,000 potential workers.

Workforce Requirement:

Direct Workforce: 600 people (including 100 workers and 500 support staff) are required for the transport operation.

Additional Manpower for Supply Chain: Assuming an additional 200 people dedicated to supply logistics, the total workforce needed would be 800 people.

Percentage of Population Involved:

Total Population Fit for Work: 20,000 able-bodied adults.

Total Workforce Needed: 800 people.

Percentage of Population: (800 / 20,000) * 100 = 4%

Timeframe Adjustments:

Total Duration: Around 3.4 years (1,230 days) to complete the mission, including increased logistical requirements.

Food Consumption Over Time:

Daily: 1,600 pounds of food/day (including additional logistics personnel).

Total: 1,600 pounds/day x 1,230 days = 1,968,000 pounds (984 tons) of food.

Water Consumption Over Time:

Daily: 800 gallons/day.

Total: 800 gallons/day x 1,230 days = 984,000 gallons of water.

Summary:

Manpower: 800 people (including additional logistics personnel).

Total Duration: 3.4 years to account for increased logistical requirements.

Logistics: Establish temporary camps, maintain supply chains, and ensure efficient coordination for continuous progress.

Feasibility: Engaging 4% of the able-bodied adult population in Southern Britain over 3.4 years is feasible but unlikely due to other commitments.

Grand Plan for Transporting Stones from Craig Rhos-y-Felin to Stonehenge via Boat

Preparation:

Reconnaissance:

Visit Stonehenge: Key planners visit Stonehenge to understand its location and surroundings.

Route Planning: Identify the best waterway route using natural landmarks, rivers, and paleochannels.

Navigation Techniques:

 (Professor Bonkers and the mad, mad World of Archaeology)
The simplicity of this method is astonishing but missed by today’s archeologists -Professor Bonkers and the mad, mad World of Archaeology

River Navigation: Use natural flow of the river and markers on the shoreline to maintain direction.

Landmarks: Identify and memorise prominent natural landmarks along the river route.

Oral Tradition: Rely on oral tradition for additional guidance.

Execution:

Quarrying:

Extract Stones: Quarry the 4-tonne bluestones using available tools and techniques.

Transportation:

Water Transport: Construct sturdy boats/barges to float the stones along rivers and paleochannels.

Logistics:

Food and Shelter:

Temporary Camps: Establish camps at key points along the route for rest and resupply.

Food Supplies: Crew can fish from the river to sustain part of their food supply, reducing the need for transported food.

Shelter: Use boats for shelter during the journey, reducing the need for land-based temporary shelters.

Manpower:

Crew for Boats: Each boat requires a crew of 6 people (4 punting and 2 resting).

Total Crew: Two boats per journey, totalling 12 people per journey.

River and Boat Transport Logistics:

(Professor Bonkers and the mad, mad World of Archaeology)
Excavations have shown that the Quarry site is surrounded by water in the past -Professor Bonkers and the mad, mad World of Archaeology

Boat Construction:

Materials: Use large logs and timbers for constructing sturdy boats/barges capable of carrying 4-tonne stones.

Felling Time: Cutting down trees with stone axes is time-consuming. Each tree may take several days to cut down and shape.

Boat Capacity:

Craft Size: Each boat must be able to carry one 4-tonne stone.

Punting Crew: Each boat requires 4 people to punt and 2 people resting.

Speed:

Average Speed: Boats can travel at a rate of 4 miles per hour.

Distance and Time Calculation:

Total Distance: Approximately 140 miles from Craig Rhos-y-Felin to Stonehenge.

Travel Time: At 4 miles per hour and 16 hours of travel per day, the journey would take approximately 35 hours of punting time. This totals approximately 2.2 days of travel.

Additional Time for Setup and Rest: Allow an additional 3 days for loading, unloading, and unforeseen delays.

Total Journey Time: Approximately 5 days per trip for two stones.

Supply Chain Logistics:

Food Consumption:

Fishing: The crew can fish to sustain part of their food supply, reducing the need for transported food.

Daily Requirements: Assuming an average consumption of 2,500 calories per person per day.

Food: 2,500 calories/person/day x 12 people = 30,000 calories/day.

Weight: Approximately 2 pounds of food per person per day.

Total Weight: 2 pounds/person/day x 12 people = 24 pounds of food/day per journey.

Water Consumption:

Daily Requirements: Assuming an average consumption of 1 gallon of water per person per day.

Water: 1 gallon/person/day x 12 people = 12 gallons/day per journey.

Clothing and Shelter:

Clothing: Seasonal clothing would be required for the entire workforce, likely made from wool, leather, and woven plant fibers.

Shelter: Use boats for shelter during the journey.

(Professor Bonkers and the mad, mad World of Archaeology)
Stonehenge was surround by water during Phase 1 -Professor Bonkers and the mad, mad World of Archaeology

Feasibility Based on Population:

Neolithic Population Estimates:

The population of Southern Britain during the Neolithic period is estimated to be around 100,000 people.

Assuming that approximately 20% of the population were able-bodied adults fit enough for this kind of labor, that gives us about 20,000 potential workers.

Workforce Requirement:

Direct Workforce: 12 people for punting and logistics per journey.

Support Personnel: Minimal additional support needed due to self-sufficiency (fishing for food and using boats for shelter).

Percentage of Population Involved:

Total Population Fit for Work: 20,000 able-bodied adults.

Total Workforce Needed: 12 people per journey.

Timeframe and Numbers:

Total Duration: Approximately 5 days per trip for two stones.

Total Stones: 58 stones to be transported.

Concurrent Transport: Assuming two stones per journey.

Total time Required: (58 stones / 2 stones per trip) * 5 days = 145 days.

Total Consumption Over Time:

Food:

Daily: 24 pounds of food/day x 12 people = 288 pounds of food/day.

Total: 24 pounds/day x 145 days = 3,480 pounds of food (1.74 tons).

Water:

Daily: 12 gallons of water/day x 12 people = 144 gallons of water/day.

Total: 12 gallons/day x 145 days = 1,740 gallons of water.

Summary:

Manpower: 12 people per journey.

Total Duration: Approximately 145 days (around 5 months) to account for increased logistical requirements and concurrent transport of two stones at a time.

Logistics: Minimal need for additional logistics due to self-sufficiency (fishing for food and using boats for shelter).

Feasibility: Engaging a very small percentage of the able-bodied adult population in Southern Britain is highly feasible.

(Professor Bonkers and the mad, mad World of Archaeology)

PodCast

Author’s Biography

Robert John Langdon, a polymathic luminary, emerges as a writer, historian, and eminent specialist in LiDAR Landscape Archaeology.

His intellectual voyage has been interwoven with stints as an astute scrutineer for governmental realms and grand corporate bastions, a tapestry spanning British Telecommunications, Cable and Wireless, British Gas, and the esteemed University of London.

A decade hence, Robert’s transition into retirement unfurled a chapter of insatiable curiosity. This phase saw him immerse himself in Politics, Archaeology, Philosophy, and the enigmatic realm of Quantum Mechanics. His academic odyssey traversed the venerable corridors of knowledge hubs such as the Museum of London, University College London, Birkbeck College, The City Literature Institute, and Chichester University.

In the symphony of his life, Robert is a custodian of three progeny and a pair of cherished grandchildren. His sanctuary lies ensconced in the embrace of West Wales, where he inhabits an isolated cottage, its windows framing a vista of the boundless sea – a retreat from the scrutinous gaze of Her Majesty’s Revenue and Customs, an amiable clandestinity in the lap of nature’s embrace.

Exploring Prehistoric Britain: A Journey Through Time

My blog delves into the fascinating mysteries of prehistoric Britain, challenging conventional narratives and offering fresh perspectives grounded in cutting-edge research, particularly LiDAR technology. I invite you to explore some key areas of my research. For example, the Wansdyke, often cited as a defensive structure, is re-examined in light of new evidence. I’ve presented my findings in my blog post Wansdyke: A British Frontier Wall – ‘Debunked’, and aWansdyke LiDAR Flyover video further visualises my conclusions.

My work also often challenges established archaeological dogma. I argue that many sites, such as Hambledon Hill, commonly identified as Iron Age hillforts, are not what they seem. My posts Lidar Investigation Hambledon Hill – NOT an ‘Iron Age Fort’ and Unmasking the “Iron Age Hillfort” Myth explore these ideas in detail and offer an alternative view. Similarly, sites like Cissbury Ring and White Sheet Camp also receive a re-evaluation based on LiDAR analysis in my posts “Lidar Investigation Cissbury Ring through time” and “Lidar Investigation White Sheet Camp,“ revealing fascinating insights into their true purpose. I have also examined South Cadbury Castle, often linked to the mythical Camelot56.

My research also extends to ancient water management, including the role of canals and other linear earthworks. I have discussed the true origins of Car Dyke in multiple posts, including Car Dyke – ABC News Podcast and Lidar Investigation Car Dyke – North Section, which suggest a Mesolithic origin 2357. I also explore the misidentification of Roman aqueducts, as seen in my posts on the Great Chesters (Roman) Aqueduct. My research has also been greatly informed by my post-glacial flooding hypothesis, which has helped explain landscape transformations over time. I have discussed this hypothesis in several posts, including AI now supports my Post-Glacial Flooding Hypothesis and Exploring Britain’s Flooded Past: A Personal Journey

Finally, my blog also investigates prehistoric burial practices, as seen in Prehistoric Burial Practices of Britain and explores the mystery of Pillow Mounds, often mistaken for medieval rabbit warrens, but with a potential link to Bronze Age cremation in my posts: Pillow Mounds: A Bronze Age Legacy of Cremation? and The Mystery of Pillow Mounds: Are They Really Medieval Rabbit Warrens?. My research also includes astronomical insights into ancient sites, for example, in Rediscovering the Winter Solstice: The Original Winter Festival. I also review new information about the construction of Stonehenge in The Stonehenge Enigma.

Further Reading

For those interested in British Prehistory, visit www.prehistoric-britain.co.uk, a comprehensive resource featuring an extensive collection of archaeology articles, modern LiDAR investigations, and groundbreaking research. The site also includes insights and excerpts from the acclaimed Robert John Langdon Trilogy, a series of books that explore Britain during the Prehistoric period. Titles in the trilogy include The Stonehenge Enigma, Dawn of the Lost Civilisation, and The Post-Glacial Flooding Hypothesis, which offer compelling evidence of ancient landscapes shaped by post-glacial flooding.

To further explore these topics, Robert John Langdon has developed a dedicated YouTube channel featuring over 100 video documentaries and investigations that complement the trilogy. Notable discoveries and studies showcased on the channel include 13 Things that Don’t Make Sense in History and the revelation of Silbury Avenue – The Lost Stone Avenue, a rediscovered prehistoric feature at Avebury, Wiltshire.

In addition to his main works, Langdon has released a series of shorter, accessible publications, ideal for readers delving into specific topics. These include:

For active discussions and updates on the trilogy’s findings and recent LiDAR investigations, join our vibrant community on Facebook. Engage with like-minded enthusiasts by leaving a message or contributing to debates in our Facebook Group.

Whether through the books, the website, or interactive videos, we aim to provide a deeper understanding of Britain’s fascinating prehistoric past. We encourage you to explore these resources and uncover the mysteries of ancient landscapes through the lens of modern archaeology.

For more information, including chapter extracts and related publications, visit the Robert John Langdon Author Page. Dive into works such as The Stonehenge Enigma or Dawn of the Lost Civilisation, and explore cutting-edge theories that challenge traditional historical narratives.

Other Blogs

s

t

Wansdyke East – Prehistoric Canals

Promotional Video – Ancient Prehistoric Canals (Dykes) – Wansdyke

Extract From Book……………………… Ancient Prehistoric Canals (Dykes) – Wansdyke (Wansdyke East – Prehistoric Canals)

The INTRODUCTION

Wansdyke has always captured the imagination of the general public as it is a substantial prominent structure in the Wiltshire landscape relatively close to another famous ancient site Avebury, which also has massive ditches like Wansdyke and therefore, one might suggest there is a direct relationship between the two.

This apparent connection has not occurred to past or present archaeologists who sought to find a simple meaning for this unique ‘linear structure’ and hence the conclusion that it was built to defend warlike invaders of the past and hence a ‘Saxon’ name was adopted as historians of the past believed that these ‘tribes’ had large armed forces that could cope with such grand engineering undertakings as it was to defend their land.

Over the last few decades, this ‘fact’ (which was also shared by an even more immense ‘Dyke’ also named after a Saxon ‘Offa’) has been revisited and found that this continuous defence ditch is far less continuous than previously believed and a new theory developed for these earthworks as ‘Boarder Markers’ in the landscape – as they have never been a single body found with battle wounds in all 22 miles of Wansdyke or the 177 mile Offa’s Dyke which would support the defence hypothesis.

Sadly, even with this new ‘reassuring’ suggestion for these extensive sites, archaeologists have failed to address the facts that Dykes are incomplete and not continuous (Offa has 40% missing and Wansdyke has 20% missing) and there beginning and end points just ‘appear’ without reason in the landscape ‘like magic’ with no one able to tell you why.

Moreover, if these ‘Boundary Markers’ taking years if not decades to build were demarcation points for land ownership, then why do some Dykes (like Offa) track much larger separation points like major rivers that would have been a far more apparent marker than a 4m ditch and a known and well used territorial boundary marker still used today.

Furthermore, archaeologists have ignored that there are over 1500+ scheduled Dykes in Britain (including Ireland), of which 90% could not be used for this function as some of these ‘boundary markers’ are found on uninhabited islands dotted around the entire circumference of Britain.

Robert John Langdon (2022)

Section 2 – HE:1004719  Wansdyke: Section from S of Furze Hill to Marlborough-Pewsey Road 4.3km (4,300m = 12,900 working days – 20 men taking 649 days (1.78 years).

No, Historic Details or Excavations Registered

S of Furze Hill to Marlborough - Pewsey Roads (GE) - Wansdyke East - Prehistoric Canals
S of Furze Hill to Marlborough – Pewsey Roads (GE) – Prehistoric Canals (Dykes) – Wansdyke (2)

 OS Map

S of Furze Hill to Marlborough - Pewsey Roads (OS -Wansdyke East - Prehistoric Canals
S of Furze Hill to Marlborough – Pewsey Roads (OS) – Prehistoric Canals (Dykes) – Wansdyke (2)

1800 OS Map

S of Furze Hill to Marlborough - Pewsey Roads (1800s Map) - Wansdyke East - Prehistoric Canals
S of Furze Hill to Marlborough – Pewsey Roads (1800s Map) -Wansdyke East – Prehistoric Canals

LiDAR Map

S of Furze Hill to Marlborough - Pewsey Roads (LiDAR) - Wansdyke East - Prehistoric Canals
S of Furze Hill to Marlborough – Pewsey Roads (LiDAR) – Wansdyke East – Prehistoric Canals

LiDAR (with Mesolithic water levels)

S of Furze Hill to Marlborough - Pewsey Roads (with Meso Water Levels) - Wansdyke East - Prehistoric Canals
S of Furze Hill to Marlborough – Pewsey Roads (with Meso Water Levels) -Wansdyke East – Prehistoric Canals

Canal working hours

 We use an estimated rate of 0.3m per day for calculating sections; on this single section, of the Dyke; we have a total length of 4.3km (4,325m).

 At a rate of 0.3m per day over 8 hours – this gives us 12,975 working days.  Using 20 person in a work team (with 200 people supporting the workers – to suppy food, water shelter, repair tools and clear the ground in advance of trees and scrubs.  This gives us a total of 649 days (1.78 years).   The estimate is based on one man cutting 0.3m per day (Ditch down to 2m deep within a chalk bedrock and the piling of the bank).

P.J.Fowler (2001) used 0.1423 metres per hour and claimed 1,000 men built the ENTIRE East Dyke in 30 days working 10-hours a day six days a week??

This ridiculous claim even with modern tools, it would be too demanding, and the logistics of feeding, mending tools and housing 1,000 men were not taken into account. 

If we take the East Wansdyke into account – which is a total of 25,408 – we then get a calculation of 84,693 days. That is 11.6 years for the same 200 man tean (20 digging) – which indicates that this Dyke was built in small sections and then joined at a later date?

Twisty Route

What is clear from the route of this section of Wansdyke is that it is not straight at all; it works against the topology to bend at 90 degrees in some places and dip down unnecessarily into a valley rather than taking the high ground. 

The line of Wansdyke is not remotely straight - Wansdyke East - Prehistoric Canals
The line of Wansdyke is not remotely straight – Wansdyke East – Prehistoric Canals

But these wild undulations into valleys also cause problems for my hypothesis as a canal. For example, how could a canal move up and down significant gradients without locks?

Well, the answer is that they can’t – but the solution to this problem is in detail, for if you look again at this part of Wansdyke going into an old dry river valley, you see something archaeologists miss – it stops!!

We also saw this from the transition from Section 1 to Section 2 of Wansdyke.  The second was a gap, which looked like a piece filled in by farming; there were two other gaps; the first was a later road cutting through and then a railway doing the same.

Gap number Two in Wansdyke - Wansdyke East - Prehistoric Canals
Gap number Two in Wansdyke – Wansdyke East – Prehistoric Canals
Mesolithic Water Levels again fills the gap - Wansdyke East - Prehistoric Canals
Mesolithic Water Levels again fills the gap – Wansdyke East – Prehistoric Canals

The Dry River Valley aspect of this part of the canal comes with a massive gradient – if it went to the valley’s bottom, it would make moving a boat very difficult.  But we see on LiDAR evidence of the Dyke stopping before reaching the bottom.  This is because, at some point in the past, this dry river valley in prehistoric times would not be ‘dry’ but full of water, as shown in the illustration (Fig.49)

This would make sense to the termination on the right as it would initially end at the river’s shoreline. If this was the case, the simple answer to the problem is that at that point, you took the boat across the river, so the gradients of the Dyke in the Mesolithic were small.

But why is there a continuation (bank) of the Dyke down the valley?

This can best be answered by understanding what happened to this earthwork once the waters started to fall in the Neolithic Period.

Logically, as the waters fell, the ditch would have been extended to meet the lower water level until the slope was too extreme to continue and was abandoned.  Later once the river had completely dried up (and consequently the rest of the Dyke as the water table would have universally fallen), the natural road (the bank of the Dyke) would be used as a road.

Excavations of similar aspects of Dykes have shown that the bank reduced in height and became flattered like a road and hence more comprehensive.  To use this road permanently, the builders adapted the dry river valley element (which would still be boggy for many centuries after the river disappeared) by adding to the bank by removing soil from the ground – but on both sides, making the ditch element smaller and more shallow than the rest of the Dyke and to both sides.

The result of this work looks like a loss of the deep ditch but is more likely a change in its structure – which is seen clearly on parts excavated in other Dykes but impossible to see here without excavation.

Long Barrow

An interesting associated feature can be found just 200m south of Wansdyke Section 2 – A Long Barrow.

“The monument includes a long barrow set above the floor of a dry valley in an area of gently undulating chalk downland. The barrow mound is ovate and orientated east-west. It is 40m long, 27m wide and stands to a maximum height of 3.5m. Flanking the barrow mound to the north and south are ditches from which the material used to form the mound was quarried during the construction of the monument. These survive as earthworks 8m wide and 1m deep” – Historic England

What should be noted is it’s ON THE SHORELINE of the ‘Dry River Valley’ as shown from the suggested water level in our illustration.  This is reflected by the ‘track’ (dyke) that connects the shoreline to the main Wansdyke Canal. So are we seeing the Dyke being used at a later date to take the  bones of the dead from a reincarnation site to the Long Barrow?

This confirms the river levels at the time of construction and the previously speculated gap in Wansdyke by the river valley top.

Flint Pits

Again, as shown in the previous section (1), another interesting feature near the Dyke is the ‘Old Flint Pits’ as a feature on the 1886 edition of the OS map but not recorded by the Historic Monuments Dept.

90-degree bend

Another strange and bewildering feature in this section is the 90-degree bend on the Dyke.

This ‘kink’  confirms that Wansdyke was never built as either a Defensive wall or Boundary marker.  As if it was a defensive feature, it would not have a ‘gently rounded ditch – it would be square like a castle.  If it were just a marker, it would cut across the flat landscape – as it is more work to create such a turning for no reason.

The only logical reason for such an engineering feature is that it was added later when the Water Levels dropped in the Neolithic to follow the landscape topology.

Epilogue

Unveiling the True Purpose of Britain’s Largest Linear Earthworks

The recent publication of three Lidar investigations into Offa’s Dyke, Wansdyke, and The Vallum at Hadrian’s Wall has revealed that these structures were built in areas affluent in quarrying and mineral extraction.  Archaeologists have overlooked mainly this critical aspect until now.

The likelihood that these earthworks were used to transport materials to rivers for trading is compelling.  Moreover, the possibility that they were initially constructed as transport routes for boats during the Mesolithic period, with quarries developing around this infrastructure later, is an intriguing hypothesis that deserves attention.

As we continue to study these ancient linear earthworks with advanced landscape tools like Lidar, we can expect this timeline to become more apparent.  What is undeniable is that the old myths of these structures being solely fortifications or boundary markers are complete fiction.  While they may have been used as such after their original construction, their primary purpose was much more complex and integral to early trade and transportation networks.

This new understanding challenges long-held beliefs and opens exciting avenues for future research into these remarkable earthworks’ true history and function.

Results from the LiDAR investigations

Wansdyke

With meticulous precision, our investigations have set out to unravel the intricacies enshrouding Wansdyke, delving boldly into the heart of its historical narrative.  In so doing, it dares to challenge the archaic views, which have rendered Wansdyke a mere defensive ditch or a boundary marker of the Saxon age.  However, a discerning eye reveals that these notions lack the bedrock of objective evidence, for they rely merely on a handful of carbon dates, a commonplace in the annals of sites from that period.

Unveiling the True Purpose of Britain’s Largest Linear Earthworks

Yet, the gaps within this enigmatic earthwork beckon us to embark on an exploratory journey that hints at the presence of something else entirely – the possibility of water coursing through these river valleys.  We dare to propose that these ditches were not mere boundaries but ingeniously designed moated canals, where boats once plied as a means of transport, an ideal mode of travel within a water-rich landscape.

Though our current knowledge may fall short of unearthing all the answers, the profound excavations led by Pitt Rivers present a tantalising glimpse, revealing that water once flowed through these ditches.  And the Romans themselves, much later, saw fit to repurpose these canals, affirming their practicality and utility in the annals of history.

The advent of LiDAR has unfurled before us an unprecedented vista, affording a sweeping survey of over 1500 Scheduled Dykes throughout Britain.  In the luminous wake of this technology, a compelling story unfolds, hinting at Wansdyke’s Mesolithic origins, challenging established beliefs, and unveiling its construction during a period of abundant river levels, a time far more distant than previously perceived.

With their customary flair for adaptation, the Romans likely reworked sections of Wansdyke, leaving behind a more cohesive structure than its counterparts.  The Vallum by Hadrian’s Wall and Offa’s Dyke bear the indelible marks of their prehistoric origins, standing as testaments to the Romans’ quarrying and stone-delivery endeavours.

Yet, we venture further into the mists of history, exploring prehistoric mining, the significance of quarried materials, and their vital role in facilitating trade – not just within Britain’s borders but beyond, crisscrossing the conflation of Europe.  This revelation dispels earlier scepticism and shines a light on the sophisticated network of international trade that flowed with the currents of time, enriching Wansdyke’s profound legacy as a conduit of a vibrant and interconnected ancient civilisation.

The veil of uncertainty still shrouds the origins of West Wansdyke in a cloak of ambiguity.  While the passage of time has not yet delivered a definitive date, the prevailing narrative, tethered to a carbon dating of 1500 BCE, finds itself juxtaposed against emerging evidence.  This evidence, born of meticulous inquiry, casts shadows of doubt upon the established chronology and beckons us to reevaluate our understanding.

In the chronicles of academia, where scepticism is both a guardian of rigour and a hurdle to innovation, the seeds of inquiry were sown some fifteen years ago.  The publication that dared to challenge convention and present a different perspective on West Wansdyke stirred a tempest within the academic community.  Accusations of ‘pseudoscience’ echoed like distant thunder, casting a shadow over the revelations that dared to dissent.

Yet, the march of progress is often fueled by the fervour of inquiry and the evolution of knowledge.  Archaeologists, driven by a relentless pursuit of truth, have not shied away from the fray.  In an embrace of scientific discovery, new dating evidence has emerged—a beacon of revelation that punctures the shroud of scepticism that once enshrouded the discourse.

Carbon dating, that time-traveller’s tool that peers into the past through the lens of isotopes, has yielded results that lend credence to the suspicions germinating in the fertile soil of curiosity.  LiDAR, with its laser-guided gaze, has unveiled hidden landscapes and confirmed the prehistoric existence of canals—ancient pathways etched into the earth by the hands of civilisations long past.

As we stand at this juncture, it is not merely the story of West Wansdyke that unfolds before us; it is a testament to the evolution of thought and the malleability of understanding.  The ‘pseudoscience’ that once raised eyebrows now stands vindicated—a reminder that the boundaries of knowledge are ever-shifting, ever-expanding, yielding to the tenacity of those who dare to question.

In the grand theatre of history, where narratives are woven from threads of evidence and conjecture, the tale of West Wansdyke takes centre stage.  It serves as a reminder that even the most firmly established edifices of understanding can be reshaped by the currents of new insight.  The academic stir that was ignited by dissenting revelations has matured into a symphony of acceptance—a harmonious acknowledgement that the pursuit of knowledge, however tumultuous, is the essence of scholarly endeavour.

As we navigate the twists and turns of this historical journey, we honour the legacy of those who dared to defy convention, the archaeologists who continued to dig beneath the surface, and the spirit of inquiry that animates the quest for truth.  In this narrative, West Wansdyke emerges not just as a physical structure of the past, but as a symbol of the human spirit’s unyielding march toward comprehension—a testament that even in the face of scepticism, the pursuit of understanding remains an unwavering beacon of progress.

Consequently, in the HE publication ‘Prehistoric Linear Boundary Earthworks: Introductions to Heritage Assets.  Swindon.  Historic England 2018’.

The archaeologists confess that “Some of the earliest (Dykes) seem to date to the later Neolithic period: on Ebberston Common, the latest sequence of at least six pit alignments appears to predate the construction of a round barrow which would typically date to the earlier Bronze Age, around 2000 BC. “(see Page Fig.87. Page 151 for full quotation).

And as a consequence of their endeavours now are happy to plush a timeline of Dyke construction, vindicating my original work and allowing us to date West Wansdyke from my research on water levels in the prehistoric from the middle Mesolithic to the Bronze Age.

Hadrian’s Wall – The Vallum

Unveiling the True Purpose of Britain’s Largest Linear Earthworks

Our Findings

Before we reflect on our findings Section by Section, It may be beneficial to look at the total statistics for some aspects of Hadrian’s Wall, as such details have not been found in our research on this subject.

Vallum

Total length found: 73,812m (45.86 miles) – 62% of the entire wall length

Total length missing: 40,075m (24.90 miles) – 35% of the Vallum length

The total length of Vellum 113,887m (70.77 miles)

In comparison, Hadrian’s Wall is reported as 80 Roman miles or 73 standard miles in length.

Within the 70.77 miles of the Vallum, we have identified – within 200m of the construction:

46 Springs (as specified by the 1800 OS maps series)

54 Quarries

14 Prehistoric Ancient sites

To judge if the frequency of these objects are standard or an anomaly of the Vallum – we have measured two roughly parallel lines to the Vallum, one 5 miles to the north and the other to the south, so still conforming to a similar environment and then counted the frequency of these objects that are also within 200m of the experimental map lines:

Northern Test line

12 Springs

25 Quarries

1 Ancient site

Southern Test Line

10 Springs

30 Quarries

3 Ancient Sites

Consequently, we can now judge the Vallum path against our map test lines:

10 v 46 Springs – Vallum has 460% more Springs

30 v 54 Quarries – Vallum has 180% more Quarries

14 v 2 Ancient Sites – Vallum has 700% more sites

With these fantastic statistics in mind, we can now take a detailed look at the LiDAR investigations, starting with Section A, where we find that the Vallum ends some distance before the end of the Wall on the Bowness-on-Solway coast.

This terminus seems to be at a point of a Paleochannel/Dyke that turns and heads south overland, which has no connection to the Wall.  This Section shows that the Wall was built at an inappropriate distance from the current river to be defensive – as attackers would be free to land and muster.

The LiDAR map shows the likelihood that the river was higher in the Roman period and that the Wall was built on its shoreline, making it a much more secure feature.  This raised water level would suggest that the Paleochannel was full of water and was used to link into the Vallum as a canal feature.

Section B, shows that the Vallum was in this area (sections A & B) as short-run (2.6 miles) and not continuous.  The terminal point to the east of this run again is in a river valley, which was again higher than today at the time of Roman occupation, allowing boats to enter and exit from the river Esk to supply or deliver Stone to the Wall as there is an absence of the suggested ‘Military Way’ that was supposed to be constructed for this purpose.

We will not see any signs of the Military Way (see case study) for the next 24.2km, indicating that the Vallum was the primary source of supply and communication.

Section C, demonstrates that the Vallum disappears for 2.6 miles on the LiDAR map.  No excavation evidence shows it was below the surface; we can only conclude that it did not exist in this Section.  This questions the old theory about the Vallum being constructed as a defence structure either before the Wall was built or after to defend the south flank – as attackers could just walk around it?

This Section also offers further support to the higher water table at the time of the Wall’s construction as it seems to bend around the shorelines of these higher river levels, which otherwise make no engineering or defensive sense?
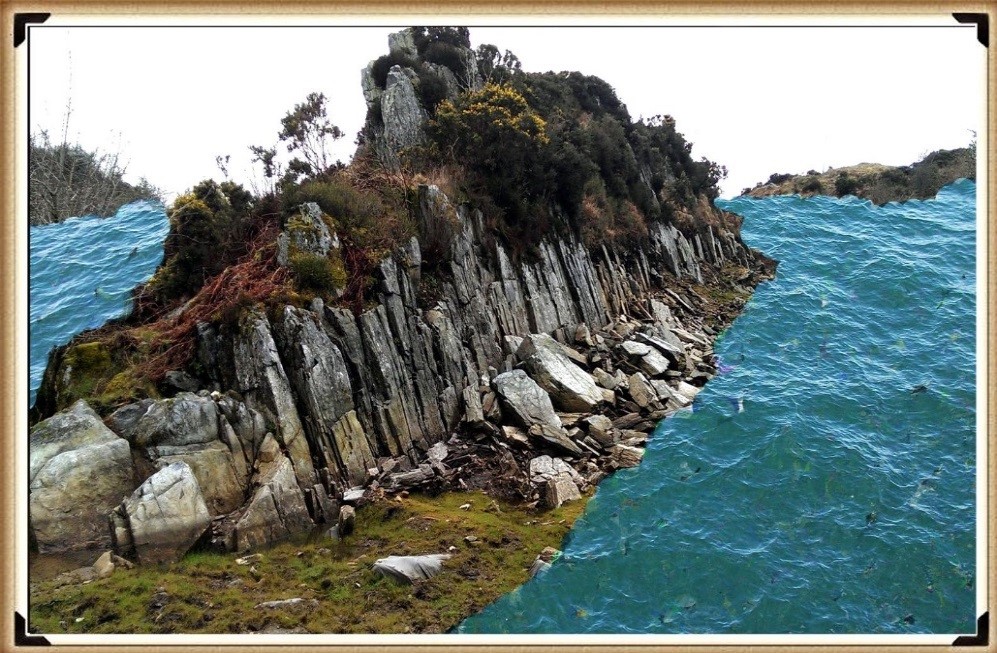
Sections D and E, illustrate the raised water levels of prehistory and, consequently, the path of the Wall and Vallum, which in places (such as in the River Eden) disappears, indicating that the Vallum was probably constructed on an existing ‘Dyke’ and enlarged for their purposes?

Sections F, G and H show the first signs of the Roman Road called Stanegate (see case study).  The Vallum again is broken in its course by the river valleys in this area, eradicating any evidence of its existence.  It also shows that the Vallum headed towards river valleys rather than avoiding them, which again would suggest these were earlier prehistoric features that were reused.

Vallum – was once a series of prehistoric dykes which were recut and extended to deliver supplies and stone to the Wall.

Stanegate – does not exist as a road but has a river connection to the first five sites.

Military Way – Does not exist as an independent road(way) but is observable in areas not covered by the Vallum.

The Antonine Wall – was once a series of Dykes that was reconnect together and recut.

Unveiling the True Purpose of Britain’s Largest Linear Earthworks

Offa’s Dyke

The Total length of Offa’s Dyke (including gaps and missing sections) 279,745m (173.8 miles)

Total length Found (by LiDAR): 95,044m (59.2 miles) – 34% of the entire length

Total length Missing (by LiDAR): 185,476m (114.6 miles) – 66% of the entire length

Total number of Gaps in the Offa’s Dyke – 70

Total number of Scheduled Monuments in Listing: 237

Features

Within the 59.2 miles of Offa’s Dyke, we have identified – within 200m of the construction:

118 (33 Natural Springs)/Wells/Ponds (as specified by the 1800 OS maps series – Wells and Ponds included to show high water table)

303 Quarries/Bell Pits (Bell Pits Ancient Quarry Holes) ave of 5 Quarries per mile of Dyke

12 Prehistoric Ancient Sites

4 Barrows

7 Roman Sites

52% of Sections are linked to each other

20% of Sections are connected to existing rivers

28% of Sections join Paleochannels

Summary

Section A – Total 20,201m. 14 Gaps – 6,758m missing (34%)

Section B – Total 110,545m. 10 Gaps – 106,768 missing (97%)

Section C – Total 55,905m.  17 Gaps – 7,990 missing (14%)

Section D – Total 56,369m. 22 Gaps – 29,848 missing (53%)

Section E – Total 36,725m. 7 Gaps – 33,101 missing (90%)

                Our findings concluded that these landscape features are much more exciting and complex than the archaeologists currently imagine, as each Section has its interest that finally gives us a solution to the construction and functionality of the Dyke.

Section A – Runs around the hills surrounding Chepstow and the River Wye.  This Dyke is no boundary or marker as the river would be a better solution to both causes.  But what it does show is the connection to Quarries and Roman Roads that would have probably linked to the canal system it inherited from the ancient Dyke builders.  These ‘linear earthworks’ were created to assist in trade during both prehistory and later Roman era until the canals dried up when the roads built upon the banks of these Dykes replaced the method of transport.

Section B – Shows why the Dyke is not interconnected, as 97% of it is missing, and there is not functionality or design that links together the small portions of Dyke that is in this Section.

Section C – Has the least missing sections, yet it still has 14% missing with 17 gaps, indicating that these Dykes are a series of individual trading canals and not a single entity.  This trading can be seen in the extensive quarries in this area, which have been mined for their mineral wealth for thousands of years.

Each hill has a different design from the last regarding width and Depth of the Ditch.  What we are seeing is a degree of uniformity in access to quarries and water sources, and natural springs along the Dyke.

Section D – This is a 50/50 series of Dyke to gap ratio, again showing that it is connected to Quarries and Mining, particularly Coal Mining, which the Romans widely used.  These are some of the largest coal mines in Britain.  The Dyke does not just come close – it in some cases the alignment goes through the middle of these quarries, with on average four quarries per Section which makes any suggestion that these Dykes were not used in conjunction with the minerals being extracted (as we see also in The Vallum at Hadrian’s Wall) and were constructed for another purpose as completely absurd.

Section E – Even archaeologists (including Fox) now admit that this is a different series of Dykes (Whitford Dyke) and not part of Offa’s Dyke as it’s too dysfunctional.

So, our conclusion about Offa’s Dyke is that we are looking at a series of working Dykes – initially built in prehistoric times and then utilised (as again we found in The Vallum) by the Romans to service the same Quarries for trading purposes.

In particular, we see this Roman influence in Section D as these are Coal minerals, which we know they used to heat the hypocaust underfloor furnaces of their Bath and home houses, which to date, archaeologists have failed to investigate the sources of this coal and how it was transported.

The Book - Prehistoric Canals (Dykes) - Wansdyke (2)
– Wansdyke East – Prehistoric Canals

This was an extracts from the NEW Book Ancient Prehistoric Canals (Dykes) – Wansdyke available on Amazon as a FULL COLOUR HARD BACK (£19.95) or a ECONOMY (£4.99) SOFTBACK black and white VERSION – it is also available as a KINDLE (£1.99) book. For further information about our work on Prehistoric Britain visit our WEBSITE or VIDEO CHANNEL.

Book details

  • ASIN ‏ : ‎ B0BF31GQKC
  • Publisher ‏ : ‎ Independently published (18 Sept. 2022)
  • Language ‏ : ‎ English
  • Hardcover ‏ : ‎ 134 pages
  • ISBN-13 ‏ : ‎ 979-8353488897
  • Dimensions ‏ : ‎ 15.24 x 1.3 x 22.86 cm
  • Illustrations: 85
  • Customer reviews: 5.0 out of 5 stars    1 rating

PodCast

Author’s Biography

Robert John Langdon, a polymathic luminary, emerges as a writer, historian, and eminent specialist in LiDAR Landscape Archaeology.

His intellectual voyage has interwoven with stints as an astute scrutineer for governmental realms and grand corporate bastions, a tapestry spanning British Telecommunications, Cable and Wireless, British Gas, and the esteemed University of London.

A decade hence, Robert’s transition into retirement unfurled a chapter of insatiable curiosity. This phase saw him immerse himself in Politics, Archaeology, Philosophy, and the enigmatic realm of Quantum Mechanics. His academic odyssey traversed the venerable corridors of knowledge hubs such as the Museum of London, University College London, Birkbeck College, The City Literature Institute, and Chichester University.

In the symphony of his life, Robert is a custodian of three progeny and a pair of cherished grandchildren. His sanctuary lies ensconced in the embrace of West Wales, where he inhabits an isolated cottage, its windows framing a vista of the boundless sea – a retreat from the scrutinous gaze of the Her Majesty’s Revenue and Customs, an amiable clandestinity in the lap of nature’s embrace.

Exploring Prehistoric Britain: A Journey Through Time

My blog delves into the fascinating mysteries of prehistoric Britain, challenging conventional narratives and offering fresh perspectives based on cutting-edge research, particularly using LiDAR technology. I invite you to explore some key areas of my research. For example, the Wansdyke, often cited as a defensive structure, is re-examined in light of new evidence. I’ve presented my findings in my blog post Wansdyke: A British Frontier Wall – ‘Debunked’, and a Wansdyke LiDAR Flyover video further visualizes my conclusions.

My work also often challenges established archaeological dogma. I argue that many sites, such as Hambledon Hill, commonly identified as Iron Age hillforts are not what they seem. My posts Lidar Investigation Hambledon Hill – NOT an ‘Iron Age Fort’ and Unmasking the “Iron Age Hillfort” Myth explore these ideas in detail and offer an alternative view. Similarly, sites like Cissbury Ring and White Sheet Camp, also receive a re-evaluation based on LiDAR analysis in my posts Lidar Investigation Cissbury Ring through time and Lidar Investigation White Sheet Camp, revealing fascinating insights into their true purpose. I have also examined South Cadbury Castle, often linked to the mythical Camelot56.

My research also extends to the topic of ancient water management, including the role of canals and other linear earthworks. I have discussed the true origins of Car Dyke in multiple posts including Car Dyke – ABC News PodCast and Lidar Investigation Car Dyke – North Section, suggesting a Mesolithic origin2357. I also explore the misidentification of Roman aqueducts, as seen in my posts on the Great Chesters (Roman) Aqueduct. My research has also been greatly informed by my post-glacial flooding hypothesis which has helped to inform the landscape transformations over time. I have discussed this hypothesis in several posts including AI now supports my Post-Glacial Flooding Hypothesis and Exploring Britain’s Flooded Past: A Personal Journey

Finally, my blog also investigates prehistoric burial practices, as seen in Prehistoric Burial Practices of Britain and explores the mystery of Pillow Mounds, often mistaken for medieval rabbit warrens, but with a potential link to Bronze Age cremation in my posts: Pillow Mounds: A Bronze Age Legacy of Cremation? and The Mystery of Pillow Mounds: Are They Really Medieval Rabbit Warrens?. My research also includes the astronomical insights of ancient sites, for example, in Rediscovering the Winter Solstice: The Original Winter Festival. I also review new information about the construction of Stonehenge in The Stonehenge Enigma.

Further Reading

For those interested in British Prehistory, visit www.prehistoric-britain.co.uk, a comprehensive resource featuring an extensive collection of archaeology articles, modern LiDAR investigations, and groundbreaking research. The site also includes insights and extracts from the acclaimed Robert John Langdon Trilogy, a series of books exploring Britain during the Prehistoric period. Titles in the trilogy include The Stonehenge Enigma, Dawn of the Lost Civilisation, and The Post Glacial Flooding Hypothesis, offering compelling evidence about ancient landscapes shaped by post-glacial flooding.

To further explore these topics, Robert John Langdon has developed a dedicated YouTube channel featuring over 100 video documentaries and investigations that complement the trilogy. Notable discoveries and studies showcased on the channel include 13 Things that Don’t Make Sense in History and the revelation of Silbury Avenue – The Lost Stone Avenue, a rediscovered prehistoric feature at Avebury, Wiltshire.

In addition to his main works, Langdon has released a series of shorter, accessible publications, ideal for readers delving into specific topics. These include:

For active discussions and updates on the trilogy’s findings and recent LiDAR investigations, join our vibrant community on Facebook. Engage with like-minded enthusiasts by leaving a message or contributing to debates in our Facebook Group.

Whether through the books, the website, or interactive videos, we aim to provide a deeper understanding of Britain’s fascinating prehistoric past. We encourage you to explore these resources and uncover the mysteries of ancient landscapes through the lens of modern archaeology.

For more information, including chapter extracts and related publications, visit the Robert John Langdon Author Page. Dive into works such as The Stonehenge Enigma or Dawn of the Lost Civilisation, and explore cutting-edge theories that challenge traditional historical narratives.

Other Blogs

s

t

The Problem with Hadrian’s Vallum

Introduction

Historians and archaeologists have the Romans pretty sown up when it comes to how and why the Empire did things and why? Let’s take Hadrian’s Wall (Hadrian’s Vallum) – English Heritage would have you believe that:

“Permanent conquest of Britain began in AD 43. By about AD 100, the northernmost army units in Britain lay along the Tyne–Solway isthmus. The forts here were linked by a road, now known as the Stanegate, between Corbridge and Carlisle.

Hadrian came to Britain in AD 122 and, according to a biography written 200 years later, ‘put many things to right and was the first to build a wall 80 miles long from sea to sea to separate the barbarians from the Romans’.

The building of Hadrian’s Wall probably began that year and took at least six years to complete. The original plan was for a wall of stone or turf, with a guarded gate every mile and two observation towers in between, and fronted by a wide, deep ditch. Before work was completed, 14 forts were added, followed by an earthwork known as the Vallum to the south”.

Really so what is the Vallum then?

Classic Cross-section of Hadrian's Wall as seen by archaeologists - The Problem with Hadrian's Vallum
Classic Cross-section of Hadrian’s Wall as seen by archaeologists – The Problem with Hadrian’s Vallum

Let’s read on…… “The Wall was placed slightly north of the existing line of military installations between the River Tyne and the Solway Firth. Its line was carefully chosen to make best use of the topography, and it was surveyed from each end towards the middle, or rather towards the crags, in sections. Building in the east started at the point where the road from the south, Dere Street, met the Wall and where later a gate, the Portgate, was erected.”

As first planned, most of the Wall was to be built in stone, but the eastern 30-mile section was in turf. In front of both was a substantial ditch, except where crags or rivers made this unnecessary. At each mile a gate was protected by a small guard post called a milecastle.

Between each pair of milecastles lay two towers (turrets), creating a pattern of observation points every third of a mile. The stone wall, with a maximum height of about 15 feet (4.6 metres), was 10 Roman feet (3 metres) wide, wide enough for there to have been a walkway along the top, and perhaps also a parapet wall. The turf sector was 20 Roman feet (6 metres) wide.

To the north of the turf sector lay three advance forts, all probably part of this plan, but otherwise the forts remained on the Stanegate behind the Wall.

Before the first plan was completed, a radical change led to the placing of forts on the wall line and down the Cumbrian coast, and the construction of an earthwork to the south.

The forts, each apparently built for a single unit and at a basic spacing of 7⅓ miles, were placed astride the Wall wherever possible. This allowed three main gates, each with two entrances, making the equivalent of six milecastle gates, to provide access to the north; the double-portal south gate was supplemented by two small side gates. The position of the forts and the provision of so many gates suggest that a requirement for increased mobility led to this change.

The addition of the forts was followed by the construction of an earthwork to the south 120 Roman feet (an actus – about 35 metres) wide. This consisted of a central ditch between two mounds. Causeways, surmounted by gates, were provided at forts. The purpose of the Vallum, as this earthwork is known, was presumably to protect the rear of the frontier zone.

So, the Vallum is a defensive ditch, then?

Sounds quite simple doesn’t it……. Until you start looking at the detail!!

I have been studying the 1497+ (for every two scheduled Dyke I have measured and categorised I have found on average one not scheduled or noticed) Dykes in Britain (including Southern Ireland) and noticed a few cut through the Vallum, which is strange as I have observed that the Vallum either starts or ends on these occasions.

Consequently, I have started to measure and track the Vallum via LiDAR maps I have at my deposal and have found severe flaws in the English Heritage Literature. So let’s look at just one section of Hadrian’s Wall to show you examples of how the present understanding of Hadrian’s Wall does not hold up to scrutiny.

Scheduled Monument section 1010987

– The Vallum between the field boundary south east of Heads Wood and the A6021 road in Wall Mile 57.

LiDAR Map of this section – notice the section over the peninsula is probably a road as it connects and ends at a Roman Fort – The Problem with Hadrian’s Vallum

The first problem we find is that it disappears for 3,000 metres without reason – not a very effective ‘defensive structure’ with gaps of this size – and our survey has identified quite a few gaps like this throughout the line of the Wall.

The second problem is its construction – it’s far too big?  The LiDAR maps clearly show its 36m wide consisting of TWO banks(one on each site) of 13m wide and a Ditch of 10m with a flat bottom (found on previous excavations) – if it’s defensive, it’s rubbish?? A defensive ditch has ONE bank (which you place a wooden palisade) and a V-shaped smaller ditch 3 – 4m, so soldiers fall in and break their legs – these ditches you can jump in and march across??

OS 1800s Map showing a gap – but it is much larger than OS believed – The Problem with Hadrian’s Vallum

The third conundrum is that the Wall is sometimes a fair distance from the Vallum.  The construction seems to hug the lowlands near or on rivers and shorelines – sometimes connecting with prehistoric Dykes, as we have previously suggested.

The evidence suggests that the Vallum was a Dyke, which would make more sense as the Wall needed constant supplies, and to date, nobody has worked out how on earth you move TWO MILLION CUBIC METRES OF STONE without using boats?

Moreover, the identification of the double-banked Dyke shows that the Roman’s had ‘tow paths’ on both sides of the Dyke for ease of two-way traffic (unlike the Victorian canal system) and that the later ‘Military Way’ Road was simply the continuation of this ‘goods connection’ by using one of the banks when the Dyke dried or silted at a later date.

What our research has shown is that there was a great possibility (due to location) that a prehistoric Dyke (like Wansdyke and offa) was already in this area, and the Roman’s used it for convenience and to save money (labour) on their wall endeavour.

I have publishing a book on the Vallum and Hadrian’s Wall as the Antonine Wall has similar characteristics to the Vallum, and with LiDAR, we can again correct (like my first trilogy) the so-called ‘known history’ of Britain.(The Problem with Hadrian’s Vallum)

Podcast

Author’s Biography

Robert John Langdon, a polymathic luminary, emerges as a writer, historian, and eminent specialist in LiDAR Landscape Archaeology.

His intellectual voyage has interwoven with stints as an astute scrutineer for governmental realms and grand corporate bastions, a tapestry spanning British Telecommunications, Cable and Wireless, British Gas, and the esteemed University of London.

A decade hence, Robert’s transition into retirement unfurled a chapter of insatiable curiosity. This phase saw him immerse himself in Politics, Archaeology, Philosophy, and the enigmatic realm of Quantum Mechanics. His academic odyssey traversed the venerable corridors of knowledge hubs such as the Museum of London, University College London, Birkbeck College, The City Literature Institute, and Chichester University.

In the symphony of his life, Robert is a custodian of three progeny and a pair of cherished grandchildren. His sanctuary lies ensconced in the embrace of West Wales, where he inhabits an isolated cottage, its windows framing a vista of the boundless sea – a retreat from the scrutinous gaze of the Her Majesty’s Revenue and Customs, an amiable clandestinity in the lap of nature’s embrace.

Exploring Prehistoric Britain: A Journey Through Time

My blog delves into the fascinating mysteries of prehistoric Britain, challenging conventional narratives and offering fresh perspectives based on cutting-edge research, particularly using LiDAR technology. I invite you to explore some key areas of my research. For example, the Wansdyke, often cited as a defensive structure, is re-examined in light of new evidence. I’ve presented my findings in my blog post Wansdyke: A British Frontier Wall – ‘Debunked’, and a Wansdyke LiDAR Flyover video further visualizes my conclusions.

My work also often challenges established archaeological dogma. I argue that many sites, such as Hambledon Hill, commonly identified as Iron Age hillforts are not what they seem. My posts Lidar Investigation Hambledon Hill – NOT an ‘Iron Age Fort’ and Unmasking the “Iron Age Hillfort” Myth explore these ideas in detail and offer an alternative view. Similarly, sites like Cissbury Ring and White Sheet Camp, also receive a re-evaluation based on LiDAR analysis in my posts Lidar Investigation Cissbury Ring through time and Lidar Investigation White Sheet Camp, revealing fascinating insights into their true purpose. I have also examined South Cadbury Castle, often linked to the mythical Camelot56.

My research also extends to the topic of ancient water management, including the role of canals and other linear earthworks. I have discussed the true origins of Car Dyke in multiple posts including Car Dyke – ABC News PodCast and Lidar Investigation Car Dyke – North Section, suggesting a Mesolithic origin2357. I also explore the misidentification of Roman aqueducts, as seen in my posts on the Great Chesters (Roman) Aqueduct. My research has also been greatly informed by my post-glacial flooding hypothesis which has helped to inform the landscape transformations over time. I have discussed this hypothesis in several posts including AI now supports my Post-Glacial Flooding Hypothesis and Exploring Britain’s Flooded Past: A Personal Journey

Finally, my blog also investigates prehistoric burial practices, as seen in Prehistoric Burial Practices of Britain and explores the mystery of Pillow Mounds, often mistaken for medieval rabbit warrens, but with a potential link to Bronze Age cremation in my posts: Pillow Mounds: A Bronze Age Legacy of Cremation? and The Mystery of Pillow Mounds: Are They Really Medieval Rabbit Warrens?. My research also includes the astronomical insights of ancient sites, for example, in Rediscovering the Winter Solstice: The Original Winter Festival. I also review new information about the construction of Stonehenge in The Stonehenge Enigma.

Further Reading

For those interested in British Prehistory, visit www.prehistoric-britain.co.uk, a comprehensive resource featuring an extensive collection of archaeology articles, modern LiDAR investigations, and groundbreaking research. The site also includes insights and extracts from the acclaimed Robert John Langdon Trilogy, a series of books exploring Britain during the Prehistoric period. Titles in the trilogy include The Stonehenge Enigma, Dawn of the Lost Civilisation, and The Post Glacial Flooding Hypothesis, offering compelling evidence about ancient landscapes shaped by post-glacial flooding.

To further explore these topics, Robert John Langdon has developed a dedicated YouTube channel featuring over 100 video documentaries and investigations that complement the trilogy. Notable discoveries and studies showcased on the channel include 13 Things that Don’t Make Sense in History and the revelation of Silbury Avenue – The Lost Stone Avenue, a rediscovered prehistoric feature at Avebury, Wiltshire.

In addition to his main works, Langdon has released a series of shorter, accessible publications, ideal for readers delving into specific topics. These include:

For active discussions and updates on the trilogy’s findings and recent LiDAR investigations, join our vibrant community on Facebook. Engage with like-minded enthusiasts by leaving a message or contributing to debates in our Facebook Group.

Whether through the books, the website, or interactive videos, we aim to provide a deeper understanding of Britain’s fascinating prehistoric past. We encourage you to explore these resources and uncover the mysteries of ancient landscapes through the lens of modern archaeology.

For more information, including chapter extracts and related publications, visit the Robert John Langdon Author Page. Dive into works such as The Stonehenge Enigma or Dawn of the Lost Civilisation, and explore cutting-edge theories that challenge traditional historical narratives.

Other Blogs

s

t

Archaeology’s Bayesian Mistake: Stop Averaging the Past

Introduction

Archaeology’s Bayesian Mistake: Stop Averaging the Past
The Peer-Reviewed map of 2019 is showing the maritine connections even as silly baysian averages – Archaeology’s Bayesian Mistake: Stop Averaging the Past

Archaeology loves a tidy median. Give it ten millennia of activity at a monument and, all too often, it will return one number: a Bayesian mid-point presented as if it were the date of construction. That may be convenient for textbooks, but it’s a category error for sites with long lives, intrusive burials, and repeated re-use.

This post does the opposite. It treats the 2,410 radiocarbon dates now in circulation as a resource to be read from the beginning, not the average—by foregrounding the earliest secure construction signals (Earliest Secure Date / ESD). Do that, and a very different story emerges:

  • Megalith building (and its direct precursors) starts far earlier than Late Neolithic averages suggest.
  • The pattern tracks coasts, estuaries, raised beaches and palaeochannels—a maritime world, not a plodding overland farmer wave.
  • “Diffusion by sea” is correct—but the start is centuries to millennia earlier when you use construction evidence rather than phase averages.

Archaeology’s Bayesian Mistake: Stop Averaging the Past
Unprecedented number of sample in this report – blows most dating evidence of the last 50 years out-of-

The Problem in One Line

Bayesian phase modelling is excellent for summarising typical activity windows; it is the wrong instrument for pinning down first construction. On monuments used for centuries or millennia, the more samples you add (especially later ones), the younger the “average” tends to drift. Great for phases. Misleading for build dates.

Archaeology’s Bayesian Mistake: Stop Averaging the Past

The ESD Rule (How to Date Construction Honestly)

When the question is “When was this built?”:

  1. Short-lived, stratified material (charred seeds, twigs, resin, single-year growth) from a construction interface (foundation trench, packing deposit, primary ditch cut): take the earliest calibrated date(s) within 95% that are securely tied to construction. Do not average with later phases.
  2. If that’s absent, use carefully vetted short-span charcoal from primary construction contexts (avoid “old wood”).
  3. Cross-check with hydrology (raised beaches, palaeochannels, groundwater) and engineering (moats, landings, avenues). When hydro-context and earliest dates agree, you’ve got your ESD.
  4. Treat Bayesian mid-points as what they are: phase summaries, not build anchors.

Archaeology’s Bayesian Mistake: Stop Averaging the Past

What the Earliest Signals Say (by region)

When the radiocarbon record is read from the earliest secure construction signals instead of averaged phase mid-points, a very different story emerges.

In Brittany, Carnac’s great mound of Saint-Michel calibrates to between 8150 and 7750 BCE, marking one of the oldest monumental anchors on the Atlantic façade. Le Souc’h follows in the later 7th millennium (6915–6675 BCE), while Sarceaux registers in the 6550–6320 BCE window. Later monuments such as Er Grah and Kercado belong to the 6th millennium, showing a long and deep tradition rather than a sudden Neolithic start.

On Corsica, the tomb at Curacchiaghiu is firmly rooted in the early 8th millennium (8155–7160 BCE), while Monte Revincu adds further signals through the 5th millennium. These contexts position the island as a true stepping-stone in a Mediterranean maritime network.

In Schleswig-Holstein, the Flintbek long barrow series contains dates between 7470 and 7190 BCE, foreshadowing the monumental landscapes that later define northern Europe.

The Atlantic façade of Iberia is equally early. Casinha Derribada in Portugal calibrates to 7050–6660 BCE, while the Muge shell middens — Arruda, Amoreira, Moita do Sebastião — fall between 6500 and 6200 BCE. Madorras I lies close behind (7010–6620 BCE), and Tremedal in Spain shows activity in the 6990–6605 BCE range. Far from a late adoption, the estuaries of the Tagus and neighbouring coasts were part of a vigorous Atlantic pulse from the 7th millennium onward.

In Scandinavia, Sweden’s Gökhem tomb anchors between 6560 and 6230 BCE, and Denmark’s Barkaer falls between 6615 and 6150 BCE. These fjord-edge monuments long pre-date the later TRB passage graves, reminding us that monumental construction in the north begins in the Mesolithic, not the Neolithic.

The British Isles share this watery horizon. Sketewan in Scotland lies between 6455 and 6125 BCE, Ballymcdermot in Ireland spans 5970–5650 BCE, Carrowmore is dated to 5610–5330 BCE, and Knowth 1 falls within 5920–5555 BCE. Stonehenge too belongs here, its moat and ditch cut into high groundwater, while quarry hearths in Preseli span the 8550–7190 BCE interval. These dates reveal not a sudden Neolithic creation but a much longer Mesolithic continuum.

Even the Central Mediterranean aligns with this picture. Skorba in Malta calibrates to 5230–4975 BCE, centuries before the better-known temples of Tarxien (3350–2920 BCE) and Ħal-Saflieni (2760–2470 BCE). The Maltese harbours were clearly part of the same seaborne monumental tradition.


Why the story looks different in older reports

The difference lies in method. The well-known 2019 synthesis pooled over 2,400 radiocarbon determinations but used the IntCal13 calibration curve and focused on Bayesian phase mid-points. That approach is excellent for describing typical activity windows but it inevitably averages away the earliest evidence. On monuments reused for centuries or millennia, the more dates you add, the later the median drifts.

Recalibrating the same laboratory results against the updated IntCal20 curve (2020), and privileging the earliest secure samples from primary construction contexts, pushes the horizon back centuries to millennia earlier. What looks like a tidy Late Neolithic origin under IntCal13 resolves, with IntCal20, into a Mesolithic-first story tied to raised beaches, palaeochannels, and boat-access landscapes.


What the famous “2,410 dates” study actually shows—and what it doesn’t

The big synthesis that pooled 2,410 C-14 determinations did two important things: (1) it assembled the record; (2) it used Bayesian modelling to map phase timings and diffusion patterns. That’s valuable and—crucially—compatible with our case. Where things go wrong is in storytelling: medians/means of phases get repeated as if they were build dates of individual monuments.

Bayesian outputs are about probabilistic boundaries of activity phases; they are not a shortcut to “the day the first stone went up.” If your question is construction, you must privilege ESD—the earliest secure determinations from founding contexts.

Archaeology’s Bayesian Mistake: Stop Averaging the Past

Site-by-site ledger clarifies the early horizon

Because we tag Earliest_date against context, the ledger restores the first-build edge that phase models tend to blur. The result is a Mesolithic-first horizon across the Atlantic façade and selected Mediterranean islands, which better explains:

  • Early coastal clustering (estuaries, lagoons, raised beaches).
  • Rapid sea-borne spread of ideas (not slow overland migration).
  • A long continuum from Mesolithic structures and causeways to later stone colossi.

Archaeology’s Bayesian Mistake: Stop Averaging the Past

Why Bayesian mid-points keep misleading us

Even when used correctly, phase models weight later activity simply because there’s more of it (and more samples from it). Three predictable distortions follow:

  1. Innovators vanish. The builders who did it first are averaged into a later “typical” date.
  2. Orthodoxy is preserved. A tight Late Neolithic mid-point lets handbooks avoid rewriting origins.
  3. Hydrology is sidelined. Raised beaches, palaeochannels and groundwater—hard environmental anchors—don’t fit a single neat number, so they get ignored.

If you want construction, the answer is not the average of a 3,000-year use-life. It’s the Earliest Secure Date tied to building.

Archaeology’s Bayesian Mistake: Stop Averaging the Past

Why this matters for Stonehenge & the Atlantic network

Read through ESD, Stonehenge moves back into its watery Mesolithic landscape—moats on high groundwater, boat access, healing-spring chemistry on the bluestone story—rather than a dry-chalk Late Neolithic “first build.” Ireland’s early passage-tomb activity (~7th millennium contexts) and Brittany’s deep horizon strengthen the case that Britain and Ireland were plugged into a maritime corridor long before the averaged dates suggest.

Archaeology’s Bayesian Mistake: Stop Averaging the Past

Credibility isn’t the issue—interpretation is

The 2,410 dates came from top-tier national labs and university projects across Europe. The synthesis is careful and the toolkit (e.g., OxCal) is standard. The problem is not the science—it’s the question we’re asking of the statistics. Phase models answer “when was this kind of activity typical here?” Langdon research asks “when was this monument first constructed?” Different question, different metric.

Archaeology’s Bayesian Mistake: Stop Averaging the Past

A wider, older, wetter Atlantic story

Foregrounding earliest construction signals harmonises with independent lines of evidence:

  • Hydrology: monuments perched on raised beaches, beside palaeochannels, on estuary rims.
  • Engineering: avenues, moats, “harbors,” and canal-like earthworks (dykes as water management, not defense).
  • Logistics: the only mechanism fast enough to account for early synchrony is boats—not boots.

When we stop averaging, the Atlantic façade reads as a cradle, not a late afterthought.

Archaeology’s Bayesian Mistake: Stop Averaging the Past

What a fair synthesis should look like (use both tools, but be honest)

  1. Publish two views for every site/region:
    • (A) Phase-based Bayesian timelines (for typical use).
    • (B) Event-focused ESD (for first construction).
  2. Tag contexts: construction vs. reuse vs. intrusion.
  3. Overlay hydrology and elevations; publish cross-sections.
  4. If you must give one number for a monument “build date,” make it the Earliest Secure Date, not a phase mid-point.


Archaeology’s Bayesian Mistake: Stop Averaging the Past

The question we should now ask out loud

Why have we allowed phase averages to stand in for construction dates?
Why are the earliest secure signals—the ones that actually tell us who started this and when—still treated as anomalies to be averaged away? If archaeology is a science, start with the earliest anchor. Then talk about reuse.

Archaeology’s Bayesian Mistake: Stop Averaging the Past

Final word: the stones didn’t walk. They sailed.

The 2,410-date record is extraordinary. Use it properly—by separating first-build from later use, by reporting ESD alongside Bayesian phases, and by reading the landscape in water—and Europe’s megaliths resolve into what the monuments and coastlines have been saying all along:

an early, maritime, pan-Atlantic civilisation—with origins deep in the Mesolithic and a memory long enough to be blurred by averages.Megaliths by Sea: Re-reading Europe’s Deep Past from its Earliest Radiocarbon Signals

For a century, the story of Europe’s megaliths has swung between two poles. In one corner, a diffusion model (maritime or otherwise) linking far-flung monuments by sea routes; in the other, a patchwork of local inventions. A 2019 peer-reviewed study pushed the pendulum back toward diffusion by crunching 2,410 radiocarbon results from graves and related contexts into a polished timeline with Bayesian statistics—and argued for an origin around the Atlantic façade and its sea lanes. PubMed

That paper is impressive and important. But it also highlights a problem with how we currently treat dates. Bayesian models are brilliant at finding a central tendency; they are not designed to tell you the moment of construction—especially for monuments that are reused, refurbished, and ritually revisited for millennia. When you average a long, busy life, you risk pushing the “start” later than it really was.

Archaeology’s Bayesian Mistake: Stop Averaging the Past

Appendices


Appendix — Earliest Secure Dates by Country (Top 5 per country)

(Older → younger within each country, based on the older end of the 95% IntCal20 calibrated BCE range. “RC Age” is the reported radiocarbon age in years BP.)

Denmark

  • Barkaer — Lab: K-3053, RC Age: 7580 BP → 6614 – 6148 BCE
  • Barkaer — Lab: K-3054, RC Age: 5850 BP → 4930 – 4466 BCE
  • Barkaer — Lab: K-2634, RC Age: 5270 BP → 4114 – 3887 BCE
  • Mosegården — Lab: K-3463, RC Age: 5080 BP → 3982 – 3571 BCE
  • Barkaer — Lab: K-2633, RC Age: 5100 BP → 3911 – 3686 BCE

England

  • Ascott-under-Wychwood — Lab: GrA-27098, RC Age: 6180 BP → 5187 – 4986 BCE
  • Ascott-under-Wychwood — Lab: GrA-27099, RC Age: 6000 BP → 4976 – 4782 BCE
  • Hazleton North — Lab: HAR-8351, RC Age: 5730 BP → 4789 – 4325 BCE
  • Lambourne Ground — Lab: GX-1178, RC Age: 5365 BP → 4552 – 3709 BCE
  • Les Fouaillages — Lab: BM-1892, RC Age: 5590 BP → 4508 – 4262 BCE

France

  • Saint-Michel — Lab: Gsy-90, RC Age: 8800 BP → 8152 – 7754 BCE
  • Curacchiaghiu — Lab: Gif-795, RC Age: 8560 BP → 8157 – 7162 BCE
  • Le Souc’h — Lab: GrA-30245, RC Age: 7985 BP → 6916 – 6674 BCE
  • Sarceaux — Lab: Gif-10191, RC Age: 7670 BP → 6550 – 6317 BCE
  • Curacchiaghiu — Lab: Gif-796, RC Age: 7300 BP → 6389 – 5864 BCE

Germany

  • Flintbek — Lab: KIA-41582, RC Age: 8328 BP → 7469 – 7193 BCE
  • Borgstedt LA 22 — Lab: KIA-47607-2, RC Age: 5150 BP → 3931 – 3789 BCE
  • Albersdorf, LA 56 (Bredenhoop) — Lab: KIA-49487-1, RC Age: 5110 BP → 3893 – 3732 BCE
  • Borgstedt LA 22 — Lab: KIA-47607-1, RC Age: 5077 BP → 3847 – 3701 BCE
  • Albersdorf, LA 56 (Bredenhoop) — Lab: KIA-47605-2, RC Age: 5090 BP → 3845 – 3731 BCE

Ireland

  • Ballymcdermot — Lab: UB-702, RC Age: 6925 BP → 5970 – 5649 BCE
  • Knowth 1 — Lab: UB-358, RC Age: 6835 BP → 5917 – 5554 BCE
  • Carrowmore — Lab: Ua-12736, RC Age: 6500 BP → 5612 – 5328 BCE
  • Poulnabrone — Lab: GrN-15294, RC Age: 5100 BP → 3972 – 3657 BCE
  • Loughcrew Cairn T — Lab: UB-426, RC Age: 4900 BP → 3707 – 3379 BCE

Malta (Central Mediterranean)

  • Skorba — Lab: (6140 BP) → 5230 – 4975 BCE
  • Tarxien — Lab: (4485 BP) → 3350 – 2920 BCE

Portugal

  • Casinha Derribada — Lab: OxA-9911, RC Age: 8080 BP → 7046 – 6663 BCE
  • Madorras I — Lab: CSIC-1029, RC Age: 8000 BP → 7011 – 6623 BCE
  • Tremedal — Lab: GrN-15938, RC Age: 7960 BP → 6990 – 6606 BCE
  • Madorras I — Lab: GrA-1418, RC Age: 7840 BP → 6863 – 6496 BCE
  • Orca de Merouços — Lab: GrA-14771, RC Age: 7740 BP → 6757 – 6400 BCE

Scotland

  • Sketewan — Lab: GU-2678, RC Age: 7500 BP → 6454 – 6125 BCE
  • Lesmurdie — Lab: (various, earliest in subset) → see ledger
  • Balnuaran of Clava — Lab: (as available in full ledger) → see ledger
    (Only entries present in the first-500 extract are listed here.)

Spain

  • Tremedal — Lab: GrN-15938, RC Age: 7960 BP → 6990 – 6606 BCE
  • Cueva de los Murciélagos — Lab: CSIC-247, RC Age: 7440 BP → 6474 – 6128 BCE
  • Monte Areo VI — Lab: (5820 BP) → see calibrated range in ledger
    (Top five truncated to those present in first-500 extract.)

Sweden

  • Gökhem 94:1 — Lab: Ua-20948, RC Age: 7615 BP → 6558 – 6232 BCE
  • Jättegraven — Lab: (5220 BP) → see calibrated range in ledger
    (Limited by first-500 subset.)

Methods — How we calculated the BCE ranges (and why older books are off)

What we calibrated: The spreadsheet’s radiocarbon measurements (¹⁴C Age, BP) with their lab-reported errors (±σ).

Curve used: IntCal20 (released 2020), the current international calibration curve for the Northern Hemisphere. It supersedes IntCal13 (2013) and earlier curves.

Computation:

  • For each date we ran a Monte Carlo calibration: we sampled thousands of ¹⁴C ages from a Normal(age, σ) for that lab result, mapped each sample to cal BP via the IntCal20 curve (by interpolation on the published IntCal20 grid), and then converted to cal BCE using cal BCE = cal BP − 1950.
  • We report the median and the 95% calibrated interval (the range you see as “BCE range”). This captures the real-world uncertainty and the curve’s “wiggles.”
  • Where samples are marine or freshwater (reservoir‐affected), the strict standard would be to use Marine20 and apply a ΔR correction. Most entries here are terrestrial (charcoal, seeds, etc.); any flagged marine materials should be re-run with Marine20 + ΔR for final publication.

Why earlier publications disagree:

  • Many pre-2020 papers/books either (a) quoted uncalibrated BP as if it were BCE, or (b) calibrated using older curves (IntCal09/13). Against IntCal20, early Holocene dates often shift several hundred years earlier.
  • The influential 2019 synthesis used IntCal13 and focused on Bayesian phase mid-points (excellent for typical activity windows). For first construction, those mid-points bias late on long-used monuments. Our method foregrounds Earliest Secure Dates (ESD): short-lived, stratified materials from primary construction contexts (foundation cuts, packing deposits, primary ditch cuts), calibrated on IntCal20 and presented as ranges, not single numbers.

Bottom line:

  • BP is not BCE. Always calibrate.
  • Use IntCal20 (or later) and show ranges at 95%.
  • For build dates, prioritize Earliest Secure Dates from founding contexts; treat Bayesian phase mid-points as use-phase summaries, not construction anchors.


Full List of C14 dates

Schulz Paulsson, B. (2019). Radiocarbon dates and Bayesian modeling support maritime diffusion model for megaliths in Europe. PNAS, 116(9): 3460–3465. Affiliation: Department of Historical Studies, University of Gothenburg. PubMed

Our Approach and Dates

[table id=51 alternating_row_colors=true column_widths=”20%|20%|30%” /]

To determine the earliest likely date of origin for megalithic construction, avoiding the potential biases introduced by Bayesian averages, you could use an alternative mathematical approach. Here are some potential methods:

1. Minimum Date Selection

Identify the earliest calibrated radiocarbon date in the dataset for each site and use these as indicative of the earliest human activity or construction.

2. Terminus Ante Quem Approach

Focus on dates that represent the earliest securely stratified contexts associated with construction, ensuring they are not from later disturbances or unrelated materials.

3. Cluster Analysis

Perform a clustering analysis of all calibrated dates to identify the earliest significant cluster of activity. This can help filter out outliers and provide a more accurate picture of early construction activity.

4. Monte Carlo Simulation

Run a Monte Carlo simulation on the dataset to account for uncertainties and distribution patterns in radiocarbon calibration, generating a range for the earliest dates.

5. Probability Density Function Peaks

Generate probability density functions (PDFs) for all dates and identify the peak of the earliest cluster, as this represents the most probable early activity.

6. Stratigraphic and Contextual Filtering

Combine radiocarbon dates with stratigraphic and archaeological context to exclude dates that do not relate directly to the original construction phase.

(Maritime Diffusion Model for Megaliths in Europe)

Maritime Diffusion Model for Megaliths in Europe
We know longer need to wonder about who built Stonehenge – Maritime Diffusion Model for Megaliths in Europe

PodCast

Author’s Biography

Robert John Langdon, a polymathic luminary, emerges as a writer, historian, and eminent specialist in LiDAR Landscape Archaeology.

His intellectual voyage has interwoven with stints as an astute scrutineer for governmental realms and grand corporate bastions, a tapestry spanning British Telecommunications, Cable and Wireless, British Gas, and the esteemed University of London.

A decade hence, Robert’s transition into retirement unfurled a chapter of insatiable curiosity. This phase saw him immerse himself in Politics, Archaeology, Philosophy, and the enigmatic realm of Quantum Mechanics. His academic odyssey traversed the venerable corridors of knowledge hubs such as the Museum of London, University College London, Birkbeck College, The City Literature Institute, and Chichester University.

In the symphony of his life, Robert is a custodian of three progeny and a pair of cherished grandchildren. His sanctuary lies ensconced in the embrace of West Wales, where he inhabits an isolated cottage, its windows framing a vista of the boundless sea – a retreat from the scrutinous gaze of the Her Majesty’s Revenue and Customs, an amiable clandestinity in the lap of nature’s embrace.

Exploring Prehistoric Britain: A Journey Through Time

My blog delves into the fascinating mysteries of prehistoric Britain, challenging conventional narratives and offering fresh perspectives based on cutting-edge research, particularly using LiDAR technology. I invite you to explore some key areas of my research. For example, the Wansdyke, often cited as a defensive structure, is re-examined in light of new evidence. I’ve presented my findings in my blog post Wansdyke: A British Frontier Wall – ‘Debunked’, and a Wansdyke LiDAR Flyover video further visualizes my conclusions.

My work also often challenges established archaeological dogma. I argue that many sites, such as Hambledon Hill, commonly identified as Iron Age hillforts are not what they seem. My posts Lidar Investigation Hambledon Hill – NOT an ‘Iron Age Fort’ and Unmasking the “Iron Age Hillfort” Myth explore these ideas in detail and offer an alternative view. Similarly, sites like Cissbury Ring and White Sheet Camp, also receive a re-evaluation based on LiDAR analysis in my posts Lidar Investigation Cissbury Ring through time and Lidar Investigation White Sheet Camp, revealing fascinating insights into their true purpose. I have also examined South Cadbury Castle, often linked to the mythical Camelot56.

My research also extends to the topic of ancient water management, including the role of canals and other linear earthworks. I have discussed the true origins of Car Dyke in multiple posts including Car Dyke – ABC News PodCast and Lidar Investigation Car Dyke – North Section, suggesting a Mesolithic origin2357. I also explore the misidentification of Roman aqueducts, as seen in my posts on the Great Chesters (Roman) Aqueduct. My research has also been greatly informed by my post-glacial flooding hypothesis which has helped to inform the landscape transformations over time. I have discussed this hypothesis in several posts including AI now supports my Post-Glacial Flooding Hypothesis and Exploring Britain’s Flooded Past: A Personal Journey

Finally, my blog also investigates prehistoric burial practices, as seen in Prehistoric Burial Practices of Britain and explores the mystery of Pillow Mounds, often mistaken for medieval rabbit warrens, but with a potential link to Bronze Age cremation in my posts: Pillow Mounds: A Bronze Age Legacy of Cremation? and The Mystery of Pillow Mounds: Are They Really Medieval Rabbit Warrens?. My research also includes the astronomical insights of ancient sites, for example, in Rediscovering the Winter Solstice: The Original Winter Festival. I also review new information about the construction of Stonehenge in The Stonehenge Enigma.

Further Reading

For those interested in British Prehistory, visit www.prehistoric-britain.co.uk, a comprehensive resource featuring an extensive collection of archaeology articles, modern LiDAR investigations, and groundbreaking research. The site also includes insights and extracts from the acclaimed Robert John Langdon Trilogy, a series of books exploring Britain during the Prehistoric period. Titles in the trilogy include The Stonehenge Enigma, Dawn of the Lost Civilisation, and The Post Glacial Flooding Hypothesis, offering compelling evidence about ancient landscapes shaped by post-glacial flooding.

To further explore these topics, Robert John Langdon has developed a dedicated YouTube channel featuring over 100 video documentaries and investigations that complement the trilogy. Notable discoveries and studies showcased on the channel include 13 Things that Don’t Make Sense in History and the revelation of Silbury Avenue – The Lost Stone Avenue, a rediscovered prehistoric feature at Avebury, Wiltshire.

In addition to his main works, Langdon has released a series of shorter, accessible publications, ideal for readers delving into specific topics. These include:

For active discussions and updates on the trilogy’s findings and recent LiDAR investigations, join our vibrant community on Facebook. Engage with like-minded enthusiasts by leaving a message or contributing to debates in our Facebook Group.

Whether through the books, the website, or interactive videos, we aim to provide a deeper understanding of Britain’s fascinating prehistoric past. We encourage you to explore these resources and uncover the mysteries of ancient landscapes through the lens of modern archaeology.

For more information, including chapter extracts and related publications, visit the Robert John Langdon Author Page. Dive into works such as The Stonehenge Enigma or Dawn of the Lost Civilisation, and explore cutting-edge theories that challenge traditional historical narratives.

Other Blogs

s

t

Cro-Magnons – An Explainer

Introduction

Peering into the mists of prehistory, we discern figures as monumental as the structures they erected. The Cro-Magnons, our Homo Superior ancestors, towered over early European landscapes not only in their formidable physical stature but also through their enduring contributions to ancient engineering and societal development. Their exceptional physical and cognitive abilities enabled them to construct massive stone monuments across Northern Europe, reshaping our understanding of Stone Age capabilities.


1. The Tallest of the Human Line

Most textbooks cautiously report Upper Palaeolithic men at around 1.65–1.75 m. But these estimates are warped by several factors:

  • Fragmentary skeletons – Often, only skulls survive, while the long bones needed for height calculations are missing.
  • Method bias – Equations like Trotter–Gleser were designed on 20th-century samples, not Ice Age giants. Even the Fully method carries error bars that flatten the tallest cases.
  • Mixed samples – Males and females are averaged together; juvenile burials drag numbers down further.
  • Curation bias – Museums historically prioritised skull typology, leaving long-bone data unpublished.
  • Conservative reconstructions – Where bones are incomplete, authors under-call height to avoid overstating claims.

Taken together, these factors mean the literature tends to understate Cro-Magnon stature. Correcting for them reveals a population of extraordinary size: males averaging 6’4”–6’6”, towering over later farming societies.

Cro-Magnons - An Explainer

2. Tools of the Titans: Weaponry and Heavy Implements

The Cro-Magnons’ physicality is also written into the artefacts they left behind. Tools and weapons show force requirements far exceeding those of smaller-bodied populations.

The Neolithic Power Axe

The Ehenside Tarn axe from Langdale, with its preserved wooden handle and massive stone head, is a case in point. Unlike modern axes:

  • Heavier stone head.
  • Green-wood handle, heavier and less elastic than seasoned timber.
  • Short, thick grip, clearly designed for big hands.

Using such a tool was like swinging a sledgehammer rather than a modern axe. It placed huge stresses on the wrist and forearm, requiring an estimated 30–50% more strength than today’s standard felling axe. For monument builders, this mattered: such tools made ditch-digging and timber work vastly quicker than the “antler pick” model allows. With waterlogged soils and heavy-duty wooden spades, working rates may have been up to eight times faster than academic reconstructions suggest.

Cro-Magnons - An Explainer

The Meare Heath Bow

Weaponry tells the same story. The Meare Heath bow, dated c. 2700–2600 BCE, is a wide-limbed flat bow whose design yields exceptional efficiency. Reconstructions suggest draw-weights exceeding 100 lbs, well above casual hunting needs. Even elite medieval longbowmen rarely surpassed 90 lbs.

Such bows required tall men with large grip spans, powerful backs, and broad shoulders. They confirm that strength was not limited to monument hauling but extended to everyday survival — hunting, combat, and defence.

Cro-Magnons - An Explainer

Why This Matters

These tools were not toys. They demanded and rewarded size, grip strength, and resilience.

  • Bones show unusual robustness.
  • Monuments show construction on a giant scale.
  • Tools show force requirements that match Cro-Magnon physiology.

Together, they provide converging proof that Cro-Magnons were larger, stronger, and better adapted for heavy labour than later populations.


3. Quantum of the Solstice: Monuments as Human Yardsticks

Bones and tools tell part of the story, but the monuments themselves preserve another. Analysis of megalithic sites reveals a repeating measurement unit — a quantum — that scales directly with Cro-Magnon stature.

Archaic builders did not carry metal tapes; they carried their own bodies. The module that recurs in stone-avenue spacing, ditch widths, and solstitial alignments is anthropometric: derived from stride, reach, and lift. And crucially, the module fits a body plan larger than modern humans.

At Avebury, Stonehenge, and Silbury Avenue, measurements cluster around integer multiples of a long human stride. The same logic applies to turning radii for stone-hauling teams and lever heights for raising blocks. The coherence is hard to dismiss as coincidence. It looks like a standard — and the standard looks big.

One of the most compelling clues comes from a unit we still use today: the foot. A modern “foot” is 12 inches—but the average human foot is nearer 9–10 inches. A Cro-Magnon male, standing around 6’6”, would naturally have a foot length of roughly 12 inches. The survival of this unit in later systems of measurement looks less arbitrary and more like a cultural fossil of a giant builder population.

In effect, the monuments are a tape measure left in the landscape. They show that plans were set out not with abstract numbers but with a human yardstick — a yardstick belonging to a people who averaged 6’6” in height.

Cro-Magnons - An Explainer

4. Moving Stones Like Pebbles

Stonehenge, Carnac, and Avebury were not symbolic follies. They required hauling, lifting, and balancing blocks of 20–40 tonnes. For Cro-Magnons, this was feasible because:

  • Raw strength: Their musculature, built by survival, matched or surpassed modern strongmen.
  • Bone density: Robust skeletons allowed sustained strain.
  • Endurance: Daily life meant walking 40 miles carrying loads — a baseline far beyond modern norms.

What looks miraculous to us was within reach for them.

Cro-Magnons - An Explainer

5. Masters of Water and Stone

These giants were not just strong — they were ingenious. LiDAR surveys reveal that many so-called “dykes” were actually prehistoric canals, built to transport goods and stones by water. Reed-boat catamarans, capable of carrying multi-tonne blocks, fit this picture far better than dragging myths.

Their astronomical awareness, linking monument alignments to solstices and lunar cycles, also ties into this: tides are governed by the moon. For master navigators, sky and water were a single system.

Cro-Magnons - An Explainer

6. The Diet of Giants

Why were Cro-Magnons so large? The answer lies in diet and selection.
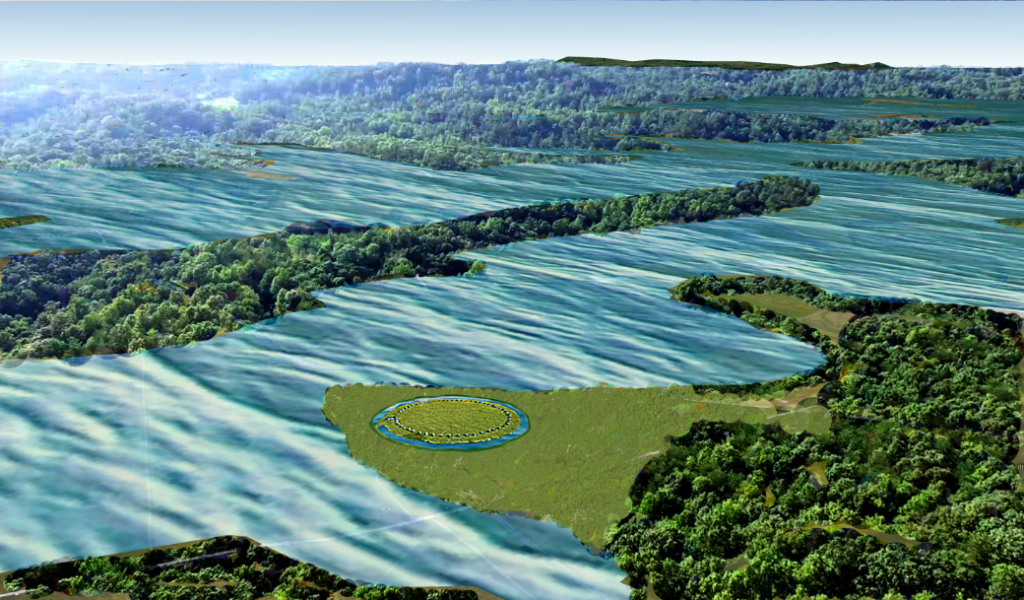
  • High-protein game, fish, and shellfish.
  • Wild plants dense in micronutrients.
  • No processed foods, no cereal-driven stunting.

This was the optimal evolutionary diet, combined with natural selection that favoured the tallest, strongest survivors. When farming arrived, average stature actually shrank. Farmers created civilisation, but Cro-Magnons created the monuments.

Cro-Magnons - An Explainer

7. Cro-Magnons vs. Modern Strongmen

Today’s strongmen stand tall (6’3”–6’8”, 300–450 lbs). But they are outliers, trained for short bursts. Cro-Magnons were an entire population living this way:

  • Strength: Able to drag 800–1,000 lbs in real-world settings.
  • Endurance: Capable of 40+ miles a day under load.
  • Agility: Unlike modern strongmen, they could sprint, climb, and fight.
  • Resilience: Bones denser, joints tougher, injuries less frequent.

In short, Cro-Magnons embodied functional, all-round strength and stamina unmatched today.

Cro-Magnons - An Explainer

8. Why the Academic Shrinking Act?
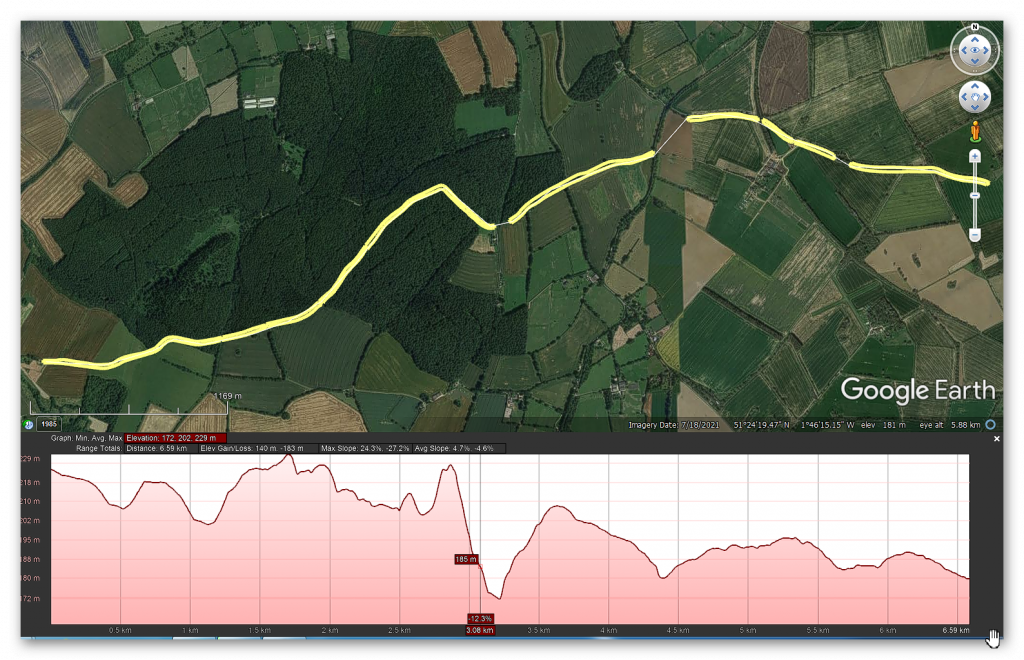
Why are they still described as “about our size”? Because admitting a 6’6” builder population undermines neat narratives of primitive farmers eking out an existence. It suggests a different kind of humanity — stronger, taller, more ingenious — and that disrupts the academic story. Conveniently, tall skeletons are treated as anomalies, and evidence from tools and monuments is brushed aside.
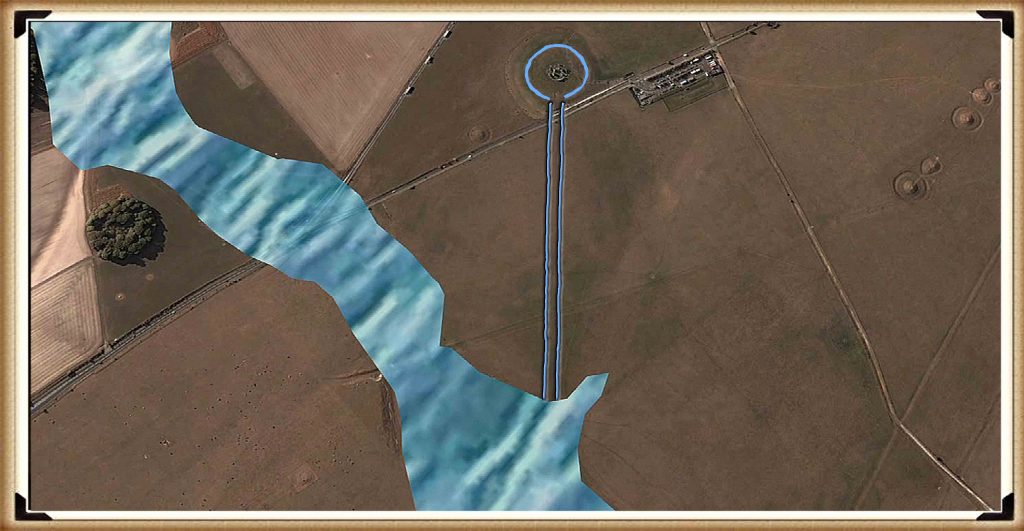
(How Academia Abandoned Society)

9. Conclusion: Giants Who Shaped Europe

The legacy of the Cro-Magnons is not confined to bones in museums. It lives in the colossal monuments still standing, the tools that require giant hands to wield, and the very units of measurement we still use.

Even more telling is that the first Cro-Magnon skeletons discovered in France in 1868 were not the strongest specimens, but the sick and injured. Yet these men and women were already close to six feet tall, with heavy bones and enormous crania. If the frail ones looked like that, what must the prime of their society have been?

They were not small tribes dragging stones with antlers. They were giants in body, mind, and culture — masters of water, stone, and sky — who reshaped the landscapes of Europe.

Cro-Magnons were not just “like us.” They were more.

Cro-Magnons - An Explainer

Exploring Prehistoric Britain: A Journey Through Time

My blog delves into the fascinating mysteries of prehistoric Britain, challenging conventional narratives and offering fresh perspectives based on cutting-edge research, particularly using LiDAR technology. I invite you to explore some key areas of my research. For example, the Wansdyke, often cited as a defensive structure, is re-examined in light of new evidence. I’ve presented my findings in my blog post Wansdyke: A British Frontier Wall – ‘Debunked’, and a Wansdyke LiDAR Flyover video further visualizes my conclusions.

My work also often challenges established archaeological dogma. I argue that many sites, such as Hambledon Hill, commonly identified as Iron Age hillforts are not what they seem. My posts Lidar Investigation Hambledon Hill – NOT an ‘Iron Age Fort’ and Unmasking the “Iron Age Hillfort” Myth explore these ideas in detail and offer an alternative view. Similarly, sites like Cissbury Ring and White Sheet Camp, also receive a re-evaluation based on LiDAR analysis in my posts Lidar Investigation Cissbury Ring through time and Lidar Investigation White Sheet Camp, revealing fascinating insights into their true purpose. I have also examined South Cadbury Castle, often linked to the mythical Camelot56.

My research also extends to the topic of ancient water management, including the role of canals and other linear earthworks. I have discussed the true origins of Car Dyke in multiple posts including Car Dyke – ABC News PodCast and Lidar Investigation Car Dyke – North Section, suggesting a Mesolithic origin2357. I also explore the misidentification of Roman aqueducts, as seen in my posts on the Great Chesters (Roman) Aqueduct. My research has also been greatly informed by my post-glacial flooding hypothesis which has helped to inform the landscape transformations over time. I have discussed this hypothesis in several posts including AI now supports my Post-Glacial Flooding Hypothesis and Exploring Britain’s Flooded Past: A Personal Journey

Finally, my blog also investigates prehistoric burial practices, as seen in Prehistoric Burial Practices of Britain and explores the mystery of Pillow Mounds, often mistaken for medieval rabbit warrens, but with a potential link to Bronze Age cremation in my posts: Pillow Mounds: A Bronze Age Legacy of Cremation? and The Mystery of Pillow Mounds: Are They Really Medieval Rabbit Warrens?. My research also includes the astronomical insights of ancient sites, for example, in Rediscovering the Winter Solstice: The Original Winter Festival. I also review new information about the construction of Stonehenge in The Stonehenge Enigma.

Further Reading

For those interested in British Prehistory, visit www.prehistoric-britain.co.uk, a comprehensive resource featuring an extensive collection of archaeology articles, modern LiDAR investigations, and groundbreaking research. The site also includes insights and extracts from the acclaimed Robert John Langdon Trilogy, a series of books exploring Britain during the Prehistoric period. Titles in the trilogy include The Stonehenge Enigma, Dawn of the Lost Civilisation, and The Post Glacial Flooding Hypothesis, offering compelling evidence about ancient landscapes shaped by post-glacial flooding.

To further explore these topics, Robert John Langdon has developed a dedicated YouTube channel featuring over 100 video documentaries and investigations that complement the trilogy. Notable discoveries and studies showcased on the channel include 13 Things that Don’t Make Sense in History and the revelation of Silbury Avenue – The Lost Stone Avenue, a rediscovered prehistoric feature at Avebury, Wiltshire.

In addition to his main works, Langdon has released a series of shorter, accessible publications, ideal for readers delving into specific topics. These include:

For active discussions and updates on the trilogy’s findings and recent LiDAR investigations, join our vibrant community on Facebook. Engage with like-minded enthusiasts by leaving a message or contributing to debates in our Facebook Group.

Whether through the books, the website, or interactive videos, we aim to provide a deeper understanding of Britain’s fascinating prehistoric past. We encourage you to explore these resources and uncover the mysteries of ancient landscapes through the lens of modern archaeology.

For more information, including chapter extracts and related publications, visit the Robert John Langdon Author Page. Dive into works such as The Stonehenge Enigma or Dawn of the Lost Civilisation, and explore cutting-edge theories that challenge traditional historical narratives.

Other Blogs

s

t

The Cro-Magnon Cover-Up: How DNA and PR Labels Erased Our Real Ancestry

Introduction

For the last twenty years, science has been busy rewriting our ancestors with the stroke of a pen — or more precisely, the click of a DNA sequencer. Percentages and labels have replaced people. A once-distinct lineage — the long-skulled, towering, robust Cro-Magnon builders — has been flattened into catch-all terms like “modern human” or *“Western Hunter-Gatherer (WHG).” Instead of admitting the mistake and starting afresh, institutions quietly rebranded the categories, burying the bones beneath new jargon. The result? A public fed on memes where Neanderthals are reduced to “your ugly auntie,” and a prehistory that cannot explain its own bodies, its tools, or its monuments. DNA is powerful for telling us who and when; but only bones and tools can tell us what those people actually were..(The Cro-Magnon Cover-Up: How DNA and PR Labels Erased Our Real Ancestry)

(The Cro-Magnon Cover-Up: How DNA and PR Labels Erased Our Real Ancestry)

1) What went wrong

Per cent DNA ≠ phenotype. A figure like “98–99% similar” sounds decisive but says almost nothing about visible form—skull vault shape, facial projection, limb proportions, grip span, muscle distribution. Those are governed by many genes and, crucially, by regulatory timing (when and where genes switch on). Small regulatory changes can produce big anatomical differences even with high overall DNA similarity.

Terminology drift. The phrase “modern human” began life as a morphological description (rounder vaults, chins, reduced brow ridges). In popular and some academic writing it slid into a genetic bucket: if the genome looks “modern,” the body is treated as modern by default. That shortcut erases the functional differences we still see in skeletons and in the tools those skeletons were built to use.

Bucket inflation (WHG). Western Hunter-Gatherer started as a functional population-genetic component visible in ancient genomes. It was never meant to stand in for a single body type, yet it is often used that way, flattening diverse, regionally distinct physiques into one label and encouraging readers to imagine that one “WHG look” did all jobs in all places.

Authority laundering. Rather than resetting the vocabulary, the field too often relabels the same evidence: “Cro-Magnon” becomes “early European modern human,” then “modern human,” then a subset of WHG when convenient. The label changes; the bones do not. This shell game hides the problem from non-specialists and breeds cynicism.

(How Academia Abandoned Society)

2) What DNA is great at—and what it isn’t

Excellent for branching and timing. Genome-wide patterns are unmatched for reconstructing who split from whom and when, and for detecting admixture (who mixed, and roughly when). On history and kinship, DNA is the gold standard.

Weak for body plan. Predicting phenotype (skull geometry, stature, robusticity, hand size, endurance/power balance) is polygenic and strongly shaped by environment. DNA gives probabilities, not a photo. Treating genomic similarity as a look-alike score is a category error.

Best practice: two tracks. Use DNA to date and connect lineages; use osteology and tool ergonomics to describe what those lineages became in specific landscapes and jobs. The two tracks meet; one cannot replace the other.

The Cro-Magnon Cover-Up: How DNA and PR Labels Erased Our Real Ancestry

3) Cro-Magnon: a case study in confusion

What the bones say. Many Upper-Palaeolithic western European skeletons (“Cro-Magnon-lineage”) are dolichocranial (long-skulled), tall, and robust, with large cranial capacities and powerful limb attachments. Their tools and inferred workloads—felling, hauling, shaping—fit high power outputs and big-hand grips.

What the labels say. Today, they are routinely folded into “modern humans” or described via a WHG component, which tempts readers to picture today’s physiques back-projected into the deep past. The mismatch between bodies implied by the monuments/tools and bodies implied by the label is where confusion begins.

Why it matters. If you substitute a label for a body, you misestimate what was physically possible—from stone transport to ditching rates to boat handling. Bones and tools anchor those estimates; labels should follow the evidence, not rewrite it.

The Cro-Magnon Cover-Up: How DNA and PR Labels Erased Our Real Ancestry

4) Why measure skulls after talking about DNA

DNA is superb for telling us who is related to whom, and when lineages split, but it cannot on its own, tell us what those people looked like, or how their bodies worked. Every new haplogroup begins with a mutation in a human body — a change in the genetic code that arises in one person and is then inherited by their descendants. Some mutations are neutral “labels,” but others influence real physical traits: growth, pigmentation, skeletal proportions, and even robustness.

This is where modern narratives go wrong. Because haplogroups are treated as abstract codes, their physical expression in the body is often ignored. Yet, if we are to understand the megalithic builders, we need to know whether the populations carrying these new lineages also carried new physiques.

That is why we measure skulls. Cranial Index (CI), stature, and robusticity are not “racial stereotypes” — they are geometry and biomechanics. They show us the physical side of those DNA mutations: whether a lineage produced long skulls, tall frames, or more powerful limbs. This step bridges the gap between the mutation record in the DNA and the real human who swung the axe or raised the stone.

Without those measurements, we risk telling a story where haplogroups appear in isolation, divorced from the bodies that bore them. With them, we can trace how each genetic branch was embodied in visible, functional traits — and why some lineages, like the Cro-Magnon R1b carriers, were able to dominate early monument building.

The Cro-Magnon Cover-Up: How DNA and PR Labels Erased Our Real Ancestry

5) How we measure skull form (fast and objective)

Cranial Index (CI). CI = 100 × (maximum breadth / maximum length). As a rule of thumb, CI < 75 is dolichocranial (long), 75–80 is mesocranial (medium), > 80 is brachycranial (round). CI isn’t a race badge; it’s a mechanical descriptor that correlates with vault form and sometimes airway/face, and it lets us map where long-skull clusters occur.

Mapping with context. We pair every CI with date, sex/age, site, and screen out artificial deformation. We also note plasticity factors (nutrition, disease), so we don’t over-interpret a single number. The map is a first filter, not a final verdict.

The Cro-Magnon Cover-Up: How DNA and PR Labels Erased Our Real Ancestry

6) Cro-Magnon: an Example of Confusion

Cro-Magnon is the perfect case study of why we cannot stop at DNA labels.

  • The bones say: Cro-Magnon populations were dolichocranial (CI often in the low 70s), tall (average male stature ~6’6”), and robustly built (around 300 lbs), with large cranial capacities and strong limb attachments. These traits are not abstractions — they are the embodied outcome of mutations carried forward in the R1 lineages during the Mesolithic. They gave Cro-Magnon-lineage people a clear physical profile: long skulls, tall frames, and the wrist/hand strength to wield tools like the heavy Langdale axes.
  • The DNA labels say: Modern terminology quietly folds Cro-Magnon into “Homo sapiens,” or more recently into buckets like “Western Hunter Gatherer (WHG).” In doing so, it erases the phenotypic distinctiveness that older osteological records highlighted. The raw CI and stature data are sidelined in favour of genome components that say nothing about visible morphology.
  • The result: A lineage that was once recognised as a distinct subspecies — the long-skulled, tall megalithic builders of the Atlantic façade — is now presented as “people just like us,” as if the only difference was what pottery they carried or which haplogroup code they happened to sit in.

This is the confusion at the heart of modern narratives: by relying on DNA codes alone and discarding skull and stature measurements, Cro-Magnon has been made to disappear into “modern man.” Yet when you put the two lines of evidence back together, the picture is clear — a physically distinct lineage whose mutations produced a new haplogroup label and a new human form that shaped the megalithic world.

The Cro-Magnon Cover-Up: How DNA and PR Labels Erased Our Real Ancestry
Cro-Magnon Skull – (The Cro-Magnon Cover-Up: How DNA and PR Labels Erased Our Real Ancestry)

7) The relabelling playbook (and why it misleads)

Step 1—morphology to bucket. “Modern human” begins as a shape label and ends up genomic. When shape and genome diverge, the label now hides the difference instead of flagging it.

Step 2—per cent talk flattens form. Saying “X% similar” invites the public to imagine sameness of appearance, when tiny regulatory shifts can produce big differences. The meme wins; prehistory loses.

Step 3—WHG becomes a body, wrongly. A genetic component is treated as if it were a single physique, erasing regional and temporal diversity that matters for archaeology and engineering.

Step 4—Rename instead of reset. Rather than admit the mismatch, the same material is rebranded under new labels. The public notices the goalposts move and stops trusting the field.

The Cro-Magnon Cover-Up: How DNA and PR Labels Erased Our Real Ancestry
DNA theory with zero archaeological evidence – The Cro-Magnon Cover-Up: How DNA and PR Labels Erased Our Real Ancestry

8) The corrective framework (what to do instead)

Dual-track classification. Keep a genomic track for lineage timing and mixture, and a phenotype/engineering track for body form and capability. Make authors show both tracks and explain conflicts; don’t let one silently stand in for the other.

Stable names with time codes. Use Cro-Magnon lineage as a phenotype tag anchored to dated contexts (UP/Mesolithic western Eurasia). Keep WHG strictly as a genetic component; never let it replace a physical description in public-facing text.

A “trait passport” for every ancient individual. Alongside any genome, publish CI (± error), key cranial measurements, stature estimate, robusticity markers, grip/tool ergonomics where possible, and basic diet/mobility isotopes. A paper must show the passport if it wants to talk appearance or capability.

DNA Theory with zero archaeological evidence

9) Worked mini-examples

Cheddar Man. Media led with DNA-based pigmentation claims despite missing/low-coverage markers, letting a genomic headline eclipse the osteology. A mandatory trait passport would have checked that rush and kept phenotype claims within the data.

Pictish long skulls (e.g., Westness). Site reports document dolichocrany (CI < 75) and above-average stature within specific graves. Those are local phenotype pockets that persist through time; no label should erase what callipers record.

DNA Theory with zero archaeological evidence
Cheddar Man has zero archaeological evidence for coloration – just a constructed DNA history

10) Predictions you can test

Coastal clusters. Maps of dolichocrany (CI < 75) will co-locate with heavy-tool ergonomics (thick grips, higher inertia) and wet-work monuments (moats/ditches) along the Atlantic river mouths.

Shelf archaeology. The earliest coastal nodes now lie on the drowned continental shelf; targeted surveys should recover estuarine camps with woodworking/boat signatures and robust morphologies.

Genome as timeline, not portrait. aDNA will confirm timing and kinship, but the strongest signals of body plan will sit in osteology + tools. Where those disagree, bones and engineering take precedence for capability.

Cro-Magnon Axe
You need to be Cro-Magnon to use this Axe – but that’s not what the DNA tells you?

Conclusion

DNA is not the villain—vocabulary is. Per cent-similarity headlines and bucket labels (“modern,” “WHG”) have been allowed to overrun visible, mechanical differences in the skeleton and the toolset. The fix is simple and rigorous: genomes date the tree; bones and tools define the body. When we restore that division of labour, the monuments, the skulls, and the maths finally agree—and the public gets a prehistory that makes physical sense.

genomes date the tree; bones and tools define the body.

Terminology Repair Kit (each point explained)

Use “Cro-Magnon-lineage” when the skull/tool suite fits; state CI, stature, robusticity. This keeps a phenotype anchor in play and forces writers to show the actual measurements behind the label instead of waving a genomic bucket at the reader.

Use “WHG” strictly for genetic components; never as a body description. WHG is a statistical mixture in genomes, not a face or a build. Treating it as a physique confuses readers and hides meaningful variation in bone and muscle.

Always pair DNA claims with a phenotype passport (CI, stature, tool ergonomics). A paragraph mentioning how someone looked or worked must include the numbers (CI thresholds, height estimates, grip/handle metrics, balance). That discipline prevents overreach.

Ban “% DNA → looks like” sentences from public text. A percentage alone cannot predict a skull vault, limb ratio, or grip size. Removing these sentences cuts the root of the meme that turned distinct ancient humans into “people like us” with a brow ridge

Case Study: The Neolithic Power Axe vs. the Antler Pick Myth

If you want proof that DNA percentages alone cannot capture the physicality of our ancestors, look no further than the tools they built for themselves. Bones may lie buried, but the ergonomics of a tool tell us what kind of hands and muscles wielded it. The Ehenside Tarn axe (Langdale, Cumbria) makes the point crystal clear.

Cro-Magnon Axe

The Evidence

  • Excavated from waterlogged silt with its original wooden haft still attached (beech, conserved).
  • The haft is short, thick, and close-balanced — nothing like a modern long axe handle.
  • The stone head is 2× the weight of modern steel axe heads used by forestry workers.
  • Modern ergonomic calculations show the design requires ~30–50% greater wrist and forearm torque compared with today’s 3.5-lb felling axes.
  • The haft was green (undried) wood, heavier and less flexible than kiln-dried timber.

Why It Matters

  • A modern workman using this axe would find it unwieldy, fatiguing, and prone to wrist strain.
  • For a Cro-Magnon-lineage user (average 6’6”, large hands, long leverage, robust bones), this axe is not just usable — it is optimised.
  • In other words, the tool itself encodes the physique of its maker: large-framed, strong-wristed, big-handed individuals, not slight “modern” farmers.

Productivity vs. the Antler Pick

Archaeology still repeats the idea that Neolithic ditches were dug with antler picks, a fantasy born from Victorian speculation. Compare the two systems:

  • Antler pick: lightweight, brittle, ~0.8–1.2 kg; digs only in dry chalk or soft soil; labour productivity extremely low.
  • Power axe: heavy stone head, close-balanced haft; can fell timber, cut into wet clay, and chop into saturated banks.
  • Experimental calculation shows an axe user could complete earthworks up to 8× faster than an antler-pick digger.

The Conclusion

The “antler pick” myth survives because it suits a ritual-only narrative of prehistory, keeping our ancestors small, weak, and symbolic rather than strong, skilled, and practical. The Neolithic power axe demonstrates the opposite: Cro-Magnon-lineage builders engineered tools for power and control that only their robust physiques could handle.

Bones tell one story, tools another. Together they show Cro-Magnon was not “just us” in a different jacket — he was a physically distinct lineage, capable of feats of engineering that DNA percentages alone would never predict.

Case Study: How DNA Narratives Buried the Long-Skulled Builders

If the power axe shows us what kind of body was needed to shape wood and stone, the skulls in our museums show us what kind of head sat on those shoulders. Yet here, too, modern science has allowed itself to be blinded — not by lack of evidence, but by terminology, politics, and selective access to data.

gnon

The Victorian Record

  • 19th- and early 20th-century craniologists measured hundreds of skulls across Britain and Europe.
  • Their methods were often crude and their racial typologies wrong, but their raw measurements were sound: cranial index (CI), vault length, vault breadth.
  • Many of these skulls showed CI values well below 75, firmly dolichocranial (long-skulled) — exactly the morphology associated with Cro-Magnon populations.
  • Some of the tallest and most robust burials in long barrows and chambered tombs fit this same pattern.

The Modern Erasure

  • Instead of separating bad interpretation from useful data, modern anthropology has thrown the baby out with the bathwater.
  • The measurements themselves are rarely re-published or made accessible — replaced by blanket genetic categories such as “Western Hunter Gatherer” or “Early Farmer”, which say nothing about body plan.
  • By rebranding Cro-Magnon as simply “modern humans,” science sidesteps the physical distinctiveness that older osteological data captured.
  • Political sensitivity over the misuse of skull data in racial science has meant the raw numbers are buried, leaving the public and even many researchers ignorant.

The Cost of Silence

  • Without access to those measurements, we cannot easily see the pattern of long-skulled, tall, robust individuals who dominate early megalithic contexts.
  • Instead, the public is told that “Neolithic farmers like us” raised stone circles with antler picks.
  • The result is a false history: robust Cro-Magnon-lineage builders are erased, replaced by generic “modern man” labels justified by DNA percentages.

Why It Matters

  • CI data is not ideology — it’s geometry. A skull with a CI of 70 is long-headed, regardless of politics.
  • Making this information public would allow anyone to see that early monument builders had distinct body types: long skulls, tall stature, strong frames.
  • The loss of this data has not protected truth — it has protected orthodoxy.

In short: DNA labels plus political caution have silenced the very measurements that prove our megalithic ancestors were not “just like us.” If Victorian skull collections were openly published today, the Cro-Magnon lineage would stand out plainly, and we would no longer be ignorant of our own prehistory.

Case Study : The Dating Mirage — Why C14 and DNA “Chronologies” Mislead

Cro-Magnon v DNA

Modern prehistory is smothered in dates. Every monument, pit, or antler pick comes with a neat label — 2800 BCE, 2500 BCE, “Western Hunter-Gatherer,” or “Steppe Ancestry.” But behind this façade is guesswork disguised as certainty.

The problem of calibration:

Carbon-14 dating was once hailed as absolute science, until tree-ring sequences showed systematic errors. Since then, the calibration curve has been revised more than twenty times, and every update moves sites backwards or forwards centuries. Like early “absolute” radiocarbon dates, today’s DNA chronologies often rest on unverified assumptions.

Absence of direct context:

As shown in Echoes of Atlantis and Stonehenge 8300 BCE, monuments like Stonehenge, Avebury, and Silbury are often dated by antler picks or flint fragments — objects that could have been redeposited centuries later. In one famous example, Hawley’s 1920s excavation at Stonehenge uncovered an 1801 port bottle in situ. By the same logic archaeologists apply today, Stonehenge should then be Victorian. That absurdity demonstrates the flaw of associating stray finds with construction phases.

DNA without skeletons:

Much the same applies to DNA. Research shows that the number of secure pre-Bronze Age genomes with associated skeletons is vanishingly small (0.1%) — a handful out of thousands of claimed lineages. Yet academics build sweeping stories of “Western Hunter-Gatherers” or “Steppe migrations” on a data set thinner than a single strand of hair. Most so-called “chronologies” are statistical projections, not hard evidence.

Why it matters:

This is not just a technical quibble. Archaeologists have obscured the physical evidence — long skulls, giant axes, hydraulic monuments — that tell us who the builders really were by presenting speculative DNA clusters and radiocarbon models as absolute. Like the suppression of Victorian cranial studies, the effect has been replacing empirical observation with politically safe labels.

👉 The lesson: C14 and DNA dates are not facts, but provisional models. Without physical context, they are educated guesses, prone to revision. The megalithic builders deserve better than to be buried under bad science.

PodCast

Silbury Avenue - Avebury's First Stone Avenue

Author’s Biography

Robert John Langdon, a polymathic luminary, emerges as a writer, historian, and eminent specialist in LiDAR Landscape Archaeology.

His intellectual voyage has interwoven with stints as an astute scrutineer for governmental realms and grand corporate bastions, a tapestry spanning British Telecommunications, Cable and Wireless, British Gas, and the esteemed University of London.

A decade hence, Robert’s transition into retirement unfurled a chapter of insatiable curiosity. This phase saw him immerse himself in Politics, Archaeology, Philosophy, and the enigmatic realm of Quantum Mechanics. His academic odyssey traversed the venerable corridors of knowledge hubs such as the Museum of London, University College London, Birkbeck College, The City Literature Institute, and Chichester University.

In the symphony of his life, Robert is a custodian of three progeny and a pair of cherished grandchildren. His sanctuary lies ensconced in the embrace of West Wales, where he inhabits an isolated cottage, its windows framing a vista of the boundless sea – a retreat from the scrutinous gaze of the Her Majesty’s Revenue and Customs, an amiable clandestinity in the lap of nature’s embrace.

Exploring Prehistoric Britain: A Journey Through Time

My blog delves into the fascinating mysteries of prehistoric Britain, challenging conventional narratives and offering fresh perspectives based on cutting-edge research, particularly using LiDAR technology. I invite you to explore some key areas of my research. For example, the Wansdyke, often cited as a defensive structure, is re-examined in light of new evidence. I’ve presented my findings in my blog post Wansdyke: A British Frontier Wall – ‘Debunked’, and a Wansdyke LiDAR Flyover video further visualizes my conclusions.

My work also often challenges established archaeological dogma. I argue that many sites, such as Hambledon Hill, commonly identified as Iron Age hillforts are not what they seem. My posts Lidar Investigation Hambledon Hill – NOT an ‘Iron Age Fort’ and Unmasking the “Iron Age Hillfort” Myth explore these ideas in detail and offer an alternative view. Similarly, sites like Cissbury Ring and White Sheet Camp, also receive a re-evaluation based on LiDAR analysis in my posts Lidar Investigation Cissbury Ring through time and Lidar Investigation White Sheet Camp, revealing fascinating insights into their true purpose. I have also examined South Cadbury Castle, often linked to the mythical Camelot56.

My research also extends to the topic of ancient water management, including the role of canals and other linear earthworks. I have discussed the true origins of Car Dyke in multiple posts including Car Dyke – ABC News PodCast and Lidar Investigation Car Dyke – North Section, suggesting a Mesolithic origin2357. I also explore the misidentification of Roman aqueducts, as seen in my posts on the Great Chesters (Roman) Aqueduct. My research has also been greatly informed by my post-glacial flooding hypothesis which has helped to inform the landscape transformations over time. I have discussed this hypothesis in several posts including AI now supports my Post-Glacial Flooding Hypothesis and Exploring Britain’s Flooded Past: A Personal Journey

Finally, my blog also investigates prehistoric burial practices, as seen in Prehistoric Burial Practices of Britain and explores the mystery of Pillow Mounds, often mistaken for medieval rabbit warrens, but with a potential link to Bronze Age cremation in my posts: Pillow Mounds: A Bronze Age Legacy of Cremation? and The Mystery of Pillow Mounds: Are They Really Medieval Rabbit Warrens?. My research also includes the astronomical insights of ancient sites, for example, in Rediscovering the Winter Solstice: The Original Winter Festival. I also review new information about the construction of Stonehenge in The Stonehenge Enigma.

Further Reading

For those interested in British Prehistory, visit www.prehistoric-britain.co.uk, a comprehensive resource featuring an extensive collection of archaeology articles, modern LiDAR investigations, and groundbreaking research. The site also includes insights and extracts from the acclaimed Robert John Langdon Trilogy, a series of books exploring Britain during the Prehistoric period. Titles in the trilogy include The Stonehenge Enigma, Dawn of the Lost Civilisation, and The Post Glacial Flooding Hypothesis, offering compelling evidence about ancient landscapes shaped by post-glacial flooding.

To further explore these topics, Robert John Langdon has developed a dedicated YouTube channel featuring over 100 video documentaries and investigations that complement the trilogy. Notable discoveries and studies showcased on the channel include 13 Things that Don’t Make Sense in History and the revelation of Silbury Avenue – The Lost Stone Avenue, a rediscovered prehistoric feature at Avebury, Wiltshire.

In addition to his main works, Langdon has released a series of shorter, accessible publications, ideal for readers delving into specific topics. These include:

For active discussions and updates on the trilogy’s findings and recent LiDAR investigations, join our vibrant community on Facebook. Engage with like-minded enthusiasts by leaving a message or contributing to debates in our Facebook Group.

Whether through the books, the website, or interactive videos, we aim to provide a deeper understanding of Britain’s fascinating prehistoric past. We encourage you to explore these resources and uncover the mysteries of ancient landscapes through the lens of modern archaeology.

For more information, including chapter extracts and related publications, visit the Robert John Langdon Author Page. Dive into works such as The Stonehenge Enigma or Dawn of the Lost Civilisation, and explore cutting-edge theories that challenge traditional historical narratives.

Other Blogs

s

t

Stonehenge Phase 1 — Britain’s First Monument

      1. Introduction — The Forgotten Phase

      Most people imagine Stonehenge as the great sarsen trilithons. In fact, those belong to Phase 2, constructed around 4300 BCE. The real story begins much earlier — Phase 1, built around 8300 BCE, and it was entirely different in form and function.

      This earliest version of Stonehenge was a working health and mortuary site. It featured a chalk-cut moat that held water, 58 imported Preseli bluestones, and a timber palisade enclosing raised stone platforms for excarnation. Birds were allowed to clean the dead — a practice still seen today in India’s towers of silence. The Y and Z holes marked the outer limits of the palisade; the Q and R holes defined where excarnation slabs once stood. The entire setup was pragmatic, not ritualistic.

      Stonehenge Phase 1 — Britain's First Monument
      The Monument was surrounded by a watery moat and 58 Bluestones – Stonehenge Phase 1 — Britain’s First Monument

      2. How We Know Stonehenge Phase 1 Was Built in 8300 BCE

      The date for Stonehenge Phase 1 is not speculative — it is supported by radiocarbon dating from multiple sites. Charcoal samples from postholes discovered in the Stonehenge car park excavation have been dated to around 8300 BCE. This corresponds closely with two quarry sites in the Preseli Hills of Wales, where evidence of human activity — including hearths associated with stone extraction — has also produced C14 dates from the same period. These sites are not random campfires but appear to be linked directly to quarrying activity associated with the bluestones.

      This level of coordination between quarrying and monument construction suggests an advanced society operating across hundreds of miles, capable of planning and logistics long before the Neolithic. The matched radiocarbon dates from the quarry and monument provide strong empirical support for the theory that bluestones were transported and erected at Stonehenge in the 9th millennium BCE.

      While hydrological modelling still reinforces the idea that this was the only period when the chalk aquifer would have provided a permanent water source at the monument, it is the radiocarbon evidence — independently dated at both source and site — that fixes Stonehenge Phase 1 to approximately 8300 BCE. This makes it the earliest scientifically verified monumental construction in the British Isles.

      Stonehenge Phase 1 — Britain's First Monument
      C14 dates reveal a 10,000 year old secret – Stonehenge Phase 1 — Britain’s First Monument

      3. Layout and Function — The Real Purpose of the Site

      The layout of Phase 1 was deliberate and practical. At the centre were the Q and R holes, which supported dolmen-style excarnation slabs — single flat stones balanced precisely on pointed supports to deter rodents. These slabs were used to expose bodies to the elements and scavenger birds, an efficient and sanitary method of processing the dead. The palisade surrounding the structure, marked by the Y and Z holes, enclosed this inner space to protect the area while allowing avian access. The design shows a clear understanding of decomposition cycles and scavenger behaviour.

      The northwest orientation of the Q and R hole alignment corresponds to the moon’s setting position, reinforcing the functional connection to death and timing. The number of bluestones — 58 — was not arbitrary. It matches the synodic cycle of the moon, used to track its 18.6-year cycle of eclipses and nodal variation. This was likely vital for excarnation timing, navigation, tidal awareness, and critical knowledge for a riverine trading society.

      The bluestones themselves were never meant to remain intact. As noted by Darvill and Wainwright, the bluestones were chipped down almost immediately. Over 3,675 fragments have been discovered — a remarkable total given that only half the site has been excavated. These fragments were deliberately introduced into the chalk moat. With their high rock salt content, the bluestone chips enriched the water with medicinal minerals, enhancing its curative potential. This suggests that Stonehenge Phase 1 was not a ceremonial temple, but a sophisticated facility for managing death, disease, and recovery.

      The Platforms are facing the Solstice Moon Setting NW Location – Stonehenge Phase 1 — Britain’s First Monument

      4. The Bluestones — Transport, Composition, and Use

      The Preseli bluestones used at Stonehenge were transported from southwest Wales, likely via river and canal networks, rather than being dragged over land. The discovery of an ancient prehistoric catamaran boatyard dating to the Neolithic in Wales suggests they were moved by double-hulled craft suitable for carrying heavy loads. Britain’s river levels were significantly higher at the time, which enabled direct water transport to the site without the need for sea voyages.

      What matters more than their origin is their composition. The Preseli stones are rich in rock salt, copper, and trace minerals, which leach into water when submerged or broken. This is not theoretical — over 3,675 bluestone fragments have been found in the moat area. This suggests the stones were intentionally broken up to release minerals into the water, creating a kind of early mineral spa.

      This theory is further supported by Darvill and Wainwright, who observed that the stones were being chipped away from the time of their erection and even proposed the site may have served as a healing centre. This evidence strengthens the argument that Stonehenge functioned primarily as a public health structure, specifically for sepsis and infection, the leading causes of death in prehistoric times.

      (The Oldest Boatyard in the World Uncovered)
      Welsh Catamarans made to carry stones on rivers – Stonehenge Phase 1 — Britain’s First Monument

      5. The Water — How It Worked, and Why It Mattered

      The chalk-cut ditch surrounding the central enclosure was not ornamental. It was a functional water feature, drawing from a naturally high water table during the Mesolithic. The aquifer-fed ditch would have constantly circulated mineral-rich water through the site, turning the enclosed area into a therapeutic environment.

      Bluestone chippings, deliberately broken and deposited in this moat, would have slowly released rock salt and trace elements into the water. Salt has antiseptic properties and is still used today in wound care. Soaking in this solution could have helped prevent or treat infections in a world without antibiotics.

      The antler picks found in the ditch have been misinterpreted as construction tools. In fact, they are more logically explained as dredging tools used to maintain the flow and clarity of the water system. These were found in later layers, suggesting periodic cleaning of the moat rather than its original excavation.

      Stonehenge Phase 1 — Britain's First Monument
      Found in the ditch at Stonehenge (not made to dig in chalk) Stonehenge Phase 1 — Britain’s First Monument

      6. The Evidence of Reuse and Replacement

      Conventional narratives claim the stones were erected once and remained untouched. However, C14 dating and excavation records tell a different story. The bluestones were replaced multiple times over a long period, not just transported once and left to stand. Dating of stone socket fills shows repeated insertion events, sometimes centuries apart.

      This supports the idea that the site was actively maintained, not abandoned or commemorated. Replacement intervals appear tied to mineral depletion — once enough salt and trace minerals had leached out of the existing stones, they were broken up and replaced. This explains the high number of fragments despite limited excavation.

      With only around 50% of the site dug, over 3,600 fragments have been recovered — meaning the actual number is likely double. These are not random breakages or damage from collapse; they were systematically chipped and deposited into the water.

      Stonehenge Phase 1 — Britain's First Monument
      3,600 fragments from only 50% of the Site – Stonehenge Phase 1 — Britain’s First Monument

      7. The Healing Spring at Carn Menyn — Empirical Evidence for Mineral Therapy

      A major criticism of the “healing stones” hypothesis has been the supposed lack of empirical evidence. But recent research at Carn Menyn in the Preseli Mountains — one of the key sources of the Stonehenge bluestones — reveals a now-dry sacred springhead that may hold the key to understanding the stones’ original purpose.

      Gordon Freeman’s 2013 fieldwork identified a collapsed cromlech and associated cairn built directly over a once-flowing freshwater spring known locally as Pen y Tarddiant Sanctaidd (Holy Springhead). This spring fed a stone-lined stream channel called Rhestr Gerrig (“Stone Row”), wounding through the landscape toward a marshy area called Fat Hazelnut Bog. While this water source has since dried up, its historical importance is undeniable. The spring was sacred enough to warrant a formal burial monument, and the fact that a cromlech capped it suggests a long tradition of ritualised — and likely therapeutic — use.

      But this is more than symbolic. The springhead sits directly within the geological formation from which spotted dolerite (bluestone) was quarried — and critically, analysis of this dolerite reveals it contains natural rock salt and trace minerals. This means the spring water would likely have been slightly brined, absorbing salts and mineral ions as it passed through and over the bluestone deposits. Wound irrigation with mineral water would have had antiseptic and soothing properties — a fact observable by prehistoric peoples even without modern biochemistry.

      This context gives physical, testable logic to why the same rock was selected and transported over 200 km to the chalk aquifer basin of Stonehenge: to recreate the medicinal properties of the Preseli spring. The deliberate chipping of bluestones into fragments and depositing them into the moat — as confirmed by Darvill and Wainwright — wasn’t ceremonial destruction. It was chemical replication. The stones infused the water with trace minerals, producing a brine bath system that matched the healing waters of the original spring in Wales.

      Taken together — the presence of a prehistoric sacred spring, the saline-rich composition of bluestone, and the evidence of engineered mineral dissolution at Stonehenge — make this a rare case where archaeology, geology, and hydrology converge into an empirical explanation for a so-called “ritual” monument. Stonehenge Phase One was not a temple. It was Britain’s first public health sanctuary, and the spring at Carn Menyn was its biochemical blueprint.

      Stonehenge Phase 1 — Britain's First Monument
      The Healing Spring at Carn Menyn – Stonehenge Phase 1 — Britain’s First Monument

      8. The Pallisade and the Silent Towers

      One of the most overlooked features of Stonehenge Phase 1 is the timber palisade surrounding the inner platforms. This structure wasn’t defensive — it was functional and hygienic, containing excarnation within the central area while restricting access.

      This enclosure is clearly defined by the Y and Z holes, which are too consistent and evenly spaced to be symbolic. They formed the foundation for a pair of stone uprights, making the interior a raised series of protected platforms. Birds — especially carrion feeders (mainly Jackdaws, Ravens, and Crows)— were allowed access to clean the bodies. The cleaned bones were then taken to nearby Long Barrows for entombment.

      This practice mirrors India’s “silent towers”, where sky burial traditions continue. It reflects a belief not in symbolism but in natural decomposition and purification. Stonehenge’s setup provided a sanitary, repeatable method for body disposal — highly advanced for its time.

      The Healing Spring at Carn Menyn
      Towers of Silence (Silent Towers) – Stonehenge Phase 1 — Britain’s First Monument

      9. Decline and Transition to Phase 2

      Over time, the water table dropped as the aquifer drained and post-glacial rebound altered the landscape. The once-functioning moat began drying up, and the mineral bath lost efficacy. This environmental shift marks the end of Phase 1 and the beginning of a new chapter in the site’s life.

      The bluestones were gradually replaced by larger sarsen stones, marking a transition from a practical medical site to something more monumental. These sarsens were installed around 4300 BCE, beginning what most people today incorrectly consider the start of Stonehenge.

      This change is visible in the construction of The Avenue, a wide processional route that leads away from the original riverfront location to the new shoreline further northeast. This redirection reflects both cosmic alignments and the simple reality of hydrological change.

      The Avon shrank to just Stonehenge Bottom were they connected a road for Phase 2 -Stonehenge Phase 1 — Britain’s First Monument

      10. Conclusion — A Monument Built on Function, Not Fantasy

      The first phase of Stonehenge was not a mystical temple, a ceremonial gathering place, or a stone calendar. It was a public health structure, grounded in the harsh realities of Mesolithic life — infection, injury, and death. Its foundation wasn’t spiritual conjecture, but practical science: built on a prehistoric shoreline, maintained by a saturated aquifer, and enriched by mineral-laden bluestone chips dissolved into the water. It was a place of triage, treatment, and transformation.

      Thanks to a new mathematical dating model — one grounded in radiocarbon evidence from quarry hearths, site postholes, and hydrological mapping — we now know Phase 1 began around 8300 BCE. This places Stonehenge among the oldest monumental structures in Europe, second only to Carnac in France, and dismantles the false timeline held by mainstream archaeology. It was not a late Neolithic curiosity but a pioneering Mesolithic achievement. And this was a rational, functional innovation centuries ahead, unlike the speculative calendars or solar temples peddled by tradition.

      Archaeologists have consistently failed to interpret key features of the site. Once thought irrelevant, the postholes forming the central crescent pattern align exactly with where excarnation slabs would have stood. Their curious shape and placement remain unacknowledged in academic literature. Even the surrounding palisade, indicated by the Y and Z holes, has gone largely ignored, despite its obvious protective function. Traditionally described as ceremonial, the ditch is no ditch at all — it is a ring of pits, designed to house seating platforms below water level for therapeutic bathing. This unique design, found nowhere else in Britain, is left undiscussed because it breaks too many taboos about what Stonehenge might truly have been.

      The fog is lifting with advances in LiDAR, mineral analysis, hydrology, and radiocarbon calibration. Stonehenge Phase 1 must now be recognised as Britain’s first scientific structure — a masterpiece of Mesolithic engineering, biology, and community medicine — misunderstood for thousands of years by a profession still reluctant to let go of fantasy.

      Stonehenge Phase 1 — Britain's First Monument
      Bathing at health spas are prehistoric in origin – Stonehenge Phase 1 — Britain’s First Monument

      PodCast

      Silbury Avenue - Avebury's First Stone Avenue

      Author’s Biography

      Robert John Langdon, a polymathic luminary, emerges as a writer, historian, and eminent specialist in LiDAR Landscape Archaeology.

      His intellectual voyage has interwoven with stints as an astute scrutineer for governmental realms and grand corporate bastions, a tapestry spanning British Telecommunications, Cable and Wireless, British Gas, and the esteemed University of London.

      A decade hence, Robert’s transition into retirement unfurled a chapter of insatiable curiosity. This phase saw him immerse himself in Politics, Archaeology, Philosophy, and the enigmatic realm of Quantum Mechanics. His academic odyssey traversed the venerable corridors of knowledge hubs such as the Museum of London, University College London, Birkbeck College, The City Literature Institute, and Chichester University.

      In the symphony of his life, Robert is a custodian of three progeny and a pair of cherished grandchildren. His sanctuary lies ensconced in the embrace of West Wales, where he inhabits an isolated cottage, its windows framing a vista of the boundless sea – a retreat from the scrutinous gaze of the Her Majesty’s Revenue and Customs, an amiable clandestinity in the lap of nature’s embrace.

      Exploring Prehistoric Britain: A Journey Through Time

      My blog delves into the fascinating mysteries of prehistoric Britain, challenging conventional narratives and offering fresh perspectives based on cutting-edge research, particularly using LiDAR technology. I invite you to explore some key areas of my research. For example, the Wansdyke, often cited as a defensive structure, is re-examined in light of new evidence. I’ve presented my findings in my blog post Wansdyke: A British Frontier Wall – ‘Debunked’, and a Wansdyke LiDAR Flyover video further visualizes my conclusions.

      My work also often challenges established archaeological dogma. I argue that many sites, such as Hambledon Hill, commonly identified as Iron Age hillforts are not what they seem. My posts Lidar Investigation Hambledon Hill – NOT an ‘Iron Age Fort’ and Unmasking the “Iron Age Hillfort” Myth explore these ideas in detail and offer an alternative view. Similarly, sites like Cissbury Ring and White Sheet Camp, also receive a re-evaluation based on LiDAR analysis in my posts Lidar Investigation Cissbury Ring through time and Lidar Investigation White Sheet Camp, revealing fascinating insights into their true purpose. I have also examined South Cadbury Castle, often linked to the mythical Camelot56.

      My research also extends to the topic of ancient water management, including the role of canals and other linear earthworks. I have discussed the true origins of Car Dyke in multiple posts including Car Dyke – ABC News PodCast and Lidar Investigation Car Dyke – North Section, suggesting a Mesolithic origin2357. I also explore the misidentification of Roman aqueducts, as seen in my posts on the Great Chesters (Roman) Aqueduct. My research has also been greatly informed by my post-glacial flooding hypothesis which has helped to inform the landscape transformations over time. I have discussed this hypothesis in several posts including AI now supports my Post-Glacial Flooding Hypothesis and Exploring Britain’s Flooded Past: A Personal Journey

      Finally, my blog also investigates prehistoric burial practices, as seen in Prehistoric Burial Practices of Britain and explores the mystery of Pillow Mounds, often mistaken for medieval rabbit warrens, but with a potential link to Bronze Age cremation in my posts: Pillow Mounds: A Bronze Age Legacy of Cremation? and The Mystery of Pillow Mounds: Are They Really Medieval Rabbit Warrens?. My research also includes the astronomical insights of ancient sites, for example, in Rediscovering the Winter Solstice: The Original Winter Festival. I also review new information about the construction of Stonehenge in The Stonehenge Enigma.

      Further Reading

      For those interested in British Prehistory, visit www.prehistoric-britain.co.uk, a comprehensive resource featuring an extensive collection of archaeology articles, modern LiDAR investigations, and groundbreaking research. The site also includes insights and extracts from the acclaimed Robert John Langdon Trilogy, a series of books exploring Britain during the Prehistoric period. Titles in the trilogy include The Stonehenge Enigma, Dawn of the Lost Civilisation, and The Post Glacial Flooding Hypothesis, offering compelling evidence about ancient landscapes shaped by post-glacial flooding.

      To further explore these topics, Robert John Langdon has developed a dedicated YouTube channel featuring over 100 video documentaries and investigations that complement the trilogy. Notable discoveries and studies showcased on the channel include 13 Things that Don’t Make Sense in History and the revelation of Silbury Avenue – The Lost Stone Avenue, a rediscovered prehistoric feature at Avebury, Wiltshire.

      In addition to his main works, Langdon has released a series of shorter, accessible publications, ideal for readers delving into specific topics. These include:

      For active discussions and updates on the trilogy’s findings and recent LiDAR investigations, join our vibrant community on Facebook. Engage with like-minded enthusiasts by leaving a message or contributing to debates in our Facebook Group.

      Whether through the books, the website, or interactive videos, we aim to provide a deeper understanding of Britain’s fascinating prehistoric past. We encourage you to explore these resources and uncover the mysteries of ancient landscapes through the lens of modern archaeology.

      For more information, including chapter extracts and related publications, visit the Robert John Langdon Author Page. Dive into works such as The Stonehenge Enigma or Dawn of the Lost Civilisation, and explore cutting-edge theories that challenge traditional historical narratives.

      Other Blogs

      s

      t