

The Post Glacial Flooding Hypothesis – Robert John Langdon
In the context of “The Post-Glacial Flooding Hypothesis,” an investigation was undertaken into novel mathematical models to quantify water release events that occurred during and after the Last Glacial Maximum, approximately 10,000 years ago. Should it be postulated that the Dykes of Britain functioned as conduits for water rather than solely as demarcation or defensive structures, it would necessitate empirical evidence that the historical water table was situated at higher elevations than at present. Absent such evidence, these structures would perpetually remain inundated. (Post Glacial Flooding Hypothesis)
The computational models embedded within the Post-Glacial Flooding Hypothesis yielded an astounding result, revealing a minimum discharge of 8.42 quadrillion metric tonnes of water onto the United Kingdom at the conclusion of the last ice age. This volume is akin to the hypothetical scenario of 98,425.2 inches of precipitation evenly distributed over every square inch of the British landmass, or the conceptualisation of an unbroken, incremental descent of one inch of rainfall each day for 270 consecutive years. (Post Glacial Flooding Hypothesis)
Within the annals of British meteorological history, the most notable inundation is encapsulated in the deluge of 1947. This catastrophic event unfolded due to a trifling six inches of rainfall, equivalent to 149 millimetres, combined with the progressive thaw of up to 12 inches of snow, culminating in an absolute liquid accumulation not exceeding 15 inches over three months. This inundation, characterized by its expansive geographical impact, affected nearly all major river systems in England’s South, Midlands, and Northeast regions, earning distinction for its origins, extensive reach, and prolonged duration.
Over a fortnight, this calamity extended its grasp to encompass thirty of the forty English counties, submerging approximately 700,000 acres of land. Consequently, tens of thousands of individuals were temporarily displaced from their homes, and thousands of acres of crops suffered irreparable losses. It is noteworthy that this event, despite its monumental scale, represents only a fraction—precisely, a mere 15 inches—of the estimated equivalent of 98,425 inches of water that the British landscape bore witness to following the conclusion of the last Ice Age. The enduring ramifications of this ancient deluge persistently shape the contemporary geographical and hydrological landscape. (Post Glacial Flooding Hypothesis)
Raised Water Table
According to William Donn (Donn et al., 1962). The Fennoscandian and Great Britain ice sheet covered 4.7 106 km2, which is equivalent to:
• 8.42 106 Gigatonnes of water / 4.7 106 km2, which gives us 1.79 Gt per km2
• 1.79 Gt of water at a penetration rate of 43%, give us 0.77 Gt of water per km2
• 0.77 Gigatonnes of water by UK landmass 242,495 km² gives us 186,804 Gt of groundwater
The gradual release of this groundwater is anticipated to occur within a range of 1 to 12 millimetres per annum and conceivably originates from depths of up to 75 kilometres beneath the Earth’s surface. Consequently, to effectuate groundwater drainage from a depth of 75 kilometres at an average annual rate of 6 millimetres, a protracted temporal span of 12,500 years is deemed necessary. This extended duration significantly exceeds the previously held belief, which posited a mere 1,200 years for the dissipation of surface water from the final stages of meltwater.
This protracted release of groundwater from subterranean aquifers is a salient factor sustaining the flow of rivers, such as the Thames, even during extended periods of arid conditions. The continuous groundwater leakage into these river systems is a testament to the intricate hydrological dynamics. Notably, this groundwater flux is believed to have reached its zenith at the onset of the Mesolithic era, shortly after the momentous meltwater deluge that marked the conclusion of the last Ice Age. (Post Glacial Flooding Hypothesis)
Sea-Level Changes
Should this model prove accurate, its veracity can be corroborated by examining additional empirical evidence that explicitly affects sea level fluctuations over the past 12,500 years. This approach seeks to determine whether the rate of sea-level change has remained consistent over this extended time frame.
Traditionally, discussions in geology and palaeoclimatology concerning the end of the last Ice Age often centre on the ‘Meltwater Pulse.’ This event represents a swift and substantial elevation in sea levels, encompassing a rise of 20 meters, which transpired between 13,500 and 14,700 years before the present day, unfolding throughout approximately 400 to 500 years. While this ‘pulse’ undoubtedly constitutes a remarkable and dramatic rise in sea level, it is crucial to acknowledge that this particular episode constitutes only a fraction, specifically 16%, of the total sea level increase observed since the termination of the last Ice Age. (Post Glacial Flooding Hypothesis)
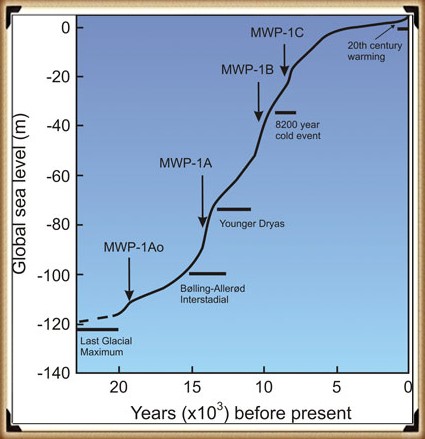
| Figure 58- Historical Sea Level Change – Post Glacial Flooding |
In scrutinising the full range of sea-level variations over this protracted interval, one can glean insights into broader patterns of change and continuity, thereby contributing to the validation or refinement of the model mentioned above, which posits groundwater release over 12,500 years as a driving force behind hydrological and geological phenomena.
We have constructed a model of sea-level changes by combining both the Wadden Sea model (Vermeersen et al., 2018) and the NASA sea-level model to calculate the rise in sea level in the North Sea area and the discharge levels from the Rivers that flow into the area over the last 10,000 years since the Last Ice Age (Fig. 59). (Post Glacial Flooding Hypothesis)
Landscape Transformation
A comprehensive analysis of Holocene data, considering factors such as substantial meltwater inflows, periodic ice-melt pulses, elevated water tables, and heightened precipitation, collectively points to increased hydrological activity and amplified water volumes during this epoch. This convergence of factors underscores the existence and sustainability of significant river systems in the Holocene. (Post Glacial Flooding Hypothesis)
Throughout this epoch, climate fluctuations led to the release of substantial meltwater as ice sheets and glaciers retreated, while periodic pulses of ice melt and elevated water tables further contributed to the formation and expansion of rivers. Augmented precipitation levels also bolstered the overall volume of water flowing through these river networks.
These Holocene rivers have served as vital agents of environmental change, influencing ecosystems, facilitating transportation, and shaping the distribution of life forms. The synthesis of this empirical evidence sheds light on the intricate relationship between climate dynamics and the development of extensive river systems during the Holocene, deepening our comprehension of this geological epoch’s hydrological evolution. (Post Glacial Flooding Hypothesis)
Table 1 – Wadden sea level rises and precipitation levels (* Meltwater Pulse).
| BCE | Change (mm) over – 500 years | Discharge Ratio rate – compared to today = 1 | Adjusted Ratio for Discharge – Pulses | Precipitation levels mm pa |
| 950 AD | 50 | 1 | 1 | 450 |
| 450 AD | 400 | 8 | 8 | 430 |
| 50 | 300 | 6 | 6 | 440 |
| 550 | 400 | 8 | 8 | 440 |
| 1050 | 350 | 7 | 7 | 450 |
| 1550 | 350 | 7 | 7 | 375 |
| 2050 | 400 | 8 | 8 | 440 |
| 2550 | 500 | 10 | 10 | 550 |
| 3050 | 1000 | 20 | 20 | 550 |
| 3550 | 1000 | 20 | 20 | 460 |
| 4050 | 1500 | 30 | 30 | 450 |
| 4550 | 1500 | 30 | 30 | 525 |
| 5050 | 1500 | 30 | 30 | 625 |
| 5550 | 6500 | 130 * | 50 | 640 |
| 6050 | 4000 | 80 | 70 | 670 |
| 6550 | 7000 | 140 * | 90 | 630 |
| 7050 | 6000 | 120 | 120 | 600 |
| 7550 | 7000 | 140 | 140 | 400 |
Figure 59, in the context of the provided table, offers an insightful depiction of the Wadden Sea region, situated within the North Sea, and its relationship to rising sea levels in relation to river discharge and river size.
The blue line labelled ‘discharge’ on the graph represents river discharge volume, thereby reflecting river size and elevation over the past ten thousand years. In this visualisation, the chart uses the discharge rate observed in 950 AD as the baseline, setting it to 1 unit. This approach enables a straightforward visual comparison with previous years by presenting the data as a size ratio.
The graphical representation thus illustrates that as far back as 8050 BCE, the rivers in this region were markedly more prominent, measuring approximately 140 times their contemporary size. This striking contrast in river dimensions over time underscores the profound changes in the Wadden Sea area and highlights the significance of historical river dynamics in shaping the region’s hydrological and geological evolution.
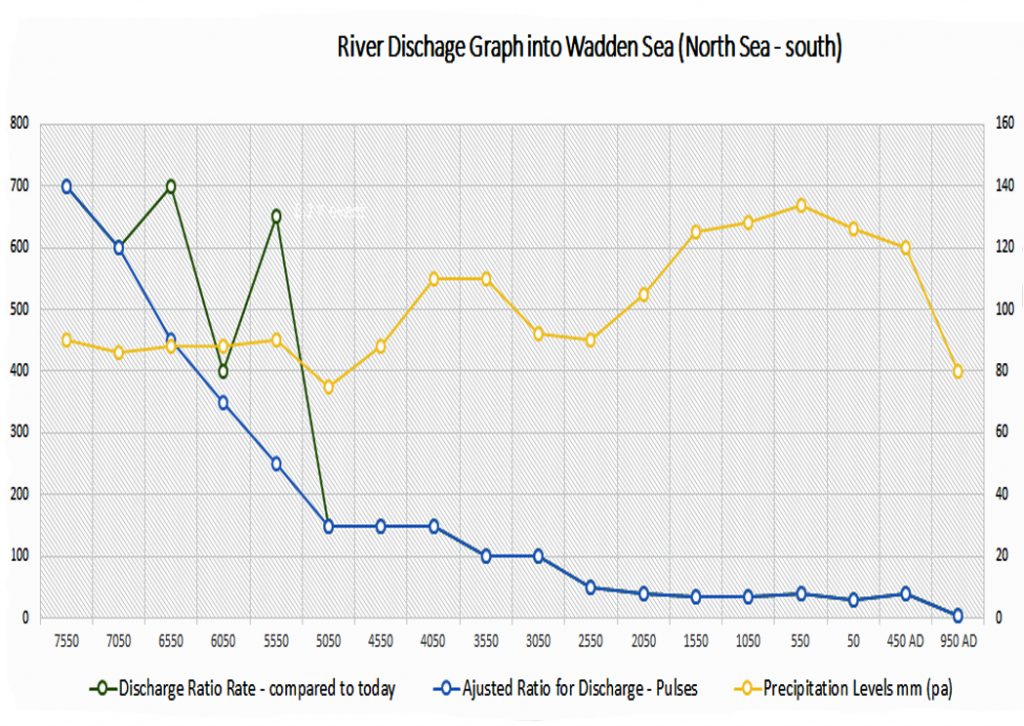
| Figure 59 – Discharges Rates from the Wadden Sea – the yellow graph is precipitation and the green is the water pulses above the estimated steady blue discharge from the water table |
Other Post-Glacial Flooding around the world
Indeed, the post-Last Glacial Maximum (LGM) flooding was not limited to the British Isles alone. The comprehensive examination presented in the trilogy’s first volume, “The Post-Glacial Hypothesis,” has illuminated the widespread nature of these inundations, extending their impact to various regions, including North America.
The empirical data showcased the substantial surge in river discharge following the LGM, with notable examples such as the Mississippi River experiencing an astounding increase from its contemporary rate of 16,790 cubic meters per second (m³/s) to a staggering 160,000 m³/s. This monumental rise, an 853% increase, clearly signifies a significant increase in river height and discharge.
Similar observations of heightened river levels and discharge rates are also evident in regions such as Germany. The cascading consequences of these amplified discharge rates and elevated water levels have historically manifested, notably in the Black Sea. Situated approximately 2000 miles from the glacial ice sheet, the Black Sea witnessed the impact of rising sea levels, culminating in a historic flood.
This inundation event, in which freshwater from the Black Sea overflowed into the Mediterranean, led to the transformation of the Black Sea from a freshwater body into a saltwater lake. These instances collectively underscore the far-reaching and interconnected implications of post-LGM flooding, which extended well beyond the immediate vicinity of the glacial ice sheets and left a profound imprint on global hydrological and geological dynamics. (Post Glacial Flooding Hypothesis)
Britain’s Post-Glacial Flooding
Lewin and Macklin’s 2003 study is a pivotal contribution to our understanding of Holocene river dynamics. They identified a remarkable 147 channel floods that occurred during the Holocene, primarily attributable to a rising water table, a phenomenon that persisted until approximately 1000 years ago. Their work also highlighted the expected trends in sedimentation, theoretically yielding straight-line cumulative plots and uniform probability levels, with deviations indicating episodic or fluctuating trends in sediment activity.
However, the uneven preservation of alluvial units, as noted in Lewin and Macklin’s study, complicates the interpretation of the Holocene sedimentary record. This variance in preservation primarily affects later Holocene sediments and can result in the spikiness observed in the illustrated plots. Additionally, radiocarbon-dated materials can exhibit clustering due to variability in 14C production, which may or may not align with flood events. Thus, the complexity of the data presented underscores the need for a nuanced interpretation of episodic alluviation.
Subsequently, the study investigated the Thames River as a case study to elucidate how Britain’s most prominent river was impacted during the Mesolithic and Neolithic periods. A discharge model was constructed based on sedimentary data from the British Geological Society’s superficial maps and borehole core samples. The findings of this study revealed a striking increase in the current average discharge of the Thames River, indicating a 3723% increase within the watershed. This, in turn, allowed an estimate that, at its peak, the Thames River discharged approximately 2450 m³/s (0.0025 gigatonnes per second or 1314 gigatonnes per annum), a rate akin to that of some smaller rivers in North America during the same period.
This raises a pertinent question about the Thames River’s historical behaviour and potential relationship with the meltwater from the last ice age. To delve deeper into this inquiry, a meticulous excavation at the edge of the BGS superficial Alluvium flood map was undertaken to provide tangible evidence regarding the nature of the sediments observed in the geological record. The cross-section profile of the Thames revealed an expansion of the Holocene superficial sediment area by at least one mile, terminating at Boreholes TQ47NE344 and TQ58NW141. These boreholes demonstrated significant sediment thickness before reaching underlying geological strata.
The implications of these findings are profound, as they substantially augment the Thames Flood Model, projecting a discharge of 12,250 m³/s. This revised estimate aligns more closely with the North American Discharge Model, prompting a reevaluation of the Thames River’s historical behaviour and the influence of post-glacial meltwater dynamics on its hydrological profile. (Post Glacial Flooding Hypothesis)
Peat (Ultimate Evidence of Holocene Flooding).
The formation of bogs in the UK began around 10,000 years ago, coinciding with the end of the last ice age, when glaciers withdrew northwards, leaving behind terrain characterised by shallow meltwater lakes and waterlogged depressions. A substantial portion of the UK’s land area, approximately 2.3 million hectares or 9.5%, is now covered by bog peatlands.
Peat, commonly known as turf, is an accumulation of partially decomposed organic matter, with Sphagnum moss being a predominant contributor. Soils primarily composed of peat are referred to as histosols. Peat formation occurs in wetland environments where atmospheric oxygen supply is impeded by flooding, resulting in reduced decomposition rates.
While bogs represent a prominent source of peat, other less common wetland types, including fens, pocosins, and peat swamp forests, also contribute to peat deposition. Various terms describe lands dominated by peat, such as moors, muskeg, or mires. These landscapes support specific plant species, notably Sphagnum moss, Ericaceous shrubs, and sedges. Since organic matter accumulates over millennia, peat deposits offer valuable records of past vegetation and climates preserved in plant remains, particularly pollen. Consequently, they facilitate the reconstruction of historical environments and the analysis of changes in land use.
Peat develops where plant material, typically in marshy areas, undergoes incomplete decay due to acidic and anaerobic (oxygen-deprived) conditions. It primarily consists of organic remains from marshland vegetation, including trees, grasses, fungi, insects, and animal remains. Under specific requirements, the decomposition of these materials is constrained, making peat layers valuable for archaeological investigations.
The growth of peat layers and the extent of decomposition depend primarily on factors such as composition and waterlogging. Peat formed in very wet conditions accumulates more rapidly and experiences less decomposition than in drier environments, making it a valuable indicator of climatic change for climatologists.
Unlike subsoils like head and alluvium, peat bogs can often be precisely carbon-dated, a crucial aspect of understanding post-glacial flooding. The flooded regions of Britain are prime candidates for the development of marshes and swamps, contributing to the formation of contemporary peat subsoils.
Peat not only aids in identifying Holocene wet areas and elevated river levels but also helps determine river size and flow during the Mesolithic and Neolithic periods. Blanket bog, which occupies approximately 6% of the UK’s current land area, has historically been attributed to Neolithic forest clearance. However, recent predictive models, such as PeatStash, which use summer temperature and moisture index thresholds, provide accurate predictions of the current distribution of blanket bog in Great Britain. Additionally, these models explain the global distribution of blanket bog ecosystems. (Post Glacial Flooding Hypothesis)
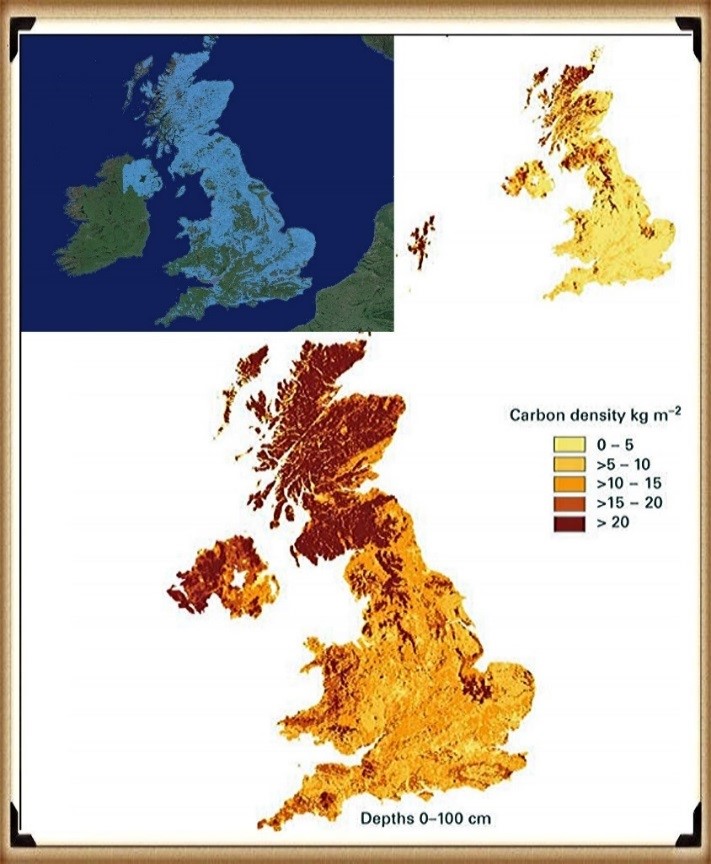
| Figure 60- Peat growth – reflecting the post-glacial flooding of Britain (blue map) |
The discovery made by Gallego-Sala and colleagues in 2016 suggests that climate factors predominantly control the distribution of blanket bogs in the UK and globally rather than being primarily influenced by historical land-use practices. (Post Glacial Flooding Hypothesis)
Interestingly, the maximum rate of peat production doesn’t coincide with the immediate post-meltwater-flooding period following the Last Glacial Maximum. If one were to anticipate a direct correlation, the peak peat growth would logically occur in the early Holocene period, shortly after the rapid recession of floodwaters. However, as exemplified in Scotland (Figure 61), empirical observations reveal a 4000 to 6000-year lag between the post-glacial period and the peak peat growth.
This delay can be attributed to the hydrological dynamics of the early Holocene, characterised by the highest and most rapid river flows. During this phase, the environmental conditions were unfavourable for the establishment and growth of marshes and bogs. It is only as the rivers gradually receded that suitable conditions for peat formation began to emerge. This process of peat formation was occasionally disrupted by flooding events triggered by precipitation towards the end of the Neolithic period, coinciding with the advent of farming practices.
In essence, this temporal discrepancy underscores the intricate relationship between river behaviour, climate, and the development of peatlands during the Holocene. It challenges the assumption that post-glacial flooding directly leads to peat growth and emphasises the role of evolving hydrological conditions in shaping the timing and extent of peatland formation. (Post Glacial Flooding Hypothesis)
(Post Glacial Flooding Hypothesis)
Further Reading
For more information about British Prehistory and other articles/books, go to our BLOG WEBSITE for daily updates or our VIDEO CHANNEL for interactive media and documentaries. The TRILOGY of books that ‘changed history’ can be found with chapter extracts at DAWN OF THE LOST CIVILISATION, THE STONEHENGE ENIGMA and THE POST-GLACIAL FLOODING HYPOTHESIS. Other associated books are also available, such as 13 THINGS THAT DON’T MAKE SENSE IN HISTORY, and other ‘short’ budget-priced books can be found on our AUTHOR SITE. For active discussion on the findings of the TRILOGY and recent LiDAR investigations that are published on our WEBSITE, you can join our FACEBOOK GROUP.
(Post Glacial Flooding Hypothesis)
Other Blogs
1
a
- AI now Supports – Homo Superior
- AI now supports my Post-Glacial Flooding Hypothesis
- Alexander the Great sailed into India – where no rivers exist today
- Ancient Secrets of Althorp – debunked
- Antler Picks built Ancient Monuments – yet there is no real evidence
- Antonine Wall – Prehistoric Canals (Dykes)
- Archaeological ‘pulp fiction’ – has archaeology turned from science?
- Archaeological Pseudoscience
- Archaeology in the Post-Truth Era
- Archaeology: A Bad Science?
- Archaeology: A Harbour for Fantasists?
- Archaeology: Fact or Fiction?
- Archaeology: The Flaws of Peer Review
- Archaeology’s Bayesian Mistake: Stop Averaging the Past
- Are Raised Beaches Archaeological Pseudoscience?
- Atlantis Found: The Mathematical Proof That Plato’s Lost City Was Doggerland
- ATLANTIS: Discovery with Dan Snow Debunked
- Avebury Ditch – Avebury Phase 2
- Avebury through time
- Avebury’s great mystery revealed
- Avebury’s Lost Stone Avenue – FREE Flipbook
b
- Battlesbury Hill – Wiltshire
- Beyond Stone and Bone: Rethinking the Megalithic Architects of Northern Europe
- BGS Prehistoric River Map
- Blackhenge: Debunking the Media misinterpretation of the Stonehenge Builders
- Brain capacity (Cro-Magnon Man)
- Britain’s First Road – Stonehenge Avenue
- Britain’s Giant Prehistoric Waterways
- British Roman Ports miles away from the coast
c
- Caerfai Promontory Fort – Archaeological Nonsense
- Car Dyke – ABC News PodCast
- Car Dyke – North Section
- Car Dyke Atlas – Prehistoric Canals – FREE Flipbook
- CASE STUDY – An Inconvenient TRUTH (Craig Rhos Y Felin)
- Case Study – River Avon
- Case Study – Woodhenge Reconstruction
- Chapter 2 – Craig Rhos-Y-Felin Debunked
- Chapter 2 – Stonehenge Phase I
- Chapter 2 – Variation of the Species
- Chapter 3 – Post Glacial Sea Levels
- Chapter 3 – Stonehenge Phase II
- Chapter 7 – Britain’s Post-Glacial Flooding
- Cissbury Ring through time
- Clement Reid, Doggerland, and the Archaeological Establishment
- Cro-Magnon Brain Capacity
- Cro-Magnon Megalithic Builders: Measurement, Biology, and the DNA
- Cro-Magnons – An Explainer
d
- Darwin’s Children – Flipbook
- Darwin’s Children – The Cro-Magnons
- Dawn of the Lost Civilisation – FREE Flipbook
- Dawn of the Lost Civilisation – Introduction
- Digging for Britain – Cerne Abbas
- Digging for Britain Debunked – Cerne Abbas 2
- Digging Up Britain’s Past – Debunked
- DLC Chapter 1 – The Ascent of Man
- Durrington Walls – Woodhenge through time
- Durrington Walls Revisited: Platforms, Fish Traps, and a Managed Mesolithic Landscape
- Dyke Construction – Hydrology 101
- Dykes Ditches and Earthworks
- DYKES of Britain
e
f
g
h
- Hadrian’s Wall – Military Way Hoax
- Hadrian’s Wall – the Stanegate Hoax
- Hadrian’s Wall LiDAR investigation
- Hambledon Hill – NOT an ‘Iron Age Fort’
- Hayling Island Lidar Maps
- Hidden Sources of Ancient Dykes: Tracing Underground Groundwater Fractals
- Historic River Avon
- Hollingsbury Camp Brighton – A Hillfort… or a Forgotten Harbour?
- Hollows, Sunken Lanes and Palaeochannels
- Homo Superior – Flipbook
- Homo Superior – History’s Giants
- How Lidar will change Archaeology
- Hydrology 101 Simplified: Why Britain’s Dykes Worked Without Rivers
i
l
m
- Maiden Castle through time
- Mathematics Meets Archaeology: Discovering the Mesolithic Origins of Car Dyke
- Mesolithic River Avon
- Mesolithic Stonehenge
- Minerals found in Prehistoric and Roman Quarries
- Mining in the Prehistoric to Roman Period
- Mount Caburn through time
- Mysteries of the Oldest Boatyard Uncovered
- Mythological Dragons – a non-existent animal that is shared by the World.
o
- Offa’s Dyke – FREE Flipbook
- Old Sarum Lidar Map
- Old Sarum Through Time…………….
- On Sunken Lands of the North Sea – Lived the World’s Greatest Civilisation.
- OSL Chronicles: Questioning Time in the Geological Tale of the Avon Valley
- Oswestry LiDAR Survey
- Oswestry through time
- Oysters in Archaeology: Nature’s Ancient Water Filters?
p
- Pillow Mounds: A Bronze Age Legacy of Cremation?
- Pinkery Canal
- Plato Was Right: The Archaeological Evidence the Academics Never Expected
- Post Glacial Flooding – Flipbook
- Prehistoric Burial Practices of Britain
- Prehistoric Canals – Wansdyke
- Prehistoric Canals – Wansdyke
- Prehistoric Canals (Dykes) – Great Chesters Aqueduct (The Vallum Pt. 4)
- Prehistoric Canals (Dykes) – Hadrian’s Wall Vallum (pt 1)
- Prehistoric Canals (Dykes) – Offa’s Dyke (Chepstow)
- Prehistoric Canals (Dykes) – Offa’s Dyke (LiDAR Survey)
- Prehistoric Canals (Dykes) – Offa’s Dyke Survey (End of Section A)
- Prehistoric Canals (Dykes) – Wansdyke (4)
- Prehistoric Canals Wansdyke 2
- Professor Bonkers and the mad, mad World of Archaeology
r
- Real-World Confirmation of Post-Glacial Flooding
- Rebirth in Stone: Decrypting the Winter Solstice Legacy of Stonehenge
- Rediscovering the Winter Solstice: The Original Winter Festival
- Rethinking Ancient Boundaries: The Vallum and Offa’s Dyke”
- Rethinking Ogham: Could Ireland’s Oldest Script Have Begun as a Tally System?
- Rethinking The Past: Mathematical Proof of Langdon’s Post-Glacial Flooding Hypothesis
- Rising Evidence, Falling Rivers: The Real Story of Europe’s First Farmers
- Rivers of the Past Were Higher: A Fresh Perspective on Prehistoric Hydrology
s
- Sea Level Changes
- Section A – NY26SW
- Section B – NY25NE & NY26SE
- Section C – NY35NW
- Section D – NY35NE
- Section E – NY46SW & NY45NW
- Section F – NY46SE & NY45NE
- Section G – NY56SW
- Section H – NY56NE & NY56SE
- Section I – NY66NW
- Section J – NY66NE
- Section K – NY76NW
- Section L – NY76NE
- Section M – NY87SW & NY86NW
- Section N – NY87SE
- Section O – NY97SW & NY96NW
- Section P – NY96NE
- Section Q – NZ06NW
- Section R – NZ06NE
- Section S – NZ16NW
- Section T – NZ16NE
- Section U – NZ26NW & NZ26SW
- Section V – NZ26NE & NZ26SE
- Silbury Avenue – Avebury’s First Stone Avenue
- Silbury Hill
- Silbury Hill / Sanctuary – Avebury Phase 3
- Sky Maps of Prehistoric Britain
- Somerset Plain – Signs of Post-Glacial Flooding
- South Cadbury Castle – Camelot
- Statonbury Camp near Bath – an example of West Wansdyke
- Stone me – the druids are looking the wrong way on Solstice day
- Stone Transportation and Dumb Censorship
- Stonehenge – Monument to the Dead
- Stonehenge Hoax – Dating the Monument
- Stonehenge Hoax – Round Monument?
- Stonehenge Hoax – Summer Solstice
- Stonehenge LiDAR tour
- Stonehenge Phase 1 – 8300 BCE Documentary
- Stonehenge Phase 1 — Britain’s First Monument
- Stonehenge Phase I (The Stonehenge Landscape)
- Stonehenge Solved – Pythagorean maths put to use 4,000 years before he was born
- Stonehenge Through Time
- Stonehenge, Doggerland and Atlantis connection
- Stonehenge: Borehole Evidence of Post-Glacial Flooding
- Stonehenge: Discovery with Dan Snow Debunked
- Stonehenge: The World’s First Computer – FREE Flipbook
- Stonehenge: The Worlds First Computer
- Stonehenge’s The Lost Circle Revealed – DEBUNKED
t
- Ten Reasons Why Car Dyke Blows Britain’s Earthwork Myths Out of the Water
- Ten Things You Didn’t Know About Britain’s Prehistoric Flooded Past
- Ten thousand year old boats found on Northern Europe’s Hillsides
- Ten thousand-year-old boats found on Northern Europe’s Hillsides
- Testing Plato’s Atlantis Against Reality
- The “Hunter-Gatherer” Myth: Why It’s Time to Bury This Outdated Term
- The Ancient Mariners – Flipbook
- The Ancient Mariners – Prehistoric seafarers of the Mesolithic
- The Ascent of Man — From Survival to Systems
- The Beringian Migration Myth: Why the Peopling of the Americas by Foot is Mathematically and Logistically Impossible
- The Bluestone Enigma
- The Bulford Hoax: The “Simpler, Older Stonehenge” That Wasn’t
- The Cheddar Man Hoax
- The Cro-Magnon Cover-Up: How DNA and PR Labels Erased Our Real Ancestry
- The Dolmen and Long Barrow Connection
- The Durrington Mega-Monument Hoax: What Lies Beneath? – Debunked
- The Durrington Walls Hoax – it’s not a henge?
- The Dyke Myth Collapses: Excavation and Dating Prove Britain’s Great Dykes Are Prehistoric Canals
- The First European Smelted Bronzes
- The Fury of the Past: Natural Disasters in Historical and Prehistoric Britain
- The Giant’s Graves of Cumbria
- The Giants of Prehistory: Cro-Magnon and the Ancient Monuments
- The Great Ancient DNA Illusion: How Statistical Models Became Archaeological “Facts”
- The Great Antler Pick Hoax
- The Great Bell Beaker Migration Myth
- The Great Chichester Hoax – A Bridge too far?
- The Great Dorchester Aqueduct Hoax
- The Great Farming Hoax – (Einkorn Wheat)
- The Great Farming Migration Hoax
- The Great Hadrian’s Wall Hoax
- The Great Iron Age Hill Fort Hoax
- The Great Offa’s Dyke Hoax
- The Great Prehistoric Migration Hoax
- The Great Stone Transportation Hoax
- The Great Stonehenge Hoax
- The Great Wansdyke Hoax
- The Henge and River Relationship
- The Logistical Impossibility of Defending Maiden Castle
- The Long Barrow and Dolmen Enigma
- The Long Barrow Mystery
- The Long Barrow Mystery: Unravelling Ancient Connections
- The Lost Island of Avalon – revealed
- The Maiden Way Hoax – A Closer Look at an Ancient Road’s Hidden History
- The Maths – LGM total ice volume
- The Mystery of Pillow Mounds: Are They Really Medieval Rabbit Warrens?
- THE ODYSSEY PROBLEM: WHY DID A WEEK-LONG VOYAGE BECOME A TEN-YEAR EPIC?
- The Old Sarum Hoax
- The Oldest Boat Yard in the World found in Wales
- The Perils of Paradigm Shifts: Why Unconventional Hypotheses Get Branded as Pseudoscience
- The Post-Glacial Flooding Hypothesis – 1/11
- The Post-Glacial Flooding Hypothesis – FREE Flipbook
- The Post-Glacial Flooding Theory
- The Problem with Hadrian’s Vallum
- The Rise of the Cro-Magnon (Homo Superior)
- The Roman Military Way Hoax
- The Silbury Hill Lighthouse?
- The Stone Money – Credit System
- The Stonehenge Avenue
- The Stonehenge Avenue
- The Stonehenge Code: Unveiling its 10,000-Year-Old Secret
- The Stonehenge Crescent: A Monument to a Lost World
- The Stonehenge Enigma – FREE Flipbook
- The Stonehenge Enigma: Part 1/6
- The Stonehenge Hoax – Bluestone Quarry Site
- The Stonehenge Hoax – FREE Flipbook
- The Stonehenge Hoax – FREE Flipbook
- The Stonehenge Hoax – Moving the Bluestones
- The Stonehenge Hoax – Periglacial Stripes
- The Stonehenge Hoax – Station Stones
- The Stonehenge Hoax – Stonehenge’s Location
- The Stonehenge Hoax – The Ditch
- The Stonehenge Hoax – The Slaughter Stone
- The Stonehenge Hoax – The Stonehenge Layer
- The Stonehenge Hoax – Totem Poles
- The Stonehenge Hoax – Woodhenge
- The Stonehenge Hospital
- The Stonehenge Transportation Mystery
- The Subtropical Britain Hoax
- The Troy, Hyperborea and Atlantis Connection
- The Vallum @ Hadrian’s Wall – it’s Prehistoric!
- The Vallum at Hadrian’s Wall Atlas – FREE Flipbook
- The Woodhenge Hoax
- Three Dykes – Kidland Forest
- Thurnam’s 137 Skulls: The Forgotten People Behind Britain’s Megaliths.
- Top Ten Misidentified Fire Beacons in British History
- Troy Debunked – Troy did not exist in Asia Minor, but in fact, the North Sea island of Doggerland
- TSE – DVD Barrows
- TSE DVD – An Inconvenient Truth
- TSE DVD – Antler Picks
- TSE DVD – Avebury
- TSE DVD – Durrington Walls & Woodhenge
- TSE DVD – Dykes
- TSE DVD – Epilogue
- TSE DVD – Stonehenge Phase I
- TSE DVD – Stonehenge Phase II
- TSE DVD – The Post-Glacial Hypothesis
- TSE DVD Introduction
- TSE DVD Old Sarum
- Twigs, Charcoal, and the Death of the Saxon Dyke Myth
w
- Wansdyke – Short Film
- Wansdyke Atlas – FREE Flipbook
- Wansdyke East – Prehistoric Canals
- Wansdyke LiDAR Flyover
- Wansdyke: A British Frontier Wall – ‘Debunked’
- Was Columbus the first European to reach America?
- What Archaeology Missed Beneath Stonehenge
- White Sheet Camp
- Why a Simple Fence Beats a Massive Dyke (and What That Means for History)
- Windmill Hill – Avebury Phase 1
- Winter Solstice – Science, Propaganda and Indoctrination
- Woodhenge – the World’s First Lighthouse?