Clement Reid, Doggerland, and the Archaeological Establishment

How a “Lost World” Beneath the North Sea Went from Marginal Theory to Accepted Fact

Introduction

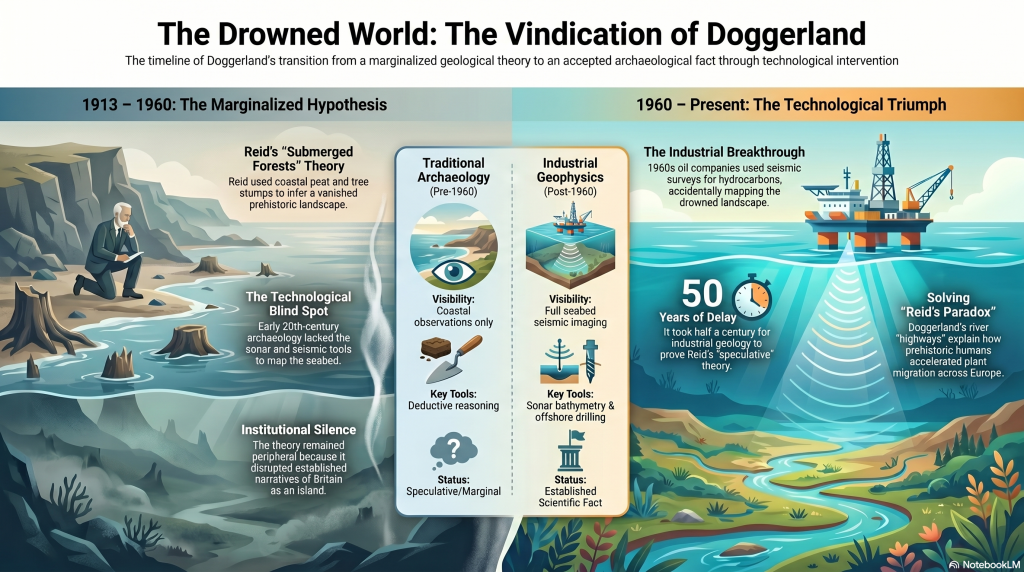
In 1913, the British geologist Clement Reid published a remarkable book titled Submerged Forests. Within its pages, Reid proposed something extraordinary for the time: that Britain had once been connected to continental Europe by a vast prehistoric landscape now submerged beneath the North Sea. (Clement Reid, Doggerland, and the Archaeological Establishment)

Today, we call this drowned world Doggerland.

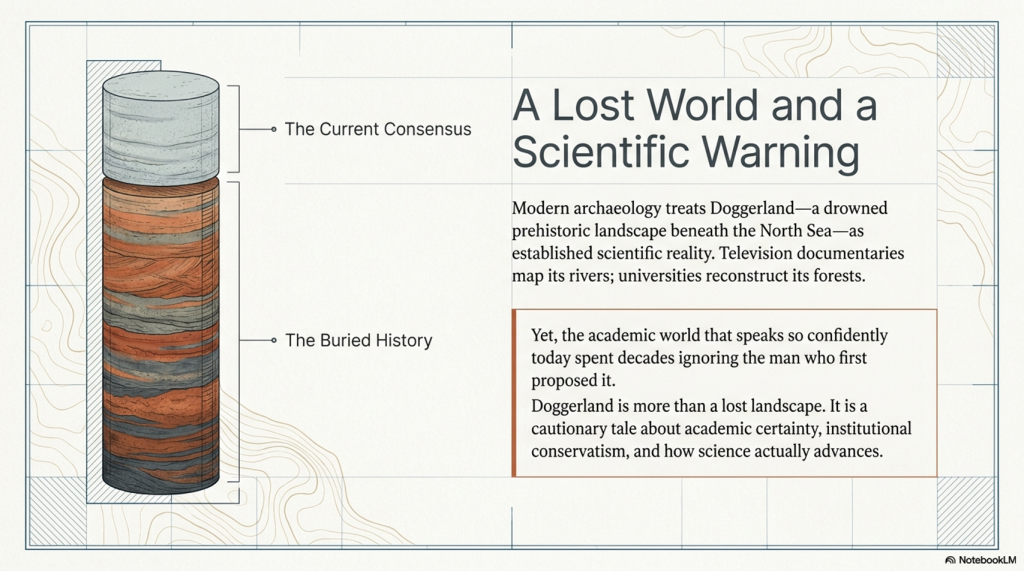
Modern archaeology now treats Doggerland as an established scientific reality. Universities reconstruct its rivers and forests in digital models. Television documentaries present it as one of the most important prehistoric landscapes ever discovered. Entire academic projects are devoted to mapping its vanished terrain.

Yet what is rarely discussed is that when Reid first proposed the idea, it sat largely outside accepted archaeological thinking. His conclusions were not embraced as visionary science. They were treated as speculative and peripheral because the evidence challenged the prevailing understanding of Britain’s prehistoric past.

The irony is remarkable.
(Clement Reid, Doggerland, and the Archaeological Establishment)

The same academic world that now speaks confidently about Doggerland only fully accepted its existence after industrial oil exploration in the 1960s and 1970s accidentally proved Reid correct through seabed mapping, seismic surveys, and offshore drilling.

Doggerland, therefore, represents far more than a lost landscape.

It represents a cautionary tale about academic certainty itself.

Without it, critics can say:

“Well, Reid was just speculating without evidence.”

But once you include the nineteenth-century finds, the situation changes dramatically.

Because then the historical sequence becomes:

  1. Physical evidence was already being recovered from the North Sea.
  2. Scientists already knew submerged land surfaces existed.
  3. Reid synthesised this evidence into a coherent landscape model.
  4. The implications were still not fully operationalised archaeologically.
  5. Later marine geophysics confirmed the larger landscape physically.

That is a much stronger progression in history and science.

And critically, it reinforces your silence argument:

  • The evidence was not absent;
  • The implications simply were not fully pursued.

This section should probably go immediately before “The Britain Clement Reid Saw.”


The Evidence Existed Before Doggerland Had a Name

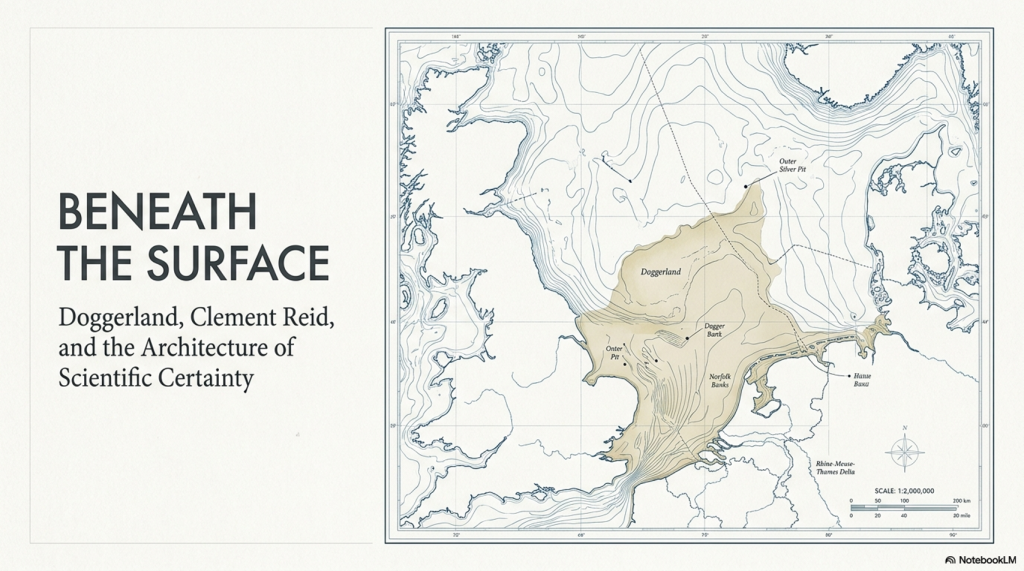
Long before the term “Doggerland” was ever coined, physical evidence was already emerging from the floor of the North Sea.

Throughout the nineteenth century, North Sea fishermen regularly recovered:

  • mammoth bones
  • antlers
  • peat deposits
  • submerged tree remains
  • and even worked flints

while trawling offshore waters.

These discoveries were not isolated curiosities. They demonstrated something fundamentally important:

Large areas beneath the North Sea had once been dry land.
(Clement Reid, Doggerland, and the Archaeological Establishment)

Peat could not form underwater. Trees could not grow on the seabed. Large terrestrial mammals could not inhabit a marine environment. The evidence, therefore, pointed directly toward a drowned prehistoric landscape connecting Britain to continental Europe.

This material heavily influenced early geologists and palaeoenvironmental researchers, including Clement Reid.

By the time Reid published Submerged Forests in 1913, the basic physical evidence for former land surfaces beneath the North Sea already existed. The real issue was not whether the land had once been exposed, but whether the scientific world was prepared to grasp the full implications of what that meant for prehistory, migration, and the ancient geography of Britain.

That distinction is crucial.

Doggerland was not suddenly invented by modern archaeology.

The evidence had been sitting in fishing nets for decades.


The Britain Clement Reid Saw

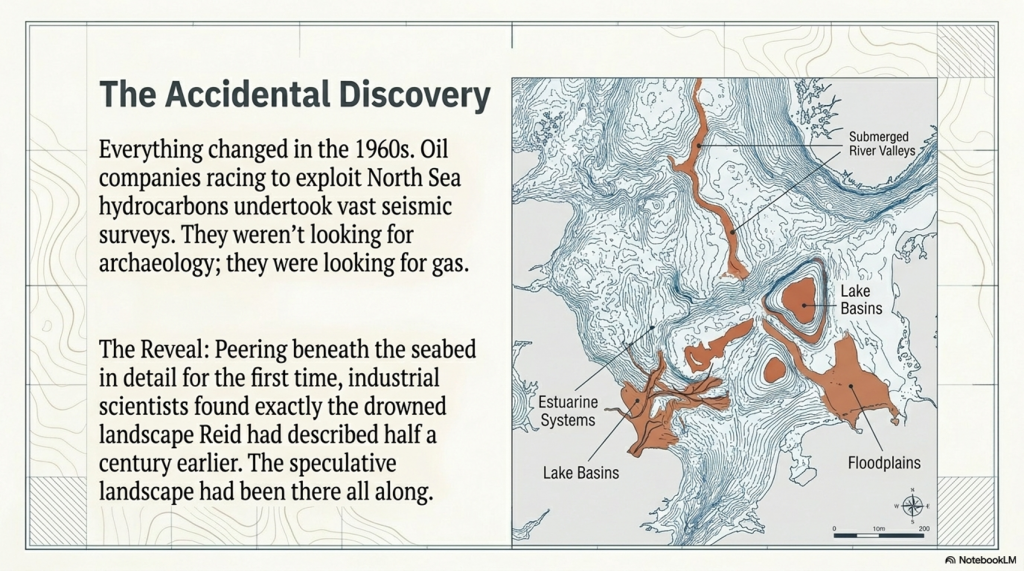
Reid was not a fantasist or fringe writer. He was a respected geologist with the Geological Survey who specialised in ancient landscapes, fossil plants, and environmental reconstruction.

While studying Britain’s coastlines, he repeatedly encountered strange evidence:

  • submerged forests exposed at low tide
  • drowned peat beds
  • ancient river sediments beneath the sea
  • tree stumps emerging from beaches
  • buried prehistoric land surfaces offshore

To Reid, the implications were obvious.

Britain had not always been an island.

Large parts of what is now the North Sea must once have been dry land occupied by forests, animals, and prehistoric people.

At the time, however, archaeology still operated within relatively rigid geographical assumptions. Britain was largely viewed as a peripheral island receiving cultural influence from continental Europe, rather than as part of a major prehistoric continental landscape in its own right.

Reid’s conclusions disrupted that simplicity.
(Clement Reid, Doggerland, and the Archaeological Establishment)

The Problem: Nobody Could See the North Sea Floor

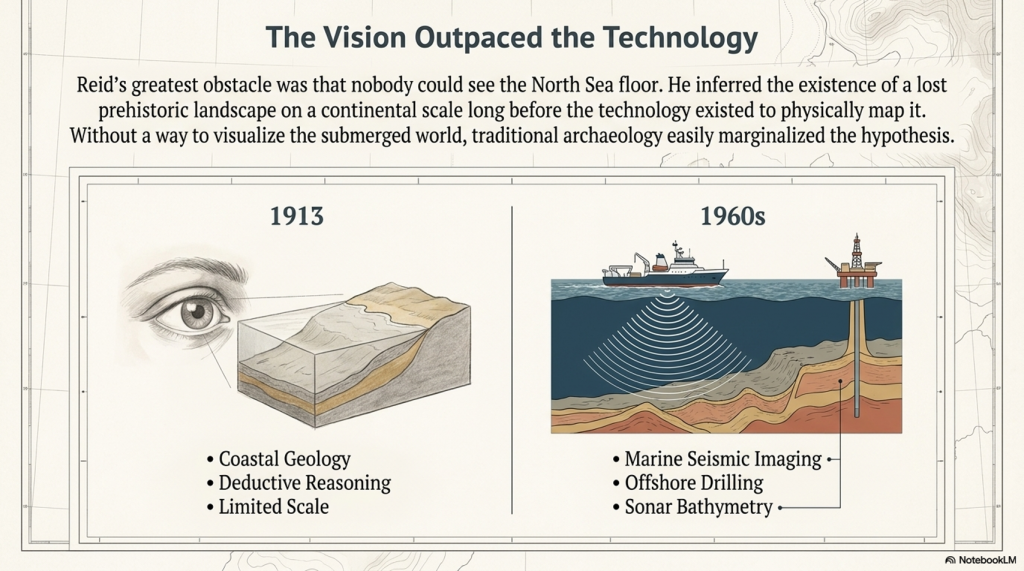
The greatest obstacle Reid faced was technological.

In 1913, there was no practical way to visualise the submerged landscape beneath the North Sea on a continental scale.

There was:

  • no marine seismic imaging
  • no industrial offshore drilling
  • no sonar bathymetry
  • no digital seabed modelling
  • no large-scale geophysical mapping

Reid’s argument, therefore, relied primarily upon coastal geology, submerged forests, peat deposits, and deductive reasoning.

To many archaeologists, this made the hypothesis easy to marginalise.

This is important because modern archaeology often presents Doggerland as though it emerged naturally from gradual academic progress. In reality, the idea remained on the fringes largely because the physical landscape itself could not yet be properly mapped.

(Clement Reid, Doggerland, and the Archaeological Establishment)

Then Came the Oil Industry

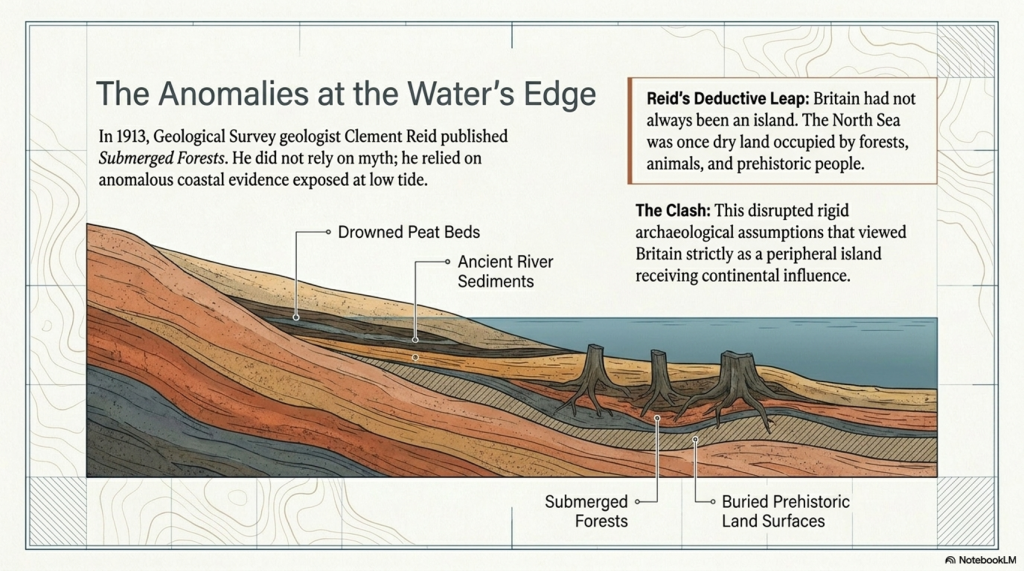
Everything changed in the 1960s with the race to exploit North Sea oil and gas reserves.

Oil companies were not searching for archaeology.

They were searching for hydrocarbons.

To locate them, they began undertaking vast geological and seismic surveys across the North Sea basin. For the first time in human history, scientists could effectively peer beneath the seabed in detail.

And what did they find?

Exactly the kind of drowned landscape Reid had described half a century earlier.

The surveys revealed:

  • submerged river valleys
  • ancient coastlines
  • lake basins
  • estuarine systems
  • floodplains
  • peat deposits
  • glacial and post-glacial landscapes

Modern seismic data have conclusively demonstrated that a vast habitable lowland once connected Britain to continental Europe.

The “speculative” landscape had been there all along.

Why Doggerland Still Wasn’t Fully Understood in the 1980s and 1990s

Even after North Sea oil exploration began revealing enormous submerged landscapes beneath the seabed, Doggerland still did not immediately transform archaeology.

This raises an important question:

If the seismic evidence existed by the 1970s and 1980s, why did it take until the early twenty-first century for Doggerland to become a mainstream archaeological reality?

The answer lies in a combination of corporate secrecy, technological limitation, and disciplinary separation.

(Clement Reid, Doggerland, and the Archaeological Establishment)

1. The Data Was Effectively Locked Away

The seismic surveys were conducted by private oil and gas companies.

These corporations spent enormous sums collecting offshore geophysical data and treated it as commercially valuable intellectual property. Academic archaeologists generally had little or no access to the datasets.

More importantly, the oil industry had no interest in prehistoric landscapes.

Their objective was to find hydrocarbons buried kilometres beneath the seabed. The shallow upper layers, containing ancient river valleys, peat beds, and drowned terrain, were largely treated as geological overburden — background material that had to be filtered out to reach the economically important strata below.

As a result, some of the clearest evidence for Doggerland physically existed for decades before archaeology could meaningfully examine it.


2. The Computers Were Not Yet Powerful Enough

Modern reconstructions of Doggerland depend upon enormous quantities of three-dimensional seismic and bathymetric data stitched together across thousands of square kilometres.

In the 1980s and early 1990s, this was technologically extremely difficult.

Universities generally lacked:

  • the computing power,
  • data storage,
  • rendering capability,
  • and processing speed

required to integrate these vast offshore datasets into coherent prehistoric landscape models.

Only in the late 1990s and early 2000s did computing technology finally become capable of handling the scale of data required to reconstruct the drowned North Sea plain properly.


3. Geologists and Archaeologists Were Working in Isolation

Perhaps most importantly, the relevant disciplines were not communicating effectively.

Oil geologists viewed the shallow seabed primarily as a barrier obscuring deeper oil-bearing strata.

Archaeologists, meanwhile, understood that prehistoric populations had once occupied areas now submerged beneath the North Sea, but lacked the marine geophysical tools necessary to visualise the landscape itself.

The two fields largely operated independently of one another.

Only in the early 2000s did serious interdisciplinary collaboration begin, combining:

  • offshore seismic data,
  • marine geology,
  • palaeoenvironmental reconstruction,
  • and archaeology

into a unified model of the drowned prehistoric landscape.

By then, Clement Reid had been dead for almost a century.

(Clement Reid, Doggerland, and the Archaeological Establishment)

Doggerland Was Proven by Geology — Not Traditional Archaeology

This is the crucial point often overlooked.

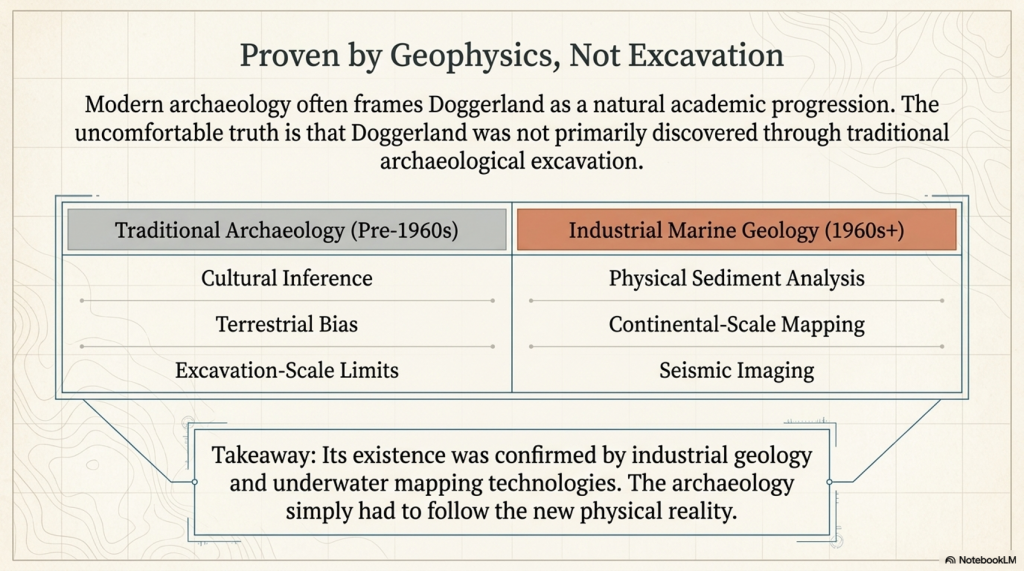
Doggerland was not primarily discovered through excavation in the traditional archaeological sense.

Its existence was confirmed by:

  • marine geophysics
  • industrial seismic imaging
  • offshore geological surveys
  • sediment analysis
  • underwater mapping technologies

The archaeology followed afterwards.

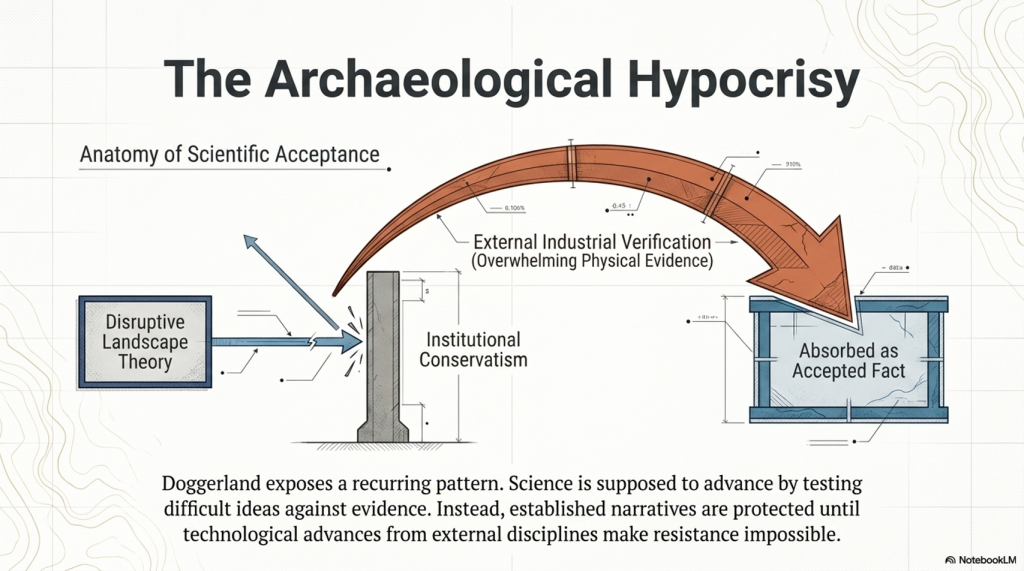
This matters because it reveals an uncomfortable pattern that repeats throughout the history of archaeology:

  1. A disruptive landscape theory is proposed.
  2. It struggles against established narratives.
  3. Independent sciences later produce overwhelming physical evidence.
  4. Archaeology absorbs the new reality as an accepted fact.

Doggerland is therefore not merely a triumph of archaeology.

It is equally a triumph of geology, marine science, and technological surveying.
(Clement Reid, Doggerland, and the Archaeological Establishment)

Silence Is Not the Same as Acceptance

One of the most revealing aspects of Clement Reid’s work is not open hostility, but relative silence.

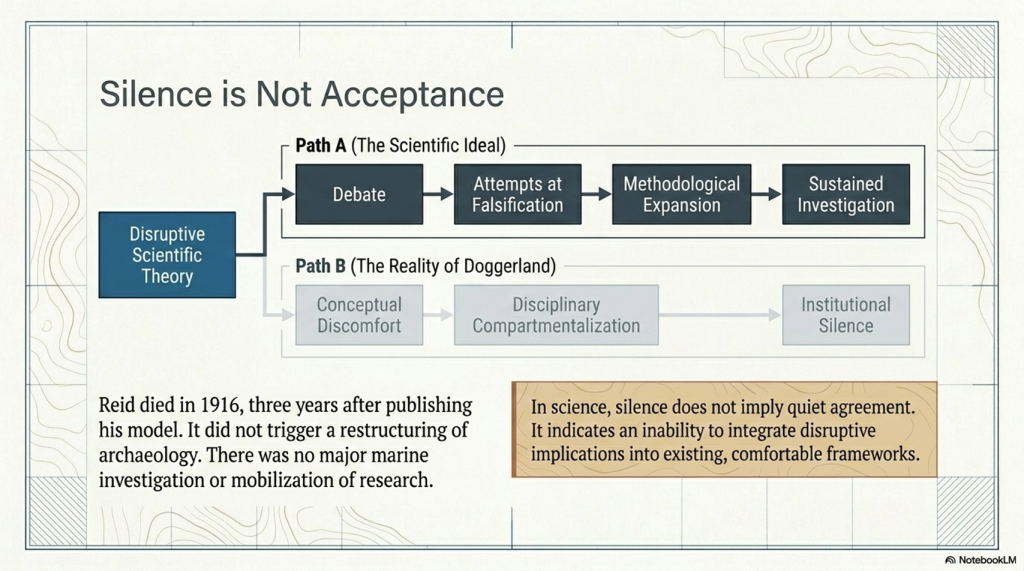
Modern archaeology often gives the impression that Reid’s submerged landscape ideas were gradually and quietly accepted by the scientific world. But in science, silence does not necessarily imply agreement or acceptance.

Quite often, it indicates something very different:

  • conceptual discomfort
  • technological limitation
  • disciplinary compartmentalisation
  • or an inability to integrate disruptive implications into existing frameworks.

If a scientific theory genuinely transforms a discipline, it normally generates:

  • debate
  • criticism
  • attempts at falsification
  • methodological expansion
  • and sustained investigation.

Had Albert Einstein published relativity only for physics to largely ignore it for decades, nobody would argue that relativity had therefore been “quietly accepted.” The opposite conclusion would be drawn — that the scientific world had not yet fully absorbed the implications of the theory.

The same pattern appears in the history of Doggerland.

Reid published Submerged Forests in 1913, the same year he retired from the Geological Survey after a distinguished scientific career. He died only three years later in 1916. During that short remaining period, his drowned landscape model did not trigger a major transformation in archaeology or prehistoric reconstruction.

There was:

  • no large-scale marine investigation programme
  • no major archaeological restructuring around submerged landscapes
  • no widespread mobilisation of prehistoric research into the North Sea basin

Instead, the idea remained scientifically peripheral for decades.

This is important because it suggests that the scientific world of the early twentieth century was not fully equipped — technologically or conceptually — to grasp the scale of what Reid was implying.

He had inferred the existence of a lost prehistoric landscape beneath the North Sea long before the technology existed to visualise it properly.

Only later did:

  • marine geophysics
  • seismic profiling
  • sonar mapping
  • offshore drilling
  • and North Sea oil exploration

Finally, transform Reid’s geological inference into a physically visible drowned world.

In this sense, the muted reception of Reid’s work may itself be evidence of how disruptive and difficult its implications truly were for the scientific establishment of the time to fully comprehend.

(Clement Reid, Doggerland, and the Archaeological Establishment)

The Archaeological Hypocrisy

Today, archaeologists speak with complete confidence about Doggerland.

It appears in textbooks, museums, documentaries, and university lectures as settled science.

Yet very few openly acknowledge that:

  • the original theory existed outside mainstream archaeological thinking
  • the idea was treated cautiously for decades
  • and it was only overwhelming physical evidence from external sciences that forced universal acceptance

This is not how science is supposed to operate.

Science advances by testing difficult ideas against evidence — not by protecting established narratives until technological advances make resistance impossible.

Doggerland demonstrates how institutional conservatism can delay acceptance even when the underlying reasoning is sound.

(Clement Reid, Doggerland, and the Archaeological Establishment)

The Same Pattern Appears Elsewhere

Doggerland is not an isolated example.

The same tendency toward premature certainty recurs throughout archaeology.


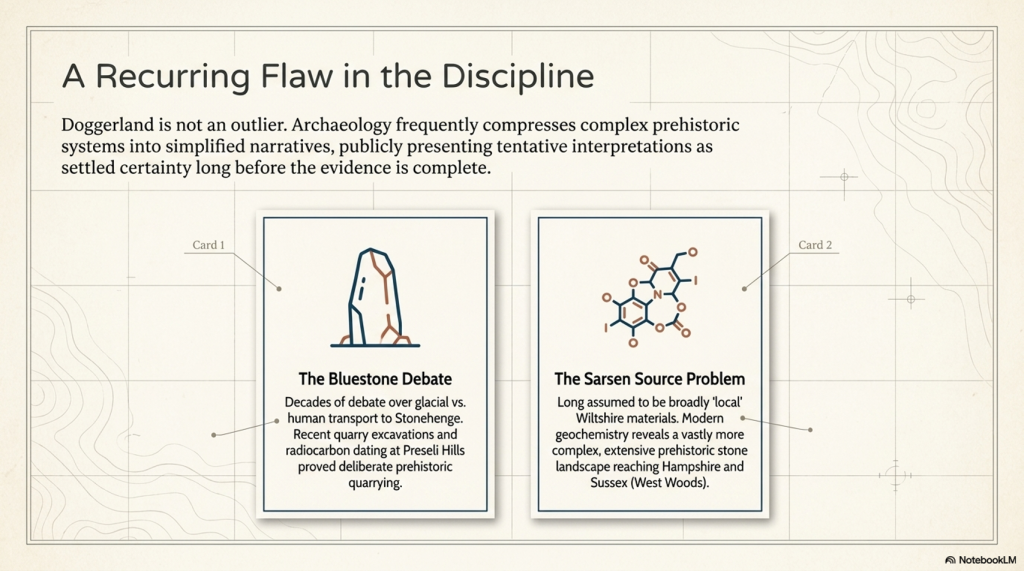
1. The Bluestone Debate

For decades, debate surrounded how the Stonehenge bluestones reached Salisbury Plain.

While their Welsh origin was widely accepted, archaeologists remained divided over whether the stones were deliberately transported by humans or partially carried by glacial processes.

Over time, quarry excavations in the Preseli Hills, associated hearths, and radiocarbon evidence increasingly strengthened the case for deliberate prehistoric quarrying and transport.

The important issue is not that archaeology asks questions — that is, healthy science.

The issue is how tentative interpretations are often presented publicly as settled certainty long before the evidence is complete.


2. The Sarsen Source Problem

For many years, Stonehenge narratives simplified the sarsens as broadly “local” materials derived from nearby Wiltshire landscapes.

More recent geochemical work has considerably complicated that picture.

While West Woods appears to have been a major source of many of the principal stones, the wider sarsen distribution across southern Britain indicates a far more extensive prehistoric stone landscape extending into Hampshire and Sussex.

The significance is not simply geological.

It demonstrates again how archaeology frequently compresses complex prehistoric systems into simplified narratives that later evidence must revise.

Doggerland followed exactly the same trajectory.
(Clement Reid, Doggerland, and the Archaeological Establishment)

3. The Prehistoric Dyke Problem

For generations, large linear earthworks such as:

  • Offa’s Dyke
  • Wansdyke
  • Car Dyke
  • and the Vallum

have been interpreted primarily as defensive or territorial boundaries.

Yet many of these structures display characteristics difficult to reconcile with simple military explanations:

  • inconsistent defensive logic
  • discontinuous alignments
  • relationships with wetlands and floodplains
  • hydraulic behaviour
  • and associations with water-retaining landscapes.

Increasingly, alternative interpretations suggest that at least some of these monumental earthworks may have functioned partly as:

  • canals,
  • water-management systems,
  • transport corridors,
  • or integrated hydrological infrastructure.

The important point is not that traditional archaeology asked questions.

The issue is that defensive interpretations often became entrenched long before large-scale hydrological modelling, lidar analysis, and landscape engineering perspectives were properly integrated into archaeological interpretation.

Once again, the pattern resembles Doggerland:

A landscape system existed physically in front of investigators for generations, yet the underlying functional logic remained poorly understood because the dominant interpretive framework constrained how the evidence was viewed.


4. Hydrology: The Missing Discipline

Perhaps the deepest parallel between Doggerland and wider prehistoric archaeology is hydrology itself.

Doggerland was ultimately misunderstood because archaeology failed to properly integrate changing sea levels, marine landscapes, river systems, and submerged environmental reconstruction into prehistoric interpretation.

But remarkably, a similar problem also appears across terrestrial archaeology.

For much of the twentieth century, archaeology often treated ancient landscapes as though modern drainage conditions broadly reflected prehistoric reality.

Yet post-glacial Britain was radically different:

  • groundwater levels were higher
  • floodplains were wetter
  • wetlands were more extensive
  • chalk aquifers behaved differently
  • rivers occupied larger channels
  • and seasonal inundation transformed movement and settlement patterns.

In many cases, archaeologists interpreted prehistoric structures without fully integrating the hydrological conditions under which they originally operated.

This may have profoundly affected interpretations of:

  • ditches
  • causeways
  • river transport
  • wetland occupation
  • monument placement
  • and large linear earthworks.

The irony is extraordinary.

In Doggerland studies, archaeology initially underestimated the role of marine hydrology and drowned landscapes.

In terrestrial archaeology, it may have simultaneously underestimated inland hydrology and water-dominated land environments.

The same disciplinary weakness appears in reverse.

In both cases, the result was similar:
prehistoric landscapes were interpreted through modern environmental assumptions rather than reconstructed hydrological realities.

(Clement Reid, Doggerland, and the Archaeological Establishment)

Reid’s Other Problem: The Mystery of Rapid Plant Migration

Clement Reid’s importance to prehistoric science extends far beyond Doggerland.

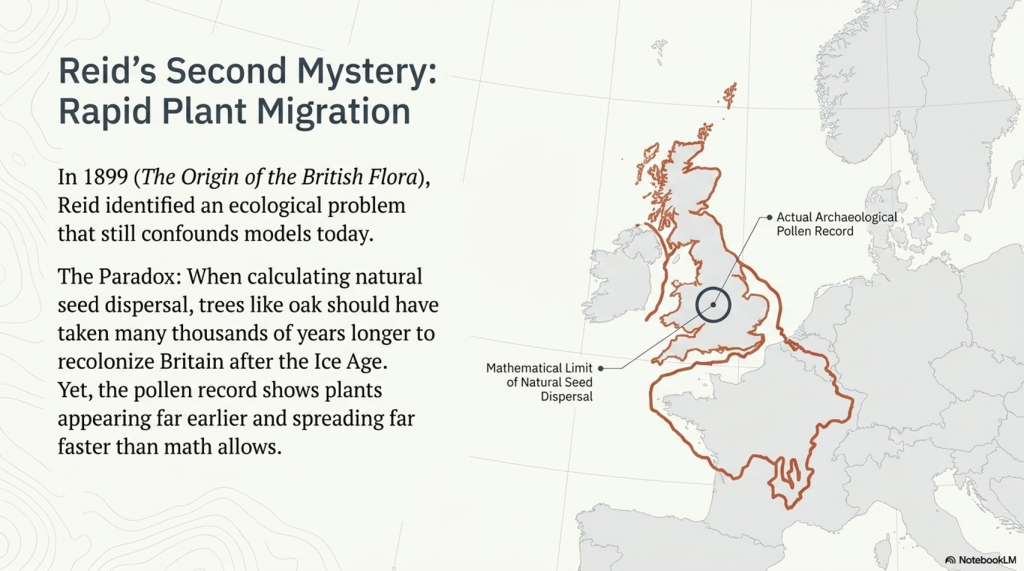
In 1899, more than a decade before Submerged Forests, Reid published another remarkable work: The Origin of the British Flora. Within it, he identified a problem that still challenges ecology today — what later became known as Reid’s Paradox of Rapid Plant Migration.

The paradox is deceptively simple.

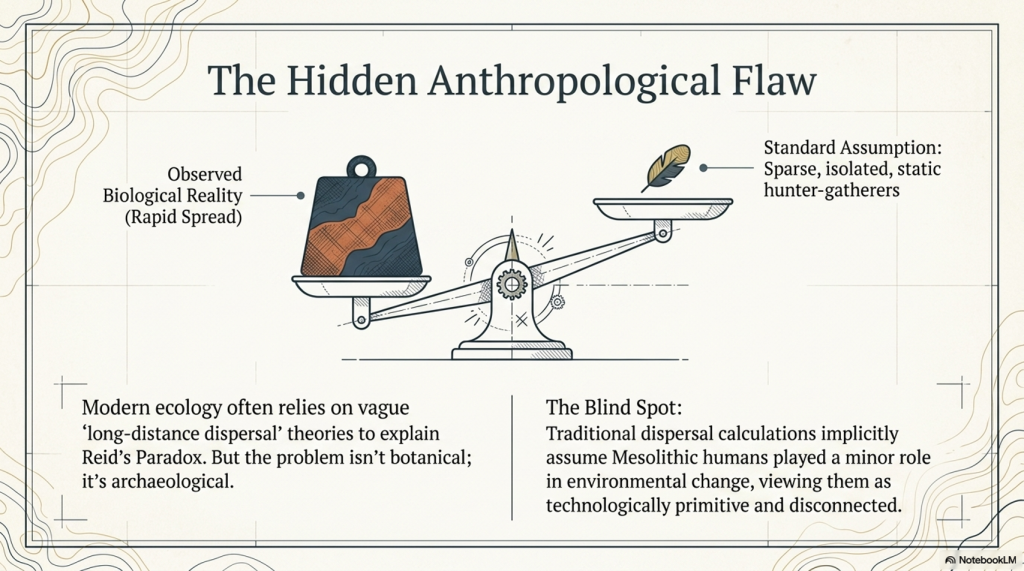
When scientists calculate how quickly plants naturally spread through seed dispersal alone, the results are extremely slow. Trees such as oak should have taken many thousands of years longer to recolonise Britain after the Ice Age than the archaeological and pollen evidence suggests.

Yet across Europe and Britain, plants repeatedly appear far earlier and spread far faster than traditional dispersal models predict.

Even modern ecology still struggles to explain this properly.

The standard explanation usually invokes vague concepts such as “long-distance dispersal,” but this often amounts to little more than admitting that the mathematics and the observed reality do not match.

But what if the problem is not botanical?

What if the problem is archaeological?
(Clement Reid, Doggerland, and the Archaeological Establishment)

The Hidden Assumption Inside Reid’s Paradox

Traditional dispersal models largely assume that prehistoric humans played only a minor role in environmental change.

Implicit within many calculations is an outdated image of Mesolithic people as:

  • sparse populations
  • isolated hunter-gatherers
  • technologically primitive
  • and largely disconnected from one another.

But the growing evidence from Doggerland and post-glacial Britain increasingly points toward something very different.

The Mesolithic world appears to have been highly mobile, river-based, and interconnected.

Once this possibility is introduced, Reid’s Paradox becomes far less mysterious.

(Clement Reid, Doggerland, and the Archaeological Establishment)

Rivers Were the Highways of the Mesolithic World

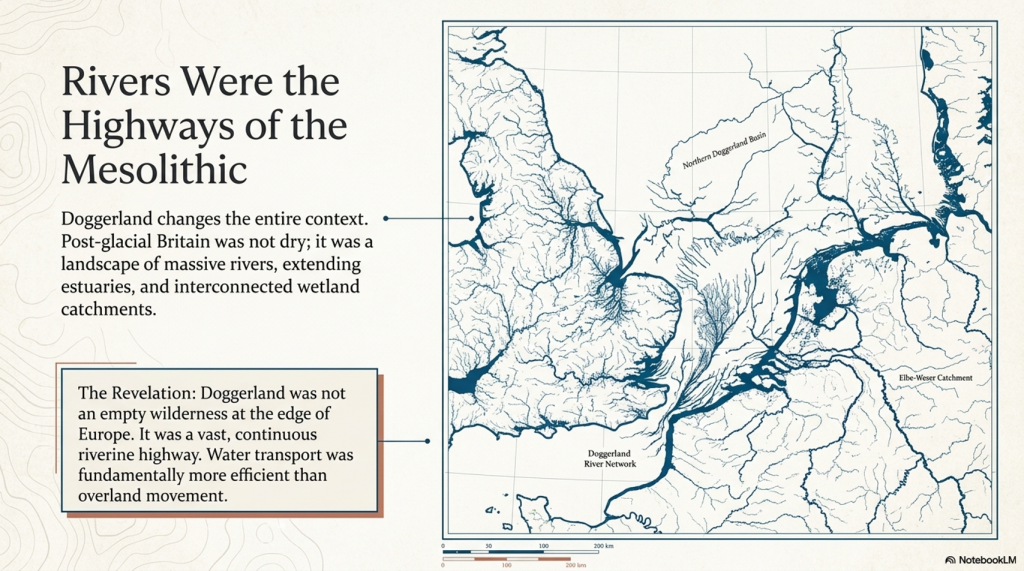
Under post-glacial conditions, Britain was not the dry landscape we know today.

Research into post-glacial hydrology increasingly suggests that:

  • rivers were larger
  • estuaries extended far inland
  • wetlands interconnected catchments
  • and water transport was likely easier and more efficient than overland movement.

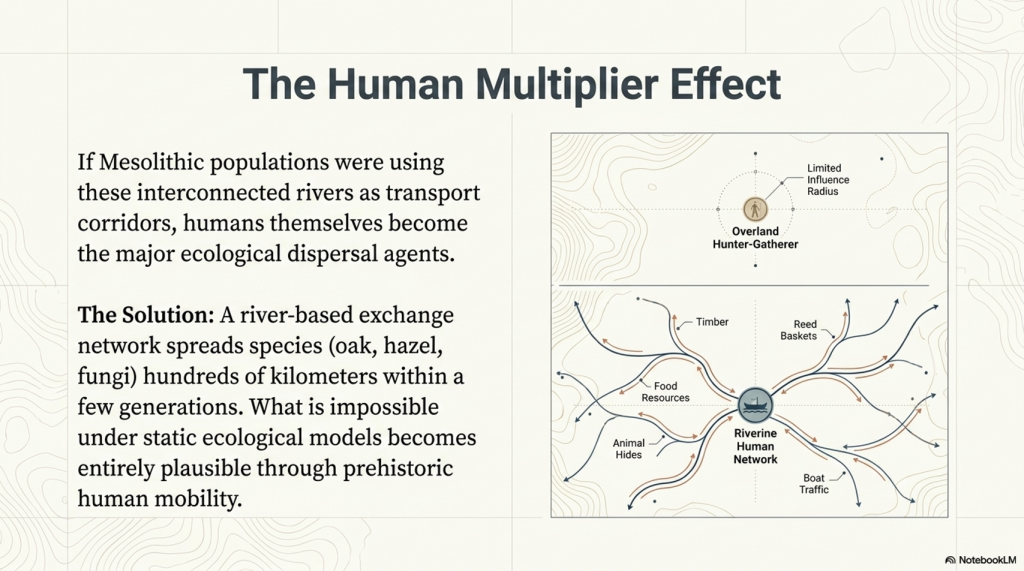
If Mesolithic populations used rivers and coastlines as transport corridors, then humans themselves became major agents of ecological dispersal.

Seeds, spores, and plants could spread through:

  • food transport
  • reeds and basket materials
  • animal hides
  • timber movement
  • boat traffic
  • stored resources
  • and simple repeated human movement along waterways.

The consequences are profound.

A river-based exchange network could spread species hundreds of kilometres within only a few generations — vastly faster than traditional natural dispersal models allow.

What appears impossible under static ecological models becomes entirely plausible once prehistoric mobility is properly considered.


Doggerland Changes the Entire Context

This is where Doggerland becomes critically important.

A connected North Sea plain linking Britain to continental Europe would not merely have allowed human migration — it would have enabled continuous ecological exchange across vast interconnected river systems.

The prehistoric populations living within this landscape may have accelerated the spread of:

  • oak
  • hazel
  • edible plants
  • fungi
  • wetland species
  • and managed woodland environments

far beyond what purely natural dispersal models predict.

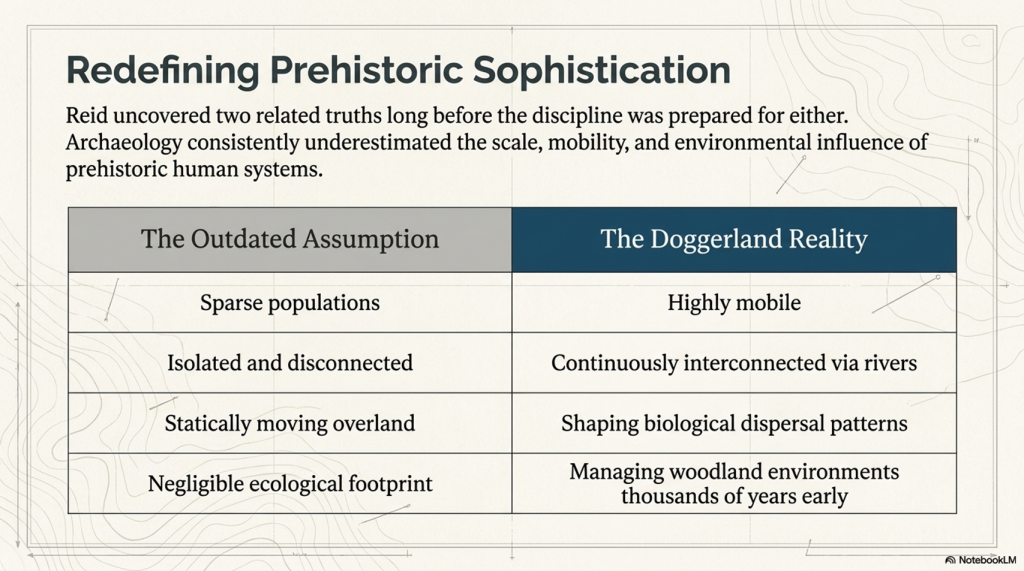
In this sense, Reid may have uncovered two related truths long before archaeology was prepared to accept either of them:

  1. Britain was once connected to Europe by a vast lost landscape.
  2. Mesolithic humans were likely far more mobile, interconnected, and environmentally influential than traditional archaeology once believed.
(Clement Reid, Doggerland, and the Archaeological Establishment)

The Real Lesson

The irony is remarkable.

Clement Reid identified both Doggerland and the plant migration paradox decades before the technologies or archaeological models existed to fully explain them.

In both cases, the underlying issue may have been the same:

Archaeology consistently underestimated the sophistication, mobility, and scale of prehistoric human systems.

Doggerland was not an empty wilderness at the edge of Europe.

It may have been part of a vast interconnected riverine world whose people reshaped landscapes, ecosystems, and biological dispersal patterns thousands of years before conventional history was prepared to recognise it.

(Clement Reid, Doggerland, and the Archaeological Establishment)

Conclusion

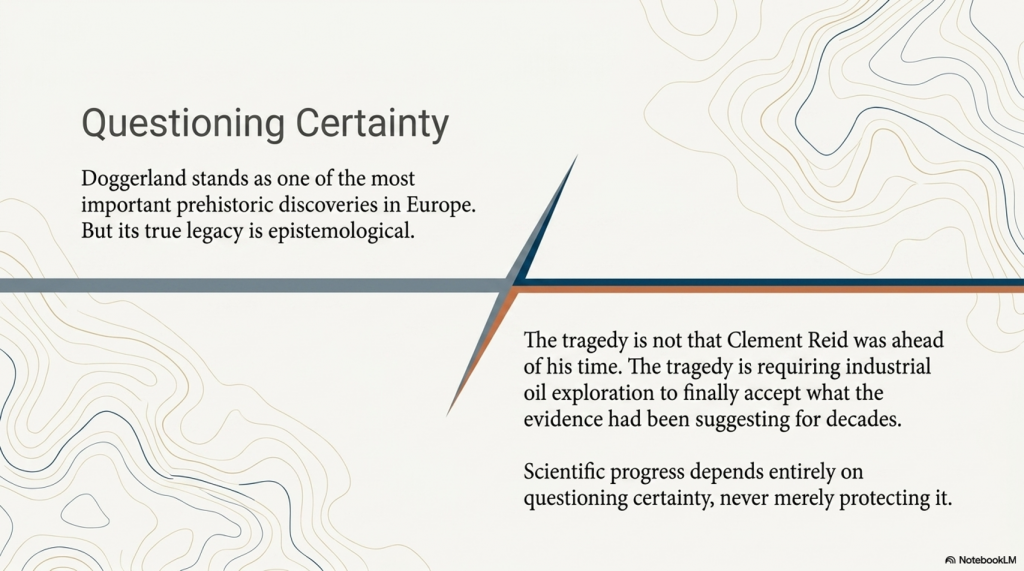
Doggerland now stands as one of the most important prehistoric discoveries in Europe.

But its history should also serve as a warning.

In 1913, Clement Reid proposed that a drowned prehistoric landscape once connected Britain to Europe. His conclusions were treated cautiously and remained outside mainstream archaeological thinking for decades.

Then, half a century later, oil companies searching for hydrocarbons accidentally proved him correct.

The tragedy is not that Reid was ahead of his time.

The tragedy is that archaeology required industrial geology and offshore oil exploration to finally accept what the evidence had already been suggesting for years.

Doggerland should therefore be remembered not only as a lost world beneath the North Sea —

But as a reminder that scientific progress depends upon questioning certainty, not protecting it.
(Clement Reid, Doggerland, and the Archaeological Establishment)

PODCAST

Author’s Biography

Robert John Langdon, a polymathic luminary, emerges as a writer, historian, and eminent specialist in LiDAR Landscape Archaeology.

His intellectual voyage has been interwoven with stints as an astute scrutineer in government and grand corporate bastions, a tapestry spanning British Telecommunications, Cable and Wireless, British Gas, and the esteemed University of London.

A decade hence, Robert’s transition into retirement unfurled a chapter of insatiable curiosity. This phase saw him immerse himself in Politics, Archaeology, Philosophy, and the enigmatic realm of Quantum Mechanics. His academic odyssey traversed the venerable corridors of knowledge hubs such as the Museum of London, University College London, Birkbeck College, The City Literature Institute, and Chichester University.

In the symphony of his life, Robert is a custodian of three progeny and a pair of cherished grandchildren. His sanctuary lies ensconced in the embrace of West Wales, where he inhabits an isolated cottage, its windows framing a vista of the boundless sea – a retreat from the scrutinising gaze of Her Majesty’s Revenue and Customs, an amiable clandestinity in the lap of nature.

Exploring Prehistoric Britain: A Journey Through Time

My blog delves into the fascinating mysteries of prehistoric Britain, challenging conventional narratives and offering fresh perspectives grounded in cutting-edge research, particularly LiDAR technology. I invite you to explore some key areas of my research. For example, the Wansdyke, often cited as a defensive structure, is re-examined in light of new evidence. I’ve presented my findings in my blog post Wansdyke: A British Frontier Wall – ‘Debunked’, and a Wansdyke LiDAR Flyover video further visualises my conclusions.

My work also often challenges established archaeological dogma. I argue that many sites, such as Hambledon Hill, commonly identified as Iron Age hillforts, are not what they seem. My posts Lidar Investigation Hambledon Hill – NOT an ‘Iron Age Fort’ and Unmasking the “Iron Age Hillfort” Myth explore these ideas in detail and offer an alternative view. Similarly, sites like Cissbury Ring and White Sheet Camp receive re-evaluations based on LiDAR analysis in my posts “Lidar Investigation Cissbury Ring through time” and “Lidar Investigation White Sheet Camp,“ revealing fascinating insights into their true purpose. I have also examined South Cadbury Castle, often linked to the mythical Camelot56.

My research also extends to ancient water management, including the role of canals and other linear earthworks. I have discussed the true origins of Car Dyke in multiple posts, including Car Dyke – ABC News Podcast and Lidar Investigation Car Dyke – North Section, which suggest a Mesolithic origin 2357. I also explore the misidentification of Roman aqueducts, as seen in my posts on the Great Chesters (Roman) Aqueduct. My research has also been greatly informed by my post-glacial flooding hypothesis, which has helped explain landscape transformations over time. I have discussed this hypothesis in several posts, including AI now supports my Post-Glacial Flooding Hypothesis and Exploring Britain’s Flooded Past: A Personal Journey

Finally, my blog also investigates prehistoric burial practices, as seen in Prehistoric Burial Practices of Britain and explores the mystery of Pillow Mounds, often mistaken for medieval rabbit warrens, but with a potential link to Bronze Age cremation in my posts: Pillow Mounds: A Bronze Age Legacy of Cremation? and The Mystery of Pillow Mounds: Are They Really Medieval Rabbit Warrens?. My research also includes astronomical insights into ancient sites, for example, in Rediscovering the Winter Solstice: The Original Winter Festival. I also review new information about the construction of Stonehenge in The Stonehenge Enigma.

Further Reading

For those interested in British Prehistory, visit www.prehistoric-britain.co.uk, a comprehensive resource featuring an extensive collection of archaeology articles, modern LiDAR investigations, and groundbreaking research. The site also includes insights and excerpts from the acclaimed Robert John Langdon Trilogy, a series of books that explore Britain during the Prehistoric period. Titles in the trilogy include The Stonehenge Enigma, Dawn of the Lost Civilisation, and The Post-Glacial Flooding Hypothesis, which offer compelling evidence of ancient landscapes shaped by post-glacial flooding.

To further explore these topics, Robert John Langdon has developed a dedicated YouTube channel featuring over 100 video documentaries and investigations that complement the trilogy. Notable discoveries and studies showcased on the channel include 13 Things that Don’t Make Sense in History and the revelation of Silbury Avenue – The Lost Stone Avenue, a rediscovered prehistoric feature at Avebury, Wiltshire.

In addition to his main works, Langdon has released a series of shorter, accessible publications, ideal for readers delving into specific topics. These include:

For active discussions and updates on the trilogy’s findings and recent LiDAR investigations, join our vibrant community on Facebook. Engage with like-minded enthusiasts by leaving a message or contributing to debates in our Facebook Group.

Whether through the books, the website, or interactive videos, we aim to provide a deeper understanding of Britain’s fascinating prehistoric past. We encourage you to explore these resources and uncover the mysteries of ancient landscapes through the lens of modern archaeology.

For more information, including chapter extracts and related publications, visit the Robert John Langdon Author Page. Dive into works such as The Stonehenge Enigma or Dawn of the Lost Civilisation, and explore cutting-edge theories that challenge traditional historical narratives.

Other Blogs

s

t

Digging for Britain – Cerne Abbas

Introduction

In a recent instalment of Digging for Britain, Alice Roberts stirred the archaeological debate by asserting that the Dorset Chalk Giant at Cerne Abbas had Saxon origins rather than prehistoric roots. This added a layer of intrigue, especially from a landscape archaeology perspective. At first glance, the giant’s features appear to echo a much earlier connection, reminiscent of other chalk figures found elsewhere in Britain, where their placement within the landscape suggests a deeper, functional context.

Curiosity led to a closer look at the methods used to date this iconic figure, and the findings raise several important questions. While the programme presents a clear and confident conclusion, a deeper inspection reveals fundamental issues and omissions that call into question its reliability. This is not just about one site but about broader methodological problems in archaeology, particularly the uncritical acceptance of dating approaches that underpin many historical assumptions.

Small trenches for dating evidence

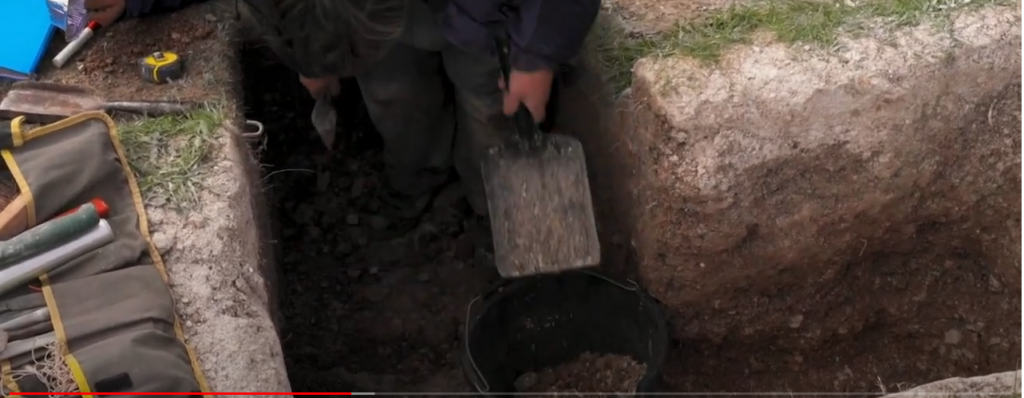
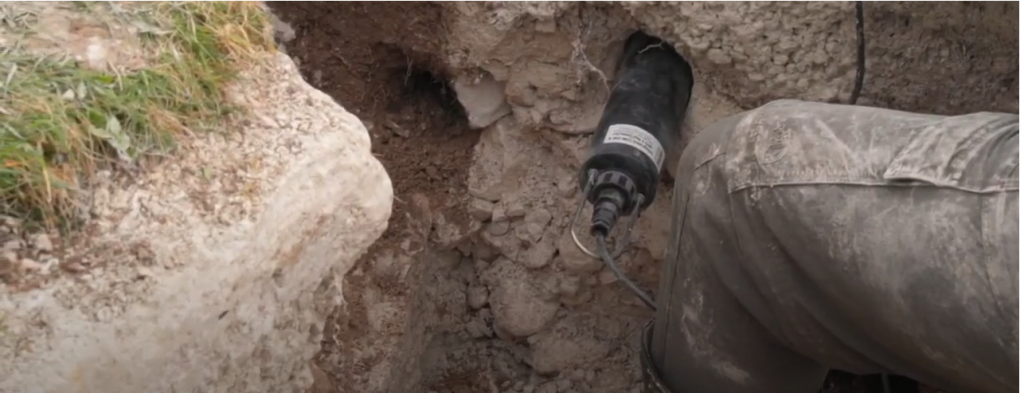
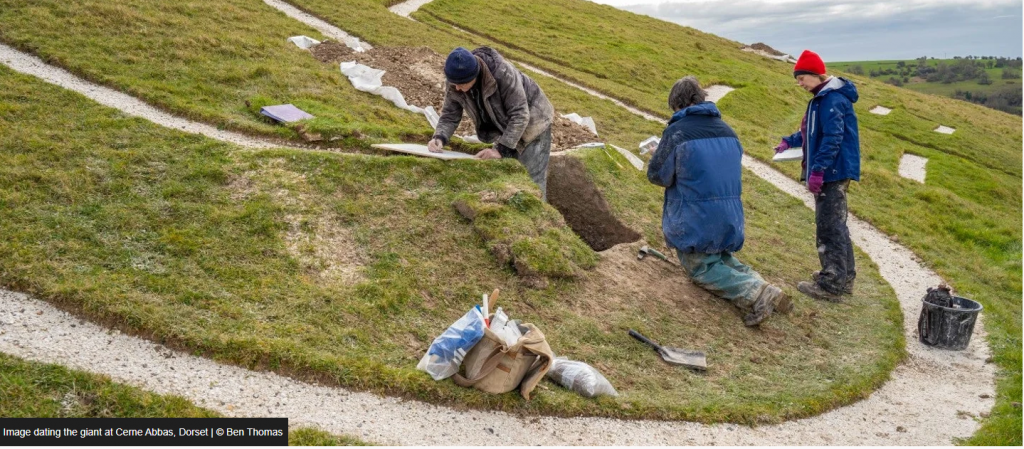
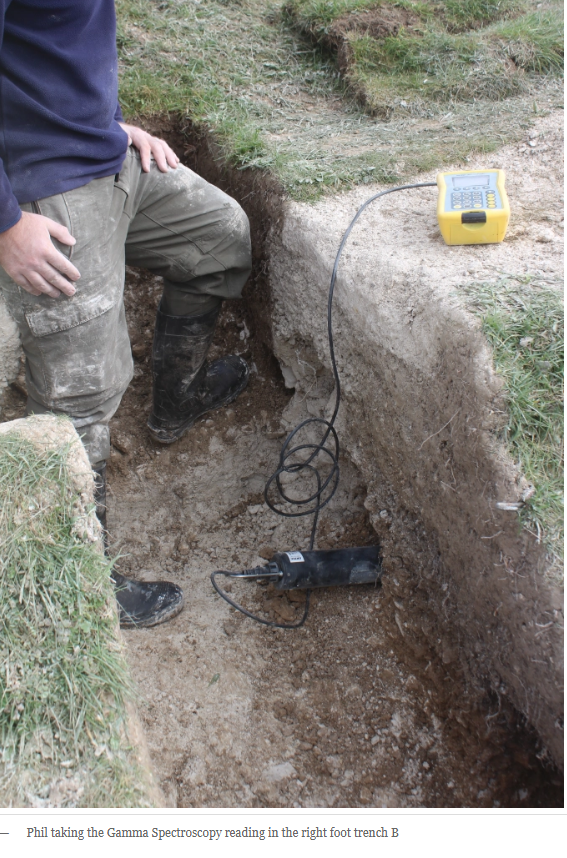
The primary technique involved excavating four small trenches and penetrating approximately 1 m into the topsoil to extract samples. The underlying assumption is that the surface beneath the chalk line represents the original ground level and therefore provides the latest possible date for the figure’s creation. While the theory itself is not unreasonable, the reliance on just four sampling points raises serious concerns about the representativeness of the results.

To fully support such a method, variations across the entire area beneath the figure would need to be taken into account. Limited sampling introduces the risk of missing key variations in the soil and sediment, which could significantly alter the dating outcome. Scientific investigation depends on comprehensive data, and without it, conclusions remain open to question.

 (Digging for Britain - Cerne Abbas)
Snail used to date the chalk figuare

In addition, the programme does not fully explore alternative interpretations or the potential impact of environmental processes on the site. This becomes particularly important when considering evidence from other studies, in which larger datasets have shown a wide range of dates from similar contexts. In one such case, forty-two samples produced dates ranging from the ninth millennium BCE through to the historic period, yet only a subset was used to support the final interpretation. This raises an obvious question about the selection and exclusion of data.

The reliance on a very small number of samples for OSL dating introduces a substantial margin of uncertainty. Across a large area such as this, variation is expected. With such limited data, the resulting data range cannot be considered definitive. The methodology, including how samples are collected and interpreted, does not meet the level of precision expected in modern scientific analysis.

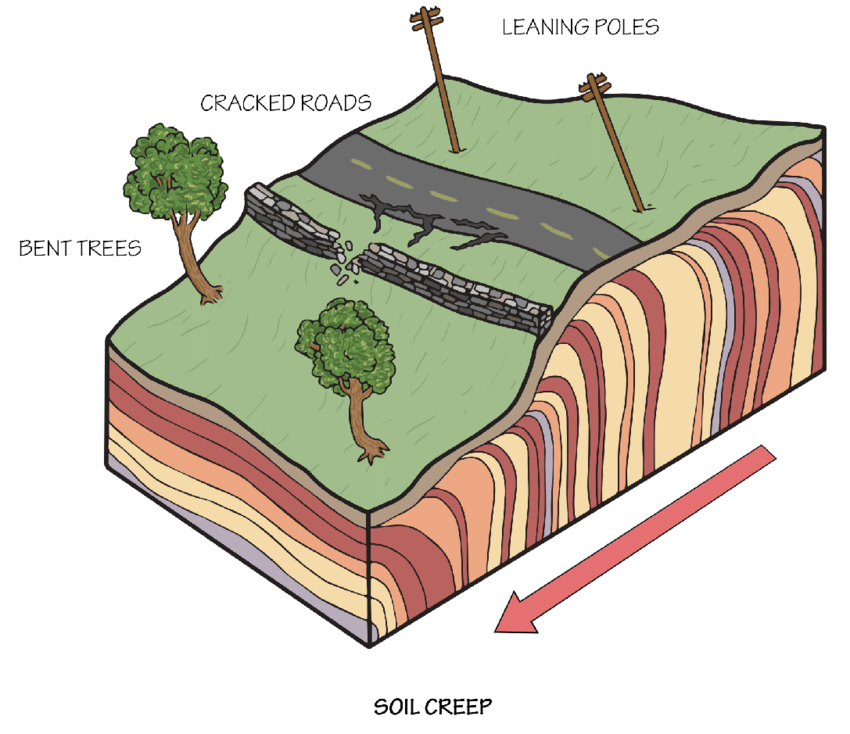
There is also a fundamental geological factor that appears to have been overlooked. The site sits on a steep slope, where soil creep is an ongoing process. Even at a conservative rate, soil can move approximately one metre over a thousand years. This means that materials such as snails and sediments beneath the figure are not necessarily in their original position. Over long periods, they can be displaced downslope, disconnecting them from the original context to which they were dated.

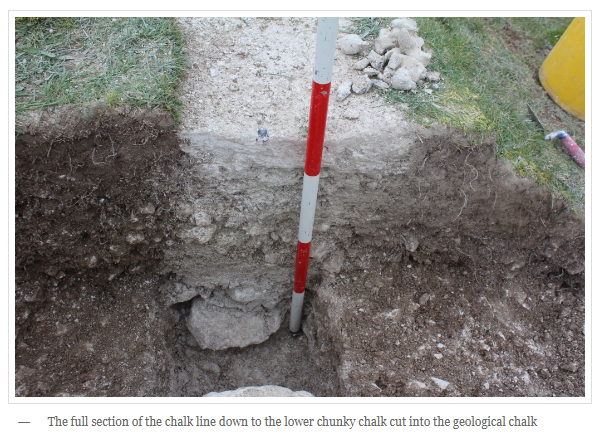
The physical construction of the figure itself also raises questions. The current form sits within topsoil rather than being cut directly into the underlying chalk bedrock. From a practical perspective, a prehistoric construction would be more logically cut into solid chalk to ensure durability and reduce maintenance needs. The fact that the figure requires ongoing upkeep suggests a different history, potentially involving phases of covering and reworking.

 (Digging for Britain - Cerne Abbas)

Historical accounts suggest that subsequent activity may have altered or preserved the figure, raising the possibility that what is visible today is not the original construction. This opens the question of whether an earlier figure existed beneath the current one, potentially modified or replaced at a later date.

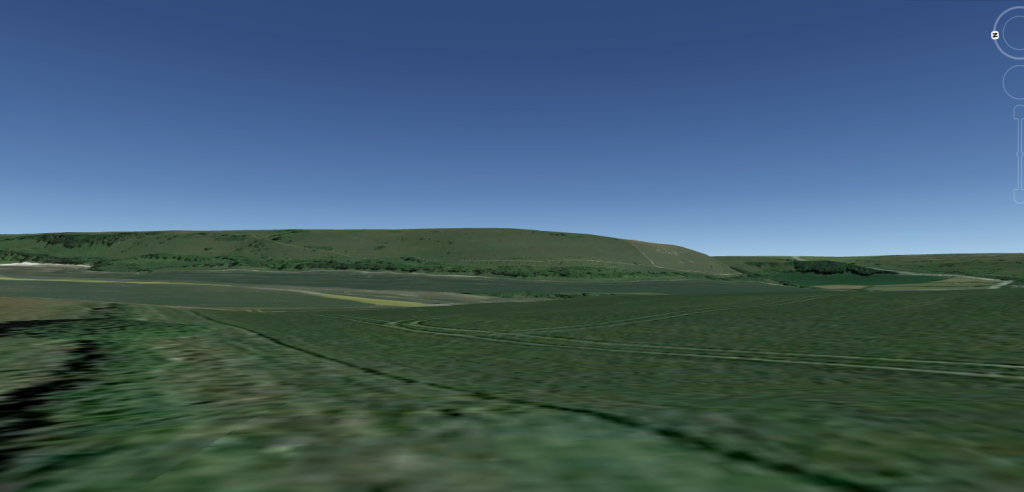
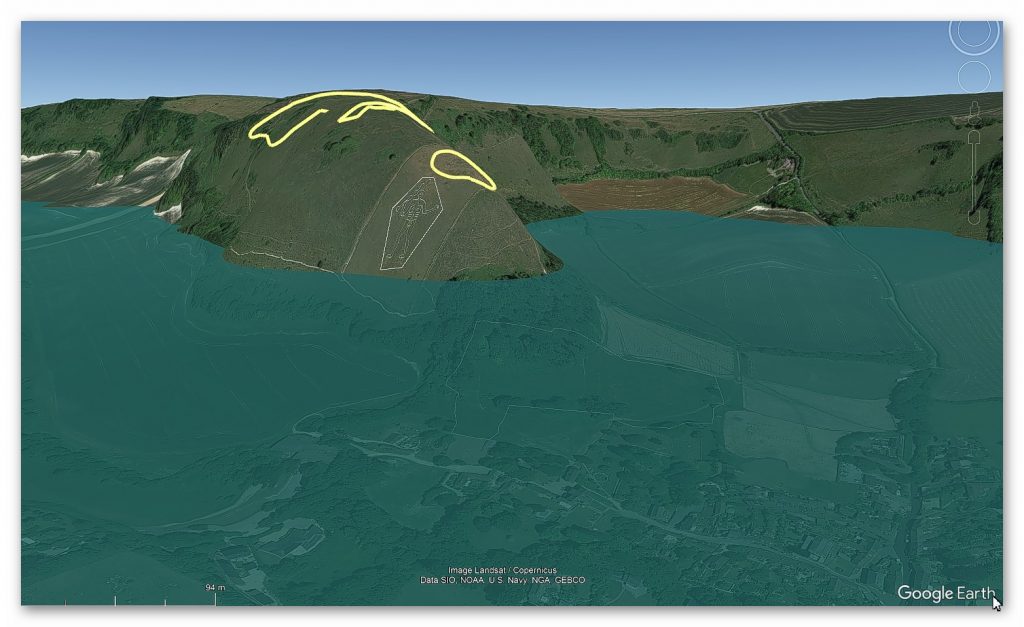
The landscape context adds further complexity. The figure is positioned at the edge of a range of hills rather than at its highest point, and its full form is clearly visible only from elevated viewpoints. This challenges the idea of it functioning as a simple ground-level marker and instead suggests that its placement may relate to a broader landscape system that is no longer immediately visible.

 (Digging for Britain - Cerne Abbas)

When all of these factors are considered together, the conclusion presented in the programme appears far less certain than initially suggested. The evidence does not point to a simple, single-phase construction, but rather to a more complex history influenced by geological processes, environmental change, and possible later modification.

Archaeological interpretation must remain grounded in robust, testable methods. When conclusions rely on limited data, untested assumptions, or incomplete consideration of environmental factors, they risk presenting certainty where uncertainty remains.

 (Digging for Britain - Cerne Abbas)
The current Figuare sits on top of the soil with broken chalk that needs constant maintenance

The Dorset Chalk Giant is not a straightforward case. It is a reminder that understanding the past requires not just data, but careful evaluation of how that data is gathered, interpreted, and applied.

The next stage of analysis will examine the wider landscape using LiDAR data, with the aim of reconstructing how this site functioned in a prehistoric environment and what it may originally have represented.

Digging for Britain - Cerne Abbas
The Giant is to the far right of the Hill Range and near the bottom – why not at the top of the middle if it’s a marker?

Part 2

Now, in this second part, our focus shifts to the professionalism of archaeologists involved in such endeavours and, by extension, the broader state of the archaeological profession in the 21st century. A critical lens is turned towards the National Trust’s excavation efforts, particularly the four trenches dedicated to OSL dating. Despite the extensive timeframe of over two years for this undertaking, the conspicuous absence of an official report raises concerns about transparency and the ability of other knowledgeable individuals to conduct scrutiny. This delay in producing and sharing findings with the wider community calls into question the efficiency and accessibility of archaeological information.

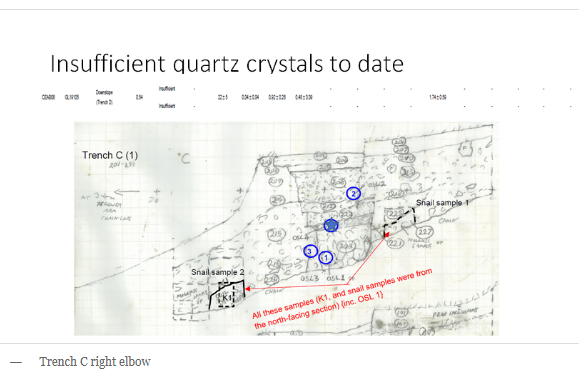
The quality of documentation further comes into question, as hand-drawn cross-sections, seemingly rushed and lacking the meticulous detail expected in rigorous scientific practices, were presented. This not only reveals an apparent ‘back of an envelope’ approach but also underscores a profound oversight by the experts. Despite having two years for scrutiny and examination, critical questions were left unexplored, a shortcoming magnified by the collaboration with the BBC for the televised program.

Digging for Britain Debunked - Cerne Abbas
Digging for Britain Debunked – Cerne Abbas

Cerne Abbas

The absence of a comprehensive and timely report, coupled with the apparent lack of attention to detail in documentation, casts doubt on the thoroughness and professionalism of the archaeological efforts surrounding Cerne Abbas. The urgency to present findings to the media and create a documentary may have compromised the meticulousness required in archaeological endeavours.

This prompts a broader reflection on the state of the archaeological profession itself. The slow pace of report publication, potential gaps in expertise, and a seeming reluctance to subject findings to rigorous scrutiny raise concerns about the discipline’s agility and accountability in contemporary times.

The deficiencies in the excavation process around Cerne Abbas become more apparent when we scrutinise the placement of the trenches and the sampling locations. The hand-drawn illustrations (which I consider ‘outdated’ in an era of affordable, widely available 3D high-definition cameras) indicate that samples were taken from the topsoil just above the chalk bedrock. However, a photograph reveals a more accurate location at the bottom of the topsoil, near the chalk bedrock, leading to the conclusion that it is Saxon.

Digging for Britain Debunked - Cerne Abbas

Poor Conclusions

A critical oversight emerges when we consider the implications of the Saxon date. If accurate, the absence of topsoil dating back thousands of years raises intriguing questions. Three plausible scenarios are explored: the deliberate removal of soil before the construction of Cerne Abbas, the initial absence of soil, or inaccuracies in OSL dating.

Option one, soil removal, implies an intention to obliterate what was originally present, raising logistical questions about the necessity for such an extensive process compared to the simplicity of laying new lines on existing chalk.

Option two speculates on the absence of soil due to something atop the bedrock, a theory we will delve into further.

Option three questions the accuracy of OSL dates, which, if proven, could cast doubt on the entire OSL science.

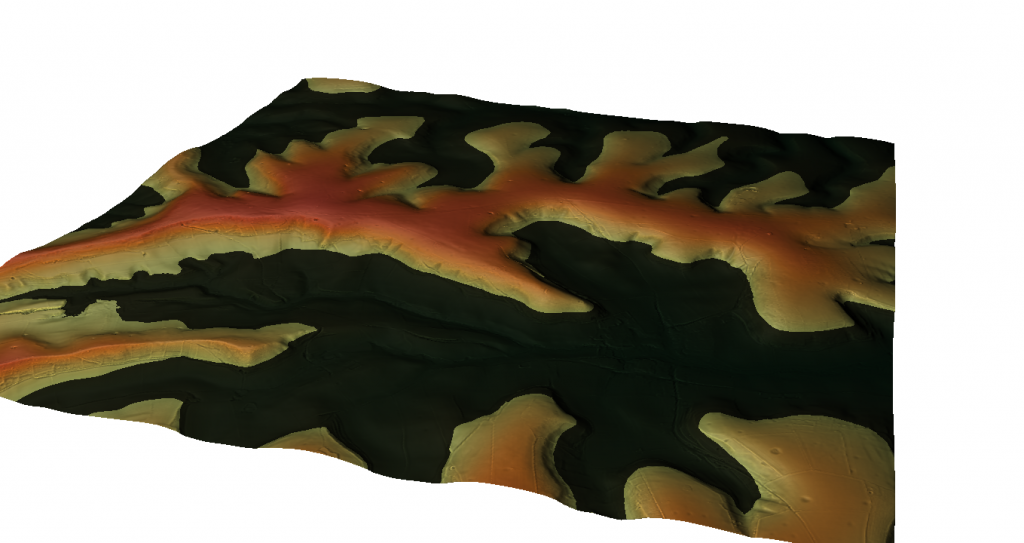
Option two gains credence when exploring the Post-Glacial Hypothesis, which is grounded in the notion of elevated sea levels in prehistoric times. LiDAR imagery of the site reveals a landscape shaped by Mesolithic waters, with identified natural harbours and Neolithic camps indicating the higher historical river levels. Archaeological findings, including tools and earthworks, support the hypothesis that the river running parallel to the figure was significantly higher during the Neolithic period.

Digging for Britain Debunked - Cerne Abbas
Mesolithic Coastline – Digging for Britain Debunked – Cerne Abbas

Prehistoric Landscape

This scenario accounts for approximately 7,000 years with no topsoil in the figure. Examining the bedrock reveals signs of extensive water weathering, consistent with chalk erosion over thousands of years. The excavation report and photographs reveal broken chalk at the base of the topsoil, indicating water-induced erosion and redeposition. The darkened appearance, a result of drying after being broken and re-laid on top, mirrors the common impact of water on solid chalk.

Digging for Britain Debunked - Cerne Abbas
Digging for Britain Debunked – Cerne Abbas

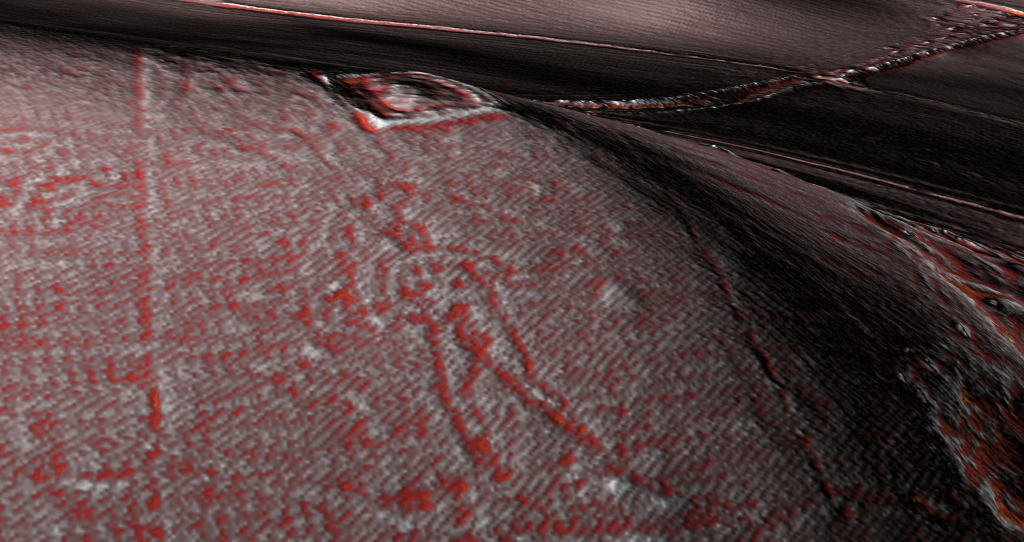
Further evidence points to Post-Glacial Flooding and a Neolithic origin of the figure, which strategically marks the entrance to the harbour. LiDAR maps suggest a man balancing a load on his shoulders or head, potentially representing a trading centre surrounded by quarries and mining pits.

Digging for Britain Debunked - Cerne Abbas
Lidar showing the deep chalk cuttings – Digging for Britain Debunked – Cerne Abbas
Original Cerne Abbas figure according to AI – Digging for Britain Debunked – Cerne Abbas

The intricacies of Cerne Abbas, when viewed through the lens of geological processes and archaeological evidence, unfold a narrative of ancient landscapes shaped by water, a figure emerging from millennia of erosion, and a Neolithic trading hub leaving its mark on the chalky canvas of history.

Long Man of Wilmington

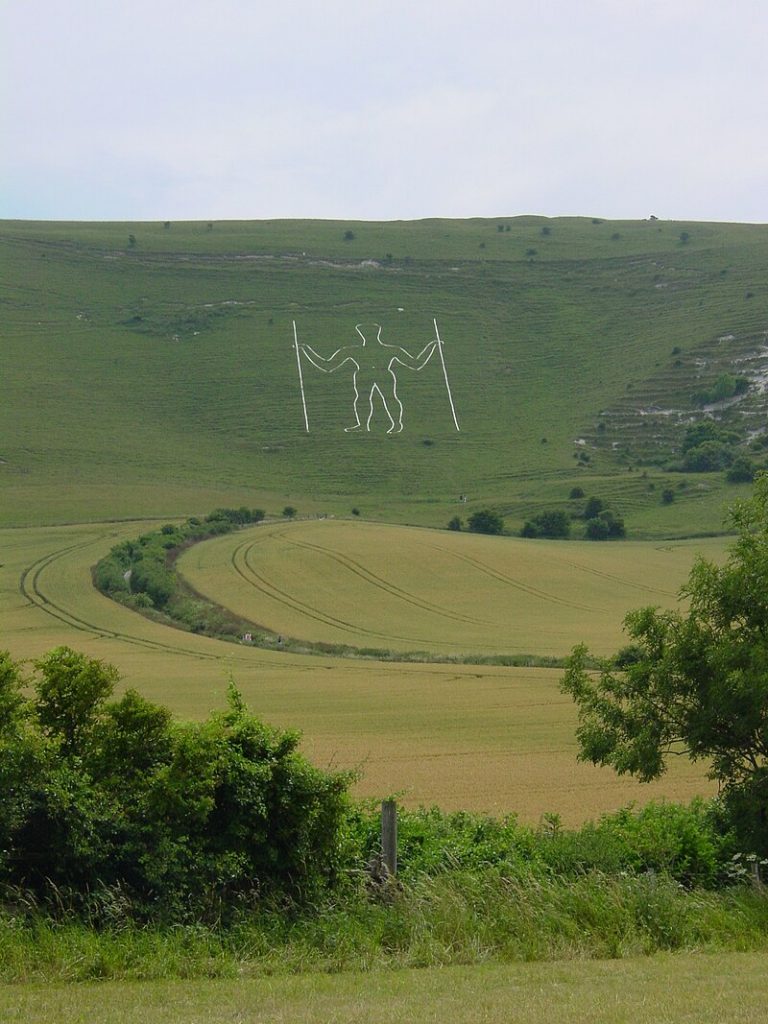
NB. The findings at The Long Man of Wilmington by Prof. Martin Bell show very similar findings and geology as Cerne Abbas –

“Our method was to machine cut a trench at the base of the slope to look at the sediment sequence, then carefully hand excavate an adjoining strip, recording in three dimensions the positions of all artefacts, no matter how modern, in order to date each layer.

At the base of our trench, there were chalk meltwater muds from a time of rapid physical weathering at the end of the last Ice Age. Above these were bowl-shaped features, perhaps tree-throw pits, because they contained land snails from woodland habitats, indicating that this part of the slope had been wooded earlier in the Postglacial. They also contained some flint flakes, so they could be archaeological features.

Over this was a buried soil. Ed Rhodes, formerly of the Research Laboratory for Archaeology at Oxford, now of the Australian National University, has used OSL to date this soil to the mid-2nd millennium BC. The snails show that by this time, the landscape was open. Later in the Bronze Age, the soil was buried by more soil derived from cultivation at the base of the slope. Snails show that the escarpment above was grassland. Many sites on the South Downs show evidence for quite extensive Bronze Age soil erosion. Bronze Age and Neolithic pottery and flints from the basal soil and the colluvium indicate that a settlement was nearby.”

They called the broken chalk we saw in these excavations ‘chalk meltwater muds’, and he is correct, but this kind of deposit can only be produced by thousands of years of water erosion, not a couple of hundred, and his OSL dates confirm this, as just above this level is an OSL date of 2,000 BCE. We have 8,000 years of topsoil missing as the site, like Carne Abbass, was covered with river water, creating another natural harbour – and would you believe it – it also has a Neolithic.

PODCAST

Author’s Biography

Robert John Langdon, a polymathic luminary, emerges as a writer, historian, and eminent specialist in LiDAR Landscape Archaeology.

His intellectual voyage has been interwoven with stints as an astute scrutineer in government and grand corporate bastions, a tapestry spanning British Telecommunications, Cable and Wireless, British Gas, and the esteemed University of London.

A decade hence, Robert’s transition into retirement unfurled a chapter of insatiable curiosity. This phase saw him immerse himself in Politics, Archaeology, Philosophy, and the enigmatic realm of Quantum Mechanics. His academic odyssey traversed the venerable corridors of knowledge hubs such as the Museum of London, University College London, Birkbeck College, The City Literature Institute, and Chichester University.

In the symphony of his life, Robert is a custodian of three progeny and a pair of cherished grandchildren. His sanctuary lies ensconced in the embrace of West Wales, where he inhabits an isolated cottage, its windows framing a vista of the boundless sea – a retreat from the scrutinising gaze of Her Majesty’s Revenue and Customs, an amiable clandestinity in the lap of nature.

Exploring Prehistoric Britain: A Journey Through Time

My blog delves into the fascinating mysteries of prehistoric Britain, challenging conventional narratives and offering fresh perspectives grounded in cutting-edge research, particularly LiDAR technology. I invite you to explore some key areas of my research. For example, the Wansdyke, often cited as a defensive structure, is re-examined in light of new evidence. I’ve presented my findings in my blog post Wansdyke: A British Frontier Wall – ‘Debunked’, and a Wansdyke LiDAR Flyover video further visualises my conclusions.

My work also often challenges established archaeological dogma. I argue that many sites, such as Hambledon Hill, commonly identified as Iron Age hillforts, are not what they seem. My posts Lidar Investigation Hambledon Hill – NOT an ‘Iron Age Fort’ and Unmasking the “Iron Age Hillfort” Myth explore these ideas in detail and offer an alternative view. Similarly, sites like Cissbury Ring and White Sheet Camp receive re-evaluations based on LiDAR analysis in my posts “Lidar Investigation Cissbury Ring through time” and “Lidar Investigation White Sheet Camp,“ revealing fascinating insights into their true purpose. I have also examined South Cadbury Castle, often linked to the mythical Camelot56.

My research also extends to ancient water management, including the role of canals and other linear earthworks. I have discussed the true origins of Car Dyke in multiple posts, including Car Dyke – ABC News Podcast and Lidar Investigation Car Dyke – North Section, which suggest a Mesolithic origin 2357. I also explore the misidentification of Roman aqueducts, as seen in my posts on the Great Chesters (Roman) Aqueduct. My research has also been greatly informed by my post-glacial flooding hypothesis, which has helped explain landscape transformations over time. I have discussed this hypothesis in several posts, including AI now supports my Post-Glacial Flooding Hypothesis and Exploring Britain’s Flooded Past: A Personal Journey

Finally, my blog also investigates prehistoric burial practices, as seen in Prehistoric Burial Practices of Britain and explores the mystery of Pillow Mounds, often mistaken for medieval rabbit warrens, but with a potential link to Bronze Age cremation in my posts: Pillow Mounds: A Bronze Age Legacy of Cremation? and The Mystery of Pillow Mounds: Are They Really Medieval Rabbit Warrens?. My research also includes astronomical insights into ancient sites, for example, in Rediscovering the Winter Solstice: The Original Winter Festival. I also review new information about the construction of Stonehenge in The Stonehenge Enigma.

Further Reading

For those interested in British Prehistory, visit www.prehistoric-britain.co.uk, a comprehensive resource featuring an extensive collection of archaeology articles, modern LiDAR investigations, and groundbreaking research. The site also includes insights and excerpts from the acclaimed Robert John Langdon Trilogy, a series of books that explore Britain during the Prehistoric period. Titles in the trilogy include The Stonehenge Enigma, Dawn of the Lost Civilisation, and The Post-Glacial Flooding Hypothesis, which offer compelling evidence of ancient landscapes shaped by post-glacial flooding.

To further explore these topics, Robert John Langdon has developed a dedicated YouTube channel featuring over 100 video documentaries and investigations that complement the trilogy. Notable discoveries and studies showcased on the channel include 13 Things that Don’t Make Sense in History and the revelation of Silbury Avenue – The Lost Stone Avenue, a rediscovered prehistoric feature at Avebury, Wiltshire.

In addition to his main works, Langdon has released a series of shorter, accessible publications, ideal for readers delving into specific topics. These include:

For active discussions and updates on the trilogy’s findings and recent LiDAR investigations, join our vibrant community on Facebook. Engage with like-minded enthusiasts by leaving a message or contributing to debates in our Facebook Group.

Whether through the books, the website, or interactive videos, we aim to provide a deeper understanding of Britain’s fascinating prehistoric past. We encourage you to explore these resources and uncover the mysteries of ancient landscapes through the lens of modern archaeology.

For more information, including chapter extracts and related publications, visit the Robert John Langdon Author Page. Dive into works such as The Stonehenge Enigma or Dawn of the Lost Civilisation, and explore cutting-edge theories that challenge traditional historical narratives.

Other Blogs

s

t

Troy Debunked – Troy did not exist in Asia Minor, but in fact, the North Sea island of Doggerland

Introduction

Troy, Atlantis — and the North-West European Connection

The search for Atlantis has always felt like chasing a shadow on the edge of history. Yet the deeper I read, the more the shadow begins to take shape — and not in the Mediterranean.

What if both Atlantis and Troy belonged not to the eastern Mediterranean, but to the lost landscapes of north-west Europe?
That suggestion is not as wild as it first sounds.(Troy Debunked – Troy did not exist in Asia Minor)

Plato Was Not Writing Fantasy

The Atlantis story comes to us through Plato, primarily in Timaeus and Critias. The account was said to have been passed from Egyptian priests at Sais to Solon around 590 BCE, and from Solon down to Plato’s own family line.

Now, here is the uncomfortable point for mainstream thinking: Plato was not a myth-maker in the modern sense of the term. His works are studied in the world’s leading universities for their philosophical depth. Aristotle, his student, did not dismiss Atlantis as an invention. Nor did thinkers such as Theophrastus or Poseidonios. Several ancient writers treated Atlantis as a historical tradition.

(Troy Debunked - Troy did not exist in Asia Minor)
Plato and Aristotle – (Troy Debunked – Troy did not exist in Asia Minor)

If Plato intended pure allegory, it is strange that later classical authors debated its geography rather than dismissing it outright.

The Egyptian connection is particularly important. Sais was said to hold records carved on sacred pillars — records describing a great civilisation destroyed by a deluge. That word alone — deluge — should make us pause. Nearly every ancient culture preserves a flood memory. If prehistoric societies were heavily maritime, boats would have been survival tools. Flood traditions and seafaring cultures go hand in hand.

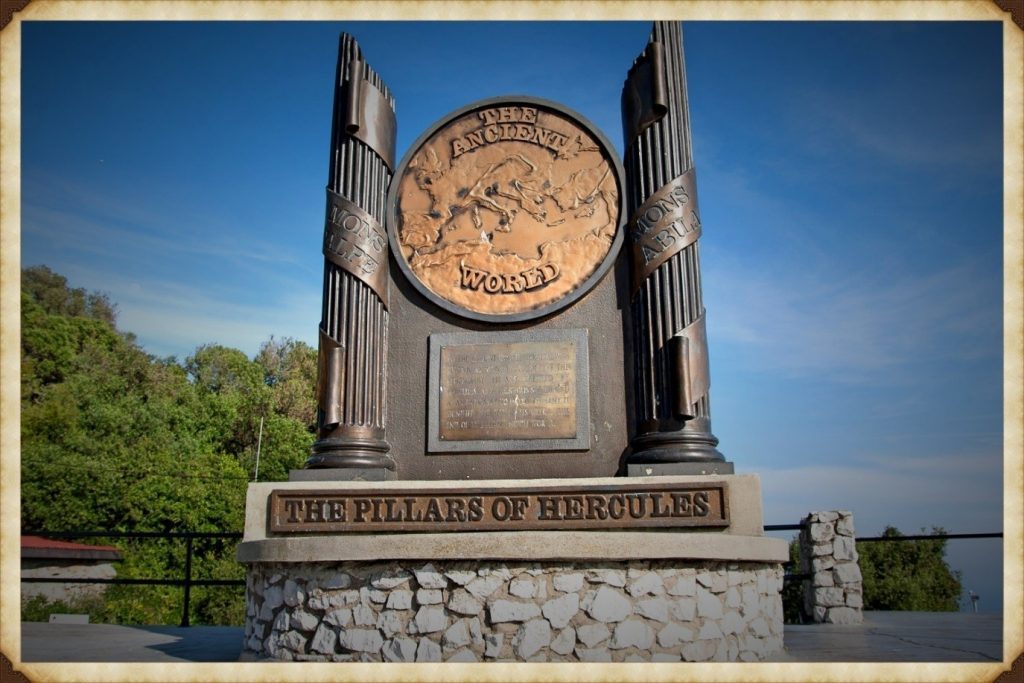
The Pillars of Hercules — A Directional Clue

Plato situates Atlantis beyond the “Pillars of Hercules.” The conventional interpretation places these at the Straits of Gibraltar.

But Plato’s terminology is fluid. “Mouth” can mean “strait.” He refers to the Mediterranean as being “within the straits,” suggesting a perspective looking outward — not inward.

If Atlantis lay beyond the Pillars, then by definition it was Atlantic.

(Troy Debunked - Troy did not exist in Asia Minor)

Even the name survives in geography: the Atlantic Ocean.

Critics argue that Atlantis was said to be “larger than Libya and Asia together.” But Libya in Plato’s time referred only to North Africa west of Egypt, and “Asia” generally meant Asia Minor — modern Turkey. Combined, they are not vast in comparison to the landmass that once connected Britain to Europe during lower sea levels.

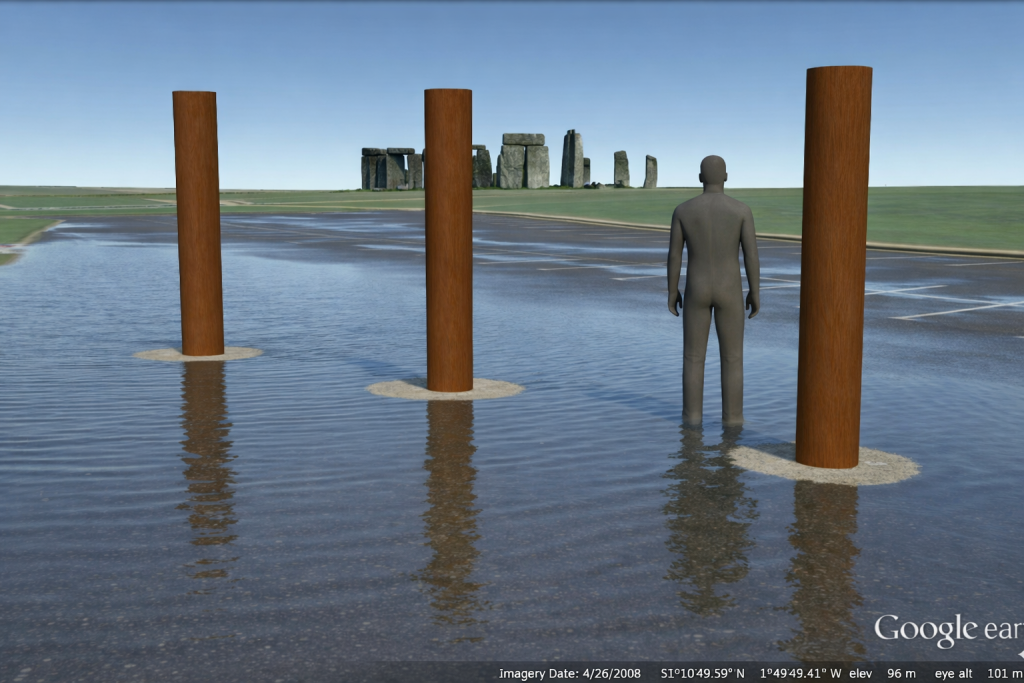
At the end of the last Ice Age, sea levels were dramatically lower. The North Sea was not sea — it was land. We now call it Doggerland. Britain was not an island. It was a peninsula of a much larger north-west European landmass.

If that land later drowned beneath rising seas, Plato’s description of a powerful Atlantic civilisation destroyed by water suddenly becomes less mythical and more geological.

Island — or Peninsula?
Another linguistic trap lies in the word “island.” In the ancient world, the term could describe large peninsulas or territories bordered by water on multiple sides. If Atlantis was a north-west European peninsula connected to Britain and continental Europe, it could still fit the description.

And if we look at that Ice Age landscape — stretching from eastern Britain through the Low Countries and into Scandinavia — we have a region that easily exceeds the size comparison Plato gives.

The Circular Capital

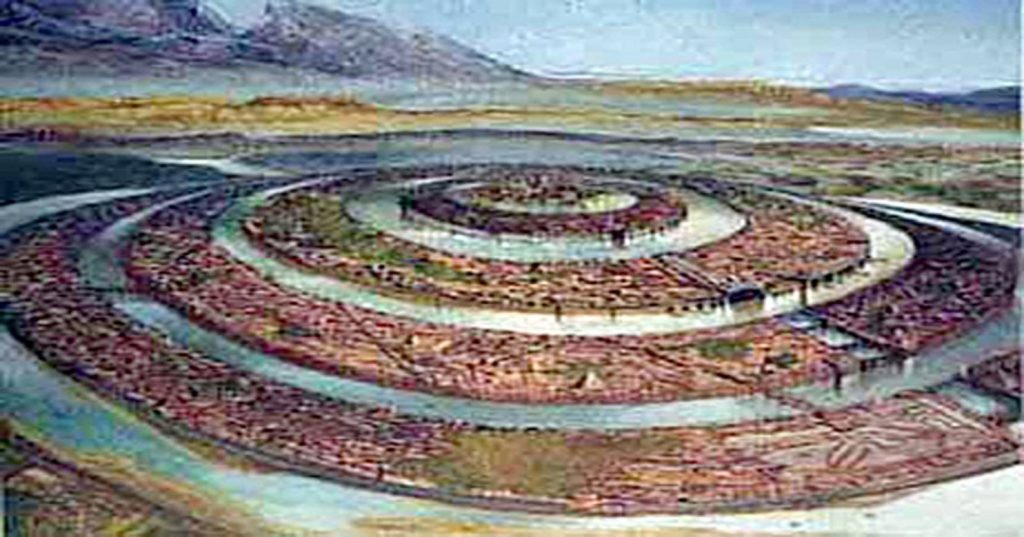
Plato describes Atlantis’ central city as formed in concentric rings of earth and water.

Now consider this: Neolithic Europe is filled with circular earthworks — causewayed enclosures, henges, and ringed settlements. Whitehawk Camp in Sussex, for example, once displayed multiple circular ditches and banks. Similar circular designs occur across Britain and northern Europe.

(Troy Debunked - Troy did not exist in Asia Minor)

These are not Mediterranean urban forms.

They are north-west European.

Even more intriguing are the turf mazes scattered across England and the Isles of Scilly — many named “Troy Town” or “The City of Troy.” These labyrinths follow the classical pattern seen on coins from Knossos, linking the labyrinth myth and Troy. Why do so many northern European earthworks preserve Troy in their naming tradition?

Coincidence?

Or cultural memory?

The People of Homer

Then we come to something even more uncomfortable.

In Homer’s epics, the Achaeans — the supposed Greeks — are frequently described as blond, red-haired, or light-skinned. Menelaus is repeatedly called “blond.” Achilles is described with yellow hair. Odysseus is described in terms that imply light or reddish colouring. Helen is “white-armed,” “fair-tressed,” luminous.

Even the gods — Zeus, Athena, Apollo, Aphrodite — are repeatedly described as blue-eyed or golden-haired in ancient sources.

(Troy Debunked - Troy did not exist in Asia Minor)
“he was blond “and seized the son of Peleus by his yellow hair” (I:197). – (Troy Debunked – Troy did not exist in Asia Minor)

This is not a Mediterranean phenotype.

Now, it is dangerous to oversimplify ancient descriptions, but the repeated emphasis on fair hair and light features is striking. If the Homeric tradition preserves older northern memories, then the epic heroes may reflect populations from farther north.

What if the poems travelled south, rather than originating there?

Troy and the North Sea

The idea that Troy lay in north-west Europe has been proposed before. Iman Wilkens argued for a British location. Others suggested links to the North Sea basin. While these ideas have been dismissed by mainstream scholarship, geological evidence now confirms that Doggerland existed — and drowned — between 10,000 and 6,000 BCE.

We know that vast prehistoric landscapes lie submerged beneath the North Sea. We know that rising waters displaced populations. We know that maritime networks existed far earlier than once believed.

(Troy Debunked - Troy did not exist in Asia Minor)
Odysseus -This “hyacinth colour” is, however, as Wilhelm Sieglin has shown, to be described as “reddish” because the hyacinth was cultivated in Hellas as a sub-type with reddish blooms.- (Troy Debunked – Troy did not exist in Asia Minor)

If a powerful Atlantic civilisation flourished on that land — and was later lost to the sea — the memory of it could have travelled.

Plato speaks of Atlantis fielding twelve hundred ships.

The Trojan War tradition speaks of a thousand ships.

Both traditions centre on maritime coalitions and northern powers confronting southern territories.

The parallels are uncomfortable — but they exist.

The Larger Pattern

Let us step back.

We have:

• A flood-destroyed Atlantic civilisation described by Plato
• A lost North Sea landmass proven by geology
• Circular monumental architecture concentrated in northern Europe
• Troy-named labyrinths across Britain
• Homeric heroes repeatedly described with northern physical traits
• Persistent ancient belief that Troy and Atlantis were historical, not fictional

Individually, each point can be dismissed.

Collectively, they form a pattern.

Is this definitive proof?

No.

(Troy Debunked - Troy did not exist in Asia Minor)
Zeus – King of the gods – he was the father of both Helen and Athena, both blue-eyed blondes – (Troy Debunked – Troy did not exist in Asia Minor)

But it is far more than a coincidence.

If Atlantis was north-west Europe — if Troy belonged not to Anatolia but to a lost Atlantic world — then the centre of early European civilisation shifts dramatically.

And perhaps the reason these traditions feel mythical is not because they were invented…

…but because the land they describe now lies beneath the sea.

Where Troy Once Stood

Where Troy Once Stood (Troy – Debunked) is a book by Iman Wilkens that argues that the city of Troy was located in England and the Trojan War was fought between groups of Celts. The standard view is that Troy is located near the Dardanelles in Turkey. Wilkens claims that Homer’s Iliad and Odyssey, though products of ancient Greek culture, is originally orally transmitted epic poems from Western Europe. Wilkens disagrees with conventional ideas about the Iliad’s historicity and the location and participants of the Trojan War.

Copies of his book ranked high on BookFinder’s list of most wanted out-of-print books until 2005, when the latest revised edition was published. His work has had little impact among professional scholars. Anthony Snodgrass, Emeritus Professor in Classical Archaeology at Cambridge University, has named Wilkens as an example of an ‘infinitely less-serious’ writer.

Troy Debunked - traditional view showing the short distance between the two waring groups
Traditional view showing the short distance between the two warring groups – Troy Debunked

So, what evidence does Wilkens use to prove that Troy was in Northern Europe?

Wilkens argues that Troy was located in England on the Gog Magog Downs in Cambridgeshire. He believes that Celts living there were attacked around 1200 BCE by fellow Celts from the continent to battle over access to the tin mines in Cornwall as tin was an essential component for bronze production.

Wilkens writes that there are similarities between the river names in the Iliad and in present-day England: “Homer names no less than fourteen rivers in the region of Troy.” The rivers Thames, Cam, Great Ouse and Little Ouse, to name a few, can respectively be identified as Temese, Scamander, Simois and Satniois, according to Wilkens. The revised edition of 2005 contains a ‘reconstruction’ of the Trojan battlefield in Cambridgeshire.

Wilkens further hypothesises that the Sea Peoples found in the Late Bronze Age Mediterranean were Celts, who settled in Greece and the Aegean Islands as the Achaeans and Pelasgians. They named new cities after the places they had come from (similar to the migration of many place names to North America) and brought the oral poems that formed the Iliad and the Odyssey with them from Western Europe. Wilkens writes that, after being orally transmitted for about four centuries, the poems were translated and written down in Greek around 750 BCE.

The Greeks, who had forgotten about the origins of the poems, located the Mediterranean’s stories, where many Homeric place names could be found, but the poems’ descriptions of towns, islands, sailing directions and distances were not altered to fit the reality of the Greek setting. He also writes that “It also appears that Homer’s Greek contains a large number of loan words from western European languages, more often from

Dutch rather than English, French or German.” These languages are considered by linguists to have not existed until around 1000 years after Homer.

Wilkens argues that the Atlantic Ocean was the theatre for the Odyssey instead of the Mediterranean. For example, he locates Scylla and Charybdis at present-day St Michael’s Mount.

To prove his theory Wilkens produces archaeological evidence, for instance, the Isleham Hoard in the battlefield, and etymological evidence, for instance, the location of Ismaros in Brittany at Ys or the location of Homer’s Sidon at Medina Sidonia in Spain. He also brings forth indications that Homer described areas around the Atlantic with distinctive topographical features.

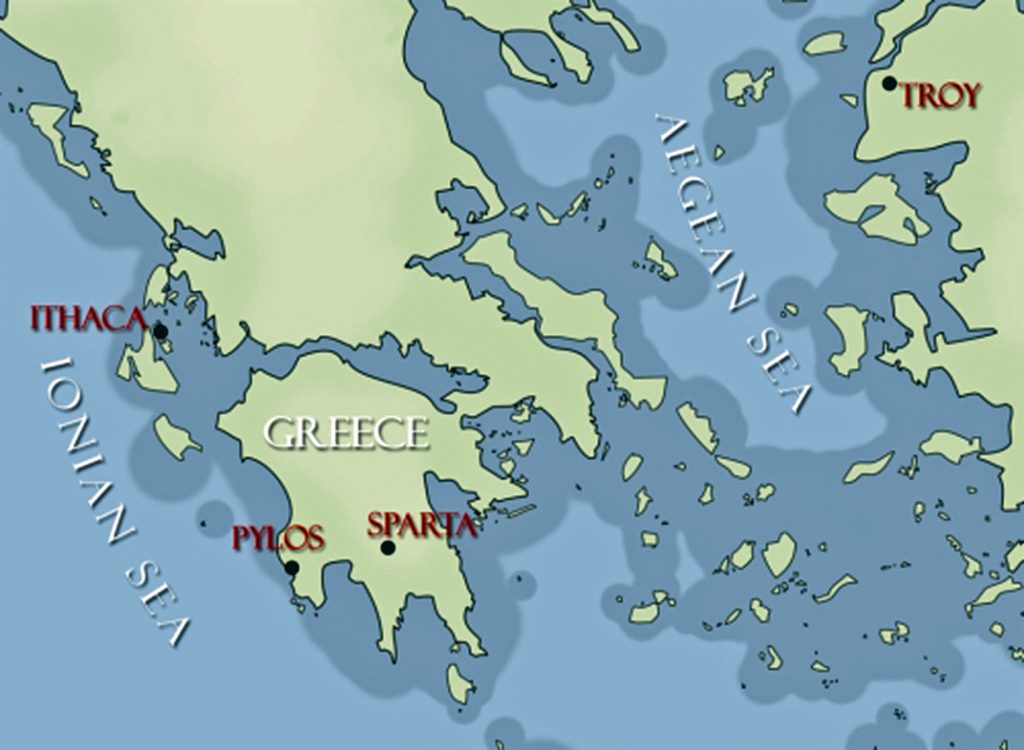
Cádiz would match Ithaca’s description; There is in the land of Ithaca a particular harbour of Phorcys, the older man of the sea, and at its mouth two projecting headlands sheer to seaward, but sloping down on the side toward the harbour…

Wilkens believes that Havana’s topography much resembles the description of Telepylos: The harbour, about which on both sides, a sheer cliff runs continuously, and projecting headlands opposite to one another stretch out at the mouth, and the entrance is narrow, …, and the ships were moored within the hollow harbour, for therein no wave ever swelled, great or small, but all about was a bright calm……

Troy Debunked  - Map of the rivers contained within the Iliad
Map of the rivers contained within the Iliad – Troy Debunked

Wilkens mentions several sources for his ideas. Belgian lawyer Théophile Cailleux wrote that Odysseus sailed the Atlantic Ocean, starting from Troy, which was situated near the Wash in England (1879).  Charles-Joseph de Grave thought that the historical and mythological background of Homer’s work should be sought in Western Europe (1806).

However, this is not the only source that shows the story could be of a different origin.  The late Sir Moses Finley, Professor of Ancient History at the University of Cambridge, concluded that ‘we are confronted with this paradox and that the more we know; the ‘worse off, we are’ and he, therefore, suggested that ‘Homer’s Trojan War must be evicted from the history of the Greek Bronze Age’. As it seems complicated to disagree with his conclusion, we are, in my view, left with only two options: the great Trojan War never took place in northwest Turkey and consequently; the Iliad is the fruit of pure imagination, or else; the war did take place but in another country.

Troy Debunked - according to Wilkens, St michael's mount is the site of Scylia and Charybdis
According to Wilkens, St michael’s mount is the site of Scylia and Charybdis – – Troy Debunked

And Professor P H Damste (Universities of Utrecht and Leuven) “Valuable knowledge is to be discovered about the people of the Northwest European coast around 1 200 BCE, how they navigated the oceans and a great war between the Kings of continental Europe and the Trojan king in England, who held a monopoly of tin-mining in Cornwall. Such information is encoded in the Iliad and Odyssey.”

And other facts show that the story may not be as straight forward as we once imagined, for when we look at Northern Europe for signs of Troy, we get some interesting facts such as an old legend that Britain was founded by Brutus, who led survivors from Troy here. Geoffrey of Monmouth wrote in his Historia Regum Britanniae an origin myth that traced the foundation of Britain back to the Trojans.  This account described how Brutus, great-grandson of Troy’s Aeneas, landed at Totnes, subdued the race of giants who lived there and gave his name to the country he had pacified (Britain = Brutus).

The Romans called the Celtic tribe that occupied this part of Essex the Trinovantes or ‘Trinovante’, which means New Troy or Troy of New.

The Baltic Origins of Homer’s Epic Tales is an essay written by Felice Vinci, a nuclear engineer and amateur historian, published for the first time in 1995. The book, translated into several languages, submits a revolutionary idea about the Iliad and Odyssey’s geographical setting. Felice Vinci started reading Greek classics and learned about a passage from the De facie quae in orbe lunae apparet, by Plutarch, which points out the location of Ogygia. This island became the point of departure of Vinci’s theory.

According to his assumptions, the events told by Homer did not take place in the Mediterranean area, as the tradition asserts, but rather in the seas of Northern Europe, the Baltic Sea and Northern Atlantic. This theory has been widely considered (both in Italy, where the author has been invited to present it in some universities and high schools and the rest of the world) and has caused heated debate among the academic community.

Troy Debunked - 'Trinovante', which means New Troy or Troy of New.
‘Trinovante’, which means New Troy or Troy of New – Troy Debunked

According to Vinci, the Achaeans would have lived at the beginning of the 2nd millennium BCE on the coasts of the Baltic Sea and, towards the middle of the millennium, as the climate grew harsher, they would have moved southward along the Dnepr, reaching the Black and Aegean Seas. The newcomers would have founded the Mycenaean cities (the most ancient Mycenaean graves are rich in amber, a typical Baltic product, whereas the latest ones are not) and would have named them with the names of their previous settlements in Scandinavia, although not precisely in correspondence of their location, because of the physical differences between the two areas.

During their migration, they would have brought their traditional oral tales, poetic sagas set in their original homeland. Therefore, the Trojan War would not have occurred around the 13th century BCE, as is usually thought, but around the 18th century BCE. Then the poems would have been transcribed later, after 800 or 900 years of oral tradition.

In support of the theory, it is essential to remember that the Mycenaeans are not considered an aboriginal population but are thought to have come to Greece around the 16th century BCE. Felice Vinci also reports the hypothesis formulated in the late 19th century by the Indian scholar Bal Gangadhar Tilak, who argued that Indo-European populations had lived around the Arctic Circle in the past. On the other hand, the so-called ‘Linear B’ documents appear to have been written in a language that was a precursor of what later became Greek.

The main topic of Vinci’s hypothesis is the incongruence between the geography described by Homer and the configuration of the Mediterranean lands, a point already noted by Strabo. The geographical descriptions provided by the Iliad and the Odyssey, on the contrary, perfectly adapt to Northern Europe, and the incongruity regarding the Mediterranean localities would be due to the application of old Scandinavian names.  Furthermore, Homer’s description of the climate would be more suitable for the Baltic regions.

According to Vinci, Ulysses’ journey would have taken place along the coasts of Norway. After being held back in Ogygia (identified with one of the Faroe Islands, following Plutarch’s passage mentioned above), the Odyssey relates that, after seventeen days on the sea, Ulysses reached Scheria, home of the Phaiakians, described as a high rocky coast and densely wooded: this region, impossible to locate in the Mediterranean area, could be instead identified with the environs of Bergen, at the mouth of river Figgjo, where several Bronze Age objects have been founded (Scheria is never mentioned in the Odyssey as an island).

The new position would explain why Ulysses had noticed that the sea used to flow back into the river: this phenomenon is due to ocean tides and does not occur in the Mediterranean. Other places visited by Ulysses could be located on the Norwegian coasts, too: Circe’s island, Aeaea, and the areas she describes (the Sirens, Scylla and Charybdis) may be placed in the Lofoten archipelago, where tides on the ebb create the so-called maelstrom, corresponding with the Scylla whirlpool which swallowed up Ulysses’ ship and is described as forming three times a day, just like the maelstrom. In the end, Aeolus’s island would be located somewhere in the Shetland archipelago, where winds exceeding 200 km/h often blow.

Other Greek mythological tales are set in the same region. Among these, the Argonauts’ journey, who are said to have reached Colchis sailing eastwards and arriving there at Aeaea, from where they came back to Greece going westwards. The identification of Colchis in the Black Sea and of Aeaea in the Tyrrhenian Sea would lead to hypothesising an improbable itinerary for the Argonauts by ship across Continental Europe, along the rivers Danube, Po, and Rhone. The navigation would be instead the memory of an ancient counter-clockwise circumnavigation of Scandinavia starting from the Baltic Sea, crossing Lapponia overland along the rivers which run through it and reaching Lofoten, where Aeaea was identified. According to what Circe tells Ulysses, the Argonauts chose for their journey home the course passing through the Wanderers Rocks, which are to be identified with the narrow straits covered by the streams between the islands and the mainland.

Another reference to an ancient Nordic setting can be found, according to Vinci, in an assertion by Plato in his dialogue Critias, where the philosopher reminds him that Athens used to rise formerly in a flat fertile zone, not harsh and mountainous: this particular is presented in the book as a reference to the ancient Baltic Athens.

So, how is it possible that Troy was in Northern Europe?

The climate described by Homer is cold and stormy: mist and wind often appear, and storms are heavy. The characters are usually covered in thick cloaks and are never described sweating from the heat. Although in the period generally chosen to date the Trojan War (8th century BCE) the average temperature was lower than it is nowadays, the Homeric weather conditions are difficult to adapt to the Aegean area, especially considering that the events are likely to behave happened in summer, instead, this description would be perfect for the Prehistoric Baltic regions when temperatures in Northern Europe were by far higher than now: the drop in temperatures at a later time would have forced Achaeans to emigrate southwards.

Some passages in the Iliad and the Odyssey can be interpreted as descriptions of typical Nordic phenomena. For example, in the great battle between Achaeans and Trojans, the linchpin of the Iliad’s central books, the time of noon is quoted at two different moments; this wouldn’t be a mistake: the battle would have continued for two consecutive days, thanks to the midnight sun, which let the warriors carry on fighting. Other references to this phenomenon are the exceptional duration of the day among the Laestrygonians and Ulysses’ uncertainty when trying to find his way to Aeaea, since he cannot figure out where the sun rises and where it sets.

Troy Debunked - The Viking connection
The Viking connection – Troy Debunked

In Homeric poems and among the Vikings, it is possible to find similar features regarding traditions, mythology and literature. The custom of assembling for a meeting, the majestic convivial banquets and the kind of exile imposed to unintentional homicide. Also, the Achaean ships would have in common with the Viking ones the dismountable mast, considered useful, especially in the Northern seas to avoid the formation of ice, and the double bow, which allowed oarsmen to travel backwards too (a reference to this aspect might be the Greek term meaning “curved on both sides,” frequently used by Homer; Tacitus describes the same feature concerning the Germans.)

Moreover, the Greek aoidos would be similar to the Old Norse skald, as Homer would often make use of a figure of speech known as kenning in Nordic literature.  Also, some mythological figures would be similar in the two cultures (for example, Ulysses to the archer Ull in an Icelandic saga and Hamlet, the main character of an ancient Danish legend reported in Saxo Grammaticus’ Gesta Danorum), as well as many divinities: Aphrodite corresponds with Freyja, Ares with Thor, Zeus with Wotan and the Keres (who come down on the battlefield to take the souls of dead warriors, with the Valkyries).

Wilken’s main points

•             The Achaeans built 1186 ships for their attack on Troy; they could have travelled the short-distance overland far quicker and cheaper if Troy had been in the Turkish setting.

•             Odysseus claimed to have got home by travelling as a passenger on a ship going from Crete to Sidon (present-day Saïda in Lebanon), but that is the opposite direction he needed to go in the Mediterranean setting.

•             Agamemnon tells us it took him a full month to sail from his kingdom Argos to Ithaca; we know the trip takes less than 24 hours in the Mediterranean setting.

•             The mythical location for Troy in Turkey is far too small to accommodate the invading army of about 100,000 men and the long pursuits in horse-drawn chariots.

•             The extensively travelled Greek geographer Strabo who lived 2000 years ago (1200 years after the Trojan War), believed that some of the ports of call in the Odyssey should be found in the Atlantic because of the mention of tides that do not exist in the Mediterranean.

More information about Troy – Debunked can be found here on our web site: http://prehistoric-britain.co.uk/dawn-of-the-lost-civilisation and on our video channel: www.prehistoric-britain.online

PodCast

Author’s Biography

Robert John Langdon, a polymathic luminary, emerges as a writer, historian, and eminent specialist in LiDAR Landscape Archaeology.

His intellectual voyage has interwoven with stints as an astute scrutineer for governmental realms and grand corporate bastions, a tapestry spanning British Telecommunications, Cable and Wireless, British Gas, and the esteemed University of London.

A decade hence, Robert’s transition into retirement unfurled a chapter of insatiable curiosity. This phase saw him immerse himself in Politics, Archaeology, Philosophy, and the enigmatic realm of Quantum Mechanics. His academic odyssey traversed the venerable corridors of knowledge hubs such as the Museum of London, University College London, Birkbeck College, The City Literature Institute, and Chichester University.

In the symphony of his life, Robert is a custodian of three progeny and a pair of cherished grandchildren. His sanctuary lies ensconced in the embrace of West Wales, where he inhabits an isolated cottage, its windows framing a vista of the boundless sea – a retreat from the scrutinous gaze of the Her Majesty’s Revenue and Customs, an amiable clandestinity in the lap of nature’s embrace.

Exploring Prehistoric Britain: A Journey Through Time

My blog delves into the fascinating mysteries of prehistoric Britain, challenging conventional narratives and offering fresh perspectives based on cutting-edge research, particularly using LiDAR technology. I invite you to explore some key areas of my research. For example, the Wansdyke, often cited as a defensive structure, is re-examined in light of new evidence. I’ve presented my findings in my blog post Wansdyke: A British Frontier Wall – ‘Debunked’, and a Wansdyke LiDAR Flyover video further visualizes my conclusions.

My work also often challenges established archaeological dogma. I argue that many sites, such as Hambledon Hill, commonly identified as Iron Age hillforts are not what they seem. My posts Lidar Investigation Hambledon Hill – NOT an ‘Iron Age Fort’ and Unmasking the “Iron Age Hillfort” Myth explore these ideas in detail and offer an alternative view. Similarly, sites like Cissbury Ring and White Sheet Camp, also receive a re-evaluation based on LiDAR analysis in my posts Lidar Investigation Cissbury Ring through time and Lidar Investigation White Sheet Camp, revealing fascinating insights into their true purpose. I have also examined South Cadbury Castle, often linked to the mythical Camelot56.

My research also extends to the topic of ancient water management, including the role of canals and other linear earthworks. I have discussed the true origins of Car Dyke in multiple posts including Car Dyke – ABC News PodCast and Lidar Investigation Car Dyke – North Section, suggesting a Mesolithic origin2357. I also explore the misidentification of Roman aqueducts, as seen in my posts on the Great Chesters (Roman) Aqueduct. My research has also been greatly informed by my post-glacial flooding hypothesis which has helped to inform the landscape transformations over time. I have discussed this hypothesis in several posts including AI now supports my Post-Glacial Flooding Hypothesis and Exploring Britain’s Flooded Past: A Personal Journey

Finally, my blog also investigates prehistoric burial practices, as seen in Prehistoric Burial Practices of Britain and explores the mystery of Pillow Mounds, often mistaken for medieval rabbit warrens, but with a potential link to Bronze Age cremation in my posts: Pillow Mounds: A Bronze Age Legacy of Cremation? and The Mystery of Pillow Mounds: Are They Really Medieval Rabbit Warrens?. My research also includes the astronomical insights of ancient sites, for example, in Rediscovering the Winter Solstice: The Original Winter Festival. I also review new information about the construction of Stonehenge in The Stonehenge Enigma.

Further Reading

For those interested in British Prehistory, visit www.prehistoric-britain.co.uk, a comprehensive resource featuring an extensive collection of archaeology articles, modern LiDAR investigations, and groundbreaking research. The site also includes insights and extracts from the acclaimed Robert John Langdon Trilogy, a series of books exploring Britain during the Prehistoric period. Titles in the trilogy include The Stonehenge Enigma, Dawn of the Lost Civilisation, and The Post Glacial Flooding Hypothesis, offering compelling evidence about ancient landscapes shaped by post-glacial flooding.

To further explore these topics, Robert John Langdon has developed a dedicated YouTube channel featuring over 100 video documentaries and investigations that complement the trilogy. Notable discoveries and studies showcased on the channel include 13 Things that Don’t Make Sense in History and the revelation of Silbury Avenue – The Lost Stone Avenue, a rediscovered prehistoric feature at Avebury, Wiltshire.

In addition to his main works, Langdon has released a series of shorter, accessible publications, ideal for readers delving into specific topics. These include:

For active discussions and updates on the trilogy’s findings and recent LiDAR investigations, join our vibrant community on Facebook. Engage with like-minded enthusiasts by leaving a message or contributing to debates in our Facebook Group.

Whether through the books, the website, or interactive videos, we aim to provide a deeper understanding of Britain’s fascinating prehistoric past. We encourage you to explore these resources and uncover the mysteries of ancient landscapes through the lens of modern archaeology.

For more information, including chapter extracts and related publications, visit the Robert John Langdon Author Page. Dive into works such as The Stonehenge Enigma or Dawn of the Lost Civilisation, and explore cutting-edge theories that challenge traditional historical narratives.

Other Blogs

s

t

What Archaeology Missed Beneath Stonehenge

Introduction

For more than a century, Stonehenge has been interpreted as if it were constructed in a dry, stable chalk landscape, with water treated as peripheral or incidental. That assumption has never been tested against the subsurface record at the landscape scale. This blog presents the results of the first complete synthesis of borehole data from around Stonehenge Bottom, linking 21 historic boreholes into a single, quantitative framework. The outcome is neither interpretative nor theoretical. It is numerical. The subsurface record demonstrates repeated, extensive, and spatially constrained water activity throughout the Holocene, fundamentally incompatible with a dry-land model for early Stonehenge. What follows is not a reinterpretation of Stonehenge — it is a correction driven by data that has been available for decades but never assembled, counted, or tested as a system. (What Archaeology Missed Beneath Stonehenge)


Video showing the volume of River material as a percentage of the Borehole

1. Why This Blog Exists

From surface narratives to subsurface evidence

Stonehenge interpretation has long been dominated by surface observations: earthworks, stone settings, artefact distributions, and visual landscape relationships. These are valuable, but they are incomplete. Landscapes do not function at the surface alone, and water — in particular — leaves its most durable evidence below ground.

The central problem addressed here is simple: claims about a dry Stonehenge landscape have been made without reference to the subsurface record that would be required to support them. Boreholes have existed around Stonehenge for decades, logged by multiple contractors for engineering and infrastructure projects, yet they have almost never been synthesised or quantified in archaeological interpretation.

This blog exists because that synthesis has now been done.

By analysing boreholes not as isolated descriptions but as a connected dataset — counted, measured, and compared across topography — it becomes possible to test whether Stonehenge Bottom behaved as a dry chalk valley or as a water-dominated basin during the Holocene. Once that question is asked using arithmetic rather than narrative, the answer is no longer ambiguous.

(What Archaeology Missed Beneath Stonehenge)

2. The Data Nobody Had Ever Assembled

Linking 21 boreholes into one landscape system

Boreholes around Stonehenge Bottom are not new. Many were drilled decades ago for engineering, infrastructure, and site investigations. What is new is that they have now been brought together and analysed as a single landscape-scale dataset, rather than as isolated, descriptive records.

Historically, each borehole has been treated as local and incidental — a column of chalk, a few notes on gravel or marl, then filed away. No attempt was made to ask whether these records, taken together, described a coherent subsurface environment. As a result, interpretations of the Stonehenge landscape were based almost entirely on surface evidence, while the subsurface record remained fragmented and effectively invisible.

That fragmentation is the core problem this section resolves.

Twenty-one boreholes distributed around Stonehenge Bottom and the adjacent valley system have now been collated, normalised, and analysed together. They span the valley floor, margins, and surrounding uplands. They were logged by different contractors, at different times, for different purposes — which makes their convergence more significant, not less.

Crucially, the analysis does not rely on reinterpretation of the logs. No lithologies were renamed. No depths adjusted. No categories merged to strengthen an argument. Each borehole was taken exactly as recorded, then subjected to the same fixed rules for identifying water-related evidence.

When treated individually, these boreholes can be argued over.
When treated collectively, they cannot.

Once counted, measured, and compared across topography, a clear and repeatable pattern emerges: water-related features are vertically stacked, repeatedly logged, and concentrated within the valley, while the surrounding high ground shows a fundamentally different subsurface character. That pattern only becomes visible when the data are assembled as a system.

This section establishes the foundation for everything that follows. The argument does not depend on a single “key” borehole, nor on selective examples. It rests on the behaviour of the dataset as a whole, which is precisely why it has such force.

 (What Archaeology Missed Beneath Stonehenge)
Shell count across Stonehenge bottom – (What Archaeology Missed Beneath Stonehenge)

3. What Counts as Water Evidence

Rules fixed in advance

Before any counting was undertaken, the rules had to be fixed. This matters because most disagreement in geo-archaeology does not arise from missing data, but from changing definitions once results are known.

In this analysis, a water-related occurrence is defined strictly as any logged interval that requires water to exist, or to have existed, in order to form or to be preserved. Nothing is inferred. Nothing is upgraded. Only what is explicitly recorded in the borehole logs is used.

The following categories are considered water-related evidence, with reasons provided.


Water-related sediment and alteration indicators

→ Rounded pebbles, gravel, and cobbles
Rounded or sub-rounded clasts require transport. In chalk landscapes, this transport is hydraulic. Angular flint fragments may occur residually; rounded gravels and cobbles do not. Where gravels are logged as lenses, bands, or stacked horizons, they indicate repeated water movement, not isolated disturbance.

→ Flint gravel bands, flint lags, and sheeted flint horizons
Flint concentrated into bands or sheets reflects winnowing, reworking, or lag formation by flowing or standing water. These features cannot be produced by in situ chalk decay alone and require hydraulic sorting.

→ Sand, silt, and marl seams
Fine-grained sediments such as sand, silt, and marl are, by definition, water-laid. Their presence within chalk sequences indicates periods of low-energy flow, ponding, or suspension settling. Repeated marl seams imply repeated water presence over time, not a single episode.

→ Shell material (intact shells, fragments, and shell-rich horizons)
Shells indicate habitable aquatic environments. They require sustained water conditions, not transient wetting. Their repeated occurrence at multiple depths is incompatible with surface wash or periglacial disturbance.

→ Shell impressions and moulds (dissolved shells)
In chalk aquifers, shells dissolve readily under percolating freshwater, often leaving impressions rather than intact material. These impressions are direct evidence of former shell presence and, by extension, former water, even where the shell itself has been removed.

→ Organic staining and peat-like horizons
Organic staining, darkened horizons, or peat-like material indicate stagnant or slow-moving water, waterlogging, or anoxic conditions. These features reflect prolonged saturation rather than brief exposure.

→ Chalk paste, softened chalk, and puttified chalk
Where chalk is logged as paste, soft, weakened, or puttified, this reflects chemical dissolution and mechanical breakdown under sustained saturation. These textures are aqueous in origin and fundamentally different from blocky fracture produced by freeze–thaw.

→ Solution features, voids, and collapse structures
Voids, cavities, and collapse features attributed to solution require long-term water circulation. They indicate groundwater flow paths, dissolution, and structural weakening — processes that cannot occur in dry chalk.

→ Repeated vertical alternation of the above
Perhaps most critically, these features occur repeatedly and at different depths, separated by intact chalk. That vertical stacking is itself evidence of multiple water incursions over time.

 (What Archaeology Missed Beneath Stonehenge)
(What Archaeology Missed Beneath Stonehenge)

What is explicitly excluded

To avoid exaggeration, the following are not counted:

→ drilling-induced fragments or artefacts
→ administrative gaps in logging
→ colour change or staining on its own
→ lithological labels without physical description
→ assumed processes not written in the log

Where an interval is ambiguous, it is excluded.


Additional safeguards

Two further safeguards are applied consistently:

→ Point observations (e.g. “shells noted”) are included in event counts (N) but not inflated in thickness totals (W).
→ Overlapping descriptions at the same depth are treated as a single water occurrence, not multiple events.

These rules are conservative by design. They bias the analysis toward undercounting, not exaggeration.

This matters because every total, percentage, and frequency that follows rests on these fixed definitions. They are stated here in advance and applied uniformly across all 21 boreholes.

What the data show under these constraints, therefore, is not interpretation.

It is arithmetic.

 (What Archaeology Missed Beneath Stonehenge)
(What Archaeology Missed Beneath Stonehenge)

4. The Numbers That Break the Model

Counting replaces interpretation

Once the rules in Section 3 are fixed, the analysis becomes mechanical. There is no scope for reinterpretation, emphasis, or selective description. Each borehole is processed line by line, each qualifying interval counted once, and each thickness measured only where the log permits it.

When this is done across all 21 boreholes surrounding Stonehenge Bottom, the result is unambiguous.

Across the dataset, a total of 994 stratigraphically separate water-related bands are recorded. These bands represent discrete, depth-specific intervals in which water action is explicitly logged. They are not repeated descriptions of the same layer, not interpretive subdivisions, and not inferred events. Each band occupies its own position in the stratigraphic column.

The cumulative thickness of these water-affected intervals is 220.57 metres.

These two figures matter for different reasons:

→ The band count (994) captures frequency: how often water interacted with the subsurface at different times and depths.
→ The cumulative thickness (220.57 m) captures dominance: how much of the valley fill has been shaped by water processes rather than intact chalk.

Together, they describe both repetition and scale.

 (What Archaeology Missed Beneath Stonehenge)
(What Archaeology Missed Beneath Stonehenge)

Distribution by material class

The 994 bands are not confined to a single sediment type. They are distributed across multiple, independent indicators of water action:

→ Shell material and shell-impression horizons
→ Pebble, gravel, and cobble bands
→ Sand, silt, and marl seams
→ Flint lags and reworked flint sands
→ Organic staining and peat-like deposits
→ Chalk paste, softened chalk, and solution zones
→ Voids and collapse features

This diversity matters. A single class could be argued away. A consistent pattern across many classes cannot.


Why this exceeds statistical uncertainty

In subsurface analysis, isolated occurrences can be dismissed as noise. Sparse events can be argued as anomalous. That logic fails completely at this scale.

Nearly one thousand independently logged water-related intervals, stacked vertically through the valley fill, represent a population-level signal. The probability that such a pattern arises from non-hydrological processes — or from mis-logging replicated hundreds of times across different boreholes, contractors, and decades — is vanishingly small.

At this point, the question is no longer whether water was present.

The only remaining questions are how persistent, how extensive, and how it structured the landscape.


What the numbers do not rely on

It is important to be explicit about what these totals are not dependent on:

→ they do not depend on a single “key” borehole
→ they do not rely on shell material alone
→ they are not driven by one sediment class
→ they are not sensitive to minor changes in definition

Even if the most conservative exclusions are applied, the order of magnitude does not change. The signal remains.


This section marks the point where the traditional dry-land model becomes mathematically indefensible. The remaining sections address what these numbers mean spatially, how they vary across the valley, and why they cannot be reproduced on the surrounding uplands.

 (What Archaeology Missed Beneath Stonehenge)
Boreholes showing percentage of River fill – (What Archaeology Missed Beneath Stonehenge)

5. Percentage, Not Just Presence

When water controls the subsurface

Counts establish repetition. Percentages establish control.

While the total of 994 water-related bands demonstrates how frequently water interacted with the subsurface, the proportion of each borehole affected shows something more important: whether water was a marginal influence or the dominant process shaping the valley fill.

In several boreholes within Stonehenge Bottom, water-related sediments do not appear as thin, occasional horizons. They make up the majority of the entire borehole profile.

In the most extreme cases, over 90% of the logged sequence, and in at least one borehole, approaching 97%, consists of water-laid or water-altered material.

That figure is not rhetorical. It is arithmetic: the summed thickness of water-affected intervals divided by total borehole depth.


Why percentage matters more than occurrence

A dry chalk landscape affected only incidentally by water would produce a very different subsurface signature:

→ thin, isolated water horizons
→ limited vertical extent
→ low proportional impact
→ intact chalk dominating the sequence

That is not what is observed.

Instead, in key valley-floor locations, intact chalk becomes the minority material, repeatedly interrupted or replaced by gravels, sands, marls, shell-bearing layers, softened chalk, and solution features. Water is not an episode in these boreholes. It is the defining condition.

This distinction is critical. A single water band can be debated. A high band count demonstrates persistence. But when water-related material accounts for nearly the entire stratigraphic record, the environment being recorded cannot reasonably be described as dry.

 (What Archaeology Missed Beneath Stonehenge)
(What Archaeology Missed Beneath Stonehenge)

Why this cannot be dismissed as “local wet spots”

The percentage values are not confined to one anomalous borehole. They recur across multiple boreholes distributed through Stonehenge Bottom, while dropping rapidly toward the valley margins and disappearing entirely on surrounding high ground.

This spatial behaviour matters:

→ dominance in the valley floor
→ reduction upslope
→ absence on the interfluves

That pattern is exactly what a river basin and floodplain system produces. It is not consistent with surface runoff, rainwash, or shallow groundwater effects acting on an otherwise dry landscape.


What high percentages actually record

A borehole composed almost entirely of water-affected material records time, not drama.

It indicates long-term saturation, repeated deposition, reworking, dissolution, and sealing — processes that operate over extended periods. It does not imply catastrophic flooding. It implies a persistent water presence shaping the subsurface continuously.

In that context, the ~97% figure is not an outlier. It is a signal that, in parts of Stonehenge Bottom, the subsurface history is overwhelmingly aqueous.

 (What Archaeology Missed Beneath Stonehenge)
(What Archaeology Missed Beneath Stonehenge)

6. Control Boreholes

Defining the maximum depth of non-aqueous disturbance

Any claim that Stonehenge Bottom has been substantially reworked by post-glacial water must first answer a simpler question: how deep does non-aqueous disturbance normally penetrate into chalk on local high ground?

That question cannot be answered with a single borehole.
It requires a control group.

Three boreholes drilled on high ground around Stonehenge provide that control: RX507, RX508A, and RX510A.

These boreholes are located on interfluves outside the Stonehenge valley system, within the same chalk formation, under the same climatic history, and drilled for the same engineering purposes.


What the control boreholes show

Despite differences in total depth and drilling campaign, all three control boreholes record the same outcome:

→ near-surface disturbance confined to approximately 4.0–4.5 m
→ below this depth, structurally intact chalk
→ no progressive softening
→ no stacked gravel horizons
→ no shell material
→ no solution overprint extending downward

This convergence is critical. It shows that shallow disturbance is systematic and limited, not variable or arbitrarily deep.

The depths are consistent:

→ RX507: disturbance to ~4.0 m
→ RX508A: disturbance to ~4.0 m
→ RX510A: disturbance to ~4.5 m

These values define the maximum penetration of periglacial and near-surface processes — rainwash, frost action, soil development, and minor cryogenic disruption — on local high ground.


Why does the drilling method not undermine the control

RX507, RX508A, and RX510A include rotary open-hole drilling, which does not preserve fine sedimentary lamination. No claim is made that these boreholes provide detailed stratigraphic resolution.

Their purpose is different.

Open-hole drilling does not selectively erase:

→ deep gravel or cobble horizons
→ extensive softened or paste-like chalk
→ solution void systems
→ repeated vertical disruption

If such features were present below ~4–5 m, they would still manifest as changes in spoil character and lithological description. Their consistent absence across all three boreholes is therefore meaningful.


Why this recalibration matters

With three independent boreholes showing the same shallow disturbance limit, the analysis elsewhere can be recalibrated correctly:

→ the upper ~4–4.5 m is treated as surface / periglacial noise
→ everything below that depth is evaluated as core chalk behaviour

In the Stonehenge Bottom boreholes, water-related features occur well below this boundary, repeatedly and at multiple depths. That behaviour cannot be attributed to surface processes, periglacial activity, or drilling artefact.

 (What Archaeology Missed Beneath Stonehenge)
(What Archaeology Missed Beneath Stonehenge)

What the control set proves

The control boreholes demonstrate that:

→ deep chalk disruption is not universal
→ it is not inherited from geological time
→ it is not an artefact of logging practice
→ it is spatially constrained to the valley system

Once this control is established, explanations based on dry chalk, preserved periglacial surfaces, or shallow seasonal wetting become untenable.

The contrast is no longer interpretative.
It is geometric and measurable.


Control conclusion

RX507, RX508A, and RX510A together define the maximum depth of non-aqueous disturbance in the Stonehenge landscape.

Everything below that depth in the valley-floor boreholes records a different subsurface regime — one dominated by long-term water interaction.

That control underpins all subsequent sections.

7. Case Study: R16 Counted Properly

From description to arithmetic

To show exactly how the wider dataset was analysed, it is necessary to walk through one borehole in full, line by line, using the fixed rules set out in Section 3. Borehole R16 (SU14SW60) provides a clear example.

R16 is located within the Stonehenge landscape and was logged in detail as part of a British Geological Survey investigation. The borehole has a total depth of 36.57 m and a ground level of 79.50 m OD. No reinterpretation is applied here. Only what is explicitly written in the log is used.

 (What Archaeology Missed Beneath Stonehenge)
(What Archaeology Missed Beneath Stonehenge)

Step 1: Fix the definitions (no flexibility)

A water-related occurrence is counted only where the log records features that require water to exist or to have existed. These include gravel or cobble bands, marl seams, flint lags, shell material or shell impressions, softened or paste-like chalk, and solution-related features.

Colour change alone is excluded. Drilling artefacts are excluded. Ambiguous notes are excluded.


Step 2: Count discrete water occurrences (N)

Working from the top of the borehole to the base, R16 records 23 separate water-related intervals, each at a different depth and separated by non-water intervals.

These are not subdivisions of a single layer. They are discrete stratigraphic horizons, logged independently, and occurring repeatedly through the sequence.

This means water interacted with the subsurface at least 23 separate times at different points in the borehole’s history.


Step 3: Measure total water-affected thickness (W)

Each interval that has a defined thickness is measured and summed. Point observations (such as single shell notes or thin marl seams) are included in the event count but are not inflated in the thickness total.

For R16, the summed thickness of all water-related intervals is:

W = 4.67 m

Out of a total borehole depth of 36.57 m.


Step 4: Convert thickness to percentage

Once thickness is measured, the proportion of the borehole affected by water can be calculated directly:

Water involvement
= 4.67 ÷ 36.57 × 100
= 12.8%

Nearly 13% of the entire subsurface profile shows direct, logged interaction with water.

This figure is not inferred. It is not modelled. It is counted.


Step 5: Calculate frequency (events per metre)

A final metric captures how often water appears through the sequence:

Event density
= 23 events ÷ 36.57 m
= 0.63 water events per metre

In practical terms, R16 records water influence, on average, every 1.6 metres.

That is incompatible with a dry or stable chalk substrate.

 (What Archaeology Missed Beneath Stonehenge)
(What Archaeology Missed Beneath Stonehenge)

8. Case Study: R18 and the Shoreline Signal

Why depth matters more than surface finds

If R16 demonstrates how water repeatedly interacted with the subsurface, R18 (SU14SW62) shows where that interaction stabilised within the landscape. This borehole does not simply record water presence — it records a persistent water level.

R18 is drilled into hard chalk beneath Stonehenge Bottom. As with R16, the analysis relies solely on what is explicitly logged, applying the same fixed rules. What distinguishes R18 is not just the number of water-related intervals, but their vertical organisation.

Within this single borehole, 135 distinct water-related sedimentary levels are recorded, comprising gravels, sands, shell material, organic staining, and solution-related chalk. The cumulative thickness of water-affected material is 9.21 m, representing 18.25% of the borehole.

These figures already place R18 well beyond incidental wetting. But the critical signal lies higher in the sequence.


The erosion boundary and what lies below it

Across multiple boreholes into hard chalk in the Stonehenge area, a consistent pattern emerges: natural surface processes — rainwash, frost action, soil formation, and minor periglacial disturbance — affect only the upper ~3.5 m of chalk. Below that depth, intact chalk is normally expected.

In R18, however, repeated shell-bearing and water-laid sediments occur well below this natural erosion boundary, clustered around approximately 92.6 m OD.

That single fact carries weight.

Below the surface-affected zone, chalk should be structurally intact unless acted upon by sustained subsurface water. Shell material at this depth cannot be explained by surface wash, slope creep, or freeze–thaw processes. Those mechanisms do not transport, preserve, or repeatedly introduce shell-bearing sediments into intact chalk tens of metres below ground.

What is being recorded here is not a transient event, but a stable hydrological condition.


Why this records a shoreline, not a flood

Shells require more than water. They require time, stability, and habitable conditions. A single flood might move gravels. It does not establish repeated shell-bearing horizons at the same elevation.

In R18, water-related sediments recur around a consistent vertical level, indicating that water returned to — or persisted at — approximately the same height over extended periods. That behaviour is characteristic of a shoreline or standing-water margin, not episodic inundation.

This distinction matters. A flood leaves chaos. A shoreline leaves repetition.


Spatial implication: beside the stones, not beneath them

The elevation of the highest repeated water-related horizons in R18 places the shoreline downslope from the later stone circle, in the area now occupied by the former Stonehenge car park and adjacent valley floor. The stones themselves sit slightly above this zone.

This spatial relationship is precisely what would be expected if early activity took place adjacent to persistent water, but deliberately positioned on ground that remained reliably dry.

At this point, the argument is no longer abstract. R18 ties water presence to a specific elevation and location within the landscape.

Why R18 matters beyond itself

R18 does not stand alone. Its shoreline signal aligns with:

→ repeated water dominance shown in the wider borehole matrix
→ high percentage water-affected sequences in nearby valley-floor boreholes
→ the absence of comparable features on surrounding high ground

Together, these strands converge on a single conclusion: Stonehenge Bottom was not merely wet at times. It contained a persistent water margin during the period when the earliest features in the landscape were established.

 (What Archaeology Missed Beneath Stonehenge)
(What Archaeology Missed Beneath Stonehenge)

9. The Mesolithic Posts Reinterpreted

Infrastructure, not ritual

The Mesolithic post holes near Stonehenge have long been treated as anomalous. Dated to around 8300 BCE, they sit uncomfortably outside later monument narratives and are routinely described as symbolic, ritual, or inexplicable precursors to Stonehenge itself.

That framing has always depended on one assumption: that the surrounding landscape was dry.

Once that assumption is removed, the problem disappears.


The spatial problem that ritual never solved

The Mesolithic posts are:

→ located downslope from later monuments
→ positioned several metres above the inferred water level
→ set back from the valley floor
→ aligned along a natural route through the landscape

If these posts were ritual markers, their placement is awkward. They are not centred, not enclosed, and not associated with known ceremonial structures. Their position has always required special pleading.

In a water-dominated landscape, however, their location is exactly where it should be.


Posts above water make sense — posts below it do not

If Stonehenge Bottom contained a persistent water margin during the early Holocene, as the borehole evidence indicates, then the posts occupy a functionally optimal position:

→ safely above sustained water levels
→ close enough for access
→ far enough to avoid saturation
→ visible from the water’s edge

This is not where one places abstract symbols.

It is where one places infrastructure.

 (What Archaeology Missed Beneath Stonehenge)
(What Archaeology Missed Beneath Stonehenge)

What tall timber posts do in watery landscapes

In riverine and floodplain settings, tall timber posts serve well-understood practical roles:

→ mooring points
→ landing markers
→ route indicators
→ boundary and access control
→ stable reference points in shifting terrain

None of these functions requires ceremonial explanation. They require water movement, repeated use, and practical need.

Once water is acknowledged as the dominant landscape factor, the Mesolithic posts cease to be mysterious. They become logical.


Chronology now works instead of fighting itself

The Mesolithic date of the posts is no longer a problem to be explained away. It becomes a key indicator of early engagement with a water-managed landscape.

Long before sarsens or bluestones, the valley was already being structured, navigated, and used. The posts mark activity responding to water, not anticipating monumentality.

In this context, Stonehenge does not begin as a symbolic construction placed into an abstract landscape. It emerges later within a landscape that was already organised around access, movement, and water.


From monument to harbour

This reinterpretation does not diminish Stonehenge. It grounds it.

The earliest activity in the valley is not ritual abstraction imposed on empty land. It is practical engagement with a flooded environment. The Mesolithic posts represent the first fixed points in that system.

Stonehenge, in this light, does not replace a dry ceremonial field.

It formalises a landscape that was already working.

10. The Periglacial Escape Route Fails

Why do the two explanations not coexist

Once extensive post-glacial water activity is demonstrated in the subsurface, a common fallback is to invoke preserved periglacial features at the surface — particularly along the Stonehenge Avenue — as evidence that the landscape must have remained largely untouched since the Late Pleistocene.

This argument fails on first principles.

Periglacial explanations and the documented subsurface record are mutually incompatible. They cannot both be true.


What preserved periglacial features require

For periglacial stripes, polygons, involutions, or solifluction features to survive as recognisable surface relics, several conditions must hold:

→ a relatively stable ground surface since the Late Pleistocene
→ structurally intact chalk beneath the surface
→ dominance of cryogenic fracture rather than chemical solution
→ minimal post-glacial groundwater circulation and reworking

These requirements are well established in periglacial geomorphology. Preservation depends on limited later disturbance, not simply on the prior existence of cold conditions.

Periglacial Lines – Borehole finds how they are not – (What Archaeology Missed Beneath Stonehenge)

What the boreholes actually show

The borehole record beneath Stonehenge Bottom and the Avenue corridor shows a very different subsurface reality:

→ repeated gravel, cobble, sand, and marl bands
→ shell material and shell-impression horizons at multiple depths
→ softened chalk, chalk paste, and solution features
→ voids and collapse structures
→ vertical repetition of water-affected horizons through tens of metres

This is not conjecture. It is logged geological data from multiple independent boreholes.

These features are diagnostic of long-term water circulation, saturation, and reworking. They are not produced by freeze–thaw processes.


Why freeze–thaw cannot explain what is observed

Periglacial processes fracture chalk. They do not:

→ dissolve chalk into paste
→ create solution voids and collapse features
→ repeatedly rework sediments vertically
→ introduce or preserve shell-bearing water horizons
→ generate stacked sequences of hydraulically sorted material

Freeze–thaw acts mechanically and near the surface. The features documented here are chemical, hydraulic, and vertically extensive.

Invoking periglacial processes in this context does not explain the data. It avoids it.


The fatal contradiction

A preserved periglacial surface requires subsurface stability.
The boreholes demonstrate subsurface instability driven by water.

Once chalk has been repeatedly saturated, chemically dissolved, mechanically reworked, and overprinted by groundwater flow, the overlying surface cannot be treated as a pristine Ice-Age relic.

You cannot argue for intact periglacial features resting on a substrate that has been demonstrably broken down by post-glacial hydrology. The two interpretations cannot coexist.


Why surface analogy is no longer sufficient

Periglacial explanations for the Stonehenge Avenue rely almost entirely on surface morphology and analogy with other chalk landscapes. What they do not do is engage with the subsurface evidence directly beneath the features being interpreted.

That omission matters.

In modern geology, subsurface data overrides surface analogy. Where boreholes contradict a surface-based interpretation, the subsurface record must lead.

Here, it does—and it points unequivocally to a landscape that has been substantially reworked since the Ice Age.

 (What Archaeology Missed Beneath Stonehenge)
(What Archaeology Missed Beneath Stonehenge)

11. Why the “Older Ice Age Valley Fill” Argument Also Fails

Predictions versus what is actually observed

When faced with extensive water-related deposits beneath Stonehenge Bottom, a common fallback explanation is to argue that these features represent an inherited Pleistocene valley fill — formed during an earlier Ice Age, then later frozen, stabilised, and preserved into the Holocene.

At first glance, this sounds plausible.
In practice, it fails every test.


What an inherited Ice Age valley fill would predict

If the Stonehenge valley fill were primarily an older Pleistocene deposit, later left largely undisturbed, the subsurface record should show a consistent set of characteristics:

→ a coherent valley-fill unit with limited internal repetition
→ broad lithological continuity rather than frequent alternation
→ dominance of brecciation and blocky fracture over chemical solution
→ minimal vertical reworking once deposition ceased
→ a sealing palaeosurface separating Ice Age deposits from later soils

In short, the record should show one major depositional phase, followed by stability.


What the boreholes actually show

The borehole data beneath Stonehenge Bottom show the opposite:

→ multiple, discrete water-worked bands stacked vertically
→ repeated alternation between gravels, fines, organic horizons, and chalk
→ solution features cutting earlier deposits
→ shell material introduced at multiple depths, not confined to a single unit
→ no preserved palaeosurface sealing the sequence

This is not the signature of inherited stasis.
It is the signature of repeated reworking.


Why freezing does not preserve this pattern

A frozen or periglacially stabilised valley fill would suppress further vertical reorganisation. It would lock sediments in place, fracture chalk mechanically, and reduce chemical solution.

What is observed instead is:

→ progressive chalk dissolution
→ formation of paste and softened zones
→ collapse and void development
→ repeated sediment input long after initial deposition

These processes require liquid water circulation, not frozen ground.

 (What Archaeology Missed Beneath Stonehenge)
(What Archaeology Missed Beneath Stonehenge)

The shell problem (again)

Shell material is especially diagnostic here.

If the deposits were primarily inherited from an older Ice Age phase, shell-bearing horizons would be expected to occur once, or within a narrow stratigraphic range corresponding to that phase.

Instead, shells and shell-impression horizons recur at multiple depths, often separated by metres of sterile chalk or other deposits.

That pattern requires repeated habitable water conditions, not a single ancient episode.


Why this matters for chronology

An inherited Pleistocene fill would decouple the subsurface record from Holocene landscape use. It would allow water evidence to be dismissed as irrelevant to early Stonehenge.

The borehole data do not allow that move.

The vertical repetition, solution overprinting, and distribution of water-related features demonstrate ongoing Holocene hydrological activity rather than residual Ice Age sediment.

That means the subsurface conditions recorded are contemporary with early human activity in the valley, not a frozen relic beneath it.


The logical endpoint

Once the inherited Ice Age valley-fill model fails, there is no remaining geological mechanism that can explain:

→ hundreds of vertically stacked water-related horizons
→ deep penetration below the periglacial zone
→ dominance of water-affected material in valley-floor boreholes
→ absence of the same features on surrounding high ground

The only explanation that fits all observations is long-term post-glacial water activity confined to the Stonehenge valley system.

At this point, the question is no longer geological.

It is historical.

 (What Archaeology Missed Beneath Stonehenge)
(What Archaeology Missed Beneath Stonehenge)

12. Locking into the Wider System

River terraces, meltwater volume, and scale

The borehole evidence beneath Stonehenge Bottom does not exist in isolation. Its significance only becomes fully apparent when it is placed back into the regional post-glacial hydrological system that governed southern Britain after the last Ice Age.

Once this wider context is restored, the Stonehenge record stops looking anomalous and instead becomes inevitable.


River terraces are volume records, not abstractions

River terraces are not symbolic features. They are physical records of water volume, discharge duration, and base-level control.

Each terrace represents a prolonged period during which:
→ meltwater input was sustained
→ base level stabilised long enough for lateral activity
→ rivers occupied a relatively fixed elevation

The Avon terrace staircase is therefore not a static landscape. It is a hydrological archive.


Why terrace height matters more than terrace age

Traditional interpretations tend to treat terraces primarily as chronological markers. In doing so, they obscure their more important function: recording the magnitude of water involved.

Higher terraces require:
→ greater meltwater volumes
→ longer durations of elevated discharge
→ sustained backing-up of inland valleys

This is not controversial. It is basic fluvial physics.


Re-evaluating Ice Age scale

The terrace staircase of the Avon has typically been explained using a model in which the most recent Ice Age contributed only a minor proportion of the total erosive and depositional work — often framed as being small compared to much earlier glacial phases.

The borehole evidence at Stonehenge Bottom contradicts this.

If meltwater volumes from the last glaciation were truly negligible, the valley would not record:
→ repeated Holocene water occupation
→ deep subsurface reworking below the periglacial zone
→ dominance of water-affected material in valley-floor boreholes

The only way to reconcile the terrace staircase with the borehole data is to accept that the most recent Ice Age contributed meltwater volumes large enough to drive active water levels up to at least Terrace T9.


Why Stonehenge Bottom sits where it does

Stonehenge Bottom occupies a low-gradient section of the Avon system, precisely where back-flooding, ponding, and stabilised water levels would be expected during periods of elevated base level.

The borehole record confirms this:
→ water-related horizons stack vertically at consistent elevations
→ disruption intensifies toward the valley floor
→ surrounding high ground remains dry and intact

This is not random. It is system behaviour.

 (What Archaeology Missed Beneath Stonehenge)
(What Archaeology Missed Beneath Stonehenge)

Linking local depth to the regional scale

What the Stonehenge boreholes record is the local expression of a regional process.

The same meltwater that:
→ drove terrace formation downstream
→ sustained discharge into the North Sea
→ reconfigured river systems across southern Britain

…also occupied and re-occupied the Stonehenge valley.

The valley was not an exception.
It was part of the system.


Why this matters for interpretation

Once Stonehenge is placed back into this wider hydrological framework, long-standing interpretive problems dissolve:

→ why early activity clusters near the valley
→ why features sit at specific elevations
→ why subsurface evidence contradicts “dry chalk” assumptions

The landscape was not marginally wet.
It was structurally water-dominated during key periods.


Scale closes the loop.

Small explanations fail because the phenomenon is not small.

A handful of floods cannot produce:
→ hundreds of stratigraphically discrete water horizons
→ deep chalk reworking confined to a valley
→ terrace systems extending across catchments

Only long-duration, large-volume meltwater systems can do that.

Stonehenge Bottom records one node of that system.

And now, for the first time, the subsurface evidence allows that system to be traced — quantitatively, spatially, and historically.

 (What Archaeology Missed Beneath Stonehenge)
(What Archaeology Missed Beneath Stonehenge)

13. What This Forces Archaeology and Geology to Confront

The borehole evidence beneath Stonehenge Bottom does not merely add detail to an existing narrative. It invalidates a foundational assumption shared by both archaeology and geology: that the Stonehenge landscape was fundamentally dry, stable chalk throughout the Holocene.

Once that assumption fails, a cascade of consequences follows.


Archaeology’s problem: interpretation without ground conditions

For decades, archaeological interpretation around Stonehenge has proceeded as if subsurface conditions were either irrelevant or already understood.

They were neither.

Ritual, symbolic, and cosmological explanations were layered onto features whose physical setting had never been tested against the subsurface record. Mesolithic posts became curiosities. Linear features became symbolic avenues. Landscape use was inferred without first establishing whether the ground itself was dry, wet, stable, or seasonally occupied.

The boreholes now show that this approach is untenable.

If water dominated the valley floor for prolonged periods:
→ site placement must be re-evaluated
→ access routes must be reconsidered
→ early structures must be understood as responses to water, not abstractions from it

This is not a reinterpretation of artefacts.
It is a correction to the environmental framework in which they were placed.


Geology’s problem: description without measurement

Geology’s failure is quieter, but deeper.

The borehole logs contained the evidence all along:
→ gravels
→ marls
→ shell material
→ softened chalk
→ solution features
→ voids

But these were described qualitatively, isolated within individual logs, and never synthesised into a landscape-scale analysis.

Words replaced numbers.
Confidence replaced calculation.

No one asked:
→ how many water-related horizons exist
→ how thick they are cumulatively
→ how frequently they occur with depth
→ how they vary spatially across the valley

Once those questions are asked, the “dry chalk” assumption collapses mathematically.


The disciplinary gap that allowed this to persist

Archaeology deferred to geology on ground conditions.
Geology deferred to archaeology on relevance.

Between them, the subsurface record was never integrated.

This is how a landscape can be mischaracterised for decades despite the data being publicly available.


Why this is not an attack on expertise

This work does not argue that archaeologists or geologists were careless or incompetent. It argues something more uncomfortable:

They were working inside inherited models that were never quantitatively tested.

That is not a personal failure.
It is a methodological one.


What changes from here on

The implications are straightforward and unavoidable:

→ subsurface data must precede interpretation
→ water involvement must be quantified, not described
→ control boreholes must be used to define disturbance limits
→ surface features cannot be interpreted independently of what lies beneath them

These are not radical demands.
They are basic scientific ones.


Stonehenge as a test case, not an exception

Stonehenge is not unique because it is famous.
It is unique because it is documented.

If this level of subsurface reworking can be demonstrated here, it raises obvious questions about other chalk landscapes that have never been tested at this resolution.

Stonehenge is simply where the failure becomes visible.


The final position

This work does not ask archaeology or geology to abandon their disciplines.
It asks them to finish the job properly.

The ground has already recorded what happened.

All that remained was to count it.

Because of the huge amount of data and this blog being over 6000 words, PART II, with all the technical data, including all boreholes, will be published next week.

Podcast

Author’s Biography

Robert John Langdon, a polymathic luminary, emerges as a writer, historian, and eminent specialist in LiDAR Landscape Archaeology.

His intellectual voyage has interwoven with stints as an astute scrutineer for governmental realms and grand corporate bastions, a tapestry spanning British Telecommunications, Cable and Wireless, British Gas, and the esteemed University of London.

A decade hence, Robert’s transition into retirement unfurled a chapter of insatiable curiosity. This phase saw him immerse himself in Politics, Archaeology, Philosophy, and the enigmatic realm of Quantum Mechanics. His academic odyssey traversed the venerable corridors of knowledge hubs such as the Museum of London, University College London, Birkbeck College, The City Literature Institute, and Chichester University.

In the symphony of his life, Robert is a custodian of three progeny and a pair of cherished grandchildren. His sanctuary lies ensconced in the embrace of West Wales, where he inhabits an isolated cottage, its windows framing a vista of the boundless sea – a retreat from the scrutinous gaze of the Her Majesty’s Revenue and Customs, an amiable clandestinity in the lap of nature’s embrace.

Exploring Prehistoric Britain: A Journey Through Time

My blog delves into the fascinating mysteries of prehistoric Britain, challenging conventional narratives and offering fresh perspectives based on cutting-edge research, particularly using LiDAR technology. I invite you to explore some key areas of my research. For example, the Wansdyke, often cited as a defensive structure, is re-examined in light of new evidence. I’ve presented my findings in my blog post Wansdyke: A British Frontier Wall – ‘Debunked’, and a Wansdyke LiDAR Flyover video further visualizes my conclusions.

My work also often challenges established archaeological dogma. I argue that many sites, such as Hambledon Hill, commonly identified as Iron Age hillforts are not what they seem. My posts Lidar Investigation Hambledon Hill – NOT an ‘Iron Age Fort’ and Unmasking the “Iron Age Hillfort” Myth explore these ideas in detail and offer an alternative view. Similarly, sites like Cissbury Ring and White Sheet Camp, also receive a re-evaluation based on LiDAR analysis in my posts Lidar Investigation Cissbury Ring through time and Lidar Investigation White Sheet Camp, revealing fascinating insights into their true purpose. I have also examined South Cadbury Castle, often linked to the mythical Camelot56.

My research also extends to the topic of ancient water management, including the role of canals and other linear earthworks. I have discussed the true origins of Car Dyke in multiple posts including Car Dyke – ABC News PodCast and Lidar Investigation Car Dyke – North Section, suggesting a Mesolithic origin2357. I also explore the misidentification of Roman aqueducts, as seen in my posts on the Great Chesters (Roman) Aqueduct. My research has also been greatly informed by my post-glacial flooding hypothesis which has helped to inform the landscape transformations over time. I have discussed this hypothesis in several posts including AI now supports my Post-Glacial Flooding Hypothesis and Exploring Britain’s Flooded Past: A Personal Journey

Finally, my blog also investigates prehistoric burial practices, as seen in Prehistoric Burial Practices of Britain and explores the mystery of Pillow Mounds, often mistaken for medieval rabbit warrens, but with a potential link to Bronze Age cremation in my posts: Pillow Mounds: A Bronze Age Legacy of Cremation? and The Mystery of Pillow Mounds: Are They Really Medieval Rabbit Warrens?. My research also includes the astronomical insights of ancient sites, for example, in Rediscovering the Winter Solstice: The Original Winter Festival. I also review new information about the construction of Stonehenge in The Stonehenge Enigma.

Further Reading

For those interested in British Prehistory, visit www.prehistoric-britain.co.uk, a comprehensive resource featuring an extensive collection of archaeology articles, modern LiDAR investigations, and groundbreaking research. The site also includes insights and extracts from the acclaimed Robert John Langdon Trilogy, a series of books exploring Britain during the Prehistoric period. Titles in the trilogy include The Stonehenge Enigma, Dawn of the Lost Civilisation, and The Post Glacial Flooding Hypothesis, offering compelling evidence about ancient landscapes shaped by post-glacial flooding.

To further explore these topics, Robert John Langdon has developed a dedicated YouTube channel featuring over 100 video documentaries and investigations that complement the trilogy. Notable discoveries and studies showcased on the channel include 13 Things that Don’t Make Sense in History and the revelation of Silbury Avenue – The Lost Stone Avenue, a rediscovered prehistoric feature at Avebury, Wiltshire.

In addition to his main works, Langdon has released a series of shorter, accessible publications, ideal for readers delving into specific topics. These include:

For active discussions and updates on the trilogy’s findings and recent LiDAR investigations, join our vibrant community on Facebook. Engage with like-minded enthusiasts by leaving a message or contributing to debates in our Facebook Group.

Whether through the books, the website, or interactive videos, we aim to provide a deeper understanding of Britain’s fascinating prehistoric past. We encourage you to explore these resources and uncover the mysteries of ancient landscapes through the lens of modern archaeology.

For more information, including chapter extracts and related publications, visit the Robert John Langdon Author Page. Dive into works such as The Stonehenge Enigma or Dawn of the Lost Civilisation, and explore cutting-edge theories that challenge traditional historical narratives.

Other Blogs

s

t

Mesolithic River Avon

Rivers were higher in the past – Now UPDATED here: https://prehistoric-britain.co.uk/case-study-river-avon

At the outset, the clay-with-flints, a vestige of ancient weathering and erosion, stands as a testament to the relentless forces of nature that sculpted the landscape. Born from the remnants of Palaeogene sediments and the dissolution of chalk, these deposits serve as silent witnesses to the Pleistocene’s cold embrace. Their presence on the hilltop flats signifies a chronological anchor, predating the rhythmic succession of river terraces that stitch the valley’s quilt. (The Mesolithic River Avon)

Rivers were higher in the past (The Mesolithic River Avon)

As one descends the slopes, a mosaic of older head deposits unfolds, their genesis tied to the ancient processes of solifluction and solution. These sediments, bound to the clay-with-flint, narrate a tale of gradual descent and transformation, shaping the valley’s upper reaches with a subtle, yet profound, hand.

Further down the valley, the narrative evolves with the introduction of head gravel, gravelly head, and head deposits. These characters in the valley’s story are borne of fluvial transport, hill wash, hill creep, and solifluction—agents of change that have, over millennia, contributed to the valley’s sculptural form. The river terraces, numbering fourteen, ascend like steps from the valley floor, each a plateau from which to view the passage of time. The highest terraces, perched up to 100 meters above the valley, offer a broad vista extending 12 kilometers across, while the lower terraces, more intimate in their proximity to the present-day river, mark the recent chapters of geological history.

The consistency of thickness across these terraces speaks to a dynamic equilibrium of erosion and deposition, influenced by sediment overloading and tributary contributions. This interplay suggests a complex narrative of landscape evolution, one not solely dictated by the simplistic rhythm of Marine Isotope Stage cycles but enriched by a multifaceted process of lateral erosion and sediment redeposition.

Amidst this discussion of terraces and quaternary deposits, the narrative briefly diverges to contemplate the pre-Quaternary geology, where terraces from the River Avon linger in the Hampshire basin, their ages enshrouded in mystery. The challenges of dating these terraces, and by extension, understanding the full scope of the valley’s geological history, are underscored by recent findings that question traditional dating methods. Such inquiries not only deepen the mystery but also invite a reevaluation of our understanding of the Earth’s past.

Thus, we are reminded that the study of the Avon valley’s quaternary deposits is not merely an academic exercise but a profound exploration of the human quest for knowledge and understanding. It is a journey that connects us to the very essence of the natural world, revealing the intricate interplay of forces that have shaped not only the valley but also the broader tapestry of Earth’s geological history. (The Mesolithic River Avon)

Figure 5 - OSL Results Avon River (The Mesolithic River Avon)
Figure 5 – OSL Results Avon River
(The Mesolithic River Avon)

The intriguing findings presented in the diagrams regarding Optically Stimulated Luminescence (OSL) dating within the Avon valley unearth a complex narrative of sediment deposition and geological processes that challenges traditional understandings. The OSL results, as depicted in Figure 5, illuminate the temporal relationship between terrace formations and Marine Isotope Stages (MIS), while Figure 6, based on a three-dimensional model constructed from borehole data, offers a visual cross-section of the valley’s superficial geology.

The OSL ages for terraces T10 through T7, indicating deposition during or before MIS10/9, including the Last Glacial Maximum (LGM), suggest a timeline that not only aligns with but also refines previously established chronological frameworks. This refinement has significant implications for interpreting the archaeological record associated with Terrace T7 and recalibrating regional uplift and incision rates, which are crucial for understanding landscape evolution over geological timescales.

However, the apparent inconsistencies in the OSL dating results, particularly the dating of Terrace T7 before Terrace T10 and the identification of a Loess Terrace laid during the LGM, introduce a paradox into the sedimentary record. These anomalies challenge the linear progression implied by the terrace hypothesis that has guided interpretations of the valley’s geological history.

The highest terrace, T10, positioned at 102 meters above ordnance datum (OD) as illustrated in Figure 6, spans an unexpectedly broad temporal range of over 200,000 years, according to OSL dating. This finding disrupts the presumed chronological order, especially when juxtaposed with the dating of Terrace T7 at 58 meters OD, which, perplexingly, predates T10. Additionally, the Loess Terrace, situated at 77 meters OD and undifferentiated in the terrace sequence, laid down during the LGM, along with Terrace T4, which harbors the youngest dates, further complicates the scenario.

These results hint at a more intricate story of terrace formation and sediment deposition than previously thought. The seeming randomness and inconsistencies in the dating challenge the traditional terrace hypothesis and suggest that other factors, perhaps related to climatic variations, tectonic activities, or both, played significant roles in shaping the valley’s geomorphology.

The evidence points to a dynamic and possibly non-linear process of terrace formation, where episodes of sediment deposition were influenced by a combination of environmental conditions, rather than a simple chronological succession. This complexity underscores the need for a reassessment of the methods and models used to date and interpret terrace formations, advocating for a more nuanced understanding of the interplay between geological processes and climate change over the Pleistocene.

Thus, while the OSL dating provides valuable insights into the timing of terrace deposition, it also raises critical questions about the reliability of traditional chronological frameworks and the factors driving landscape evolution in the Avon valley. These findings invite further investigation and a reevaluation of existing hypotheses, highlighting the ongoing dialogue between past and present in the quest to decipher Earth’s geological history.

Figure 6- Avon River Terrace Levels - Avon River
Figure 6- Avon River Terrace Levels – Avon River
(The Mesolithic River Avon)

The authors’ observations highlight significant discrepancies and anomalies in the OSL dates that raise questions about the method’s reliability in certain contexts, particularly when compared to other dating methods like radiocarbon dating. These discrepancies are not merely academic curiosities; they fundamentally challenge our understanding of the temporal and environmental context in which these sediment layers were deposited.

The attempt to explain the notable discrepancy in the age estimates of Terrace T4 across different locations within the Avon valley suggests that sediment reworking due to recent fluvial processes or the presence of compound terraces exhibiting different depositional behaviors might be responsible. This acknowledgment of variability within the depositional environment underscores the dynamic nature of fluvial landscapes and the complexity of accurately dating such contexts.

The variability in OSL dates for samples taken at the same soil level (e.g., GL14039, GL14041, GL14038, GL14040) further complicates the narrative. The presence of nearly contemporaneous dates within error limits, juxtaposed with the significantly different sedimentation rates observed just below the topsoil, suggests that the depositional history of the Avon valley is more nuanced than previously understood. These findings indicate that relying solely on visual stratigraphy for dating purposes can lead to inaccuracies, reinforcing the need for a multi-methodological approach to construct a reliable chronological framework.

The comparison between OSL and radiocarbon dating, as discussed in the Gaigalas (2000) study, exemplifies the potential for significant age discrepancies between different dating methods. The observation that OSL dates can be substantially older than their radiocarbon counterparts highlights the need for caution and cross-validation when interpreting chronological data, especially in contexts where sediment exposure and reworking may have occurred.

The discussion of Holocene river flooding and its impact on the dating of river terraces introduces an additional layer of complexity. Flooding events can lead to the deposition of silt and other materials that obscure the original depositional sequence, potentially leading to out-of-sequence terrace dates. This phenomenon complicates attempts to use uplift modeling or the Palaeolithic record as reliable chronological markers, as evidenced by the discrepancies in age estimates for Terrace T7.

The passage concludes by emphasizing the potential of terrace deposits to provide a valuable chronological framework, albeit one that must be approached with caution. By integrating chronometric age control with detailed modeling of deposit height and thickness, researchers can gain a more nuanced understanding of the Avon valley’s landscape evolution. This approach not only enhances our interpretations of past hominin landscape use but also improves the predictive modeling of Palaeolithic sites. The challenges and discrepancies encountered in OSL dating underscore the importance of adopting a holistic and critically engaged approach to understanding the geological past, one that acknowledges the inherent complexities and uncertainties of dating dynamic fluvial landscapes.

Finally, archaeologists and geologists resist the fact that the river Avon was in Stonehenge Bottom during the Mesolithic and Neolithic period.  They insist that there is no evidence in the form of Alluvium or Colluvium in sufficient quantities to support my hypothesis.  This objection has a simple solution as Julian Richard’s suggested in his book ‘The Stonehenge Environs Project’: “colluvium sediments may have been removed or thinned by the action of seasonal streams or higher water tables in the past”. 

Macklin, as we have now seen in this section has identified over one hundred Holocene river floods, twelve of which lasted hundreds of years, that would have contributed to this lack of alluvium or colluvium at Stonehenge Bottom.  Moreover, the sources of the rivers that lay this sediment over the centuries of water flow, rely on massive precipitation entering the rivers, cutting through rocks and valleys making them flow at extreme levels which create this erosion and consequential sediment. However, the source of Palaeochannel water are natural springs found locally underground and therefore would not contain the same alluvium levels as active flowing rivers – resolving this dilemma.

Model of the number of flooded rivers in Britain - River Avon
Model of the number of flooded rivers in Britain – River Avon

UPDATE

More Empirical Evidence of Post-Glacial Flooding and a Flooded Stonehenge

River Avon River Terraces

 Prehistoric Levels and Widths for the River Avon

Take a close look at this illustration. It is not speculation, it is empirical science — mapped and measured river terraces from the Avon Valley, published in Egberts (2016), Pleistocene terrace formation and the Quaternary evolution of the Hampshire Basin, Bournemouth University.

What are we looking at?

  • These are the terrace steps cut by the River Avon over multiple glacial–interglacial cycles.
  • Each “T-level” marks a former stable floodplain where the river held its height for centuries, often millennia.
  • The heights are measured in metres OD (Ordnance Datum) and tied to known quarry and pit sites (e.g. Hatchet Gate Farm, Woodgreen, Somerley, Ashley).

💧 How much bigger was the Avon?

  • Today, the river meanders with a width of just ~50 m near Salisbury.
  • At its maximum (T11), the Avon floodplain stretched ~12 km across.
  • That is ~240 times wider than the river today.

🌊 What does this mean for Stonehenge?

  • Phase 1 of Stonehenge (Car Park Postholes) sits on T9 (~90 m OD).
  • Phase 2 (ditch, Aubrey Holes, bluestones) cuts into T8 (~75 m OD).
  • The terraces show that the palaeochannel not only flooded up to the old car park, but at times overtopped the entire Stonehenge site.

📐 Why this matters:

  • Terraces are not theory — they are empirical geomorphological evidence.
  • They prove that the Avon has flooded to multiple levels, sometimes far higher than the monument itself.
  • This is not about “if” water could reach those heights — the terraces prove it already has, repeatedly, over many Ice Age cycles.

So when critics dismiss the role of high water tables or argue “the site couldn’t have been wet,” they are ignoring the most basic geological record in front of us. The terraces are the diary of the river — written in gravel, chalk, and silt — showing that water rose and fell, over and over again.

👉 The real question is not if Stonehenge was surrounded by water. It is when, and how many times it happened during its long prehistory.

More information on the River Avon can be found at: https://youtu.be/j5LJ2sGcKOA

Further Reading

For information about British Prehistory, visit www.prehistoric-britain.co.uk for the most extensive archaeology blogs and investigations collection, including modern LiDAR reports.  This site also includes extracts and articles from the Robert John Langdon Trilogy about Britain in the Prehistoric period, including titles such as The Stonehenge Enigma, Dawn of the Lost Civilisation and the ultimate proof of Post Glacial Flooding and the landscape we see today.

Robert John Langdon has also created a YouTube web channel with over 100 investigations and video documentaries to support his classic trilogy (Prehistoric Britain). He has also released a collection of strange coincidences that he calls ‘13 Things that Don’t Make Sense in History’ and his recent discovery of a lost Stone Avenue at Avebury in Wiltshire called ‘Silbury Avenue – the Lost Stone Avenue’.

Langdon has also produced a series of ‘shorts’, which are extracts from his main body of books:

The Ancient Mariners

Stonehenge Built 8300 BCE

Old Sarum

Prehistoric Rivers

Dykes ditches and Earthworks

Echoes of Atlantis

Homo Superior

For active discussions on the findings of the TRILOGY and recent LiDAR investigations that are published on our WEBSITE, you can join our and leave a message or join the debate on our Facebook Group.

Other Blogs

s

t