In this video, Robert John Langdon presents mathematical, hydrological, and archaeological evidence that Stonehenge Phase 1—built around 8300 BCE—was Britain’s first true monument. Far older than the conventional 3000 BCE timeline, this reinterpretation reveals a water-filled sanctuary and healing centre, not a dry ceremonial circle. Using LiDAR, ditch profiles, and groundwater modelling, the evidence shows Stonehenge began as a moated medical site in the Mesolithic.
🧮 Key discoveries include: The Aubrey Holes, once thought to be for timber posts, align with water access and wooden palisades. The ditch and moat were dug to the water table, filling naturally and creating bathing pools. Bluestones dissolved minerals into the moat, acting like prehistoric “bath salts” for antiseptic healing. Mortuary slabs within a palisaded enclosure show the site doubled as a treatment centre and mortuary. Radiocarbon reliance on antler picks misdates the site to its abandonment, not its creation.
🔑 Main Arguments: • Stonehenge Phase 1 was a hydrological monument, designed around water, not astronomy. • It functioned as a medical sanctuary, where bluestone-infused waters were used for healing. • The earliest construction aligns with Britain’s high post-glacial water table, not later Neolithic dryland farming.
📏 Methodology Highlights: LiDAR analysis of river valleys and ditch alignments Hydrological modelling of groundwater recession since the Ice Age Archaeological reinterpretation of excavation reports (Aubrey Holes, Station Stones, ditch profiles) Mathematical alignment with Stonehenge’s measured geometry and ditch depth
🚨 This changes everything: Stonehenge did not begin as a late Neolithic temple. It was originally Britain’s first healing monument, built by a Mesolithic boat-using civilisation.
📚 Based on empirical LiDAR, ditch stratigraphy, and hydrological data cross-referenced with archaeological excavation reports.
00:00 Stonehenge Phase One — Britain’s First Monument 00:05 Introduction — The Forgotten Phase 01:12 How We Know Stonehenge Phase One Dates to 8300 BCE 03:08 Layout and Function — The Real Purpose of the Site 05:26 The Bluestones — Transport, Composition and Use 07:10 The Water — How It Worked and Why It Mattered 08:25 Evidence of Bluestone Reuse and Replacement 09:43 The Healing Spring at Carn Menyn 13:10 The Palisade and the Silent Towers 14:30 Decline and Transition to Phase Two 15:39 Conclusion — A Monument Built on Function, Not Fantasy
Key Findings
Here are 8 key findings drawn directly from the transcript:
Stonehenge Phase One is argued to date to around 8300 BCE, based on radiocarbon dates from Stonehenge postholes and comparable dates from Preseli quarry activity.
The earliest Stonehenge is presented as a practical health and mortuary site, not primarily as a temple or ceremonial monument. Its layout is interpreted as combining water, excarnation and controlled access.
The ditch is interpreted as a water-filled moat or therapeutic bathing system, supplied by the local chalk aquifer rather than as a purely symbolic earthwork.
Bluestones are argued to have been deliberately chipped and placed into the water, allowing salts and trace minerals to leach into the moat and create a mineral-rich treatment environment.
The large number of bluestone fragments is interpreted as evidence of repeated use and replacement, rather than simple accidental breakage or collapse.
The Preseli spring at Carn Menyn is proposed as a physical model for Stonehenge’s mineral-water system, suggesting that the same stone was transported to reproduce the properties of the Welsh spring.
The Y and Z holes are interpreted as evidence for a timber palisade enclosing excarnation platforms, creating a controlled area where scavenger birds could remove flesh before bones were transferred elsewhere.
The transition to Phase Two is linked to falling water levels, with the decline of the aquifer-fed system prompting a shift away from the original practical function toward the later monumental Stonehenge.
Transcript
Introduction — The Forgotten Phase
Most people imagine Stonehenge as the great sarsen trilithons. In fact, those belong to Phase Two, constructed around 4300 BCE. The real story begins much earlier.
Phase One, built around 8300 BCE, was entirely different in form and function.
This earliest version of Stonehenge was a working health and mortuary site. It featured a chalk-cut moat that held water, 58 imported Preseli bluestones, and a timber palisade enclosing raised stone platforms for excarnation.
Birds were allowed to clean the dead, a practice still seen today in India’s Towers of Silence. The Y and Z holes marked the outer limits of the palisade. The Q and R holes defined where excarnation slabs once stood.
The entire setup was pragmatic, not ritualistic.
How We Know Stonehenge Phase One Was Built Around 8300 BCE
The date for Stonehenge Phase One is not speculative. It is supported by radiocarbon dating from multiple sites.
Charcoal samples from postholes discovered during the Stonehenge car park excavation have been dated to around 8300 BCE.
This corresponds closely with two quarry sites in the Preseli Hills of Wales, where evidence of human activity, including hearths associated with stone extraction, has also produced C14 dates from the same period.
These sites are not random campfires but appear to be linked directly to quarrying activity associated with the bluestones.
This level of coordination between quarrying and monument construction suggests an advanced society operating across hundreds of miles, capable of planning and logistics long before the Neolithic.
The matched radiocarbon dates from the quarry and monument provide strong empirical support for the theory that bluestones were transported and erected at Stonehenge in the ninth millennium BCE.
Hydrological modelling further reinforces the idea that this was the period when the chalk aquifer could have provided a permanent water source at the monument. But it is the radiocarbon evidence, independently dated at both source and site, that fixes Stonehenge Phase One to approximately 8300 BCE.
This would make it the earliest scientifically verified monumental construction in the British Isles.
Layout and Function — The Real Purpose of the Site
The layout of Phase One was deliberate and practical.
At the centre were the Q and R holes, which supported dolmen-style excarnation slabs: single flat stones balanced precisely on pointed supports to deter rodents.
These slabs were used to expose bodies to the elements and scavenger birds — an efficient and sanitary method of processing the dead.
The palisade surrounding the structure, marked by the Y and Z holes, enclosed this inner space to protect the area while allowing avian access.
The design shows a clear understanding of decomposition cycles and scavenger behaviour.
The north-west orientation of the Q and R hole alignment corresponds to the Moon’s setting position, reinforcing the functional connection between death and timing.
The number of bluestones — 58 — was not arbitrary. It corresponds with a lunar cycle used to track the Moon’s 18.6-year nodal variation and eclipse cycle.
This knowledge was likely vital for excarnation timing, navigation and tidal awareness — critical information for a riverine trading society.
The Bluestones
The bluestones themselves were never intended simply to remain intact.
As noted by Darvill and Wainwright, the bluestones were chipped from almost immediately. More than 3,675 fragments have been discovered — a remarkable total given that only around half of the site has been excavated.
These fragments were deliberately introduced into the chalk moat.
With their mineral and rock-salt content, the bluestone chips enriched the water, enhancing its potential medicinal properties.
This suggests that Stonehenge Phase One was not a ceremonial temple, but a sophisticated facility for managing death, disease and recovery.
Transport, Composition and Use
The Preseli bluestones used at Stonehenge were transported from south-west Wales, likely using river and canal networks rather than being dragged overland.
The discovery of an ancient prehistoric catamaran boatyard in Wales suggests that heavy loads could have been transported using double-hulled craft.
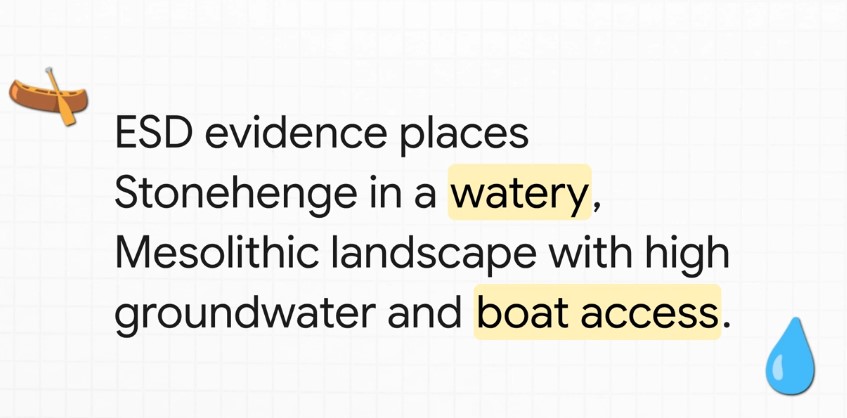
Britain’s river levels were significantly higher at the time, which could have enabled direct water transport towards the site without requiring the type of overland journey normally imagined.
But what matters more than their origin is their composition.
The Preseli stones contain salts, copper and trace minerals that can leach into water when submerged or broken.
More than 3,675 bluestone fragments have been found in the moat area.
This suggests that the stones may have been intentionally broken up to release minerals into the water, creating a form of early mineral spa.
This interpretation is further supported by Darvill and Wainwright, who observed that the stones were being chipped from the time of their erection and proposed that Stonehenge may have served as a healing centre.
This evidence strengthens the argument that Stonehenge functioned primarily as a public-health structure, particularly concerned with sepsis and infection — major causes of death in prehistoric society.
The Water — How It Worked and Why It Mattered
The chalk-cut ditch surrounding the central enclosure was not ornamental.
It was a functional water feature drawing from a naturally high water table during the Mesolithic.
The aquifer-fed ditch would have maintained mineral-rich water around the site, turning the enclosed area into a therapeutic environment.
Bluestone chippings, deliberately broken and deposited in this moat, would have slowly released salts and trace elements into the water.
Salt has antiseptic properties and is still used in wound care today. Soaking injuries in such water could therefore have helped clean wounds and possibly reduce infections in a world without antibiotics.
The antlers found in the ditch have traditionally been interpreted as construction tools.
An alternative explanation is that they were dredging tools used to maintain the flow and clarity of the water system.
They were found in later layers, suggesting periodic cleaning and maintenance of the moat rather than necessarily being tools used in its original excavation.
Evidence of Reuse and Replacement
Conventional narratives tend to portray the stones as being erected once and then remaining in place.
However, C14 dating and excavation records suggest a more complicated history.
The bluestones appear to have been replaced multiple times over a prolonged period, rather than simply being transported once and left standing.
Dating of stone-socket fills indicates repeated insertion events, in some cases separated by centuries.
This supports the idea that the site was actively maintained rather than simply abandoned or commemorated.
Within this model, replacement intervals may have been connected to mineral depletion. Once sufficient salts and trace minerals had leached from existing stones, they could have been broken up and replaced.
This could explain the extraordinarily large number of fragments despite the limited amount of the monument that has been excavated.
With only around 50 per cent of the site dug, more than 3,600 fragments have already been recovered, meaning the total surviving quantity could potentially be considerably greater.
Under this interpretation, these were not simply random breakages or damage caused by collapse. The stones were systematically chipped and the material deposited into the water.
The Healing Spring at Carn Menyn
A major criticism of the healing-stones hypothesis has been the supposed lack of empirical evidence.
But research at Carn Menyn in the Preseli Mountains — one of the proposed source areas for Stonehenge bluestones — reveals a now-dry sacred springhead that may help explain the stones’ original significance.
Gordon Freeman’s fieldwork identified a collapsed cromlech and associated cairn built directly over a once-flowing freshwater spring known locally as Pen y Tarddiant Sanctaidd — the Holy Springhead.
This spring fed a stone-lined stream channel called Rhestr Gerrig, or “Stone Row”, which wound through the landscape towards a marshy area known as Fat Hazelnut Bog.
Although this water source has since dried up, its historical importance appears considerable.
The spring was significant enough to have a formal monument constructed over it, and the fact that a cromlech capped the spring suggests a long tradition of ritualised — and potentially therapeutic — use.
But this may be more than symbolism.
The springhead sits within the geological formation associated with spotted dolerite bluestone.
If the spring water passed through mineral-bearing rock, it could have absorbed salts and trace mineral ions.
The potential effects of mineral water on wounds could have been observed by prehistoric people without any knowledge of modern biochemistry.
This provides a practical reason why the same stone could have been deliberately selected and transported more than 200 kilometres to the chalk aquifer basin at Stonehenge: to reproduce the properties associated with the Preseli water source.
Under this interpretation, the deliberate chipping of bluestones and depositing of their fragments into the moat was not ceremonial destruction.
It was chemical replication.
The stones infused the water with trace minerals, producing a mineralised bathing system intended to reproduce the healing waters associated with the original spring in Wales.
Taken together, the presence of a prehistoric sacred spring, the mineral composition of bluestone and the evidence for deliberately broken bluestone at Stonehenge allow archaeology, geology and hydrology to be considered together as a functional explanation for what has traditionally been labelled a ritual monument.
Stonehenge Phase One was therefore not simply a temple.
It may have been Britain’s first public-health sanctuary, with the spring at Carn Menyn providing its biochemical blueprint.
The Palisade and the Silent Towers
One of the most overlooked features of Stonehenge Phase One is the timber palisade surrounding the inner platforms.
This structure was not necessarily defensive. It could have served a functional and hygienic purpose, containing excarnation within the central area while restricting access.
This enclosure is defined by the Y and Z holes, which are consistent and evenly spaced.
Within this interpretation, they formed the foundation for uprights surrounding a series of protected raised platforms.
Birds — particularly carrion feeders such as jackdaws, ravens and crows — were allowed access to clean the bodies.
The cleaned bones were then taken to nearby Long Barrows for interment.
This practice resembles the principle employed by India’s Towers of Silence, where sky-burial traditions involve exposure of the dead to carrion birds.
It reflects a process of natural decomposition and purification.
Stonehenge’s arrangement therefore provided a sanitary and repeatable method of processing the dead, remarkable for its time.
Decline and Transition to Phase Two
Over time, the water table dropped as the aquifer drained and post-glacial rebound altered the landscape.
The once-functioning moat began drying up and the mineral bath became less effective.
This environmental change marks the end of Phase One and the beginning of a new chapter in the life of Stonehenge.
The bluestones were gradually replaced by larger sarsen stones, marking a transition from a practical medical site to something more monumental.
These sarsens were installed around 4300 BCE, beginning what most people today incorrectly consider to be the start of Stonehenge.
This change is reflected in the construction of the Avenue, a wide route leading away from the original riverfront location towards a new shoreline farther to the north-east.
This redirection reflects both astronomical alignments and the practical reality of hydrological change.
Conclusion — A Monument Built on Function, Not Fantasy
The first phase of Stonehenge was not a mystical temple, a ceremonial gathering place or simply a stone calendar.
It was a public-health structure grounded in the harsh realities of Mesolithic life: infection, injury and death.
Its foundation was not spiritual conjecture but practical science, built on a prehistoric shoreline, maintained by a saturated aquifer and enriched by mineral-laden bluestone chips introduced into the water.
It was a place of triage, treatment and transformation.
Thanks to a new mathematical dating model — grounded in radiocarbon evidence from quarry hearths, site postholes and hydrological mapping — Phase One can be placed at around 8300 BCE.
This would place Stonehenge among the oldest monumental structures in Europe and dismantle the conventional late-Neolithic timeline proposed for its beginnings.
It was not a late-Neolithic curiosity, but a pioneering Mesolithic achievement.
And this was a rational, functional innovation, unlike the speculative calendars and solar temples traditionally proposed.
Archaeologists have consistently struggled to interpret key features of the site.
The postholes forming the central crescent pattern align with where excarnation slabs could have stood. Their unusual shape and placement remain largely unacknowledged in conventional interpretations.
Even the surrounding palisade, indicated in this model by the Y and Z holes, has received little consideration as a protective and hygienic structure.
Traditionally described simply as a ceremonial ditch, the ditch may instead have been a ring of water-filled pits designed to accommodate seating platforms below water level for therapeutic bathing.
This unusual design is central to understanding what Stonehenge might originally have been.
The fog is lifting with advances in LiDAR, mineral analysis, hydrology and radiocarbon calibration.
Stonehenge Phase One should now be considered as a potential candidate for Britain’s first scientific structure — a masterpiece of Mesolithic engineering, biology and community medicine, misunderstood for thousands of years by a profession still reluctant to let go of fantasy.
Author’s Biography
Robert John Langdon, a polymathic luminary, emerges as a writer, historian, and eminent specialist in LiDAR Landscape Archaeology.
His intellectual voyage has been interwoven with stints as an astute scrutineer in government and grand corporate bastions, a tapestry spanning British Telecommunications, Cable and Wireless, British Gas, and the esteemed University of London.
A decade hence, Robert’s transition into retirement unfurled a chapter of insatiable curiosity. This phase saw him immerse himself in Politics, Archaeology, Philosophy, and the enigmatic realm of Quantum Mechanics. His academic odyssey traversed the venerable corridors of knowledge hubs such as the Museum of London, University College London, Birkbeck College, The City Literature Institute, and Chichester University.
In the symphony of his life, Robert is a custodian of three progeny and a pair of cherished grandchildren. His sanctuary lies ensconced in the embrace of West Wales, where he inhabits an isolated cottage, its windows framing a vista of the boundless sea – a retreat from the scrutinising gaze of Her Majesty’s Revenue and Customs, an amiable clandestinity in the lap of nature.
Exploring Prehistoric Britain: A Journey Through Time
My blog delves into the fascinating mysteries of prehistoric Britain, challenging conventional narratives and offering fresh perspectives grounded in cutting-edge research, particularly LiDAR technology. I invite you to explore some key areas of my research. For example, the Wansdyke, often cited as a defensive structure, is re-examined in light of new evidence. I’ve presented my findings in my blog post Wansdyke: A British Frontier Wall – ‘Debunked’, and a Wansdyke LiDAR Flyover video further visualises my conclusions.
My work also often challenges established archaeological dogma. I argue that many sites, such as Hambledon Hill, commonly identified as Iron Age hillforts, are not what they seem. My posts Lidar Investigation Hambledon Hill – NOT an ‘Iron Age Fort’ and Unmasking the “Iron Age Hillfort” Myth explore these ideas in detail and offer an alternative view. Similarly, sites like Cissbury Ring and White Sheet Camp receive re-evaluations based on LiDAR analysis in my posts “Lidar Investigation Cissbury Ring through time”and “Lidar Investigation White Sheet Camp,“ revealing fascinating insights into their true purpose. I have also examined South Cadbury Castle, often linked to the mythical Camelot.
My research also extends to ancient water management, including the role of canals and other linear earthworks. I have discussed the true origins of Car Dyke in multiple posts, including Car Dyke – ABC News Podcast and Lidar Investigation Car Dyke – North Section, which suggest a Mesolithic origin 2357. I also explore the misidentification of Roman aqueducts, as seen in my posts on the Great Chesters (Roman) Aqueduct. My research has also been greatly informed by my post-glacial flooding hypothesis, which has helped explain landscape transformations over time. I have discussed this hypothesis in several posts, including AI now supports my Post-Glacial Flooding Hypothesis and Exploring Britain’s Flooded Past: A Personal Journey
Long before modern geological surveys were conducted, archaeologists had already begun investigating the interior of the Stonehenge enclosure. Between 1919 and 1926 Lieutenant-Colonel William Hawley carried out the first systematic excavations of the monument. His work was followed by later investigations, most notably those directed by Richard Atkinson during the mid-twentieth century. (The Stonehenge Enigma; The Archaeological Evidence)
These excavations were primarily concerned with understanding the monument’s construction sequence. Trenches were opened across the ditch, around the stone settings, and within many of the features that form the complex layout of Stonehenge. The discoveries made during these investigations established much of the archaeological framework that is still used to interpret the monument today.
However, the excavation reports also contain numerous observations on the soil, sediments, and fills encountered during excavation. At the time, these descriptions were simply recorded as part of the archaeological record. In hindsight, some of these observations provide important clues about the environmental conditions that existed at the site.
One of the most striking features uncovered during the early excavations was the nature of the ditch surrounding the monument. Rather than being cut into solid chalk alone, the ditch contained a mixture of chalk rubble, silts, and other sediments that had accumulated within it after its construction.
(The Stonehenge Enigma; The Archaeological Evidence)
Figure 5 – Hawley’s Ditch Excavations and the ‘Dark Layer’
In places, the lower fills of the ditch were described as soft chalk slurry and silty deposits, suggesting that water had been present within the feature at various times. Such conditions can occur when rainwater or groundwater collects within excavated hollows, gradually depositing fine sediments as the water settles.
Similar observations were made in other features within the monument. Some excavated pits and holes contained deposits of fine silt and mixed sediments, rather than the simple collapse of chalk rubble that might be expected in a completely dry environment.
These details attracted relatively little attention at the time because the primary goal of the excavations was to establish the chronology of the monument rather than reconstruct its environmental setting. Nevertheless, the descriptions recorded in the excavation reports remain valuable pieces of evidence.
When viewed alongside the geological evidence discussed in the previous chapter, these archaeological observations begin to take on a new significance. Features that were once interpreted simply as construction cuts or refuse deposits may also reflect the interaction between the monument and the surrounding hydrological environment.
In other words, the excavations did not merely reveal the architecture of Stonehenge; they also recorded traces of the landscape conditions in which the monument once stood.
The importance of this relationship between archaeology and environment becomes clearer when the wider Stonehenge landscape is considered. The monument was not an isolated structure but part of a much larger complex of earthworks, avenues, and associated sites that extend across the surrounding countryside.
Understanding how these features relate to one another requires us to look beyond the excavation trenches and examine the broader landscape in which Stonehenge was built.
The earliest structural feature at Stonehenge is the circular earthwork enclosure that surrounds the monument. This enclosure consists of a ditch approximately 100 metres in diameter, with an internal bank formed from the chalk removed during its excavation.
The first systematic investigation of this feature was carried out by Lieutenant-Colonel William Hawley between 1919 and 1926. Hawley opened several trenches across the ditch and bank in order to understand how the monument had been constructed. His excavations confirmed that the ditch had been cut directly into the natural chalk bedrock that underlies Salisbury Plain.
Hawley recorded the ditch as being roughly 6–7 metres wide and up to 2 metres deep, with a steep inner face and a more gradual outer slope. The chalk removed from the ditch had been thrown inward to form the surrounding bank, creating the circular boundary that still defines the monument today.
Later excavations and reassessments of Hawley’s work confirmed that this enclosure represents the earliest construction phase of the monument. The circular earthwork established the basic layout of the site, around which later features—including the stone settings—were arranged.
While the purpose of the ditch and bank has often been interpreted simply as a boundary marker, the excavation reports contain several observations about the ditch fills that deserve closer examination.
(The Stonehenge Enigma; The Archaeological Evidence)
Hawley observed that the lowest fills of the ditch consisted largely of collapsed chalk rubble that had fallen from the sides of the excavation over time. Above this material were layers of fine silts and mixed sediments that had gradually accumulated within the hollow.
In certain sections of the ditch, Hawley also recorded the presence of a dark organic layer lying above the lower chalk deposits. Such layers can develop when water remains within a feature long enough for organic material and fine sediments to settle and accumulate.
Another observation made during the excavations was the presence of clay deposits within parts of the ditch base. Clay is not a common material in the surrounding chalk downland, and its occurrence in the ditch suggests it may have been deliberately introduced.
Perhaps the most unusual feature described in the excavation reports was the occurrence of densely packed flints within sections of the ditch floor. These flints appeared to have been compacted into the underlying sediments, suggesting that they had been trodden or pressed into place rather than simply deposited as loose rubble.
(The Stonehenge Enigma; The Archaeological Evidence)
Taken individually, these observations might appear unremarkable. However, when considered together, they suggest that the ditch experienced conditions quite different from those expected in a permanently dry chalk environment.
When the ditch observations are viewed in light of the geological setting described in the previous chapters, a more complex picture begins to emerge.
The Stonehenge enclosure lies within a shallow basin in the chalk plateau of Salisbury Plain. In chalk landscapes, groundwater levels can fluctuate significantly depending on climatic conditions. When groundwater rises, or prolonged rainfall occurs, water may collect in depressions and excavated features before draining away towards nearby river valleys.
Under such circumstances, a ditch cut into chalk bedrock could temporarily hold water. Standing or slow-moving water would allow fine silts and organic material to settle, producing the types of deposits described in the excavation reports.
The combination of clay deposits and compacted flints recorded in parts of the ditch is also noteworthy. A similar construction method has long been used to form traditional dew ponds on chalk downlands. In such ponds, a layer of clay is used to seal the basin, while chalk rubble or flints are pressed into the surface to stabilise the lining and prevent erosion.
The resemblance between these construction techniques and the features recorded in the Stonehenge ditch does not necessarily mean that the enclosure was intended to function as a dew pond. However, the similarities suggest that the builders may have been aware of how clay and compacted stone could be used to control or retain water within excavated features.
(The Stonehenge Enigma; The Archaeological Evidence)
Whether the ditch occasionally held water as a result of natural hydrological conditions, or whether aspects of its construction were intended to influence how water behaved within the enclosure, remains an open question. What is clear from the excavation record is that the ditch did not remain a simple dry hollow throughout its history.
These observations provide an important reminder that the archaeological features at Stonehenge cannot be fully understood without considering the environmental conditions of the surrounding landscape
Closer examination of the excavation reports also reveals an important structural detail about the enclosure ditch that is often overlooked. Although the monument is usually described simply as a continuous circular ditch, Hawley’s excavation trenches showed that the feature was not cut as a uniform trench in the manner of a conventional defensive earthwork.
Instead, sections of the ditch appear to have been excavated as a series of adjoining pits or scoops, separated by short chalk walls or uncut partitions. In some places, the sides of these pits formed distinct vertical faces, while the bases contained flattened areas resembling seating ledges or working platforms within the chalk.
This segmented construction is unusual when compared with later defensive or boundary ditches, which are normally dug as continuous trenches designed to maximise obstruction or drainage. The Stonehenge enclosure, by contrast, appears to have been created through a sequence of individual excavation pits that collectively form the circular earthwork seen today.
Such a design raises important questions about how the feature functioned. A series of adjacent pits would behave very differently from a continuous drainage ditch. Individual hollows within the ring could potentially retain water independently, particularly if parts of the base were lined or compacted as suggested by the clay deposits and trodden flints described earlier.
(The Stonehenge Enigma; The Archaeological Evidence)
Figure 7- The UNIQUE ditch showing Pits , Walls and Seats
In this sense, the enclosure may have functioned less like a defensive ditch and more like a chain of shallow basins arranged around the perimeter of the monument. Whether these basins were intentionally designed to interact with water, or whether this behaviour emerged from the way the ditch was excavated into the chalk, remains an important question when considering the environmental setting of Stonehenge.
These observations provide an important reminder that the archaeological features at Stonehenge cannot be fully understood without considering the environmental conditions of the surrounding landscape.
This brings us to one of the most intriguing elements of the monument’s earliest phase: a ring of pits discovered just inside the enclosure ditch. Known today as the Aubrey Holes, these features are among the most distinctive and debated components of the Stonehenge layout.
Just inside the enclosure ditch lies a ring of 56 evenly spaced pits, known as the Aubrey Holes. These features are among the earliest structural elements of the monument and define a circle approximately 87 metres in diameter.
The pits were first recognised in the seventeenth century by the antiquarian John Aubrey, but their archaeological significance was confirmed during the excavations of William Hawley in the 1920s. Hawley demonstrated that the features were deliberately excavated pits cut into the chalk bedrock, each roughly 1 metre in diameter and about 1 metre deep.
The precision of their layout is striking. Fifty-six pits are spaced almost perfectly around the interior of the enclosure, producing a regular circular array that would have required careful measurement during construction. The labour required to excavate such a ring into solid chalk also indicates that the feature served a deliberate and specific purpose.
Despite more than a century of study, conventional archaeological interpretations have never provided a convincing explanation for why exactly 56 pits were constructed in this precise circular arrangement.
(The Stonehenge Enigma; The Archaeological Evidence)
Figure 8 – Bluestone in an Aubrey Hole and the Ditch Relationship
A circle divided into fifty-six positions creates a simple numerical system capable of tracking repeating natural cycles. When used sequentially, the ring allows a marker to move around the circle one position at a time, returning to the starting point after completing the cycle.
The significance of this number becomes clear when compared with the behaviour of tidal and lunar cycles. The circle of 56 positions can represent two consecutive 28-day tidal cycles, allowing the system to track the repeating pattern of tidal strength associated with the Moon.
By advancing a marker one position each day, the circle becomes a continuous counting mechanism. After two 28-day cycles, the marker returns to its starting point and the sequence begins again.
Such a system requires only a simple rule: one movement per day.
The Aubrey circle can therefore be operated using a single movable marker.
In this arrangement:
• each Aubrey hole represents one day • the marker advances one position per day • the full circle records two tidal cycles • the sequence then repeats indefinitely
This creates a simple analogue system for tracking the strength of tidal cycles through time.
For societies dependent on water transport, such information would have been highly valuable. Predicting when strong or weak tides would occur allows travellers to plan journeys through shallow waterways, estuaries, and flooded river systems where water levels and currents change dramatically during the lunar cycle.
The Aubrey ring therefore functions not merely as a geometric feature but as a circular counting mechanism capable of encoding natural environmental cycles.
(The Stonehenge Enigma; The Archaeological Evidence)
When the Aubrey ring is considered within the wider landscape context described earlier in this book, its significance becomes clearer.
If prehistoric Britain possessed higher groundwater levels, expanded river systems, and extensive wetlands—as suggested by geological and borehole evidence—then movement through the landscape would often have depended on water. Travel along rivers, flooded valleys, and coastal inlets would have required knowledge of changing water levels and tidal behaviour.
In such an environment, the ability to predict tidal strength and water movement would have been a practical necessity. The Aubrey circle offers a simple yet effective mechanism for tracking these cycles over time.
Seen in this light, the monument can be interpreted not simply as ceremonial architecture but as an environmental computing device—a fixed geometric structure used to measure and predict the rhythms of the natural world.
A more detailed analysis of this operating system, including the role of the bluestones and the North and South Barrows that are within the ditch ring which helps indicating tidal strength and the full mechanics of the Stonehenge tidal model, is presented in the companion study Stonehenge: The World’s First Computer, where the system is examined in depth.
The earliest phase of Stonehenge therefore combines two key elements:
• the segmented enclosure ditch • the 56-hole Aubrey ring
Both were excavated directly into the chalk bedrock and form part of the monument’s ground architecture.
Together they suggest that the earliest builders of Stonehenge were not simply creating a symbolic enclosure but constructing a carefully designed geometric system embedded within the landscape.
In this interpretation, the monument began as a functional instrument, capable of tracking environmental cycles that influenced movement and activity within the surrounding landscape.
Understanding how this early system developed further requires examining the next phase in the monument’s construction: the erection and arrangement of the stone settings that transformed Stonehenge into one of the most recognisable structures of prehistoric Britain.
(The Stonehenge Enigma; The Archaeological Evidence)
The smaller stones within the Stonehenge monument are known as bluestones, typically weighing between two and four tonnes. Unlike the larger sarsen stones that dominate the later monument, the bluestones are composed of several distinct volcanic and igneous rock types not found on Salisbury Plain.
Recent advances in geochemical fingerprinting have allowed archaeologists to match these stones to specific outcrops in the Preseli Hills of western Wales. Among the most significant of these locations is the quarry site at Craig Rhos-y-Felin, along with additional sources such as Carn Goedog and other nearby Preseli outcrops.
These discoveries have confirmed that the bluestones used at Stonehenge originated more than 200 kilometres away from the monument.
Identifying the quarry sources, however, raises a far more important question: when were these stones quarried and transported?
Excavations at Craig Rhos-y-Felin and Carn Goedog have revealed clear signs of prehistoric activity associated with the extraction of bluestones.
At Craig Rhos-y-Felin archaeologists discovered human-made hearths, stone tools, and a partially quarried monolith still embedded in the rock face. These findings demonstrate that the outcrop was not simply a natural deposit but a location where stone was deliberately worked.
Radiocarbon dating of charcoal from these hearths has produced a series of dates indicating repeated human activity at the quarry sites.
Crucially, many of these dates fall within the Mesolithic period, long before the Neolithic period traditionally associated with the construction of Stonehenge.
The presence of these hearths, together with the quarry features themselves, indicates that people were working these outcrops and interacting with the bluestone deposits thousands of years earlier than previously assumed.
(The Stonehenge Enigma; The Archaeological Evidence)
The geographical setting of the quarry sites provides further clues about how the stones may have been transported.
Craig Rhos-y-Felin lies beside what was once a substantial river system feeding into the River Nevern. Radiocarbon dating of the palaeochannel deposits indicates that this watercourse flowed past the quarry outcrop for thousands of years, extending to within a few metres of the rock face.
Evidence from the site suggests that during the Mesolithic period the river was significantly larger than the stream visible today.
This positioning is significant. It places the quarry directly on the edge of a navigable waterway capable of transporting heavy materials.
Similar patterns appear elsewhere in the Preseli region. Other bluestone sources, including Carn Goedog and nearby outcrops, are also connected by streams and rivers leading toward larger river systems.
The quarry sites therefore sit within a network of waterways that would have provided natural transport routes across the landscape.
Transport by River
Moving multi-tonne stones across rugged terrain presents enormous logistical challenges if attempted overland. By contrast, transporting heavy loads by water is far more efficient, as buoyancy allows boats or rafts to carry stones with relatively little effort.
The location of the bluestone quarries along river systems suggests that water transport may have been the primary means of moving these stones.
Rather than dragging stones across mountains, forests, and valleys, it would have been far easier to load them onto boats and transport them along the river systems connecting the Preseli region to the wider landscape.
This possibility becomes even more plausible when the environmental conditions of the early Holocene are considered. Higher water levels and expanded river systems would have made river navigation far more practical than it appears today.
(The Stonehenge Enigma; The Archaeological Evidence)
Additional discoveries include a piece of rhyolite associated with one of these features and charcoal recovered from stone sockets near the monument.
These findings indicate that the Stonehenge landscape was already a place of human activity thousands of years before the traditionally accepted Neolithic construction date of the monument.
6. Connecting the Quarry Sites and Stonehenge
When the radiocarbon evidence from the Welsh quarry sites is compared with the Mesolithic dates obtained from Stonehenge, an intriguing pattern emerges.
Both locations show evidence of human activity during overlapping periods of the Mesolithic era.
This overlap raises an important question: could the activity recorded at the quarry sites and the early activity recorded at Stonehenge be connected?
To answer this question, it is necessary to examine the radiocarbon datasets from both locations in detail and determine whether the similarities between them could have occurred by chance.
The Code
A detailed analysis of the radiocarbon datasets from Stonehenge and the Welsh quarry sites reveals a remarkable statistical relationship between the two.
When the calibrated radiocarbon ranges from the Stonehenge post holes are compared with those from Craig Rhos-y-Felin and Carn Goedog, the probability that the observed overlaps occurred purely by chance becomes extraordinarily small.
Using a probability model that compares the overlapping ranges of these independent radiocarbon samples, the likelihood that the pattern occurred by chance is approximately 1 in 1.27 × 10²⁹.
In practical terms, this probability is so small that it strongly suggests a genuine chronological relationship between the activity recorded at the Welsh quarry sites and the early activity at Stonehenge.
This statistical pattern forms what may be described as The Stonehenge Code.
The mathematical analysis behind this conclusion, and the implications it has for the dating of Stonehenge’s earliest phase, will be examined in detail in the following chapter.
The accepted chronology of Stonehenge places its construction within the Neolithic period, beginning around 3000 BCE and continuing through several later phases of modification. This interpretation has remained largely unchanged for decades and forms the basis of most archaeological explanations of the monument.
However, a growing body of radiocarbon evidence challenges this timeline.
Excavations at both Stonehenge and the Welsh bluestone quarry sites have produced a series of dates that extend deep into the Mesolithic period. These dates have often been treated as isolated anomalies because they do not fit comfortably within the accepted Neolithic framework.
Yet when these dates are examined together rather than individually, a striking pattern begins to emerge.
Recent carbon dating at the bluestone quarry sites provides compelling, irrefutable mathematical evidence that Stonehenge’s construction dates to the Mesolithic era. This new data suggests Stonehenge is approximately 5000 years older than experts had previously believed, challenging established views on its origins and adding new depth to our understanding of this ancient monument
Evidence for Mesolithic activity at Stonehenge has been known for decades.
During excavations in 1966, Lance and Faith Vatcher discovered several post holes near Stonehenge, close to the location of the old visitor car park. These holes were initially interpreted as having a Neolithic character, although no datable pottery was found.
Later analysis revealed that charcoal from these features consisted largely of pine. This created a problem for the established chronology, as pollen evidence suggested pine had disappeared from the area before the supposed Neolithic construction of Stonehenge.
Radiocarbon dating eventually placed these pine charcoal samples firmly within the Mesolithic period, producing dates between approximately 8860 BCE and 6590 BCE.
Figure 9- Old Car Park Post Holes
Rather than prompting a reassessment of Stonehenge’s chronology, these early dates were generally dismissed as evidence of unrelated Mesolithic activity, sometimes interpreted as the remains of totem poles erected by hunter-gatherer groups passing through the landscape.
Further discoveries complicated the situation.
In 1988–89, Wessex Archaeology uncovered another Mesolithic posthole, along with a piece of rhyolite dated between 7737 and 7454 BCE. Additional charcoal discovered in the socket of Stone 10 during excavations by Darvill and Wainwright produced dates between 7330 and 7060 BCE.
These findings indicate that human activity at Stonehenge began thousands of years earlier than the accepted Neolithic construction date.
Figure 10 – Another Old Car Park Post Hole found in 1988
At the same time that early dates were appearing at Stonehenge, excavations in the Preseli Hills of Wales began identifying the sources of the monument’s bluestones.
Quarry sites at Craig Rhos-y-Felin and Carn Goedog revealed evidence of prehistoric quarrying activity, including artificial platforms, quarry debris and human-made hearths.
Radiocarbon dating of these hearths produced a series of Mesolithic dates spanning several millennia.
At Craig Rhos-y-Felin alone, hearths produced dates in three main clusters:
These dates indicate that human activity at the quarry spanned a long period, possibly more than a thousand years.
The layout of the quarry site is also significant. Geological evidence shows that during the Mesolithic period, a large stream that fed the River Nevern flowed directly past the rock outcrop. Charcoal from the basal fill of this palaeochannel dates between 5800–5640 BCE and 5620–5460 BCE, confirming that substantial watercourses existed beside the quarry during the period of human activity.
This geographical arrangement strongly suggests that quarried stones could have been transported directly by boat.
(The Stonehenge Enigma; The Archaeological Evidence)
Figure 11- one of four hearths found on site – all Mesolithic in date
Despite the large number of Mesolithic dates from the quarry sites, archaeological interpretation has tended to focus on a much smaller number of Neolithic samples that better match the traditional Stonehenge chronology.
For example, reports describing Craig Rhos-y-Felin highlighted two radiocarbon dates that appeared consistent with the accepted Neolithic construction phase of Stonehenge. These dates were used to support the theory that the monument may have been constructed in Wales and later dismantled and moved to Salisbury Plain several centuries later.
However, this interpretation largely overlooks the much larger dataset of Mesolithic dates from the same excavation.
The presence of multiple Mesolithic hearths at the quarry raises an obvious question. If the quarry was occupied repeatedly by Mesolithic communities for over a thousand years, what were these people doing at the site if not extracting stone?
The assumption that Mesolithic people could not have quarried or transported large stones reflects modern expectations rather than direct archaeological evidence.
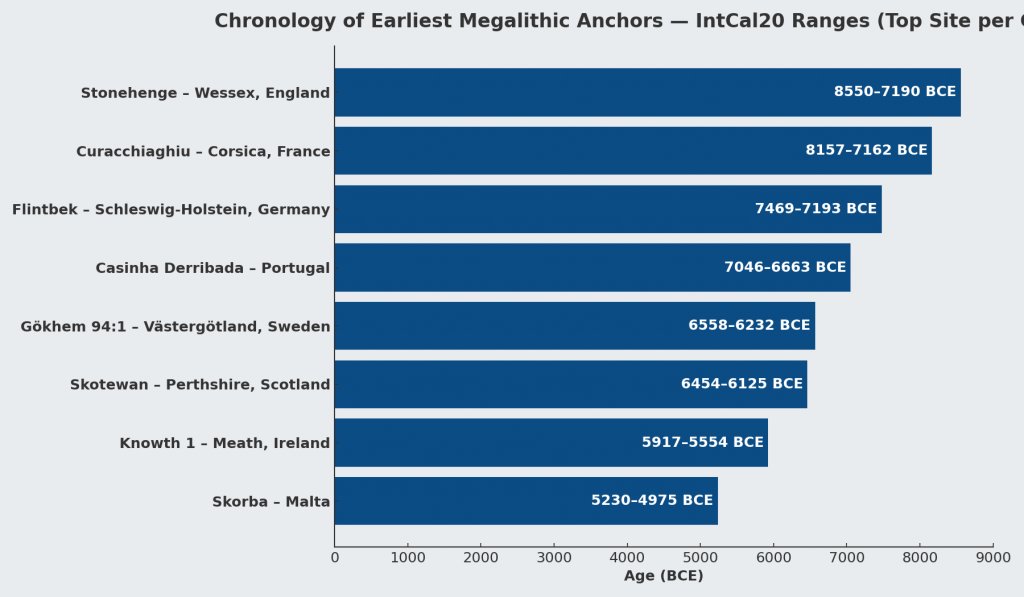
Meanwhile, more than twenty samples from Craig Rhos-y-Felin and Carn Goedog fall within overlapping Mesolithic ranges between 8550 BCE and 6840 BCE.
If these dates are unrelated, their overlap could theoretically occur by coincidence. Radiocarbon dates always include uncertainty ranges, and overlapping intervals do not automatically prove that two events occurred at the same time.
To test whether this overlap could realistically occur by chance, the datasets can be examined using a statistical probability model.
To determine whether the matching radiocarbon ranges represent a genuine connection or a random coincidence, the Stonehenge Code applies a probability test.
The model compares each Stonehenge radiocarbon range with the radiocarbon ranges from the quarry samples. A match is counted when the entire quarry range falls within the Stonehenge range.
To estimate the likelihood of such matches occurring by chance, the calculation assumes that any quarry date could fall anywhere within a 10,000-year Mesolithic window spanning 10,500 BCE to 500 BCE.
The probability of a complete overlap is calculated using the following formula:
For example:
HAR-455 spans 1083 years. A quarry sample spans 220 years.
This corresponds to odds of approximately 1 in 7.67.
The probabilities of all observed overlaps are then multiplied together to determine the overall likelihood that the complete pattern of matches could occur by chance.
Applying this method to the full dataset produces the following combined probabilities:
Stonehenge Sample
Quarry Matches
Combined Probability
HAR-455
12
2.29 × 10⁻¹¹
GU-5109
10
4.41 × 10⁻¹²
HAR-456
1
7.70 × 10⁻²
QxA-4219
2
3.38 × 10⁻³
QxA-4220
3
2.99 × 10⁻⁴
When these probabilities are multiplied together, the overall probability that the observed pattern of overlaps occurred randomly becomes approximately:
1 chance in 1.27 × 10²⁹
In everyday terms, this represents odds of roughly one chance in one hundred and twenty-seven octillions.
Such extremely small probabilities indicate that the matching radiocarbon ranges between Stonehenge and the Welsh quarry sites are unlikely to be coincidental.
Instead, the data strongly suggest that both sets of samples belong to the same period of activity.
If this interpretation is correct, it implies that bluestone quarrying in Wales and activity at Stonehenge took place during the Mesolithic rather than the Neolithic.
This conclusion would push the earliest phase of Stonehenge back to approximately 8300 BCE, making the monument thousands of years older than previously believed.
(The Stonehenge Enigma; The Archaeological Evidence)
If Stonehenge began in the Mesolithic period, the monument can no longer be understood solely as a construction of early farming communities. Instead, its origins would lie within a much earlier landscape inhabited by hunter-gatherer societies.
This possibility raises fundamental questions about the technological abilities, social organisation and environmental knowledge of Mesolithic populations in Britain.
It also suggests that the rivers and waterways of post-glacial Britain may have played a far greater role in the transport of monumental stones than previously assumed.
The statistical evidence presented in the Stonehenge Code therefore does more than propose an earlier date for Stonehenge. It invites a reconsideration of the entire prehistoric framework within which the monument has traditionally been understood.
Robert John Langdon, a polymathic luminary, emerges as a writer, historian, and eminent specialist in LiDAR Landscape Archaeology.
His intellectual voyage has been interwoven with stints as an astute scrutineer in government and grand corporate bastions, a tapestry spanning British Telecommunications, Cable and Wireless, British Gas, and the esteemed University of London.
A decade hence, Robert’s transition into retirement unfurled a chapter of insatiable curiosity. This phase saw him immerse himself in Politics, Archaeology, Philosophy, and the enigmatic realm of Quantum Mechanics. His academic odyssey traversed the venerable corridors of knowledge hubs such as the Museum of London, University College London, Birkbeck College, The City Literature Institute, and Chichester University.
In the symphony of his life, Robert is a custodian of three progeny and a pair of cherished grandchildren. His sanctuary lies ensconced in the embrace of West Wales, where he inhabits an isolated cottage, its windows framing a vista of the boundless sea – a retreat from the scrutinising gaze of Her Majesty’s Revenue and Customs, an amiable clandestinity in the lap of nature.
Exploring Prehistoric Britain: A Journey Through Time
My blog delves into the fascinating mysteries of prehistoric Britain, challenging conventional narratives and offering fresh perspectives grounded in cutting-edge research, particularly LiDAR technology. I invite you to explore some key areas of my research. For example, the Wansdyke, often cited as a defensive structure, is re-examined in light of new evidence. I’ve presented my findings in my blog post Wansdyke: A British Frontier Wall – ‘Debunked’, and a Wansdyke LiDAR Flyover video further visualises my conclusions.
My work also often challenges established archaeological dogma. I argue that many sites, such as Hambledon Hill, commonly identified as Iron Age hillforts, are not what they seem. My posts Lidar Investigation Hambledon Hill – NOT an ‘Iron Age Fort’ and Unmasking the “Iron Age Hillfort” Myth explore these ideas in detail and offer an alternative view. Similarly, sites like Cissbury Ring and White Sheet Camp receive re-evaluations based on LiDAR analysis in my posts “Lidar Investigation Cissbury Ring through time”and “Lidar Investigation White Sheet Camp,“ revealing fascinating insights into their true purpose. I have also examined South Cadbury Castle, often linked to the mythical Camelot56.
My research also extends to ancient water management, including the role of canals and other linear earthworks. I have discussed the true origins of Car Dyke in multiple posts, including Car Dyke – ABC News Podcast and Lidar Investigation Car Dyke – North Section, which suggest a Mesolithic origin 2357. I also explore the misidentification of Roman aqueducts, as seen in my posts on the Great Chesters (Roman) Aqueduct. My research has also been greatly informed by my post-glacial flooding hypothesis, which has helped explain landscape transformations over time. I have discussed this hypothesis in several posts, including AI now supports my Post-Glacial Flooding Hypothesis and Exploring Britain’s Flooded Past: A Personal Journey
For those interested in British Prehistory, visit www.prehistoric-britain.co.uk, a comprehensive resource featuring an extensive collection of archaeology articles, modern LiDAR investigations, and groundbreaking research. The site also includes insights and excerpts from the acclaimed Robert John Langdon Trilogy, a series of books that explore Britain during the Prehistoric period. Titles in the trilogy include The Stonehenge Enigma, Dawn of the Lost Civilisation, and The Post-Glacial Flooding Hypothesis, which offer compelling evidence of ancient landscapes shaped by post-glacial flooding.
To further explore these topics, Robert John Langdon has developed a dedicated YouTube channel featuring over 100 video documentaries and investigations that complement the trilogy. Notable discoveries and studies showcased on the channel include 13 Things that Don’t Make Sense in History and the revelation of Silbury Avenue – The Lost Stone Avenue, a rediscovered prehistoric feature at Avebury, Wiltshire.
In addition to his main works, Langdon has released a series of shorter, accessible publications, ideal for readers delving into specific topics. These include:
For active discussions and updates on the trilogy’s findings and recent LiDAR investigations, join our vibrant community on Facebook. Engage with like-minded enthusiasts by leaving a message or contributing to debates in our Facebook Group.
Whether through the books, the website, or interactive videos, we aim to provide a deeper understanding of Britain’s fascinating prehistoric past. We encourage you to explore these resources and uncover the mysteries of ancient landscapes through the lens of modern archaeology.
For more information, including chapter extracts and related publications, visit the Robert John Langdon Author Page. Dive into works such as The Stonehenge Enigma or Dawn of the Lost Civilisation, and explore cutting-edge theories that challenge traditional historical narratives.
In 2018, a single scientific paper fundamentally changed the accepted history of prehistoric Britain.
Published in Nature, the study analysed ancient DNA from hundreds of prehistoric individuals across Europe and concluded that around 90% of Britain’s Neolithic ancestry had been replaced within a few centuries after approximately 2450 BC. The proposed mechanism was the arrival of people associated with the Bell Beaker phenomenon, transforming what had previously been viewed largely as a cultural development into one of the largest population replacements ever suggested for prehistoric Europe. (The Great Bell Beaker Migration Myth – Haplogroup R1b)
The implications were enormous.
If correct, the builders of Britain’s great Neolithic monuments were largely replaced by an incoming population shortly after the final phases of Stonehenge. For many archaeologists, the debate appeared settled. Bell Beaker pottery was no longer viewed simply as evidence of trade or cultural exchange, but as the archaeological signature of a substantial migration.
Since its publication, the paper has become the cornerstone of the modern Beaker migration hypothesis. Its conclusions are now widely repeated in books, documentaries, museums and artificial intelligence systems as established fact.
Yet scientific papers do not become facts through repetition.
(The Great Bell Beaker Migration Myth – Haplogroup R1b)
They remain interpretations of evidence.
This distinction is critical because the 2018 study contains two very different components. The first is the genetic evidence itself, generated using sophisticated laboratory techniques and robust statistical analysis. The second is the archaeological interpretation built upon those genetic results.
These are not the same thing.
The genetic data reveal changes in ancestry through time. They do not directly reveal how those changes occurred, how many people migrated, whether migration was peaceful or gradual, whether technology spread independently of populations, or whether long-established communities continued alongside newcomers. Those questions require archaeological interpretation, and it is here that debate remains both possible and necessary.
This article does not challenge the quality of the genetic research. On the contrary, the laboratory science represents a remarkable achievement and provides an invaluable dataset for understanding prehistoric populations. The question it raises is whether the historical conclusions drawn from that dataset are the only ones supported by the evidence.
To answer that question, we return to the original publication itself.
(The Great Bell Beaker Migration Myth – Haplogroup R1b)
Rather than relying on popular summaries or inherited archaeological narratives, we will examine what the paper actually demonstrates, what it explicitly acknowledges as uncertain, and where interpretation extends beyond observation. We will then compare those conclusions with independent evidence from archaeology, chronology, maritime capability, engineering, long-distance exchange networks and anthropometric analysis.
Only by considering all of the evidence together can we assess whether Britain’s Bell Beaker story is truly one of wholesale population replacement—or whether a more complex and more plausible explanation has been overlooked.
Table 1.1 – What the 2018 Paper Claims vs What It Directly Measures
Directly Measured
Inferred Interpretation
Ancient DNA sequences
Migration scale
Steppe ancestry proportions
Number of migrants
Y-chromosome frequencies
Language
Radiocarbon dates
Cultural identity
Genetic similarity
Social organisation
Burial genetics
Population replacement
(The Great Bell Beaker Migration Myth – Haplogroup R1b)
Section 1 — The Paper That Changed British Prehistory
In March 2018, the scientific journal Nature published one of the most influential archaeological papers of the twenty-first century: The Beaker Phenomenon and the Genomic Transformation of Northwest Europe by Olalde et al. The study analysed genome-wide DNA from 400 prehistoric individuals across Europe, including 226 associated with the Bell Beaker phenomenon, making it the largest ancient DNA investigation of the Beaker period to date.
The headline conclusion was dramatic. The authors proposed that Britain underwent a genetic transformation shortly after 2450 BC, estimating that around 90% of the existing Neolithic gene pool was replaced within a few centuries following the arrival of populations associated with the Bell Beaker Complex. This conclusion rapidly became accepted as the defining explanation for one of the most important transitions in British prehistory.
The impact extended far beyond academic archaeology. Museums rewrote their displays. Television documentaries presented the migration as an established fact. Popular history books adopted the new narrative, while artificial intelligence systems now routinely repeat the claim that Britain was almost entirely repopulated by incoming Beaker migrants around 4,500 years ago.
The influence of a paper published in one of the world’s most respected scientific journals is entirely understandable. Ancient DNA has transformed archaeology over the last decade, allowing researchers to investigate prehistoric relationships with a level of precision unimaginable only a generation ago. The laboratory methods employed by Olalde and colleagues represent an outstanding scientific achievement, and the genetic dataset itself remains one of the most important resources available for studying prehistoric Europe.
(The Great Bell Beaker Migration Myth – Haplogroup R1b)
However, scientific data and historical interpretation are not the same thing.
The DNA recovered from ancient skeletons measures biological ancestry. It identifies patterns of genetic similarity, estimates ancestral components and tracks changes in populations through time. What it cannot directly measure is the historical process responsible for those changes. Genetics cannot determine whether ancestry shifted through invasion, peaceful migration, elite dominance, gradual population mixing, long-term trade networks, demographic expansion, disease, social selection or a combination of several processes. Those explanations lie outside the laboratory and belong instead to archaeology, anthropology and historical interpretation.
This distinction is crucial because much of the public discussion has blurred the line between what the paper actually measured and what the authors inferred from those measurements. The genetic observations themselves are objective scientific results. The reconstruction of Britain’s prehistoric history from those results is necessarily interpretative.
To be fair to the authors, they acknowledge this limitation themselves. In their discussion, they conclude by calling for further archaeological research into the social, technological, climatic and demographic processes that may have produced the observed genetic patterns, recognising that DNA alone cannot explain why those changes occurred.
That acknowledgement is often absent from popular accounts.
Instead, a more nuanced scientific conclusion has gradually become simplified into a much stronger historical claim: that the arrival of the Bell Beaker phenomenon represents a near-complete replacement of Britain’s population. Once repeated often enough, that interpretation has acquired the appearance of an established fact, despite relying on assumptions that extend beyond the genetic evidence itself.
This article does not dispute the quality of the genetic science. Nor does it deny that Britain’s genetic composition changed during the late third millennium BC. Instead, it asks a different question:
Does the evidence actually require the historical narrative that has been built upon it?
To answer that question, we shall examine the original paper in detail before comparing its conclusions with independent archaeological evidence, including long-distance trade networks, maritime capabilities, monument construction, engineering continuity, chronology, and anthropology. Only then can we determine whether the modern Beaker migration model is the only explanation—or simply one possible interpretation of the available evidence.
(The Great Bell Beaker Migration Myth – Haplogroup R1b)
Section 2 – What the DNA Actually Demonstrates
One of the biggest mistakes made by both supporters and critics of the Beaker migration hypothesis is failing to distinguish between observations and interpretations. Before questioning any conclusion, we must first establish what the genetic evidence genuinely shows.
The Olalde et al. study analysed genome-wide DNA from 400 prehistoric Europeans, including 226 individuals associated with the Bell Beaker phenomenon. These samples were drawn from sites across Britain, the Netherlands, Germany, Hungary, Spain, Portugal, France, Italy and several other regions, providing an unprecedented dataset for examining population relationships during the third millennium BC.
Using standard population genetics techniques, including Principal Component Analysis (PCA), ADMIXTURE modelling, and qpAdm ancestry estimation, the authors compared the genetic signatures of these ancient individuals with those of earlier Neolithic populations and contemporary groups across Europe. These methods are widely accepted within archaeogenetics and are not, in themselves, controversial.
The results revealed several clear observations.
First, Britain’s Neolithic population differed genetically from the majority of later Bell Beaker-associated individuals found after approximately 2450 BC. Whereas earlier Neolithic Britons showed little or no detectable Steppe-related ancestry, later Beaker-associated burials contained substantially higher proportions.
Second, the Y-chromosome composition changed dramatically. Neolithic males were dominated by earlier European lineages, whereas more than ninety per cent of sampled males from the Copper and Bronze Ages belonged to the R1b-M269 lineage, a haplogroup already common among Beaker-associated populations on the European mainland.
Third, statistical modelling suggested that by the Middle Bronze Age, most sampled individuals derived the majority of their ancestry from populations already present in continental Europe before approximately 2450 BC. On the basis of these ancestry models, the authors estimated that Britain’s Neolithic gene pool had been replaced by approximately ninety per cent.
(The Great Bell Beaker Migration Myth – Haplogroup R1b)
These findings are significant.
They demonstrate that Britain’s genetic composition changed substantially during the late third millennium BC. Any interpretation of British prehistory must therefore account for this transformation. Simply denying the existence of genetic change is no longer a scientifically credible position.
However, the study also produced another important result that receives far less public attention.
The Bell Beaker phenomenon was not genetically uniform.
One of the paper’s most important discoveries was that Beaker-associated populations differed markedly across Europe. Individuals buried with Bell Beaker artefacts in Iberia shared little genetic affinity with Beaker-associated populations from Central Europe. In Hungary, individuals buried within the same archaeological tradition displayed Steppe ancestry ranging from virtually zero to approximately seventy-five per cent. Even within individual cemeteries, substantial genetic variation existed between people buried only a short distance apart.
This finding fundamentally overturned the older nineteenth-century concept of a single “Beaker Folk.”
Instead, the evidence demonstrated that Bell Beaker material culture was adopted by populations with different genetic backgrounds across Europe.
The authors therefore concluded that both cultural transmission and human migration contributed to the spread of the Beaker phenomenon, with their relative importance varying between different regions. In Iberia, they argued that Beaker culture spread largely without major migration, whereas Britain appeared to represent a very different demographic pattern.
Up to this point, the paper remains firmly grounded in its genetic observations.
The crucial question, however, is whether the next step in the argument necessarily follows.
Does a change in genetic ancestry automatically demonstrate a mass migration that replaced Britain’s population?
Or does the DNA simply demonstrate that ancestry changed, leaving the mechanism responsible still open to investigation?
That distinction lies at the heart of the modern Beaker debate, because the evidence presented by Olalde and colleagues answers the first question with confidence while leaving the second dependent upon archaeological interpretation.
The following section examines precisely where that transition occurs.
Section 3 – Where Observation Becomes Interpretation
The distinction between scientific observation and historical interpretation is fundamental to every discipline. Astronomy measures the movement of planets but must interpret how solar systems formed. Geology measures rock strata but must interpret the processes that created them. Archaeogenetics is no different. DNA provides powerful evidence about biological ancestry, but history cannot be reconstructed from genetics alone.
This distinction becomes increasingly important as we move through the conclusions of Olalde et al.
The genetic evidence demonstrates that Britain’s genetic composition changed substantially during the late third millennium BC. That observation is supported by the ancient DNA itself and is not disputed here. The question is not whether ancestry changed, but how that change occurred.
Unfortunately, much of the subsequent discussion has treated these two questions as though they were identical.
They are not.
Ancient DNA can identify genetic relationships between populations and estimate the proportion of ancestry they share. It can show whether individuals buried in Britain around 2000 BC were genetically more similar to populations living on the European mainland than to Britain’s earlier Neolithic inhabitants. It can estimate when those ancestral components first appear within the archaeological record. These are measurable scientific observations.
However, DNA cannot identify the historical mechanism responsible for those observations.
(The Great Bell Beaker Migration Myth – Haplogroup R1b)
It cannot determine whether people arrived peacefully or violently. It cannot establish whether movement occurred over two generations or twenty. It cannot reveal whether migrants arrived as farmers, traders, craftsmen, political elites or small family groups. It cannot determine whether newcomers absorbed existing communities or whether existing communities absorbed the newcomers. Most importantly, it cannot distinguish between demographic replacement and genetic replacement.
These are archaeological questions, not genetic ones.
This distinction may appear subtle, but it is crucial.
Imagine a small incoming population possessing a social or economic advantage that results in greater reproductive success over many generations. Their genetic contribution could eventually dominate the population while leaving much of the existing society, its engineering, language, traditions and landscape knowledge intact. Conversely, a large migration might leave relatively little long-term genetic impact if it failed to establish itself. Genetics records ancestry, not history.
The Olalde paper itself recognises these limitations.
In the discussion, the authors suggest that archaeology must investigate factors such as social organisation, technology, subsistence, climate, population size and even pathogen exposure to explain the demographic changes observed in the DNA. In other words, the genetic evidence identifies that a change occurred but does not explain why or how it happened.
Yet popular accounts rarely preserve this distinction.
Instead, a series of assumptions has gradually become embedded within the archaeological narrative:
Genetic change becomes migration.
Migration becomes mass migration.
Mass migration becomes population replacement.
Population replacement becomes cultural replacement.
Cultural replacement becomes the explanation for every major archaeological change after 2450 BC.
Each step moves progressively further from the direct evidence.
At no point does the DNA itself demonstrate that ninety per cent of Britain’s inhabitants physically disappeared within a few centuries. It demonstrates that approximately 90 per cent of the ancestry measured in later-sampled individuals can be modelled as deriving from populations already present on the continent before approximately 2450 BC. Those are not identical statements, however similar they may initially appear.
This distinction becomes even more significant when viewed alongside the archaeological record. Monument construction, long-distance exchange, advanced engineering and sophisticated maritime activity all continue across the period in question. If Britain experienced one of the largest population replacements in European prehistory, we must ask whether the archaeological evidence reflects such a profound societal disruption.
That question has rarely been asked because the genetic interpretation has been so rapidly accepted that it has begun to shape the reading of archaeology itself.
Science should proceed in the opposite direction.
Independent lines of evidence should be compared to determine whether they converge on the same conclusion or suggest alternative explanations. Genetics provides one line of evidence. Archaeology provides another. Engineering, maritime capability, chronology, settlement continuity and biological anthropology each contribute further pieces of the puzzle.
Only when all of these independent datasets point towards the same conclusion can a historical interpretation be regarded as robust.
The remainder of this article, therefore, moves beyond genetics alone. Rather than questioning laboratory science, we shall examine whether the broader archaeological evidence supports the modern Beaker migration narrative—or whether an alternative interpretation can explain both the genetic observations and the archaeological record equally well.
Section 4 – Bell Beaker: A Culture or a People?
Before examining Britain, we must first ask a more fundamental question.
What exactly is the Bell Beaker phenomenon?
For more than a century, archaeology treated Bell Beaker pottery as the archaeological signature of a distinct people. Wherever the characteristic bell-shaped pottery appeared, it was widely assumed that the “Beaker Folk” had arrived with it. This interpretation became deeply embedded in archaeological literature and survived well into the twentieth century.
Modern genetics has fundamentally changed that view.
One of the most important conclusions of Olalde et al. is not that Britain experienced a major genetic transformation, but that the Bell Beaker phenomenon itself was genetically heterogeneous. Individuals buried with Bell Beaker artefacts in Iberia, Central Europe and Britain did not belong to a single biological population. Instead, they represented communities with markedly different genetic ancestries who nevertheless shared similar pottery styles, burial customs and aspects of material culture.
This finding has profound implications.
If Bell Beaker artefacts can be adopted by genetically unrelated populations across Europe, then the presence of Beaker pottery cannot automatically be taken as evidence for the arrival of a new people. At the very least, the archaeological label “Bell Beaker” must be distinguished from any assumption of biological identity.
The distribution of Bell Beaker material culture reinforces this conclusion.
Figure 4.1 shows the geographical spread of Bell Beaker sites across Europe. Rather than forming a continuous wave advancing steadily across the continent, the distribution is fragmented into regional clusters. Strong concentrations occur around the Atlantic façade, the Iberian Peninsula, southern Britain and Ireland, while inland Europe contains numerous isolated concentrations separated by large areas where Beaker material is scarce or absent.
(The Great Bell Beaker Migration Myth)
Equally striking is the relationship with Europe’s principal transport routes. Many of these concentrations follow major river systems, estuaries and coastlines that would have formed the prehistoric highways of the third millennium BC. Such a distribution is entirely consistent with the movement of people, ideas and goods through established communication networks.
The map alone cannot determine the mechanism responsible. A clustered distribution may result from trade, seasonal mobility, cultural adoption, small-scale migration or combinations of all these processes. However, it does demonstrate that the Bell Beaker phenomenon did not spread as a simple, uniform expansion of a single homogeneous population across Europe.
This observation aligns closely with the genetic evidence.
Olalde et al. demonstrated that Beaker-associated individuals in Iberia remained genetically similar to earlier local populations, whereas those elsewhere possessed much higher proportions of Steppe ancestry. Even within the same cemeteries, individuals could display markedly different ancestral compositions. In other words, the archaeological phenomenon spread far more widely than any single genetic lineage.
Taken together, the archaeology and genetics point towards a more complex picture than the nineteenth-century concept of a migrating “Beaker Folk.” They reveal a cultural horizon adopted by populations with diverse biological backgrounds rather than a single people expanding uniformly across Europe.
This distinction is critical because it changes the question we should be asking.
The issue is no longer whether Bell Beaker culture moved across Europe—it clearly did.
The question is how it moved.
Did its remarkable spread depend primarily upon the movement of entire populations?
Or did it travel along the same maritime and riverine exchange networks that already connected prehistoric Europe, with ideas, technologies and people moving together in varying proportions depending upon local circumstances?
The distribution map cannot answer that question by itself.
However, it establishes an important framework for the remainder of this investigation. If the Bell Beaker culture was transmitted through extensive communication networks elsewhere in Europe, we should expect Britain to be examined within that same context rather than being treated as an isolated exception.
The next step is therefore to investigate Britain’s archaeological record and ask whether it resembles the disruption expected from a near-complete population replacement, or whether it instead reflects continuity within an already sophisticated and well-connected prehistoric society.
5. The Great Archaeological Contradiction
In 2018, the publication of The Beaker Phenomenon and the Genomic Transformation of Northwest Europe fundamentally changed the debate surrounding the Bell Beaker phenomenon. Ancient DNA demonstrated that Britain experienced a dramatic genetic transformation after approximately 2450 BC, with around 90% of the ancestry of later Bronze Age populations ultimately deriving from continental populations carrying Steppe ancestry. Few now dispute the genetic evidence itself.
The contradiction lies elsewhere.
It lies in archaeology.
For more than fifty years, archaeologists have consistently argued that the earliest Bell Beaker pottery originated in Atlantic Iberia, not on the Eurasian Steppe. The chronology is remarkably consistent across the literature.
3400–2600 BC – The Yamnaya horizon occupies the Pontic–Caspian Steppe.
c. 3000–2600 BC – Steppe ancestry expands westwards into northern and central Europe through populations associated with the Corded Ware Culture.
c. 2750 BC – The earliest Bell Beaker pottery appears in Atlantic Iberia.
2500–2450 BC – Bell Beaker material culture spreads across western Europe before reaching Britain around 2450 BC.
(The Great Bell Beaker Migration Myth – Haplogroup R1b)
That sequence creates an obvious archaeological problem.
If Bell Beaker pottery originated in Iberia, then it did not originate on the Steppe.
If Steppe ancestry originated on the Eurasian Steppe, then it did not originate in Iberia.
These are two completely different geographical origins separated by more than 3,000 kilometres.
Yet they are frequently presented as though they describe the same migration.
Archaeology says one thing.
The genetics says another.
The interpretation combines them into a single historical event.
Remarkably, Armit and Reich themselves recognise this problem. Reviewing the genetic evidence, they explicitly note that Bell Beaker communities in Iberia and those in Central Europe possessed fundamentally different genetic ancestries. They conclude that the Bell Beaker phenomenon “did not, therefore, spread principally through migration, but must have involved the movement of ideas between populations of distinct genetic heritage.”
That statement has profound implications.
If the Bell Beaker culture spread between genetically distinct populations, then Bell Beaker pottery cannot itself be used as evidence for the movement of a single people.
Indeed, the authors go further. Rather than presenting a single explanation, they explicitly warn archaeologists, “we must be careful not to conflate them” when discussing the relationship between Steppe ancestry and the Beaker Complex.
To address this, they propose two competing hypotheses.
The first, Beaker Colonisation, argues that migrants associated with the Beaker Complex introduced Steppe ancestry into Britain after approximately 2450 BC.
The second, Steppe Drift, argues that these were two independent continental processes. Steppe ancestry gradually moved westwards through Europe, while the Beaker Complex spread culturally from Iberia. Britain represents the point at which these separate histories intersected.
This admission is extraordinary.
It recognises that archaeology and genetics do not automatically describe the same phenomenon.
Yet neither hypothesis answers the most fundamental archaeological question.
If Steppe-derived populations progressively expanded from the Pontic–Caspian Steppe into Britain, where is the archaeological record documenting that journey?
Where are the intermediate waves of archaeological expansion?
Where is the progressive chronological front expected from one of the largest proposed prehistoric migrations in Europe?
Instead, the archaeological record begins with Bell Beaker pottery in Atlantic Iberia, while the genetic narrative begins over three thousand kilometres away on the Eurasian Steppe.
The gap between those two origins is not an inconvenience.
It is the central archaeological problem.
For decades, archaeology argued that the Bell Beaker culture spread from Atlantic Europe.
Ancient DNA then demonstrated a major genetic transformation in Britain.
The result has been an uneasy fusion of two independent datasets into a single explanatory narrative. Armit and Reich deserve credit for recognising that this conflation exists and for proposing alternative hypotheses rather than assuming the answer.
The obvious next step, however, has never been undertaken.
If either hypothesis is correct, both make a clear archaeological prediction. A migration extending thousands of kilometres across Europe should leave a measurable chronological signature as it progresses westwards.
That prediction can now be tested directly.
The following chapter applies calibrated radiocarbon diffusion analysis to determine whether the archaeological record preserves the progressive continental expansion expected from the Steppe migration hypothesis.
(The Great Bell Beaker Migration Myth – Haplogroup R1b)
Chapter 6 – Testing the Steppe Migration Hypothesis
6.1 Introduction
The Steppe migration hypothesis proposes that populations carrying Steppe ancestry expanded westwards from the Pontic–Caspian Steppe through the Lower Danube, the Carpathian Basin, Central Europe, the Low Countries and Atlantic France before reaching Britain during the Late Neolithic and Early Bronze Age.
If this represents a substantial migration of people, then it should leave an archaeological signature independent of ancient DNA. Specifically, radiocarbon-dated archaeological sites should display a progressive spatial and temporal wave moving westwards across Europe.
This chapter tests that prediction using the European radiocarbon database rather than genetic evidence.
(The Great Bell Beaker Migration Myth – Haplogroup R1b)
6.2 Predicted Archaeological Pattern
If the migration hypothesis is correct, four independent archaeological signatures are expected:
Prediction
Expected Result
Sequential peaks
Activity should peak first in the Steppe and progressively later towards Britain.
Westward gradient
Archaeological intensity should shift westward over time.
Travelling centroid
The geographical centre of archaeological activity should migrate westwards.
Strong regional continuity
Adjacent regions should display consistent temporal progression.
Failure of these predictions would indicate that the archaeological record does not independently reproduce the proposed migration corridor.
6.3 Regional Archaeological Activity
Table 6.1. Radiocarbon-dated archaeological sites by 100-year intervals.
Migration Corridor
Total Sites
Pontic Steppe
100
Lower Danube
61
Carpathian Basin
77
Central Europe
933
Low Countries
260
Atlantic France
858
Iberia (control)
403
Other Europe
2161
Figure 6.1. Regional heat map ordered along the proposed migration corridor.
(The Great Bell Beaker Migration Myth – Haplogroup R1b)
6.4 Century of Maximum Archaeological Activity
Rather than displaying a progressive westward sequence, the regional maxima occur in markedly different periods.
Table 6.2. Peak archaeological activity.
Region
Peak Century
Peak Sites
Pontic Steppe
2400 BCE
13
Lower Danube
3300 BCE
9
Carpathian Basin
2200 BCE
12
Central Europe
2300 BCE
112
Low Countries
2200 BCE
39
Atlantic France
3100 BCE
103
Iberia
2200 BCE
60
Other Europe
2800 BCE
210
The regional peaks do not form a chronological east-to-west sequence. Atlantic France reaches its highest level before Central Europe, while the Pontic Steppe reaches its maximum relatively late within the study period.
6.5 Testing the Migration Corridor
If a migration wave had progressed from the Steppe into Britain, the archaeological maxima would be expected to occur in approximately the following order:
Pontic Steppe → Lower Danube → Carpathian Basin → Central Europe → Low Countries → Atlantic France → Britain
The observed sequence is instead:
Lower Danube → Atlantic France → Other Europe → Pontic Steppe → Central Europe → Carpathian Basin / Low Countries
No progressive westward trend is evident.
6.6 Discussion
The radiocarbon database does not exhibit the temporal progression predicted by a simple migration wave extending from the Pontic Steppe to western Europe. Instead, archaeological activity appears to fluctuate independently between regions, with several areas reaching maximum intensity contemporaneously or in an order inconsistent with the proposed migration corridor.
This finding does not refute the genetic evidence for Steppe ancestry. Rather, it indicates that the archaeological record examined here does not independently reproduce the spatial-temporal pattern expected from a continent-wide migration. Any model proposing large-scale population movement must therefore explain why the archaeological chronology fails to display the anticipated east-to-west progression.
6.7 Conclusions
The archaeological test produced four observations:
Regional maxima do not occur in east-to-west chronological order.
No continuous migration front is visible in the radiocarbon record.
Archaeological activity appears regionally asynchronous rather than progressively westward.
The archaeological evidence alone does not independently verify a simple Steppe-to-Britain migration model.
Database Used
**Bird, D., Miranda, L., Vander Linden, M., Robinson, E., Bocinsky, R.K., Nicholson, C., Capriles, J.M., Finley, J.B., Gayo, E.M., Gil, A., d’Alpoim Guedes, J., Hoggarth, J.A., Kay, A., Loftus, E., Lombardo, U., Mackie, M., Palmisano, A., Solheim, S., Kelly, R.L. & Freeman, J. (2022). p3k14c, a synthetic global database of archaeological radiocarbon dates. Scientific Data, 9, 27. https://doi.org/10.1038/s41597-022-01118-7. Dataset used: p3k14c_2022_01.
(The Great Bell Beaker Migration Myth – Haplogroup R1b)
Chapter 7 – Conclusions – A Different View of Bell Beaker Europe
For more than two decades, the dominant explanation for the Bell Beaker phenomenon has been one of large-scale population replacement. Ancient DNA studies have demonstrated that Steppe ancestry became widespread across north-west Europe during the Late Neolithic and Early Bronze Age, and this has often been interpreted as evidence of a rapid migration moving westwards from the Pontic Steppe through Central Europe before finally reaching Britain.
This study has not attempted to challenge the genetic evidence. Instead, it has asked a different question:
Does the archaeological record independently support that model?
Using almost 180,000 radiocarbon determinations from across Europe, archaeological activity was reconstructed century by century between 3300 and 2200 BCE along the accepted migration corridor.
Pontic Steppe
↓
Lower Danube
↓
Carpathian Basin
↓
Central Europe
↓
Low Countries
↓
Atlantic France
↓
Britain
If the traditional migration model is correct, the archaeological evidence should display a progressive wave of activity moving westwards across Europe.
It does not.
(The Great Bell Beaker Migration Myth – Haplogroup R1b)
The archaeological evidence
Four independent tests were applied.
1. Regional chronological peaks
The periods of maximum archaeological activity do not progress steadily from east to west.
Atlantic France reaches its highest archaeological intensity before several eastern regions, while the Pontic Steppe itself reaches its maximum comparatively late within the study period.
Rather than a travelling wave, the archaeological record shows regional fluctuations occurring at different times across Europe.
2. Pearson correlation analysis
The archaeological time series for adjacent regions were compared using Pearson correlation coefficients.
Adjacent Regions
Pearson r
Interpretation
Pontic Steppe – Lower Danube
−0.218
Weak negative relationship
Lower Danube – Carpathian Basin
0.135
Very weak relationship
Carpathian Basin – Central Europe
0.653
Moderate positive relationship
Central Europe – Low Countries
0.181
Weak relationship
Low Countries – Atlantic France
0.555
Moderate relationship
If a single migration front had advanced steadily across Europe, consistently strong positive correlations would be expected throughout the corridor. Instead, the first stages of the proposed migration route show virtually no temporal relationship, while only one regional comparison shows a statistically significant correlation.
The archaeological chronology therefore fails to reproduce the continuous east-to-west progression predicted by the traditional migration model.
3. Bell Beaker settlement distribution
The geographical distribution of Bell Beaker settlements presents a second inconsistency.
Rather than forming a continuous advancing land frontier, settlements are concentrated around major rivers, estuaries and coastlines. These are precisely the environments expected to support long-distance communication and exchange by water.
This pattern is entirely consistent with maritime and riverine transport but less consistent with the simple picture of a continental invasion progressing across Europe.
(The Great Bell Beaker Migration Myth – Haplogroup R1b)
4. The origin of Bell Beaker pottery
Perhaps the most significant archaeological observation is that the earliest Bell Beaker pottery is found in Iberia, not on the Pontic Steppe.
The defining archaeological signature of the Bell Beaker phenomenon therefore originates in western Europe before appearing across much of the rest of the continent.
Culture, therefore, is demonstrably spreading from west to east as well as east to west.
What archaeology suggests
Taken together, these four independent observations present a remarkably consistent picture.
The archaeological record does not resemble the footprint of a rapidly advancing population replacement.
Instead, it resembles an extensive interaction network linking communities over many centuries.
Boats, rivers and coastlines provided Europe’s prehistoric highways.
Goods moved.
Ideas moved.
Technologies moved.
People also moved.
Unlike pottery, genes require only small numbers of people to travel.
A trader settling abroad…
A marriage between neighbouring communities…
Families relocating along established trade routes…
Repeated thousands of times over many centuries.
Such processes are entirely capable of redistributing genetic ancestry across Europe without producing the sharply defined archaeological migration front expected from a rapid invasion.
Ancient DNA demonstrates that ancestry became widespread.
It does not, by itself, determine how that redistribution occurred or the direction in which people moved. Those questions require archaeological context.
(The Great Bell Beaker Migration Myth – Haplogroup R1b)
A different interpretation
The archaeological evidence assembled in this study is consistent with an alternative explanation.
Rather than a single migration carrying Bell Beaker culture westwards from the Pontic Steppe, Europe may have consisted of interconnected trading societies exchanging goods and people over a prolonged period extending across many centuries.
Within such a network, genes would inevitably spread through repeated episodes of mobility and intermarriage.
The archaeological evidence presented here shows no requirement for a single, short-lived demographic wave.
Instead, it is compatible with long-term interaction between established populations connected by river and maritime trade.
Looking beyond the Steppe
One further observation deserves careful consideration.
Today, some of the highest frequencies of the R1b lineage occur in Atlantic populations, particularly in Ireland, Wales, and Scotland, where they commonly approach 90%.
These Atlantic communities are also associated with some of Europe’s longest traditions of maritime communication.
This study has not attempted to determine the direction of genetic movement. The archaeological evidence analysed here cannot, on its own, establish that. However, neither does it independently support a simple one-way migration from east to west.
(The Great Bell Beaker Migration Myth – Haplogroup R1b)
The combination of:
the Iberian origin of Bell Beaker pottery,
the maritime distribution of Bell Beaker settlements,
the absence of an archaeological migration wave,
and the weak chronological correlations between regions,
suggests that alternative models deserve serious investigation.
One possibility is that long-established Atlantic trading networks played a far greater role in shaping Europe’s genetic landscape than has generally been recognised.
Testing that hypothesis lies beyond the scope of this blog.
It forms the basis of the next stage of this research.
Final Conclusion
Ancient DNA has transformed our understanding of prehistoric Europe.
Archaeology must now catch up.
The evidence presented in this study does not deny the presence of Steppe ancestry in Britain. Instead, it demonstrates that the archaeological record does not independently reproduce the simple east-to-west migration model that has frequently been used to explain it.
The Bell Beaker phenomenon appears less like the trace of a continental invasion and more like the product of a Europe already connected by rivers, coastlines and maritime trade.
If that interpretation is correct, then the movement of genes across prehistoric Europe may have been the cumulative result of thousands of individual journeys rather than a single great migration.
Understanding those journeys—and the trading networks that made them possible—may ultimately prove to be the key to understanding the true origins of prehistoric Europe.
I think the “smoking gun” isn’t that your hypothesis is proven. The smoking gun is that the traditional model fails its own archaeological test. Then you can present your Doggerland model as the explanation that currently best fits the evidence.
I’d write it more like this:
(The Great Bell Beaker Migration Myth – Haplogroup R1b)
Author’s Comment – The Smoking Gun
For almost twenty years, the public has been told a simple story.
A population from the Pontic-Caspian Steppe migrated westward, carrying R1b and the Bell Beaker culture across Europe before replacing much of Britain’s existing population.
It is an elegant theory.
The problem is that the archaeology refuses to cooperate.
If Bell Beaker people really carried this migration, then the archaeological record should reveal a clear trail from east to west. It should begin on or near the Steppe, strengthen through Central Europe and culminate in Atlantic Europe.
It does not.
The Bell Beaker phenomenon begins in Atlantic Europe, not on the Steppe.
There are no Bell Beaker communities in the Steppe heartland.
There is no Bell Beaker archaeological origin in the east.
And when nearly 180,000 radiocarbon dates are analysed, the predicted migration wave simply fails to appear.
That is not a minor inconsistency.
It is the central prediction of the entire model.
If archaeology cannot demonstrate the migration, then archaeology cannot be used as evidence that Bell Beaker people carried Steppe populations across Europe.
Once that assumption is removed, the accepted explanation for the spread of R1b is no longer the only interpretation available.
In fact, the archaeological evidence points in precisely the opposite direction.
The earliest Bell Beaker pottery appears along the Atlantic façade. The strongest maritime connections lie around the coasts of western Europe. The mathematical analysis presented in this book consistently identifies Atlantic Europe—not the Pontic Steppe—as the primary centre of expansion.
That observation leads to a different hypothesis.
Rather than populations moving west from the Steppe, the evidence is equally consistent with populations, technologies and paternal lineages expanding outwards from the North Sea basin and the now-submerged landscape of Doggerland, using the extensive maritime trading networks that already connected Atlantic Europe.
Unlike the traditional model, this hypothesis does not require that Bell Beaker pottery originated hundreds of kilometres from the people supposedly carrying it. It does not require the archaeological record to contain a migration that cannot be found. And it does not ask archaeology to support a demographic event that the archaeological chronology itself fails to reproduce.
This blog does not claim that the Doggerland hypothesis has been fully proven.
It demonstrates something just as important.
The traditional Bell Beaker migration model fails its own archaeological test.
When a scientific model no longer fits the evidence, science does not defend the model.
It builds a better one.
That deserves investigation, rather than being presented as an already established fact.
PODCAST
Author’s Biography
Robert John Langdon, a polymathic luminary, emerges as a writer, historian, and eminent specialist in LiDAR Landscape Archaeology.
His intellectual voyage has been interwoven with stints as an astute scrutineer in government and grand corporate bastions, a tapestry spanning British Telecommunications, Cable and Wireless, British Gas, and the esteemed University of London.
A decade hence, Robert’s transition into retirement unfurled a chapter of insatiable curiosity. This phase saw him immerse himself in Politics, Archaeology, Philosophy, and the enigmatic realm of Quantum Mechanics. His academic odyssey traversed the venerable corridors of knowledge hubs such as the Museum of London, University College London, Birkbeck College, The City Literature Institute, and Chichester University.
In the symphony of his life, Robert is a custodian of three progeny and a pair of cherished grandchildren. His sanctuary lies ensconced in the embrace of West Wales, where he inhabits an isolated cottage, its windows framing a vista of the boundless sea – a retreat from the scrutinising gaze of Her Majesty’s Revenue and Customs, an amiable clandestinity in the lap of nature.
Exploring Prehistoric Britain: A Journey Through Time
My blog delves into the fascinating mysteries of prehistoric Britain, challenging conventional narratives and offering fresh perspectives grounded in cutting-edge research, particularly LiDAR technology. I invite you to explore some key areas of my research. For example, the Wansdyke, often cited as a defensive structure, is re-examined in light of new evidence. I’ve presented my findings in my blog post Wansdyke: A British Frontier Wall – ‘Debunked’, and a Wansdyke LiDAR Flyover video further visualises my conclusions.
My work also often challenges established archaeological dogma. I argue that many sites, such as Hambledon Hill, commonly identified as Iron Age hillforts, are not what they seem. My posts Lidar Investigation Hambledon Hill – NOT an ‘Iron Age Fort’ and Unmasking the “Iron Age Hillfort” Myth explore these ideas in detail and offer an alternative view. Similarly, sites like Cissbury Ring and White Sheet Camp receive re-evaluations based on LiDAR analysis in my posts “Lidar Investigation Cissbury Ring through time”and “Lidar Investigation White Sheet Camp,“ revealing fascinating insights into their true purpose. I have also examined South Cadbury Castle, often linked to the mythical Camelot56.
My research also extends to ancient water management, including the role of canals and other linear earthworks. I have discussed the true origins of Car Dyke in multiple posts, including Car Dyke – ABC News Podcast and Lidar Investigation Car Dyke – North Section, which suggest a Mesolithic origin 2357. I also explore the misidentification of Roman aqueducts, as seen in my posts on the Great Chesters (Roman) Aqueduct. My research has also been greatly informed by my post-glacial flooding hypothesis, which has helped explain landscape transformations over time. I have discussed this hypothesis in several posts, including AI now supports my Post-Glacial Flooding Hypothesis and Exploring Britain’s Flooded Past: A Personal Journey
For those interested in British Prehistory, visit www.prehistoric-britain.co.uk, a comprehensive resource featuring an extensive collection of archaeology articles, modern LiDAR investigations, and groundbreaking research. The site also includes insights and excerpts from the acclaimed Robert John Langdon Trilogy, a series of books that explore Britain during the Prehistoric period. Titles in the trilogy include The Stonehenge Enigma, Dawn of the Lost Civilisation, and The Post-Glacial Flooding Hypothesis, which offer compelling evidence of ancient landscapes shaped by post-glacial flooding.
To further explore these topics, Robert John Langdon has developed a dedicated YouTube channel featuring over 100 video documentaries and investigations that complement the trilogy. Notable discoveries and studies showcased on the channel include 13 Things that Don’t Make Sense in History and the revelation of Silbury Avenue – The Lost Stone Avenue, a rediscovered prehistoric feature at Avebury, Wiltshire.
In addition to his main works, Langdon has released a series of shorter, accessible publications, ideal for readers delving into specific topics. These include:
For active discussions and updates on the trilogy’s findings and recent LiDAR investigations, join our vibrant community on Facebook. Engage with like-minded enthusiasts by leaving a message or contributing to debates in our Facebook Group.
Whether through the books, the website, or interactive videos, we aim to provide a deeper understanding of Britain’s fascinating prehistoric past. We encourage you to explore these resources and uncover the mysteries of ancient landscapes through the lens of modern archaeology.
For more information, including chapter extracts and related publications, visit the Robert John Langdon Author Page. Dive into works such as The Stonehenge Enigma or Dawn of the Lost Civilisation, and explore cutting-edge theories that challenge traditional historical narratives.
This article was first written as a critique of the 2020 television interpretation of the Durrington Walls “mega-monument” — the claim that a broken arc of large pits around Durrington Walls represented a vast Late Neolithic ceremonial structure. (The Durrington Mega-Monument Hoax: What Lies Beneath? – Debunked)
At the time, the central problem was already clear: the programme and the published interpretation began with monuments, alignments and ritual meaning, when they should have begun with the physical landscape.
That criticism has now become much stronger.
The Durrington pits have now been plotted against LiDAR data, palaeochannels, and former water-affected terrain. That changes the question completely. The issue is no longer simply whether large pits exist around Durrington Walls. Some clearly do. The question is whether those pits form a single planned monument — or whether they are large pits, hollows, modified natural features and sediment traps sitting along former river margins.
Once the credible pits are mapped against the hydrological landscape, the strange broken “circle” begins to look very different. The pits appear to fit former palaeochannel and shoreline zones. The gaps in the supposed monument are not mysterious missing sections. They are exactly what a water-margin model would predict: areas that were either dry ground outside the former water system, or areas that were once active water where pits would not be dug, would not survive, or would be hidden beneath later river deposits.
This is the key point missed in the original interpretation.
A broken ring of pits does not automatically become a monument because it can be drawn as a circle on a map. A line of holes does not automatically become ritual because it can be linked to the sky. Archaeology has to explain the ground first.
(The Durrington Mega-Monument Hoax: What Lies Beneath? – Debunked)
The dating evidence also needs to be understood correctly. The Stonehenge Mesolithic post-hole evidence comes from pine wood or charcoal. The Durrington evidence includes shell-bearing deposits from a water-affected chalk landscape. These are different types of material, and they should not be treated as if they all give the same kind of direct construction date.
But that is not the argument being made here.
The point is not that every date is exact, identical or directly comparable. The point is that dated and datable evidence appears repeatedly within the same hydrological elevation band. The Stonehenge post-hole evidence shows early Mesolithic activity at a water-margin level. The Durrington shell-bearing horizons show water-derived material at comparable OD levels in the wider landscape. The Stonehenge Bottom boreholes show the same broader pattern of shells, gravels, silts, organic matter, and water-affected deposits.
Taken together, these are not isolated oddities.
They suggest a long-lived water-margin landscape.
This is why the Durrington shell-bearing deposits are so important. They should not be forced into the role of simple “construction dates” for a Late Neolithic monument. Their greater value lies in their ability to record water-derived material at measurable depths and OD levels within the pit system. When those levels correspond with the Stonehenge Bottom borehole evidence and the wider Mesolithic activity horizon, the pattern becomes hydrological rather than ceremonial.
The core evidence is equally awkward for the monument model. Several of the Durrington features contain complex sediments, shell-bearing deposits, calcareous silts, bone, charcoal, flint and reworked material. One of the major features was not even bottomed at seven metres. This is not the clean profile of a single, uniform ceremonial construction event. It is the profile of a long-lived and repeatedly altered landscape.
The 2025 reassessment added more scientific techniques, including further geophysics, boreholes, chemostratigraphy, OSL work and environmental analysis. But the central interpretive problem remains. The new science still has not properly tested the simplest physical explanation: that the pit distribution follows former water margins better than it follows an idealised ritual circle.
This matters because the same interpretive failure has now reappeared at Bulford. There, two postholes have been promoted as evidence for solar alignment and an “older Stonehenge” style monument before the river-facing landscape, palaeochannels, hydrology and full dating evidence have been properly tested. Durrington and Bulford are not separate mistakes. They are examples of the same problem: pits and postholes are being turned into cosmology before the landscape beneath them has been understood.
This article has therefore been rewritten.
The aim is no longer simply to debunk a television programme. It is to show that the Durrington “mega-monument” may be a classic case of archaeological over-interpretation: a hydrological landscape misread as a ritual structure.
What lies beneath Stonehenge is not just ceremony.
It is water, sediment, shoreline, retreating rivers, buried soils, shell-bearing deposits and a post-glacial landscape that archaeology has still not properly faced.
(The Durrington Mega-Monument Hoax: What Lies Beneath? – Debunked)
1. The Claim Sold to the Public
In 2020, the public was presented with one of the most dramatic claims about the Stonehenge landscape in years: a vast circle or circuit of massive pits surrounding Durrington Walls.
The story was simple and powerful. Large pits, some around twenty metres wide and several metres deep, appeared to form a broken arc around Durrington Walls henge. Larkhill causewayed enclosure seemed to sit within the wider arrangement. The pattern was then interpreted as a huge Late Neolithic structure: a boundary, a ceremonial landscape marker, perhaps even a cosmological monument on a scale previously unrecognised in Britain.
It was perfect television archaeology.
There were hidden features beneath the fields. There was a giant lost monument. There was Stonehenge nearby. There were alignments, boundaries, ritual landscapes and the suggestion that Neolithic people had organised the land at an almost unimaginable scale.
But the problem was not the discovery of the pits.
The problem was the story built around them.
A group of large pits does not automatically prove the existence of a single monument. A broken arc does not automatically prove a planned circle. A pattern on a map does not become ceremonial simply because it can be drawn neatly around a famous henge.
Before the pits are turned into cosmology, the landscape itself has to be explained.
That is where the 2020 interpretation failed.
The 2020 paper presents the features as large pits/anomalies forming arcs around Durrington Walls, and offers a broader interpretation that leans toward a large-pit structure or boundary around the henge.
(The Durrington Mega-Monument Hoax: What Lies Beneath? – Debunked)
2. The First Problem: Spatial Pattern Is Not a Construction Event
The first problem with the Durrington “mega-monument” interpretation is simple: a spatial pattern is not the same thing as a construction event.
Archaeology often begins with pattern recognition. That is fair enough. If a group of large features appears to form an arc, a circle or a boundary, it deserves investigation. But pattern recognition is only the beginning of analysis. It is not the conclusion.
To prove that the Durrington pits formed a single planned monument, we would need more than a broken arrangement on a map. We would need evidence that the pits were made as part of the same project.
That means asking basic questions.
Were they dug at the same time?
Were they made by the same method?
Do they have consistent dimensions?
Do they have consistent depths?
Do they contain comparable fills?
Do they share the same dating horizon?
Do they show the same construction sequence?
Do they have a clear structural purpose?
Do they relate to posts, banks, ditches or entrances in a consistent way?
The variuos sized pit shapes and depths is a very clear indication they are not connected – (The Durrington Mega-Monument Hoax: What Lies Beneath? – Debunked)
Without that evidence, the “mega-monument” remains an interpretation placed over a group of features, not a demonstrated construction event.
The published evidence does not show a neat, uniform monument. It shows a mixed landscape of large anomalies, pits, probable pits, possible modified natural features, post alignments, uncertain features, different survey methods, varying levels of excavation, different dates, and varying degrees of confidence.
Some features are known mainly from geophysics. Some were partly excavated. Some were cored. Some were not bottomed. Some were originally interpreted as natural sinkholes or solution hollows. Some have Late Neolithic evidence. Others have Bronze Age, Iron Age, Romano-British or even later material. Feature ii remains particularly weak and should not be used as a secure part of any argument.
This is not how a clean single-event monument should behave.
The dimensions also vary. The published tables show upper diameters ranging from roughly fifteen to twenty-three metres. Depths vary from around two metres to more than seven metres, with several features not bottomed. That is a major problem if the claim is a single designed monument with a shared purpose.
Variation is not fatal by itself. Ancient monuments do not have to be machine-perfect. But variation in size, depth, date, evidence type, fill history, and certainty must be explained before the features are treated as a single structure.
The Durrington interpretation moves too quickly from “these features appear to form arcs” to “these features form a monumental circuit”.
That leap is the problem.
A shoreline can create an arc.
A palaeochannel can create an arc.
A terrace edge can create an arc.
A springline can create an arc.
A former river margin can result in a broken, irregular distribution of large water-affected features.
So, before the pits are treated as a planned ritual boundary, the physical landscape must be tested first. If the same pattern can be explained by palaeochannels, former shorelines and falling water levels, then the monument interpretation is no longer the simplest explanation.
It becomes more complicated.
(The Durrington Mega-Monument Hoax: What Lies Beneath? – Debunked)
3. The 2026 LiDAR Test: The Pits Fit Palaeochannels
The most important new evidence is not another theory.
It is the map.
When the Durrington pits are plotted against LiDAR data, palaeochannels, and former water-affected terrain, the supposed “mega-monument” begins to lose its mystery. The pattern no longer looks like a clean, planned circle around Durrington Walls. It looks like a broken distribution of large features sitting on, beside, or within former water-margin terrain.
That changes the interpretation completely.
The credible pits appear to follow palaeochannels and former shoreline zones. They do not need to be forced into a ceremonial circuit to make sense. They make sense as features associated with a changing river landscape.
(The Durrington Mega-Monument Hoax: What Lies Beneath? – Debunked)
This also explains the gaps.
In the monument model, the gaps are awkward. A huge ceremonial circle with missing sections needs an explanation: lost archaeology, unsurveyed areas, incomplete construction, later destruction, or symbolic absence.
In the hydrological model, the gaps are expected.
Where the land was not affected by the former water system, there is no reason to expect shoreline pits or water-margin sediment traps. Where the ground was once active water, there is also no reason to expect the same kind of pit survival. Features could have been unnecessary, impossible to dig, scoured away, buried beneath later alluvium, or masked by later river change.
So the gaps are not a weakness in the hydrological model.
They are one of its strongest predictions.
This is the point missed by the 2020 interpretation. The question should never have been simply, “Can these features be drawn as a circuit?” The proper question was, “Do these features fit the former river landscape better than they fit an idealised monument?”
Once that test is applied, the answer becomes difficult to ignore.
The pits fit the palaeochannels.
The gaps fit the palaeochannels.
The strange distribution fits the palaeochannels.
Feature ii remains questionable and should not be used to hold the model together. But once that weak outlier is removed, the remaining pattern becomes clearer. The credible features sit where a water-margin model would expect them to sit, while the missing sections occur where a water-margin model would expect them to be missing.
That is not a coincidence. That is landscape logic.
This does not mean every pit must have had the same origin or function. Some may be cut features. Some may be modified natural hollows. Some may be sediment traps. Some may have been reused. Some may have begun naturally and later acquired cultural material. That is exactly what we should expect in a complex river-edge landscape active over long periods.
What it does mean is that the “single mega-monument” interpretation is no longer the simplest explanation.
A ritual circle has to explain why the pits vary so much, why some are doubtful, why the dates are mixed, why several fills look reworked, why the circuit is broken, and why the missing parts occur where the hydrology predicts absence.
The palaeochannel model explains all of that more naturally.
The Durrington pits are not just dots around a henge.
They are features in a post-glacial river landscape.
Until the published interpretation can show that the pit distribution is better explained by monument geometry than by palaeochannels and former shorelines, the “mega-monument” claim remains unproven.
(The Durrington Mega-Monument Hoax: What Lies Beneath? – Debunked)
4. The Gap Problem: A Monument Fails Where Hydrology Predicts Success
The gaps in the Durrington pit distribution are not a minor detail.
They are the test.
If the pits are interpreted as a single planned monument, the missing sections become a problem. A vast ceremonial circuit should have a clear design logic. If large parts of that circuit are absent, the explanation has to be added afterwards: perhaps the pits were destroyed, perhaps they were never found, perhaps they were not visible to survey, perhaps the monument was incomplete, or perhaps the gaps had some symbolic meaning.
That is not evidence.
That is rescue archaeology for a weak interpretation.
In the hydrological model, the gaps do not need to be rescued. They are predicted by the landscape.
Where the former water system did not reach, there is no reason to expect water-margin pits, shoreline hollows, sediment traps or shell-bearing deposits. Where the former water zone was active, unstable or actually underwater, there is also no reason to expect the same type of pit survival. Features could have been impossible to dig, unnecessary, eroded, buried, masked, or replaced by later river deposits.
(The Durrington Mega-Monument Hoax: What Lies Beneath? – Debunked)
This is why the broken pattern matters.
The apparent gap on one side of the supposed circuit corresponds with land that does not fit the former water-margin model. No shoreline, no pits.
The apparent gap on the other side corresponds with ground that was once within the active Avon/water system. Active water does not preserve a neat ceremonial pit circuit. It cuts, scours, silts, masks and moves.
So what looks like a failed monument becomes a successful hydrological prediction.
The monument model has to explain why the circuit is missing where it is missing.
The water model already explains it.
This is the central weakness of the “mega-monument” claim. The interpretation begins by drawing a circle and then struggles to explain the broken evidence. But if the pits are plotted against palaeochannels and former shorelines first, the broken pattern is no longer broken. It is exactly what a changing river-edge landscape should produce.
The gaps are not missing archaeology.
They are the landscape telling us that the original interpretation started in the wrong place.
(The Durrington Mega-Monument Hoax: What Lies Beneath? – Debunked)
5. The Dating Problem: Shell, Bone and Pine Are Not the Same Evidence
The dating evidence at Stonehenge and Durrington must be handled carefully because not all radiocarbon samples date the same event.
This is where confusion can easily enter the argument.
The Mesolithic post-hole evidence at Stonehenge is associated with pine wood or charcoal. That kind of sample dates human activity involving timber. It does not date the river directly. It tells us that people were active at that location, at that period, and within that landscape setting.
The Durrington shell evidence is different. Shell is not timber. Shell is a carbonate material from a water-affected environment. It is therefore more useful here as evidence for shell-bearing, water-derived sediment at a particular depth and OD level than as a simple “construction date” for a pit.
That distinction matters.
The argument being made here is not that pine charcoal, shell and bone are all identical samples giving identical meanings. They are not.
The argument is that different kinds of dated and datable evidence repeatedly occur within a coherent hydrological landscape.
Pine or charcoal can show human activity at a water-margin location.
Shell can show water-derived material within a specific sediment horizon.
Bone can provide a terrestrial date for later activity, deposition or infilling within the same feature.
These are different kinds of evidence, but together they help build a landscape sequence.
This is why the Durrington shell dates should not be dismissed simply because they differ from bone dates. The report itself recognised that the shell dates do not behave like simple construction dates. That is true. But that does not make the shells meaningless. It means they are telling us something different.
They are not necessarily dating the moment a pit was dug.
(The Durrington Mega-Monument Hoax: What Lies Beneath? – Debunked)
They are dating, or at least period-associating, shell-bearing material within the water-affected sediment system.
For a dry-land monument model, that is awkward.
For a hydrological model, it is exactly the kind of evidence we would expect.
The Durrington shell horizons occur within deep, complex, calcareous and reworked deposits. Their value is not that they provide a neat construction date for a Late Neolithic monument. Their value lies in their placement of shell-bearing, water-derived material at measurable depths within the pit system. Once those depths are converted to OD levels and compared with Stonehenge Bottom, the pattern becomes more important than any single date.
Bone dates have a different role. Bone collagen is a terrestrial sample and is generally more useful for dating later activity or fill events within the pits. But a later bone date does not cancel the hydrological meaning of an earlier shell-bearing horizon. It simply shows that the feature or sediment system remained open, active, reused, reworked or infilled over a long period.
That is the key point.
If a pit contains older shell-bearing material and later bone-bearing deposits, the correct response is not to force the whole feature into one tidy construction date. The correct response is to recognise a multi-phase sediment sequence.
That is exactly what a water-margin landscape should produce.
Material can be washed in.
Older sediment can be reworked.
Shells can be redeposited.
Bone can enter later.
Charcoal can be introduced by human activity.
Silts, gravels and calcareous sediments can accumulate through repeated environmental change.
The dates are therefore not a weakness in the hydrological interpretation. They are part of the reason the dry “single monument” interpretation is so vulnerable.
A single construction event should produce a cleaner chronological pattern.
The Durrington evidence does not.
The shell evidence points to water-derived deposits.
The bone evidence points to later activity or infilling.
The Stonehenge pine evidence points to earlier human activity at a comparable water-margin landscape.
The important connection is not that every sample gives the same date.
It is that the evidence repeatedly appears within the same kind of hydrological setting.
That is why this article does not treat the Durrington shell dates as simple proof that a pit was dug at one exact moment. Instead, they are used as part of a wider hydrological sequence: dated shell-bearing horizons, measurable OD levels, evidence from the Stonehenge Bottom borehole, Mesolithic activity at Stonehenge, and a falling river system that could remain active for centuries or millennia.
This is the difference between dating a monument and dating a landscape.
The 2020 interpretation tried to use the dating evidence to support a Late Neolithic pit structure.
The hydrological interpretation asks a better question:
What do the dates, materials, depths and OD levels tell us about the former river landscape?
Once that question is asked, the evidence stops looking like a problem.
It starts looking like the answer.
(The Durrington Mega-Monument Hoax: What Lies Beneath? – Debunked)
6. The C14 Sequence Does Not Behave Like a Simple Dry Pit
The radiocarbon sequence at Durrington does not behave like a clean, sealed, dry-land pit sequence.
That is a major problem for the “single monument” interpretation.
In a simple dry pit, the dating pattern should normally be fairly straightforward: lower material is generally older. Higher material should generally be younger. If the pit was dug and filled as part of one construction event, the dating should cluster around that event or its immediate aftermath.
That is not what we see.
The Durrington dates are mixed, multi-phase and materially different. They include shells from water-derived deposits and bones from later terrestrial/cultural deposits. That alone should prevent anyone from treating the whole pit system as a simple one-date construction event.
The first issue is the labelling problem.
One shell sample, SUERC-92464, is listed from a depth of 4.80–4.85m below ground level and produced a published calibrated date of 6080–5990 cal BC. The feature label is not straightforward. The main paper and core sequence associate BH1 with 7A, while one supplementary radiocarbon listing appears to create a 9A / BH1 confusion.
That matters for database accuracy, but it does not destroy the hydrological argument.
The secure data are the lab number, material, depth and calculated OD horizon. If the surface height used in the LiDAR model is approximately 99m OD, then a sample at 4.80–4.85m below ground sits at about 94.15–94.20m OD. That is the important point. The sample belongs to a shell-bearing horizon at a measurable elevation within the Durrington pit system.
The argument should therefore be anchored to the sample, not the disputed label:
SUERC-92464 shell 4.80–4.85m below ground published date 6080–5990 cal BC approximate modelled horizon c.94.15–94.20m OD feature label requires caution because of the 7A / 9A inconsistency
That is how the evidence should be handled scientifically.
The second issue is 8A.
(The Durrington Mega-Monument Hoax: What Lies Beneath? – Debunked)
Here, the dating sequence is even more revealing.
8A contains a shell date from 1.50–1.55m below ground, published at 4710–4550 cal BC. It also contains a deeper shell date from 4.35–4.40m below ground, published at 3930–3690 cal BC. Then, near the base, bone from around 4.79m produced a much later date, published at 2460–2200 cal BC.
That is not a simple dry-pit sequence.
A neat monument model would struggle with that order. Older shell-bearing material sits above or within a sequence that later includes much younger bone. The fills are not behaving like a single clean construction deposit.
But a water-margin model does not struggle with this.
In a river-edge or palaeochannel landscape, older shell-bearing sediment can be reworked, washed, slumped or redeposited into later features. As water levels fall, channels shift, margins retreat, sediment is disturbed, and older material can be incorporated into younger fills. Later bone, charcoal, flint, or cultural debris can then enter the same feature during subsequent use, collapse, silting, or reworking.
That is not contamination in the casual sense.
It is a landscape process.
The Durrington evidence makes far more sense if the pits are not treated as sealed ceremonial holes but as complex sediment traps within a changing water-margin landscape.
This also explains why shell evidence should not be dismissed simply because it does not match the bone’s date. The shell is not trying to date the pit as a monument. It records shell-bearing, water-derived material within the pit fill. The bone is recording a later terrestrial or cultural event within the same complex sequence.
Those are different facts.
Both matter.
The real problem is the attempt to compress them into one monument story.
The C14 evidence instead points to a long and complex landscape history. Shell-bearing horizons, later bone deposits, reworked sediments, and deep unbottomed features do not support a simple dry-land construction event. They support a multi-phase environment in which water, sediment and later human activity interacted over long periods.
That is exactly what the LiDAR and palaeochannel model predicts.
The dates do not break the hydrological interpretation.
They break the tidy monument story.
(The Durrington Mega-Monument Hoax: What Lies Beneath? – Debunked)
7. The OSL Problem: Where Is the Full Chronology?
The OSL evidence is another major weakness in the Durrington “mega-monument” interpretation.
In the 2020 paper, the luminescence work was not presented as a complete, fully resolved OSL dating model for the pit system. What was published was mainly luminescence stratigraphy: OSL and IRSL signal profiling through selected cores, especially 8A and 5A. That is useful, but it is not the same thing as publishing a full chronological model with all age estimates, dose rates, rejected samples, uncertainty ranges and reasons for exclusion.
That distinction matters.
Luminescence stratigraphy can show changes in sediment packages. It can show reworking. It can show breaks. It can show whether lower deposits have a different depositional history from upper deposits. But unless the full dating dataset is published, it cannot be independently tested as a complete chronology.
This is especially important at Durrington because the luminescence evidence was not simple.
In 8A, the signal pattern suggested redeposited material through part of the sequence. That is already significant, because redeposition is exactly what a water-margin or palaeochannel model would predict.
In 5A, the problem becomes even bigger. The feature was not bottomed at seven metres, and the luminescence profile indicated a major change in the lower sequence. There was also a light-exposed section of core, which limited normal OSL sampling. That is not a minor technical detail. It affects how confidently the lower deposits can be understood.
So the question is obvious:
Where is the full chronology?
(The Durrington Mega-Monument Hoax: What Lies Beneath? – Debunked)
If the interpretation is going to claim a massive Late Neolithic pit structure, then every dating line matters. The full OSL evidence should be available for scrutiny, including:
all sampled depths all accepted OSL ages all rejected OSL ages all dose-rate data all equivalent-dose estimates all uncertainty ranges all light-exposed intervals all failed or unsuitable samples all reasons for excluding samples from the final model all links between OSL samples, core depths, sediment units and OD levels
Without that, the reader is asked to accept the interpretation without being able to properly test its chronological foundations.
This matters because inconvenient dates are not noise if the real question is hydrology.
A date that does not fit a neat Late Neolithic monument story may still be extremely important. It may date an older sediment package. It may identify redeposited water-margin material. It may show that a pit was cut into a much older palaeochannel fill. It may prove that the feature has a longer landscape history than the monument model allows.
In a purely ceremonial interpretation, awkward dates can be labelled residual, redeposited, contaminated or irrelevant.
In a hydrological interpretation, those same dates may be the evidence.
That is why the OSL problem is so important. The 2020 report already showed that the sediment history was complex, but it did not publish a full OSL chronological archive sufficient to test the hydrological alternative. Later work added more OSL dating and environmental analysis, but the same interpretive assumption remained: the features were still being pulled back into the pit-structure model.
That is not good enough.
If these pits are sitting on palaeochannels and former river margins, then the lower, older, reworked or awkward sediment packages are not side issues. They are central to understanding the site.
The full chronology should decide the interpretation.
The interpretation should not decide which chronology matters.
(The Durrington Mega-Monument Hoax: What Lies Beneath? – Debunked)
8. The Core Logs: These Are Sediment Traps, Not Simple Ritual Holes
The core logs are among the most important pieces of evidence in the entire Durrington debate.
They show that the features are not simple, clean, ceremonial holes with a straightforward construction story. They are deep, complex sediment sequences.
Feature 7A reached fractured chalk at around five metres. Immediately above that lower chalk horizon was a shell / mollusc-bearing sample. That matters because it places water-related material close to the base of the feature, not merely as a casual surface intrusion.
Feature 8A is even more important. Its lower fills contained grey calcareous silts, molluscs, bone fragments and a struck flint. The mollusc-bearing sediment was not an incidental find sitting at the top of the feature. It formed part of a deeper calcareous sequence. That is exactly the sort of deposit expected in a water-affected landscape where older shell-bearing material, silt and cultural debris can be trapped, reworked or redeposited.
Feature 5A is different again. It was cored to seven metres and still not bottomed. Its sequence included bone, charcoal, flint-rich material, fragmentary lower deposits and a major change beneath the upper dated levels. That is not the profile of a simple, uniform pit dug and filled in a single neat event. It is a deep and unresolved sediment archive.
These three cores alone should have stopped the interpretation from becoming too tidy.
7A gives a basal shell-bearing horizon.
8A gives calcareous silts and molluscs within a deeper reworked sequence.
5A gives a deep, unbottomed, and complex fill with bone-, charcoal-, and flint-rich material.
(The Durrington Mega-Monument Hoax: What Lies Beneath? – Debunked)
Taken together, they point to a landscape of sediment movement, water action, reworking and later activity. They do not point clearly to a single ritual construction event.
This is the difference between seeing the pits as “monumental holes” and seeing them as part of a former river-edge landscape.
A ceremonial interpretation looks at the size of the holes and asks what symbolic boundary they might have formed.
A hydrological interpretation looks at the fills and asks what processes created, altered or filled them.
The core logs favour the second question.
They show that the Durrington features are not just empty spaces in the chalk. They are sediment traps. They contain the history of the landscape that filled them.
That history includes water.
(The Durrington Mega-Monument Hoax: What Lies Beneath? – Debunked)
9. The Stonehenge Bottom Connection
The Durrington evidence matters because it does not stand alone.
Stonehenge Bottom has long been treated as if its water-affected deposits could be dismissed as background geology, chalk solution, ancient fossil material, or an irrelevant natural disturbance. That position is no longer safe.
The Durrington pits show that shell-bearing, calcareous, and water-affected deposits occur within the wider Stonehenge landscape in contexts that yield Holocene radiocarbon dates. That does not mean every shell at Stonehenge Bottom is the same age as every shell at Durrington. It does not mean that every shell records the same event. It does not mean every deposit belongs to a single flood.
That is not the argument.
The point is simpler and stronger.
Shell-bearing deposits in this landscape cannot just be waved away.
(The Durrington Mega-Monument Hoax: What Lies Beneath? – Debunked)
They must be tested.
At Stonehenge Bottom, the borehole evidence records repeated water-related material: shells, gravels, sands, silts, marl, organics, peat-like staining, solution features and water-affected chalk. These are not isolated oddities. They occur across multiple boreholes and repeatedly within the same hydrological elevation band.
At Durrington, shell-bearing horizons occur inside deep, complex pit fills associated with calcareous silts, reworked sediments and later material. Again, the correct response is not to dismiss the shells because they complicate the monument’s story. The correct response is to ask what hydrological system placed shell-bearing material at those depths and OD levels.
That is where the connection becomes important.
Durrington proves that shell-bearing deposits within the Stonehenge landscape can be part of the Holocene sedimentary record. Stonehenge Bottom shows that similar water-affected material occurs repeatedly across a wider borehole system. Together, they point to a landscape where water, sediment, shells, organics and human activity interacted over long periods.
This does not prove that every feature was flooded at the same time.
It proves that the dry-land assumption is no longer good enough.
If shells at Durrington can be dated, then shells at Stonehenge Bottom should be dated.
If calcareous silts at Durrington can be analysed, then silts and marl at Stonehenge Bottom should be analysed.
(The Durrington Mega-Monument Hoax: What Lies Beneath? – Debunked)
If Durrington’s deposits require OSL, radiocarbon, sedimentology and environmental testing, then Stonehenge Bottom deserves the same treatment.
The scientific response is obvious:
date the shells identify the species test the carbonate source analyse the sediment calculate the OD levels compare the horizons model the hydrology
Anything less is not science. It is an assumption.
The Durrington evidence, therefore, strengthens the Stonehenge Bottom argument. It shows that shell-bearing, water-affected deposits in this landscape are not archaeological background noise. They may be the record of the landscape itself.
And that is exactly what the “mega-monument” interpretation failed to consider.
The pits were not sitting in an abstract ceremonial diagram.
They were sitting in the same wider post-glacial water landscape that shaped Stonehenge Bottom.
(The Durrington Mega-Monument Hoax: What Lies Beneath? – Debunked)
10. The 2025 Reassessment: More Science, Same Assumption
The 2025 reassessment is important because it added more evidence.
The new work incorporated additional geophysics, including magnetometry, ground-penetrating radar, electromagnetic ground conductivity, and electrical resistivity tomography. It also added drone survey, boreholes, core analysis, geochemistry, chemostratigraphy, OSL profiling and dating, and sedimentary ancient DNA.
That sounds impressive.
And in one sense, it is. More data is always better than less data.
But more science does not automatically mean a better interpretation.
The problem with the 2025 reassessment is that the additional techniques were still largely used to test and defend the pit-structure interpretation, rather than to properly test the competing hydrological explanation. The paper continued to treat the features as a large prehistoric pit structure surrounding Durrington Walls, even while acknowledging variable features, possible natural origins, unproven anomaly ii, differing depths, complex fills and multiple sediment histories.
That is the central weakness.
The new work improved the description of the pits, but it did not break free from the original assumption.
(The Durrington Mega-Monument Hoax: What Lies Beneath? – Debunked)
If the features sit on palaeochannels and former water margins, then the correct test is not simply whether they resemble other pits. The correct test is whether their distribution is better explained by hydrology than by monument geometry.
Do the pits follow former river margins?
Do the gaps correspond with dry land outside the water system?
Do the missing sections correspond with former active water?
Do the depths and OD levels match falling water horizons?
Do shell-bearing layers, calcareous silts and reworked sediments align with palaeochannel positions?
Do the dated horizons behave like shoreline deposits rather than construction deposits?
These are the questions that should have been placed at the centre of the reassessment.
Instead, the interpretation still moves back toward monumentality. The features are repeatedly pulled into the language of arcs, alignments, pit structures, boundaries, Durrington Walls and Larkhill. The landscape is still being organised around a ceremonial model rather than a water model.
This is why the 2025 paper does not close the debate.
It actually strengthens the hydrological critique.
The more sediment evidence is added, the less convincing a simple ritual pit-circuit becomes. Boreholes, chemostratigraphy, OSL and sedaDNA are not just tools for confirming monumentality. They are tools for reconstructing the landscape process. They can show reworking, environmental change, sediment movement, palaeoecology, water-derived material and long-term infilling.
That is exactly why the hydrological model must be tested.
The 2025 reassessment shows that the pits are complex. It shows that they contain layered environmental histories. It shows that no recorded pit has been totally excavated. It shows that individual cores cannot provide full geometry. It shows that remote sensing alone cannot completely define these features.
Those admissions matter.
They mean the interpretation should become more cautious, not more confident.
If the features have not been fully excavated, if the lower sequences remain complex, if some pits are unbottomed, if natural origins remain possible, and if the spatial distribution has not been tested against former water margins, then the “mega-monument” claim remains unproven.
The 2025 reassessment added more science.
But it did not ask the most important question:
Are these really the remains of a planned ceremonial pit structure, or are they the archaeological trace of a changing Avon river landscape?
Until that test is done, the extra science has not solved the problem.
It has simply given us more evidence that the original interpretation may have been based on the wrong assumption.
(The Durrington Mega-Monument Hoax: What Lies Beneath? – Debunked)
11. The Bulford Repeat: Same Mistake, Smaller Site
The Durrington problem is not an isolated case.
The same interpretive failure has now reappeared at Bulford.
At Durrington, large pits, hollows and uncertain features were drawn into a vast “mega-monument” story. The pattern was pushed toward boundary, ceremony, cosmology and large-scale Neolithic planning before the hydrological landscape was properly tested.
At Bulford, the scale is smaller, but the method is familiar.
Two postholes have been promoted as evidence for solar alignment, with suggestions of an earlier Stonehenge-style monument. Once again, the story moves quickly from holes in the ground to sunrise, ritual and Stonehenge.
The problem is not the archaeology.
The problem is the interpretation.
Real features exist at Bulford. Real features exist at Durrington. But real features do not automatically prove the story being built around them.
At Durrington, pits became cosmology.
At Bulford, two postholes became an older Stonehenge.
In both cases, the same method appears:
select a limited number of features draw a line or circuit notice a sunrise or horizon relationship invoke ritual or ceremonial meaning connect it to Stonehenge treat the physical landscape as background scenery
That is backwards.
The correct order should be:
landscape first hydrology second dating third interpretation last
Before Bulford is turned into a solar monument, the river-facing landscape must be tested. Its relationship to the Nine Mile River, the Avon, local topography, former water levels, routeways, palaeochannels and sediment history must come first.
(The Durrington Mega-Monument Hoax: What Lies Beneath? – Debunked)
Before Durrington is turned into a cosmological pit circle, the same test must be applied there. Do the pits form a monument, or do they fit former palaeochannels and shoreline zones? Do the gaps prove missing ceremony, or do they mark areas of dry land and former active water?
That is why the Bulford case matters.
It shows that the same mistake is still being made.
The Stonehenge landscape is being read from the sky down, when it should be read from the ground up.
This is not how science should work. Two points always make a line. Some lines will point at the sun. A broken arc can always be turned into a symbolic circle if the missing parts are explained away. But that does not prove prehistoric intention.
It proves only that modern interpreters are very good at drawing patterns.
The Bulford Hoax article deals with that problem directly. It shows how quickly a limited set of features can be turned into a headline claim before the full landscape evidence has been published and tested.
Durrington is the larger version of the same failure.
At both sites, the archaeology should have been tested against water, terrain, sediment, dating and palaeochannels before it was dressed up as monumentality.
Until that happens, the lesson is simple:
Stop turning holes into cosmology before the landscape has been understood.
(The Durrington Mega-Monument Hoax: What Lies Beneath? – Debunked)
12. What Proper Science Would Test
The Durrington debate does not need more storytelling.
It needs a proper test.
If the pits are indeed a planned Late Neolithic monument, then that interpretation should withstand comparison with the physical landscape. If the hydrological model is wrong, then the evidence should show that too. But that requires testing the two models against each other, not simply assuming the monument model from the start.
The first requirement is simple: plot every credible pit centre accurately.
Not approximate dots.
Not symbolic positions.
Not selected examples.
Every credible feature needs a fixed coordinate, a confidence rating and a source trail. Questionable features, especially ii, should be excluded from the main model unless they are independently proved.
The second requirement is elevation.
Each pit needs a LiDAR-derived surface OD. Each dated or sampled horizon then needs its own calculated OD, based on depth below ground. The same applies to bases, basal chalk contacts, shell-bearing layers, bone horizons, OSL samples, calcareous silts and lower sediment breaks.
Without OD levels, there is no real hydrological test.
The third requirement is a landscape overlay.
The pit map must be tested against:
palaeochannels former Avon water levels former shoreline margins Head deposits dry valleys flow accumulation slope breaks terrace edges springline potential alluvium and colluvium sediment traps and solution features
Only then can the interpretation be tested properly.
(The Durrington Mega-Monument Hoax: What Lies Beneath? – Debunked)
The key comparison is not whether the pits can be drawn around Durrington Walls. We already know they can be made to look like arcs. The real question is whether their distribution is better predicted by distance from Durrington Walls or by distance from former water margins.
That is the test.
If the pits cluster more strongly by distance to Durrington Walls, then the monument model gains strength.
If the pits cluster more strongly by palaeochannel edges, shoreline zones, OD bands and former water levels, then the hydrological model gains strength.
At the moment, the hydrological explanation has not been properly falsified.
That is the failure.
The same applies to the dating evidence. All dating data should be published or archived for scrutiny: radiocarbon lab numbers, material type, sample depths, calibration curves, rejected dates, OSL age estimates, dose-rate data, light-exposed intervals, equivalent-dose values, failed samples and reasons for exclusion.
A scientific chronology does not hide awkward results.
It explains them.
This is especially important because inconvenient dates are not noise if the real question is hydrology. An old shell date, a reworked sediment signal, a light-exposed lower unit, or a mixed fill may be awkward for a simple monument story, but it may be exactly the evidence needed to reconstruct a former river landscape.
The proper test is therefore straightforward.
Plot the pits.
Calculate the OD levels.
Map the palaeochannels.
Overlay the former water levels.
Publish the full dating archive.
Remove unproven ii from the core model.
Then compare two explanations:
Do the pits form a planned monument around Durrington Walls?
Or do they fit a former Avon shoreline and palaeochannel system?
Until that test is done, the “mega-monument” is not a proven archaeological conclusion.
It is an interpretation awaiting landscape review.
(The Durrington Mega-Monument Hoax: What Lies Beneath? – Debunked)
13. Conclusion: What Really Lies Beneath?
The Durrington “mega-monument” has not been proved by the pits.
It is an interpretation placed over a broken pattern.
Large pits exist. That is not in dispute. Some are deep. Some are impressive. Some contain important archaeological and environmental evidence. But none of that automatically proves a single planned Late Neolithic ceremonial circuit.
The monument interpretation depends on treating a scattered, uneven and incomplete distribution of features as if it were a designed whole. It takes arcs and turns them into a circle. It takes gaps and explains them away. It takes complex fills and pulls them back into a single story. It treats water-affected sediment as background rather than evidence.
That is the failure.
Once the same features are plotted against LiDAR, palaeochannels, former water margins and dated water-derived deposits, the pattern looks very different.
It no longer looks like a sacred circle.
It looks like a river landscape.
(The Durrington Mega-Monument Hoax: What Lies Beneath? – Debunked)
The credible pits sit where a changing water-margin landscape would predict them. The gaps occur where a hydrological model would expect gaps: dry ground outside the former water system, or active water zones where pits would not be dug, would not survive, or would be hidden beneath later deposits.
The dating evidence does not rescue the monument model. It exposes its weakness. Shell, bone, charcoal, OSL signals and sediment layers do not form a clean single construction sequence. They point to a longer, messier and more realistic landscape history — one involving water, reworking, sediment movement, later activity and repeated environmental change.
That is what the original interpretation failed to face.
The Stonehenge landscape was not an abstract ceremonial diagram waiting to be decoded from the sky. It was a post-glacial landscape of rivers, springs, palaeochannels, shorelines, gravels, silts, shells, buried soils and changing water levels.
Durrington was part of that landscape.
Stonehenge Bottom was part of that landscape.
Bulford was part of that landscape.
And until archaeological tests of that landscape are conducted, every new “ritual monument”, every sunrise alignment, and every sacred circle should be treated with extreme caution.
The real question is not whether prehistoric people had beliefs, rituals or ceremonies. Of course they did.
The question is whether modern archaeology is mistaking the physical remains of a hydrological landscape for ceremonial architecture.
At Durrington, that is exactly what appears to have happened.
The “mega-monument” may not be a monument at all.
It may be the archaeological shadow of a former Avon river system — a broken pattern of pits, hollows, sediment traps and modified features surviving along palaeochannels and retreating shorelines.
What really lies beneath Stonehenge is not just ritual.
It is water.
And once water is returned to the landscape, the Durrington mystery stops looking mysterious.
It starts looking obvious.
(The Durrington Mega-Monument Hoax: What Lies Beneath? – Debunked)
Old Article for Reference
How Durrington Walls, Larkhill and the “Mega-Monument” Forgot the Water (2020)
The fundamental problem with the modern interpretation of Stonehenge and its wider landscape is simple.
Archaeologists still do not understand the basic infrastructure of prehistoric society.
They look at pits, ditches, earthworks, dry valleys and monument alignments, but too often interpret them as ritual, ceremonial or symbolic before asking the more important question:
What did the landscape actually look like when these features were built?
Imagine a future historian trying to understand our society without knowing what roads were. They might find motorways, lanes, junctions, roundabouts, bridges and service roads confusing. Some roads are straight. Some curve. Some are wide. Some are narrow. Some stop suddenly. Some have been widened, reused, bypassed or abandoned. Without understanding transport, that historian would never understand the structure of our world.
The same mistake is being made with prehistoric Britain.
The infrastructure was not roads.
It was water.
Rivers, palaeochannels, marshes, flooded valleys, landing places, shoreline routes and dykes were the transport system of early Britain. If that is not understood, then the archaeology becomes distorted before interpretation even begins.
This is precisely the problem with Channel 5’s documentary, The Stonehenge Enigma: What Lies Beneath? The title was cheekily close to my own Stonehenge work, but the interpretation repeated the same old archaeological problem: it treated a changing post-glacial landscape as if it were a mostly dry modern chalkland.
Once that assumption is made, the rest of the story goes wrong.
The programme promoted the idea that new research had identified a huge arc or ring of massive pits beneath fields near Durrington Walls. These were said to form part of a two-kilometre-wide structure, with the great Neolithic settlement of Durrington Walls at its centre.
The popular version was dramatic.
Durrington Walls became a “party city”.
The pits became a monumental boundary.
The wider landscape became part of a sacred ceremonial system.
The implication was that archaeologists had found another giant prehistoric structure in the Stonehenge landscape.
The programme synopsis presented this as another remarkable addition to the Stonehenge mystery. The pits, it suggested, formed part of a huge ring around Durrington Walls, perhaps enclosing or defining a special landscape used during seasonal gatherings.
The academic paper behind the claim, A Massive, Late Neolithic Pit Structure associated with Durrington Walls, argued that the surviving pits might represent an elaboration of the monument complex at a massive and unexpected scale. It also suggested that the pits may have been laid out with respect to the recently discovered Larkhill causewayed enclosure, and that some evidence might even show maintenance of the structure into the Middle Bronze Age.
That sounds impressive.
But it only works if the environmental assumptions are correct.
They are not.
The Landscape Is the Missing Evidence
The interpretation assumes that these pits, hollows, and alignments primarily belong to a monumental or ceremonial system.
But if the landscape were water-active, the same evidence would look very different.
Dry valleys were not always dry.
Palaeochannels were not irrelevant background geology.
Ditches were not automatically symbolic.
Pits were not automatically ritual.
Linear earthworks were not automatically boundaries.
And river-facing monuments were not necessarily ceremonial theatres.
They may have been part of a practical water-based landscape of access, movement, drainage, supply, landing, extraction and trade.
That is the missing context in the Durrington interpretation.
The modern Stonehenge landscape is relatively dry. The prehistoric landscape was not. During the Mesolithic and Neolithic, rivers and groundwater systems were operating under very different post-glacial conditions. Water tables were higher. Valleys were wetter. Springs and seasonal channels were more active. Palaeochannels continued to hold environmental significance long after their formation.
If archaeologists ignore this, they will continue to turn working landscapes into sacred fantasies.
Larkhill: The Supposed Boundary That Follows Water
The Larkhill causewayed enclosure is crucial because it was used in the argument for the Durrington pit structure.
But when we examine the site with LiDAR, the landscape tells a different story.
The supposed northern section of the Durrington pit-circle does not behave like part of a neat circular boundary. It sits within and follows a palaeochannel or dry valley system. These features form a line connected with the ancient water landscape rather than a convincing monumental ring.
That matters.
If the pits are aligned within a palaeochannel, then they are not simply arbitrary points on a ceremonial circle. They may be following the physical logic of an earlier watercourse.
The Larkhill causewayed enclosure itself sits in relation to this water system. It is not isolated on empty chalkland. It is positioned where a water-linked route would have mattered.
This supports a very different interpretation.
Causewayed enclosures may not have been mysterious ceremonial camps. They may have functioned as trading and gathering sites positioned on water-connected routes. Their interrupted ditches make far more sense if we understand them as moated or water-fed enclosures rather than simply symbolic boundaries.
Boats could approach.
Goods could be exchanged.
People could gather.
The enclosure could be supplied, defended, accessed and identified from the water.
That is a practical explanation rooted in landscape use.
The Dyke Problem
The Durrington and Larkhill interpretation also ignores one of the most important but least understood prehistoric feature-types in Britain:
the dyke.
Linear earthworks are everywhere in the British landscape. There are more than 1,500 scheduled sections of dykes and linear earthworks across Britain and Ireland. My own LiDAR research has identified thousands more that remain unclassified or misunderstood. If correct, Britain may contain more than 2,000 miles of ancient dyke systems — a greater total length than the known Roman road network in Britain.
Yet archaeology still struggles to explain them.
Some are called defensive.
Some are called territorial.
Some are called boundaries.
Some are called lynchets.
Some are simply ignored.
But the word dyke itself is water-related. A dyke is a water-management feature. In many cases, that older meaning may be the clue archaeologists have missed.
At Larkhill, the linear earthwork associated with the palaeochannel makes far more sense as part of a water-management or water-supply system than as a symbolic boundary.
At Durrington Walls, the same problem appears again.
The Durrington “Lynchet” That Runs the Wrong Way
Within the Durrington Walls landscape, there is a linear earthwork that once connected the River Avon to the henge’s ditch or moat.
In the report, this feature was described as a modern lynchet.
That interpretation is weak.
Durrington Walls ‘DYKE’ – see LiDAR Video for more details – The Stonehenge Enigma: What Lies Beneath? – Debunked
A lynchet is normally an agricultural feature formed by ploughing across a slope. Lynchets generally run along the contour of a hillside.
This feature does the opposite.
It runs down the slope towards the River Avon, some 30 metres below.
That is not how a typical lynchet behaves.
It is exactly how a water-linked dyke, channel or supply feature would behave.
LiDAR shows this clearly. The feature is not simply a random agricultural scar. It connects the monument to the river system. If Durrington Walls had a water-fed ditch or moat, it would be logical.
Again, the problem is not a lack of evidence.
The problem is the interpretive framework.
If archaeologists expect ritual, they see ritual.
If they expect agriculture, they see lynchets.
If they begin with hydrology, the landscape suddenly makes more sense.
Removing the Northern Section
Once the northern “pit-circle” elements are understood as features associated with a palaeochannel and possible dyke system linked to Larkhill, the supposed two-kilometre circle begins to weaken.
The “monument” is no longer a clean ring.
It becomes a mixed landscape of natural hollows, palaeochannels, pits, reused features, dykes and water-related deposits.
That does not make the archaeology unimportant.
It makes it more interesting.
But it is no longer the simple story sold to the public: a giant sacred boundary surrounding Durrington Walls.
The remaining southern features then need to be assessed on their own terms. When examined against LiDAR, topography and reconstructed Mesolithic/Neolithic water levels, many of them appear to relate more logically to the raised shoreline and hydrological history of the River Avon than to a single monumental circuit.
Some of these features sit at levels that would have been strongly affected by earlier water regimes.
That brings us to the dating evidence.
The C14 Dates Do Not Support a Simple Monument
The radiocarbon dates associated with these features are not neat.
They range across a long period.
Larkhill Causewayed Camp and its paleochannel with pits – The Stonehenge Enigma: What Lies Beneath? – Debunked
Some of the most important dates come from shell and bone material recovered from the Durrington features. The shell samples are especially important because they produced Holocene dates rather than meaningless ancient fossil ages.
Feature 7A produced a shell date around 6080–5990 cal BC.
Feature 8A produced another shell date around 4710–4550 cal BC.
A further shell date from feature 8A produced a result around 3930–3690 cal BC.
Feature 5A produced later material, with dates reaching into the Bronze Age.
That is not a single construction event.
That is a long-lived, water-affected landscape sequence.
Southern Pits reflect the post-glacial flooding in the area – Stonehenge enigma
The original authors were cautious about the shell dates, suggesting they may be affected by geological calcium or reservoir effects and therefore should not be used as direct dates for the pits’ excavation.
That caution is reasonable.
But it also proves the point.
If shell carbonate is affected by geological calcium or reservoir effects, then hydrology is not a side issue.
It is the issue.
Reservoir effects are hydrological evidence.
Carbonate movement is hydrological evidence.
Shell-bearing sediments are hydrological evidence.
Water-affected pits are hydrological evidence.
The shell dates should not be dismissed. They should force a proper environmental reconstruction of the entire Stonehenge landscape.
The Core Logs Show More Than Three Shell Dates
The Durrington evidence is even stronger when the core logs are examined in detail. The important point is not simply that three shell samples were radiocarbon dated. The sediment descriptions themselves show that these features were water-affected environmental deposits.
In pit 7A, the mollusc sample came from 4.80–4.85m, immediately above fractured chalk bedrock. Above it lay loose, unconsolidated, chalky silts with clasts of flint and chalk. That is not the description of a clean, dry, sealed ritual feature. It is a sediment sequence.
Pit 8A is even more significant. Between 2.60m and 4.35m, the core log records grey calcareous silts, described as structureless and massive, with molluscs present throughout. That is not one stray shell fragment. That is a thick mollusc-bearing calcareous silt deposit nearly two metres deep. Below it, the same feature produced grey silts, bone fragments and a flint artefact.
This matters because mollusc-bearing calcareous silts are environmental evidence. They point towards water, groundwater chemistry, slow silting, carbonate movement, ponding, palaeochannel activity or wet hollow conditions. Even if the shells are treated cautiously for dating purposes, their presence still demands a hydrological explanation.
Pit 5A adds another complication. It was cored to 7m without clearly reaching chalk bedrock. Its lower fills included brown clay silt with charcoal and bone, followed by flint gravel with many bone fragments, charcoal and burnt flints, and then possible bedding with darker horizons. That is a complex sediment trap, not a simple ceremonial hole.
So the Durrington evidence is not just three shell dates.
It is a wider pattern of grey silts, calcareous deposits, molluscs, bone-rich layers, unconsolidated sediments, gravel, possible bedding and deep unresolved stratigraphy.
That is exactly why the “mega-monument” interpretation is premature.
Before these features become a sacred boundary around Durrington Walls, they must first be understood as physical features within a water-shaped landscape.
The core logs do not weaken the hydrology argument.
They strengthen it.
The most remarkable weakness in the Durrington “mega-monument” claim is the mismatch between the scale of the interpretation and the scale of the physical testing.
The proposed monument includes numerous features arranged around a two-kilometre circuit, yet the core logs relate to only three sampled features: 7A, 8A and 5A. Those cores are important, but they cannot carry the whole interpretation. They show that selected features contained deep sediment sequences, molluscs, calcareous silts, bone, flint and complex fills. They do not prove that every anomaly in the proposed circuit was the same type of feature, dug at the same time, used for the same purpose, or maintained as part of one planned monument.
Three cores can ground-truth three features. They cannot prove a mega-monument.
The Stonehenge Bottom Connection
This is where the Durrington evidence becomes far more important.
At Stonehenge Bottom, the borehole evidence records a repeated cluster of water-related deposits: shell fragments, gravels, sands, silts, organic staining, chalk disturbance and other sediments sitting within a comparable elevation band. These deposits have been criticised as irrelevant, with the usual dismissal being that the shells are probably just ancient fossils from the chalk.
But the Durrington evidence now makes that dismissal much weaker.
The Durrington core logs do not simply record three isolated shell samples. They record a broader sedimentary pattern that closely resembles the material identified in the Stonehenge Bottom boreholes.
In pit 7A, the mollusc sample was taken from 4.80–4.85m, immediately above fractured chalk bedrock. Above it lay loose, unconsolidated, chalky silts with clasts of flint and chalk. This is not the description of a clean, dry, sealed ceremonial feature. It is a sediment sequence sitting directly over broken chalk.
In pit 8A, the evidence is even stronger. Between 2.60m and 4.35m, the core log records grey calcareous silts described as structureless and massive, with molluscs present throughout. That is not one stray shell fragment. It is a thick mollusc-bearing calcareous silt deposit nearly two metres deep. Below this, the same feature produced grey silts, bone fragments and a flint artefact.
In pit 5A, the borehole reached 7m without clearly reaching chalk bedrock. The lower fills included brown clay silts with charcoal and bone, flint gravel with many bone fragments, charcoal fragments, burnt flints and possible bedding with darker horizons. That is a complex, deep sediment trap, not a simple ritual pit.
These details matter because they show that the Durrington features were not just “holes”. They contained water-related sediment signatures: calcareous silts, molluscs, loose unconsolidated fills, gravels, bone-rich layers and possible bedding. These are precisely the kinds of deposits that require hydrological explanation.
That links directly to Stonehenge Bottom.
At Stonehenge Bottom, the boreholes identify shell fragments and water-laid or water-affected materials within a repeated elevation band. At Durrington, the core logs identify mollusc-bearing calcareous silts, grey silts, gravels and deep sediment sequences within major landscape features. In both cases, we are looking at subsurface deposits that make most sense within a water-shaped landscape.
The difference is that some of the Durrington shell material was radiocarbon dated.
And the results were not millions of years old.
They produced Holocene dates, including Mesolithic and Neolithic results.
That does not prove that every Stonehenge Bottom shell is the exact same age as the Durrington shells.
But it does prove something extremely important.
Shell-bearing deposits in the wider Stonehenge landscape can be Holocene environmental evidence. They cannot simply be dismissed as meaningless chalk fossils without testing.
The proper scientific response is obvious:
date them.
If the Stonehenge Bottom shells return Holocene dates, then the traditional dry-land interpretation of Stonehenge Bottom has a serious problem.
The Durrington evidence, therefore, supports the broader hydrological model in two ways.
First, the C14 shell results show that Holocene shell-bearing deposits exist within the wider Stonehenge landscape.
Second, the core logs show that these shells occur within grey calcareous silts, chalky silts, gravels, bone-rich layers and deep sediment sequences — exactly the kind of deposits expected in wet hollows, palaeochannels, ponded pits, groundwater-fed depressions or slow-silting water-affected features.
This means Stonehenge Bottom should no longer be treated as an isolated anomaly.
It sits within a wider pattern.
Durrington has mollusc-bearing calcareous silts.
Stonehenge Bottom has shell-bearing borehole horizons.
Durrington has grey silts, gravels, bone and deep unresolved sediment sequences.
Stonehenge Bottom has sands, gravels, silts, organic material and water-affected deposits.
Durrington has Holocene C14 shell dates.
Stonehenge Bottom has comparable shell-bearing deposits that now urgently require direct dating.
Together, these two datasets point towards the same conclusion: the Stonehenge landscape was hydrologically active, chemically complex and environmentally dynamic during the Mesolithic and Neolithic.
The shells are not the weakness in the argument.
They are the clue.
The real weakness lies in any interpretation of Stonehenge, Durrington or Larkhill that treats this landscape as dry ceremonial chalkland before first explaining the water.
The Real Shape of the Landscape
The Channel 5 documentary and the Durrington pit-circle claim both suffer from the same problem.
They start with monuments.
They should have started with water.
Once we properly reconstruct the landscape, the supposed mysteries become less mysterious.
Larkhill sits on a water-linked route.
Durrington Walls connect to the River Avon.
The so-called lynchet behaves more like a dyke.
The northern “pit-circle” follows a palaeochannel rather than a clean ceremonial boundary.
The southern pits correspond with changing water levels and long-term landscape activity.
The shell dates show Holocene environmental signals.
The Stonehenge Bottom boreholes record similar water-related signatures.
Together, these do not point towards a simple two-kilometre sacred ring.
They point towards a changing post-glacial river landscape.
Causewayed Enclosures as Trading Sites
This also changes how we view causewayed enclosures.
The traditional explanation treats them as ceremonial gathering places.
But their structure makes far more sense in a water-based economy.
Causewayed enclosures are often found in prominent landscape positions, near river systems, valleys, routeways or water access points. Their segmented ditches could control access, manage water, organise movement and define trading areas.
If boats were central to prehistoric transport, then causewayed enclosures were not isolated religious sites.
They were meeting points.
Markets.
Landing zones.
Exchange hubs.
Controlled spaces where goods, animals, people and information moved through the landscape.
This also explains why later communities reused and reinterpreted these places. Important practical sites often become important symbolic sites. The mistake is assuming they were symbolic from the start.
The Problem With “Ceremonial”
Modern archaeology often uses “ceremonial” when it cannot explain the function.
This is not good enough.
A pit is not ceremonial because it contains bone.
A ditch is not ceremonial because it surrounds space.
A line is not ceremonial because it can be drawn on a map.
A river-facing monument is not ceremonial because archaeologists have not reconstructed the water system.
The word ceremonial has become a dustbin for unresolved evidence.
The Durrington pit-circle claim is a perfect example.
Large features became pits.
Pits became a circuit.
The circuit became a boundary.
The boundary became sacred.
The sacred boundary became cosmology.
But each step required assumptions.
Once the hydrology is restored, those assumptions become much weaker.
The Failure of the Original Paper
The original Durrington pit-circle paper did not use LiDAR as it should have.
That is a serious weakness.
LiDAR is one of the most powerful tools available for understanding prehistoric landscapes. It reveals routeways, dykes, palaeochannels, earthworks, slope relationships, shoreline levels and subtle features that cannot be understood from geophysics alone.
If you are proposing a two-kilometre monumental structure across a complex chalk landscape, LiDAR should not be optional.
Without it, natural hollows, palaeochannels, dykes and landscape features can be misread as components of a monument.
That appears to be exactly what happened.
What the Evidence Actually Shows
The evidence does not show a simple sacred boundary.
It shows a complex, reused, water-shaped landscape.
It shows palaeochannels.
It shows pits.
It shows shell-bearing deposits.
It shows long-term activity from the Mesolithic through the Neolithic and into the Bronze Age.
It shows features connected to the River Avon.
It shows a possible dyke at Durrington misidentified as a lynchet.
It shows Larkhill linked to a water route rather than neatly incorporated into a circular monument.
It shows that dry valleys were still archaeologically active.
It shows that hydrology has been badly underestimated.
In other words, the Durrington pit structure may not be a giant monument at all.
It may be an archaeological misunderstanding of a water-shaped landscape.
Conclusion: What Really Lies Beneath?
What lies beneath Stonehenge and Durrington is not simply another sacred monument.
It is water.
Water shaped the landscape.
Water shaped movement.
Water shaped settlement.
Water shaped access.
Water shaped trade.
Water shaped where monuments were built.
Water shaped how pits filled.
Water shaped what survived.
Water shaped the dates.
And water has been largely ignored.
The problem with modern interpretations of Stonehenge is not that archaeologists lack data. They have excavation, geophysics, radiocarbon dates, boreholes, environmental samples, LiDAR and landscape surveys.
The problem is that the evidence is repeatedly forced through the same old interpretive filter:
ritual,
ceremony,
religion,
sacred landscape,
cosmology.
This has led archaeology away from physical explanation and towards storytelling.
The Durrington “mega-monument” is not proof of a vast sacred boundary.
It is proof of how easily a complex hydrological landscape can be turned into a headline.
Archaeology should not begin by asking what ancient people believed.
It should begin by asking how the landscape worked.
At Stonehenge, Durrington and Larkhill, the answer is clear.
The landscape worked through water.
Until that is understood, every documentary, every headline and every “new discovery” will continue making the same mistake.
They will keep finding sacred landscapes where they should have been finding shorelines.
PODCAST
Author’s Biography
Robert John Langdon, a polymathic luminary, emerges as a writer, historian, and eminent specialist in LiDAR Landscape Archaeology.
His intellectual voyage has been interwoven with stints as an astute scrutineer in government and grand corporate bastions, a tapestry spanning British Telecommunications, Cable and Wireless, British Gas, and the esteemed University of London.
A decade hence, Robert’s transition into retirement unfurled a chapter of insatiable curiosity. This phase saw him immerse himself in Politics, Archaeology, Philosophy, and the enigmatic realm of Quantum Mechanics. His academic odyssey traversed the venerable corridors of knowledge hubs such as the Museum of London, University College London, Birkbeck College, The City Literature Institute, and Chichester University.
In the symphony of his life, Robert is a custodian of three progeny and a pair of cherished grandchildren. His sanctuary lies ensconced in the embrace of West Wales, where he inhabits an isolated cottage, its windows framing a vista of the boundless sea – a retreat from the scrutinising gaze of Her Majesty’s Revenue and Customs, an amiable clandestinity in the lap of nature.
Exploring Prehistoric Britain: A Journey Through Time
My blog delves into the fascinating mysteries of prehistoric Britain, challenging conventional narratives and offering fresh perspectives grounded in cutting-edge research, particularly LiDAR technology. I invite you to explore some key areas of my research. For example, the Wansdyke, often cited as a defensive structure, is re-examined in light of new evidence. I’ve presented my findings in my blog post Wansdyke: A British Frontier Wall – ‘Debunked’, and a Wansdyke LiDAR Flyover video further visualises my conclusions.
My work also often challenges established archaeological dogma. I argue that many sites, such as Hambledon Hill, commonly identified as Iron Age hillforts, are not what they seem. My posts Lidar Investigation Hambledon Hill – NOT an ‘Iron Age Fort’ and Unmasking the “Iron Age Hillfort” Myth explore these ideas in detail and offer an alternative view. Similarly, sites like Cissbury Ring and White Sheet Camp receive re-evaluations based on LiDAR analysis in my posts “Lidar Investigation Cissbury Ring through time”and “Lidar Investigation White Sheet Camp,“ revealing fascinating insights into their true purpose. I have also examined South Cadbury Castle, often linked to the mythical Camelot56.
My research also extends to ancient water management, including the role of canals and other linear earthworks. I have discussed the true origins of Car Dyke in multiple posts, including Car Dyke – ABC News Podcast and Lidar Investigation Car Dyke – North Section, which suggest a Mesolithic origin 2357. I also explore the misidentification of Roman aqueducts, as seen in my posts on the Great Chesters (Roman) Aqueduct. My research has also been greatly informed by my post-glacial flooding hypothesis, which has helped explain landscape transformations over time. I have discussed this hypothesis in several posts, including AI now supports my Post-Glacial Flooding Hypothesis and Exploring Britain’s Flooded Past: A Personal Journey
For those interested in British Prehistory, visit www.prehistoric-britain.co.uk, a comprehensive resource featuring an extensive collection of archaeology articles, modern LiDAR investigations, and groundbreaking research. The site also includes insights and excerpts from the acclaimed Robert John Langdon Trilogy, a series of books that explore Britain during the Prehistoric period. Titles in the trilogy include The Stonehenge Enigma, Dawn of the Lost Civilisation, and The Post-Glacial Flooding Hypothesis, which offer compelling evidence of ancient landscapes shaped by post-glacial flooding.
To further explore these topics, Robert John Langdon has developed a dedicated YouTube channel featuring over 100 video documentaries and investigations that complement the trilogy. Notable discoveries and studies showcased on the channel include 13 Things that Don’t Make Sense in History and the revelation of Silbury Avenue – The Lost Stone Avenue, a rediscovered prehistoric feature at Avebury, Wiltshire.
In addition to his main works, Langdon has released a series of shorter, accessible publications, ideal for readers delving into specific topics. These include:
For active discussions and updates on the trilogy’s findings and recent LiDAR investigations, join our vibrant community on Facebook. Engage with like-minded enthusiasts by leaving a message or contributing to debates in our Facebook Group.
Whether through the books, the website, or interactive videos, we aim to provide a deeper understanding of Britain’s fascinating prehistoric past. We encourage you to explore these resources and uncover the mysteries of ancient landscapes through the lens of modern archaeology.
For more information, including chapter extracts and related publications, visit the Robert John Langdon Author Page. Dive into works such as The Stonehenge Enigma or Dawn of the Lost Civilisation, and explore cutting-edge theories that challenge traditional historical narratives.
13 things that don’t make sense about Waun Mawn (Stonehenge’s The Lost Circle Revealed)
Introduction
According to the BBC documentary, the discovery of the bluestone quarry in Wales was presented as a major breakthrough in understanding Stonehenge. At face value, that seems fair enough. Identifying a potential source for the stones is important.
But this is where the problem begins.
Because from that point onward, the investigation appears to shift away from asking what the evidence actually shows… and toward trying to make the evidence fit an already established timeline.
Instead of examining the quarry independently and comparing it objectively with Stonehenge, the focus becomes finding dates that support a pre-existing conclusion. That is not how science works. When you start with the answer and work backwards, you are no longer testing a hypothesis — you are trying to confirm one.
Craig Rhos-y-Felin is a good example of this.
Craig Rhos-Y-Felin: Stonehenge: The Lost Circle Revealed
The site contains clear evidence of Mesolithic activity, particularly in the form of man-made hearths. That should be the starting point for interpretation. Yet the emphasis is instead placed on a small number of later samples that fall closer to the desired Neolithic timeframe.
When those dates still don’t quite align, the solution is not to question the model — it is to introduce another one. A “prototype” stone circle in Wales was later moved to Stonehenge. A theory designed not from evidence, but from necessity.
And so begins a decade-long search for that missing link.
Sites are proposed… then quietly dropped when the dates don’t match. New locations are suggested… then abandoned for the same reason. The pattern repeats. The goal is no longer discovery — it is validation.
Eventually, everything converges on Waun Mawn.
(Stonehenge’s The Lost Circle Revealed)
This is presented as the long-awaited solution. But when you strip it back, the physical evidence is extremely limited. A handful of stones. A small number of possible stone holes. Nowhere near enough to replicate what exists at Stonehenge.
So the gaps are filled in.
Estimates are extended beyond what is actually present. Missing stones are assumed. Layouts are reconstructed from partial data. And suddenly, a fragment becomes a full circle.
Then we come to the dating.
Among a broad range of results spanning several millennia, one sample is highlighted as aligning with the proposed timeline. The rest — which do not support the theory — receive far less attention.
This is the core issue. You cannot treat a single favourable result as definitive while ignoring the wider dataset. That is not strengthening an argument — it is narrowing it.
The same pattern appears in other parts of the interpretation.
(Stonehenge’s The Lost Circle Revealed)
Large stones at the quarry are presented as the source of Stonehenge’s bluestones, despite clear differences in size and shape. No explanation is provided for how they were reduced or reworked.
Transport by water is dismissed, despite experimental demonstrations showing it is entirely possible. Instead, overland transport through heavily forested and waterlogged terrain is presented as the more feasible option — a claim that raises more questions than it answers.
Even the more technical aspects, such as photogrammetry, are used in ways that assume ideal conditions. A stone is said to match a socket, without addressing the simple fact that removing a stone alters the shape of that socket. Basic mechanical realities are overlooked.
And then, towards the end, the programme drifts into broader speculation — cultural movements, symbolic alignments, and generalised astronomical claims. These are presented confidently, but without the level of supporting evidence required to justify them.
Meanwhile, key inconsistencies remain unresolved.
Stonehenge contains 56 bluestone positions. Waun Mawn does not. The construction methods differ. The depth of the stone holes differs. The overall structure is not the same.
These are not small details. There are fundamental differences.
(Stonehenge’s The Lost Circle Revealed)
So what are we left with?
Not a clear, evidence-led conclusion — but a narrative built around selective interpretation. Certain data points are emphasised. Others are downplayed. Gaps are filled with theory rather than evidence.
The result is compelling television.
But it is not robust science.
Because real scientific analysis does not depend on finding the right answer.
It depends on being willing to accept when the evidence points somewhere else entirely.
(Stonehenge’s The Lost Circle Revealed)
The Documentary
Therefore, the last hope for MPP’s reputation and his ’10-year search’ fell upon Waun Mawn, culminating in the BBC documentary “Stonehenge: The Lost Circle Revealed”, shown on the 12th February 2021. In it, he claimed many so-called ‘facts’ which I shall now highlight as ‘not making sense’, with the reasons why.
1. At (13:20) MPP shows signs of human-made quarrying and splitting of Bluestones at Carn Goedog in Wales – unfortunately, there are no extensive excavation reports on this site, just a published review showing that of the 31 carbon dates, only three random samples support his theory and none of the man-made hearths which are Mesolithic (like Craig Rhos-Y-Felin) or late Neolithic.
2. The program showed the suggested quarried stones at Carn Goedog, which are over 12 feet long and 5 feet wide, weighing therefore around 20+ tonnes. The Stonehenge bluestones are, on average, less than six feet high and about 18–24 inches wide, weighing 1-3 tonnes.The review on the site offered no evidence that the stones were cut down and reshaped for the journey to Stonehenge or elsewhere. (Stonehenge’s The Lost Circle Revealed)
Carn Goedog – Stonehenge: The Lost Circle Revealed
3. MPP claims that the boat transport method (14.50) was infeasible as they did not have sturdy enough boats to carry the stones on such a journey – Sadly, you do not need a ‘boat’ to transport stones in a river as shown by Atkinson in the 1960’s who employed just four school kids to punt a raft with a 3 tonne stone attached down the Avon. Moreover, he has failed to recognise that the oldest boatyard in the world, located in the Solent (at the end of the Avon), was found with planked wood (and associated wheat grain from Turkey), indicating that substantial seafaring boats were available by the 7th Millennium BCE.
Clearly MPP was too young to see this punt down the Avon?
4. Mike Parker-Pearson also suggested that an ‘ox-cart’ route that followed the current A40 was the most feasible way of transporting these stones to Stonehenge. He believed that they dragged these stones over 200 km on wooden sledges – unfortunately, the example shown on the program shows schoolboys dragging a small stone over flat grassland, which would not be available for another 4000+ years and after Stonehenge’s initial construction. At the time of Phase I construction, the environment (as indicated by pollen analysis) shows that 70% of the terrain was woodland and forest, and the remaining 30% was mostly rivers and swampland, making such an endeavour impossible.
5. The Discovery (21:15) of ‘random’ hazel nuts at Craig Rhos-Y-Felin provides MPP’s required date for Stonehenge of 3300 BCE (which is still 500 years before MPP’s supposed construction date) – This clear ‘cherry picking’ of the archaeological evidence is ‘Bad Science’. To take just two carbon dates from over 40 at the Craig-Rhos-Y-Felin site and ignoring the more solid man-made hearth dates, which are Mesolithic and moreover, compatible with 26 carbon dates found at Stonehenge, is plainly a falsehood.
6. When they eventually found their target site (36:15), Waun Mawn (after many claims that other sites were “the one we have been looking for” to eventually find that the carbon dating on these sites did not match the required date), they found just four bluestones, and so went on a stone hunt and found 10 further stone HOLES! – This is clearly a sad attempt to fit a square peg into a round hole. The excavation was flawed as it only identified 14 possible stone locations and the remainder of the estimated 15 – 25 stones was a ‘guesstimation’ based on the known 14 holes – two of which had non-bluestone stones in situ.
Nowhere near the 56 stones needed to create Stonehenge Phase I
7. The BBC reconstruction shows just 28 stones (38:05) of the 56 Bluestones required for the Aubrey holes to be filled at Stonehenge, and MPP goes on to suggest, that the stone circle is of equal size and dimensions as Stonehenge, quote “the chances of the two sites having the EXACT dimensions are very slim”- This sadly, is another falsehood, the Moat/Ditch at Stonehenge is approximately 110 metres in diameter, NOT the Aubrey holes which are 90 metres in diameter. Moreover, Stonehenge has a ditch/moat surrounding the stones (for a good reason) Waun Mawn does not!!
8. MPPs then used a new, unused tool in archaeology to prove their hypothesis, ‘photogrammetry’, and suggested that Stone 62 at Stonehenge fitted the stone hole 91 at Waun Mawn. The reason this method is not used is somewhat obvious to even non-academics. You would need a crane to lift the stone vertically out of the hole to get an exact imprint. If you are taking out a stone by hand and/or with levers, you will rock it from side to side, destroying the stone hole impression, as we have seen with post holes in numerous excavations.
9. The program fails to report that the 40 carbon dates from wood found on the site did not come up with MPP’s magic date, and so he employed another form of Dating OSL (40:17) to find this single piece of evidence he desperately required. – Sadly, watching Dr Kim Kinnaird’s efforts to get a light, uncontaminated sample from over a fallen Stone summed up the state of archaeology as a science for me. Armed with a black weed blocker and a bicycle light on his head, he set forth to get a sample to prove MPP’s hypothesis. Anyone who considers this an effective way of obtaining an OSL sample is beyond scientific redemption, as logic would suggest; doing it at night would perhaps be more suitable. This was finally compounded when we saw him transporting the sample in his hand into the detector in daylight, which was pure icing on that flawed cake.
10. Roberts indicated (quite rightly) that ALL the dates were “way out” and all hopes were put on this one sample, MPP then claimed (42:20) “we had dated the thing, and it just before Stonehenge’s construction” (3300 BCE) – Sadly, and not report in the program, but within the Waun Mawn excavation report, there was not one OSL samples taken but 18, which gave results in the range of 6980+/- 2120 BCE to AD 1900 +/- 20. So the 17 dating sample did not verify MPP’s hypothesis, only a single one, which was dated 3530 +/- 330 (with that date range, the probability it’s 3300 BCE is slim!!).In fact, the OSL data in the review document suggested “removal of the stones” in 2120 +/- 520 BCE, long after the Stonehenge phase I.
11. The program then went onto a flight of fantasy for 15 minutes (25% OF AIR TIME) with unscientific mythology and astroarchaeology (which proved MORE that astroarchaeology doesn’t have any significance as the ‘expert’ suggested that the stones were ‘in the general direction’ of an alignment – which by the very nature of a stone circle of 360 degrees – every stone circle in the world is in the general direction of all astrological alignments!! Even more ludicrous came an idea that the Welsh culturally invaded England in 3300 BCE and took the stones of Waun Mawn with them –Sadly, at no point did the experts attempt to justify why Stonehenge had 56 Bluestones and the site at Waun Mawn had less than 30 at the most. Even if this idea were remotely true, why would you leave four stones behind when you are already going to be 30 stones short and need to go back and get some more from the quarry site?
12. The program never went into any detail of the OTHER carbon dates found at Waun Mawn, which would have allowed a balanced scientific program, allowing the viewer to decide whether MPP’s hypothesis was actually feasible. It presented speculation as fact, with a number of site workers and the presenter agreeing on MPP’s ideas without question or qualification – this is commonly known as ‘propaganda’ rather than scientific methodology. Moreover, the REAL evidence can be found in the report and shows that of the carbon dating evidence at Waun Mawn (the OSL data was excluded from the report accept a small paragraph without all data!) shows that of the 42 samples taken:
1 – sample were of 9th Millennium BCE
3 – samples were of the 8th Millennium BCE
8 – samples were of the 7th Millennium BCE
4 – samples were of the 6th Millennium BCE
10 – samples were of the 5th Millennium BCE
6 – samples were of the 4th Millennium BCE
11- samples from the 4th Millennium BCE to 17 AD.
13. The report on Waun Mawn contains other questionable evidence, which was excluded from the program. This includes the fact that the Aubrey holes at Stonehenge are ALL two to three times deeper than at Waun Mawn. This indicates that the Stonehenge Bluestones were made from larger bluestones than those at Waun Mawn (Stonehenge Bluestone hole 69 is over 1.5m deep, as it is long and thin). It looks as if the original stone circle at Waun Mawn was made up of stones similar in shape to the existing recumbent stone 13, which is 6– 7 feet tall and surrounded by a moat. The shape of recumbent 13 indicates that rather than the long thin bluestones as at Stonehenge, Waun Mawn had ‘fat bottomed’ domed ends and hence the need for only shallow ditches.
recumbent stone 13; Stonehenge: The Lost Circle RevealedStonehenge Bluestone 69 – a third is underground. Stonehenge: The Lost Circle Revealed
Conclusion
In conclusion, it seems that the BBC has produced a nice piece of archaeological propaganda that supports the current false ‘archaeological narrative’ of mythology and speculation, rather than tested and qualified scientific fact. This lack of ‘critical analysis’ is a clear indication of why the ‘science’ of archaeology has not progressed much over the last 50 years, even with modern technology, which it has incorporated to very limited success.
(Stonehenge’s The Lost Circle Revealed)
Memoir
I first met MPP on his excavation dig on the Avon in 2009, where he was preparing to announce his bluestone site, ‘Bluestonehenge’. At the time, we had a discussion about the date of the site, as he was convinced that (at that time) he believed it predated Stonehenge Phase I (we now know this was the first of many claims of a predated Stonehenge bluestone circle). I did point out that at the meeting that I thought this date would be incorrect as according to my research (of the surrounding 50 sites around Stonehenge) which was included in my published book and post-glacial flooded environment hypothesis ‘The Stonehenge Enigma’ in 2013 – that this site would have been below water as the River Avon would remain flooded throughout the Neolithic period. At this point, he ended the meeting and disappeared at such a rapid speed – it looked as if he thought I was clearly mad.
Later carbon dating proved my point and supported my hypothesis, as it is now accepted that Bluehenge was constructed between 2840 and 2230 BCE, in the Early Bronze Age.
PODCAST
Author’s Biography
Robert John Langdon, a polymathic luminary, emerges as a writer, historian, and eminent specialist in LiDAR Landscape Archaeology.
His intellectual voyage has been interwoven with stints as an astute scrutineer in government and grand corporate bastions, a tapestry spanning British Telecommunications, Cable and Wireless, British Gas, and the esteemed University of London.
A decade hence, Robert’s transition into retirement unfurled a chapter of insatiable curiosity. This phase saw him immerse himself in Politics, Archaeology, Philosophy, and the enigmatic realm of Quantum Mechanics. His academic odyssey traversed the venerable corridors of knowledge hubs such as the Museum of London, University College London, Birkbeck College, The City Literature Institute, and Chichester University.
In the symphony of his life, Robert is a custodian of three progeny and a pair of cherished grandchildren. His sanctuary lies ensconced in the embrace of West Wales, where he inhabits an isolated cottage, its windows framing a vista of the boundless sea – a retreat from the scrutinising gaze of Her Majesty’s Revenue and Customs, an amiable clandestinity in the lap of nature.
Exploring Prehistoric Britain: A Journey Through Time
My blog delves into the fascinating mysteries of prehistoric Britain, challenging conventional narratives and offering fresh perspectives grounded in cutting-edge research, particularly LiDAR technology. I invite you to explore some key areas of my research. For example, the Wansdyke, often cited as a defensive structure, is re-examined in light of new evidence. I’ve presented my findings in my blog post Wansdyke: A British Frontier Wall – ‘Debunked’, and a Wansdyke LiDAR Flyover video further visualises my conclusions.
My work also often challenges established archaeological dogma. I argue that many sites, such as Hambledon Hill, commonly identified as Iron Age hillforts, are not what they seem. My posts Lidar Investigation Hambledon Hill – NOT an ‘Iron Age Fort’ and Unmasking the “Iron Age Hillfort” Myth explore these ideas in detail and offer an alternative view. Similarly, sites like Cissbury Ring and White Sheet Camp receive re-evaluations based on LiDAR analysis in my posts “Lidar Investigation Cissbury Ring through time”and “Lidar Investigation White Sheet Camp,“ revealing fascinating insights into their true purpose. I have also examined South Cadbury Castle, often linked to the mythical Camelot56.
My research also extends to ancient water management, including the role of canals and other linear earthworks. I have discussed the true origins of Car Dyke in multiple posts, including Car Dyke – ABC News Podcast and Lidar Investigation Car Dyke – North Section, which suggest a Mesolithic origin 2357. I also explore the misidentification of Roman aqueducts, as seen in my posts on the Great Chesters (Roman) Aqueduct. My research has also been greatly informed by my post-glacial flooding hypothesis, which has helped explain landscape transformations over time. I have discussed this hypothesis in several posts, including AI now supports my Post-Glacial Flooding Hypothesis and Exploring Britain’s Flooded Past: A Personal Journey
For those interested in British Prehistory, visit www.prehistoric-britain.co.uk, a comprehensive resource featuring an extensive collection of archaeology articles, modern LiDAR investigations, and groundbreaking research. The site also includes insights and excerpts from the acclaimed Robert John Langdon Trilogy, a series of books that explore Britain during the Prehistoric period. Titles in the trilogy include The Stonehenge Enigma, Dawn of the Lost Civilisation, and The Post-Glacial Flooding Hypothesis, which offer compelling evidence of ancient landscapes shaped by post-glacial flooding.
To further explore these topics, Robert John Langdon has developed a dedicated YouTube channel featuring over 100 video documentaries and investigations that complement the trilogy. Notable discoveries and studies showcased on the channel include 13 Things that Don’t Make Sense in History and the revelation of Silbury Avenue – The Lost Stone Avenue, a rediscovered prehistoric feature at Avebury, Wiltshire.
In addition to his main works, Langdon has released a series of shorter, accessible publications, ideal for readers delving into specific topics. These include:
For active discussions and updates on the trilogy’s findings and recent LiDAR investigations, join our vibrant community on Facebook. Engage with like-minded enthusiasts by leaving a message or contributing to debates in our Facebook Group.
Whether through the books, the website, or interactive videos, we aim to provide a deeper understanding of Britain’s fascinating prehistoric past. We encourage you to explore these resources and uncover the mysteries of ancient landscapes through the lens of modern archaeology.
For more information, including chapter extracts and related publications, visit the Robert John Langdon Author Page. Dive into works such as The Stonehenge Enigma or Dawn of the Lost Civilisation, and explore cutting-edge theories that challenge traditional historical narratives.
In a recent instalment of Digging for Britain, Alice Roberts stirred the archaeological debate by asserting that the Dorset Chalk Giant at Cerne Abbas had Saxon origins rather than prehistoric roots. This added a layer of intrigue, especially from a landscape archaeology perspective. At first glance, the giant’s features appear to echo a much earlier connection, reminiscent of other chalk figures found elsewhere in Britain, where their placement within the landscape suggests a deeper, functional context.
Curiosity led to a closer look at the methods used to date this iconic figure, and the findings raise several important questions. While the programme presents a clear and confident conclusion, a deeper inspection reveals fundamental issues and omissions that call into question its reliability. This is not just about one site but about broader methodological problems in archaeology, particularly the uncritical acceptance of dating approaches that underpin many historical assumptions.
Small trenches for dating evidence
The primary technique involved excavating four small trenches and penetrating approximately 1 m into the topsoil to extract samples. The underlying assumption is that the surface beneath the chalk line represents the original ground level and therefore provides the latest possible date for the figure’s creation. While the theory itself is not unreasonable, the reliance on just four sampling points raises serious concerns about the representativeness of the results.
To fully support such a method, variations across the entire area beneath the figure would need to be taken into account. Limited sampling introduces the risk of missing key variations in the soil and sediment, which could significantly alter the dating outcome. Scientific investigation depends on comprehensive data, and without it, conclusions remain open to question.
Snail used to date the chalk figuare
In addition, the programme does not fully explore alternative interpretations or the potential impact of environmental processes on the site. This becomes particularly important when considering evidence from other studies, in which larger datasets have shown a wide range of dates from similar contexts. In one such case, forty-two samples produced dates ranging from the ninth millennium BCE through to the historic period, yet only a subset was used to support the final interpretation. This raises an obvious question about the selection and exclusion of data.
The reliance on a very small number of samples for OSL dating introduces a substantial margin of uncertainty. Across a large area such as this, variation is expected. With such limited data, the resulting data range cannot be considered definitive. The methodology, including how samples are collected and interpreted, does not meet the level of precision expected in modern scientific analysis.
There is also a fundamental geological factor that appears to have been overlooked. The site sits on a steep slope, where soil creep is an ongoing process. Even at a conservative rate, soil can move approximately one metre over a thousand years. This means that materials such as snails and sediments beneath the figure are not necessarily in their original position. Over long periods, they can be displaced downslope, disconnecting them from the original context to which they were dated.
The physical construction of the figure itself also raises questions. The current form sits within topsoil rather than being cut directly into the underlying chalk bedrock. From a practical perspective, a prehistoric construction would be more logically cut into solid chalk to ensure durability and reduce maintenance needs. The fact that the figure requires ongoing upkeep suggests a different history, potentially involving phases of covering and reworking.
Historical accounts suggest that subsequent activity may have altered or preserved the figure, raising the possibility that what is visible today is not the original construction. This opens the question of whether an earlier figure existed beneath the current one, potentially modified or replaced at a later date.
The landscape context adds further complexity. The figure is positioned at the edge of a range of hills rather than at its highest point, and its full form is clearly visible only from elevated viewpoints. This challenges the idea of it functioning as a simple ground-level marker and instead suggests that its placement may relate to a broader landscape system that is no longer immediately visible.
When all of these factors are considered together, the conclusion presented in the programme appears far less certain than initially suggested. The evidence does not point to a simple, single-phase construction, but rather to a more complex history influenced by geological processes, environmental change, and possible later modification.
Archaeological interpretation must remain grounded in robust, testable methods. When conclusions rely on limited data, untested assumptions, or incomplete consideration of environmental factors, they risk presenting certainty where uncertainty remains.
The current Figuare sits on top of the soil with broken chalk that needs constant maintenance
The Dorset Chalk Giant is not a straightforward case. It is a reminder that understanding the past requires not just data, but careful evaluation of how that data is gathered, interpreted, and applied.
The next stage of analysis will examine the wider landscape using LiDAR data, with the aim of reconstructing how this site functioned in a prehistoric environment and what it may originally have represented.
The Giant is to the far right of the Hill Range and near the bottom – why not at the top of the middle if it’s a marker?
Part 2
Now, in this second part, our focus shifts to the professionalism of archaeologists involved in such endeavours and, by extension, the broader state of the archaeological profession in the 21st century. A critical lens is turned towards the National Trust’s excavation efforts, particularly the four trenches dedicated to OSL dating. Despite the extensive timeframe of over two years for this undertaking, the conspicuous absence of an official report raises concerns about transparency and the ability of other knowledgeable individuals to conduct scrutiny. This delay in producing and sharing findings with the wider community calls into question the efficiency and accessibility of archaeological information.
The quality of documentation further comes into question, as hand-drawn cross-sections, seemingly rushed and lacking the meticulous detail expected in rigorous scientific practices, were presented. This not only reveals an apparent ‘back of an envelope’ approach but also underscores a profound oversight by the experts. Despite having two years for scrutiny and examination, critical questions were left unexplored, a shortcoming magnified by the collaboration with the BBC for the televised program.
Digging for Britain Debunked – Cerne Abbas
Cerne Abbas
The absence of a comprehensive and timely report, coupled with the apparent lack of attention to detail in documentation, casts doubt on the thoroughness and professionalism of the archaeological efforts surrounding Cerne Abbas. The urgency to present findings to the media and create a documentary may have compromised the meticulousness required in archaeological endeavours.
This prompts a broader reflection on the state of the archaeological profession itself. The slow pace of report publication, potential gaps in expertise, and a seeming reluctance to subject findings to rigorous scrutiny raise concerns about the discipline’s agility and accountability in contemporary times.
The deficiencies in the excavation process around Cerne Abbas become more apparent when we scrutinise the placement of the trenches and the sampling locations. The hand-drawn illustrations (which I consider ‘outdated’ in an era of affordable, widely available 3D high-definition cameras) indicate that samples were taken from the topsoil just above the chalk bedrock. However, a photograph reveals a more accurate location at the bottom of the topsoil, near the chalk bedrock, leading to the conclusion that it is Saxon.
Poor Conclusions
A critical oversight emerges when we consider the implications of the Saxon date. If accurate, the absence of topsoil dating back thousands of years raises intriguing questions. Three plausible scenarios are explored: the deliberate removal of soil before the construction of Cerne Abbas, the initial absence of soil, or inaccuracies in OSL dating.
Option one, soil removal, implies an intention to obliterate what was originally present, raising logistical questions about the necessity for such an extensive process compared to the simplicity of laying new lines on existing chalk.
Option two speculates on the absence of soil due to something atop the bedrock, a theory we will delve into further.
Option three questions the accuracy of OSL dates, which, if proven, could cast doubt on the entire OSL science.
Option two gains credence when exploring the Post-Glacial Hypothesis, which is grounded in the notion of elevated sea levels in prehistoric times. LiDAR imagery of the site reveals a landscape shaped by Mesolithic waters, with identified natural harbours and Neolithic camps indicating the higher historical river levels. Archaeological findings, including tools and earthworks, support the hypothesis that the river running parallel to the figure was significantly higher during the Neolithic period.
Mesolithic Coastline – Digging for Britain Debunked – Cerne Abbas
Prehistoric Landscape
This scenario accounts for approximately 7,000 years with no topsoil in the figure. Examining the bedrock reveals signs of extensive water weathering, consistent with chalk erosion over thousands of years. The excavation report and photographs reveal broken chalk at the base of the topsoil, indicating water-induced erosion and redeposition. The darkened appearance, a result of drying after being broken and re-laid on top, mirrors the common impact of water on solid chalk.
Digging for Britain Debunked – Cerne Abbas
Further evidence points to Post-Glacial Flooding and a Neolithic origin of the figure, which strategically marks the entrance to the harbour. LiDAR maps suggest a man balancing a load on his shoulders or head, potentially representing a trading centre surrounded by quarries and mining pits.
Lidar showing the deep chalk cuttings – Digging for Britain Debunked – Cerne AbbasOriginal Cerne Abbas figure according to AI – Digging for Britain Debunked – Cerne Abbas
The intricacies of Cerne Abbas, when viewed through the lens of geological processes and archaeological evidence, unfold a narrative of ancient landscapes shaped by water, a figure emerging from millennia of erosion, and a Neolithic trading hub leaving its mark on the chalky canvas of history.
Long Man of Wilmington
NB. The findings at The Long Man of Wilmington by Prof. Martin Bell show very similar findings and geology as Cerne Abbas –
“Our method was to machine cut a trench at the base of the slope to look at the sediment sequence, then carefully hand excavate an adjoining strip, recording in three dimensions the positions of all artefacts, no matter how modern, in order to date each layer.
At the base of our trench, there were chalk meltwater muds from a time of rapid physical weathering at the end of the last Ice Age. Above these were bowl-shaped features, perhaps tree-throw pits, because they contained land snails from woodland habitats, indicating that this part of the slope had been wooded earlier in the Postglacial. They also contained some flint flakes, so they could be archaeological features.
Over this was a buried soil. Ed Rhodes, formerly of the Research Laboratory for Archaeology at Oxford, now of the Australian National University, has used OSL to date this soil to the mid-2nd millennium BC. The snails show that by this time, the landscape was open. Later in the Bronze Age, the soil was buried by more soil derived from cultivation at the base of the slope. Snails show that the escarpment above was grassland. Many sites on the South Downs show evidence for quite extensive Bronze Age soil erosion. Bronze Age and Neolithic pottery and flints from the basal soil and the colluvium indicate that a settlement was nearby.”
They called the broken chalk we saw in these excavations ‘chalk meltwater muds’, and he is correct, but this kind of deposit can only be produced by thousands of years of water erosion, not a couple of hundred, and his OSL dates confirm this, as just above this level is an OSL date of 2,000 BCE. We have 8,000 years of topsoil missing as the site, like Carne Abbass, was covered with river water, creating another natural harbour – and would you believe it – it also has a Neolithic.
PODCAST
Author’s Biography
Robert John Langdon, a polymathic luminary, emerges as a writer, historian, and eminent specialist in LiDAR Landscape Archaeology.
His intellectual voyage has been interwoven with stints as an astute scrutineer in government and grand corporate bastions, a tapestry spanning British Telecommunications, Cable and Wireless, British Gas, and the esteemed University of London.
A decade hence, Robert’s transition into retirement unfurled a chapter of insatiable curiosity. This phase saw him immerse himself in Politics, Archaeology, Philosophy, and the enigmatic realm of Quantum Mechanics. His academic odyssey traversed the venerable corridors of knowledge hubs such as the Museum of London, University College London, Birkbeck College, The City Literature Institute, and Chichester University.
In the symphony of his life, Robert is a custodian of three progeny and a pair of cherished grandchildren. His sanctuary lies ensconced in the embrace of West Wales, where he inhabits an isolated cottage, its windows framing a vista of the boundless sea – a retreat from the scrutinising gaze of Her Majesty’s Revenue and Customs, an amiable clandestinity in the lap of nature.
Exploring Prehistoric Britain: A Journey Through Time
My blog delves into the fascinating mysteries of prehistoric Britain, challenging conventional narratives and offering fresh perspectives grounded in cutting-edge research, particularly LiDAR technology. I invite you to explore some key areas of my research. For example, the Wansdyke, often cited as a defensive structure, is re-examined in light of new evidence. I’ve presented my findings in my blog post Wansdyke: A British Frontier Wall – ‘Debunked’, and a Wansdyke LiDAR Flyover video further visualises my conclusions.
My work also often challenges established archaeological dogma. I argue that many sites, such as Hambledon Hill, commonly identified as Iron Age hillforts, are not what they seem. My posts Lidar Investigation Hambledon Hill – NOT an ‘Iron Age Fort’ and Unmasking the “Iron Age Hillfort” Myth explore these ideas in detail and offer an alternative view. Similarly, sites like Cissbury Ring and White Sheet Camp receive re-evaluations based on LiDAR analysis in my posts “Lidar Investigation Cissbury Ring through time”and “Lidar Investigation White Sheet Camp,“ revealing fascinating insights into their true purpose. I have also examined South Cadbury Castle, often linked to the mythical Camelot56.
My research also extends to ancient water management, including the role of canals and other linear earthworks. I have discussed the true origins of Car Dyke in multiple posts, including Car Dyke – ABC News Podcast and Lidar Investigation Car Dyke – North Section, which suggest a Mesolithic origin 2357. I also explore the misidentification of Roman aqueducts, as seen in my posts on the Great Chesters (Roman) Aqueduct. My research has also been greatly informed by my post-glacial flooding hypothesis, which has helped explain landscape transformations over time. I have discussed this hypothesis in several posts, including AI now supports my Post-Glacial Flooding Hypothesis and Exploring Britain’s Flooded Past: A Personal Journey
For those interested in British Prehistory, visit www.prehistoric-britain.co.uk, a comprehensive resource featuring an extensive collection of archaeology articles, modern LiDAR investigations, and groundbreaking research. The site also includes insights and excerpts from the acclaimed Robert John Langdon Trilogy, a series of books that explore Britain during the Prehistoric period. Titles in the trilogy include The Stonehenge Enigma, Dawn of the Lost Civilisation, and The Post-Glacial Flooding Hypothesis, which offer compelling evidence of ancient landscapes shaped by post-glacial flooding.
To further explore these topics, Robert John Langdon has developed a dedicated YouTube channel featuring over 100 video documentaries and investigations that complement the trilogy. Notable discoveries and studies showcased on the channel include 13 Things that Don’t Make Sense in History and the revelation of Silbury Avenue – The Lost Stone Avenue, a rediscovered prehistoric feature at Avebury, Wiltshire.
In addition to his main works, Langdon has released a series of shorter, accessible publications, ideal for readers delving into specific topics. These include:
For active discussions and updates on the trilogy’s findings and recent LiDAR investigations, join our vibrant community on Facebook. Engage with like-minded enthusiasts by leaving a message or contributing to debates in our Facebook Group.
Whether through the books, the website, or interactive videos, we aim to provide a deeper understanding of Britain’s fascinating prehistoric past. We encourage you to explore these resources and uncover the mysteries of ancient landscapes through the lens of modern archaeology.
For more information, including chapter extracts and related publications, visit the Robert John Langdon Author Page. Dive into works such as The Stonehenge Enigma or Dawn of the Lost Civilisation, and explore cutting-edge theories that challenge traditional historical narratives.
The Bluestone quarry sites give us compelling evidence of the Mesolithic construction dates of Stonehenge (The Bluestone Enigma)
The papers published by researchers from the University of London, Southampton, and Manchester, including Mike Parker-Pearson and his team, regarding the discovery of the quarries at Craig Rhos-y-Felin and the bluestone megaliths at Carn Goedog have been a significant contribution to our understanding of Stonehenge’s origins. This research brought to light the fascinating theory that Stonehenge was originally built in Wales and later transported to Salisbury Plain around 500 years later.
This groundbreaking discovery not only captured the attention of archaeologists worldwide but also challenged previous assumptions about the methods and motivations behind Stonehenge’s construction. The idea that these bluestones were quarried and shaped in Wales before making their journey to Salisbury Plain adds a new dimension to our understanding of prehistoric peoples’ capabilities and social organisation.
This revelation suggests a remarkable level of dedication and coordination among ancient communities. The logistical feat of transporting these massive stones over such a distance, and the decision to do so centuries after their initial quarrying, hints at the profound significance these stones—and the monument they came to form—held for the people of the time.
As someone deeply interested in the mysteries of ancient civilisations, I find the implications of this research thrilling. It deepens our appreciation for the ingenuity and spiritual dedication of our ancestors and opens up new avenues for exploring the cultural and religious ties that connected different regions of prehistoric Britain.
Prescilli Mountains in Wales – The Bluestone Enigma
Craig Rhos-Y-Felin
The publication of the report “Craig Rhos-y-Felin: a Welsh bluestone megalith quarry for Stonehenge” in the December 2016 edition of Antiquity Magazine unveiled intriguing findings about the origins of the bluestones used in Stonehenge. This study, which identified a 4m long monolith at Craig Rhos-y-Felin as microscopically identical to the bluestones at Stonehenge, has sparked significant debate and speculation within the archaeological community and beyond.
Despite the excitement generated by these findings, the report’s focus on two radiocarbon dates that align with the authors’ hypothesis on Stonehenge’s construction date has raised questions about the completeness of the narrative presented to the public. The discrepancy between these dates and the hoped-for evidence led to the speculative suggestion that Stonehenge was originally constructed in Wales and later relocated to Salisbury Plain. This narrative, while intriguing, illustrates the complexities and challenges of interpreting archaeological data, as well as the temptation to fit new evidence into pre-existing hypotheses.
However, a more detailed analysis of the report reveals a wealth of Mesolithic carbon dates obtained from human-made hearths, suggesting a much earlier period of human activity at the site than the two Neolithic dates highlighted. These Mesolithic dates, which significantly predate the construction of Stonehenge as currently understood, were largely overlooked in the public dissemination of the research findings.
Quarry Site at Craig Rhos-Y-Felin – The Bluestone Enigma
This oversight raises essential questions about the narrative surrounding Stonehenge’s origins and the methodologies used in archaeological dating. The presence of Mesolithic hearths at Craig Rhos-y-Felin suggests that the site was of importance to human communities thousands of years before the Neolithic period. This evidence challenges the conventional timeline of Stonehenge’s construction and suggests a longer, more complex history of human interaction with the landscape and the bluestones.
Furthermore, the report inadvertently highlights the ongoing debate within archaeology about how best to interpret and present findings to the public. The focus on headline-grabbing narratives, such as the relocation of Stonehenge from Wales, can sometimes overshadow equally significant but less sensational discoveries, such as the evidence of Mesolithic activity at the quarry site.
Mesolithic Post Holes at the Old Car Park at Stonehenge – The Bluestone Enigma
The excavation in 1966 and subsequent discoveries surrounding Stonehenge offer a fascinating and somewhat contentious glimpse into the complex task of accurately dating ancient sites. The initial observations by Lance and Faith Vatcher highlighted the Neolithic character of three holes excavated near Stonehenge, with no datable pottery found. Yet, the characteristics of the holes suggested a Neolithic origin. This assumption was later questioned when a PhD student discovered that the charcoal deposits from these holes, surprisingly composed mostly of pine, could not be Neolithic as initially thought. Pine was believed to be ‘extinct’ in the area by the time of Stonehenge’s supposed construction, according to pollen analysis.
This revelation was startling, especially to the officials of the Historic Buildings and Monuments Commission, later known as English Heritage. The carbon dating of these pine samples placed them squarely in the Mesolithic era, specifically between 8860 to 6590 BCE, challenging the previously accepted timeline for Stonehenge’s construction. Furthermore, the report mentions pine samples from Woodhenge, which, if also Mesolithic, would radically alter our understanding of that site’s age.
Stonehenge Car Park
Mesolithic Post Holes in Old Car Park – The Bluehenge Enigma
Instead of seizing this opportunity to delve deeper into these findings, a narrative was constructed that dismissed these posts as totem poles from wandering hunter-gatherers, unrelated to Stonehenge. This decision to sideline potentially groundbreaking evidence highlights a reluctance within some parts of the archaeological community to reconsider established narratives, even in the face of new evidence.
The discovery in 1988-89 by Wessex Archaeology of another Mesolithic post hole, along with a piece of rhyolite dated to 7737 – 7454 BCE, further complicates the timeline for Stonehenge and the surrounding area. This finding should have prompted a reevaluation of the site’s dating. However, attempts to fit this new evidence into the existing narrative of Stonehenge’s construction timeline illustrate the challenges and controversies inherent in archaeological interpretation.
These instances underscore the necessity for openness, curiosity, and a willingness to revise our understanding of history in light of new evidence. They remind us that the story of human history is complex and continually evolving, and our interpretations must adapt as we uncover more about our past.
Stone Hole WA9580 shows a piece of Bluestone 5,000 years before they arrived. – The Bluestone Enigma
Discoveries at Stonehenge, including charcoal (OxA-18655) found in the Hole socket of Stone 10, dating to 7330 – 7060 BCE, match the dates of the Mesolithic post holes, with significant implications for our understanding of the site’s history. This evidence, dating to the Mesolithic post holes, suggests that the activities at Stonehenge and its surroundings span much earlier than previously believed. However, the apparent suppression of this news from widespread media coverage raises questions about the narrative presented to the public and in educational materials.
The excavation at Blick Mead, less than a mile from Stonehenge, by the Open University, which uncovered evidence of Mesolithic-period habitation and feasting, further challenges the entrenched views held by some about prehistoric life around Stonehenge. These findings suggest a continuous and significant presence of people in this area during the Mesolithic period, contradicting the simplistic ‘totem pole’ myth still perpetuated in some narratives by English Heritage (EH) through their exhibitions and guidebooks.
Moreover, the recent transformation of the Stonehenge site, including the closure of the B-road past the stones and the relocation of the visitors’ car park to a new, multi-million-pound visitor centre, represents a significant shift in how the site is accessed and experienced by the public. The removal of the old tarmac and the reversion of the land to grass aim to restore a more authentic prehistoric ambience to Stonehenge. This effort to make the site appear more as it did at the time of its construction is commendable, but also highlights the ongoing tension between modern interpretations of the site and the emerging evidence of its ancient past.
These developments at Stonehenge and Blick Mead exemplify the dynamic nature of archaeological research and the complexities involved in interpreting and presenting the past. As new evidence continues to emerge, the narrative of prehistoric Britain needs to evolve accordingly, ensuring a more accurate and nuanced understanding of these ancient landscapes and their significance to human history.
In 2008, Stone 10 – Tim Darvill and Geoffrey Wainwright found charcoal dating back to 7330 to 7060 – The Bluestone Enigma
You would indeed think that removing the tarmac from the old visitor car park at Stonehenge, especially given the significant previous findings beneath it, would prompt a comprehensive excavation to unearth more evidence of the site’s Mesolithic history. Such an excavation could potentially transform our understanding of Stonehenge and its origins, providing invaluable insights into its early history and the people who frequented the site during the Mesolithic period.
Tim Daw’s role as a warden at Stonehenge, combined with his proactive approach to documenting changes and features of the site through photography, exemplifies the kind of engaged observation that can lead to important discoveries. His finding of patch marks by the central upright stones, indicating the possible positions of missing stones from the Inner Circle, is a testament to the contributions individuals can make to the ongoing investigation of Stonehenge. Daw’s work underscores the value of continuous and attentive observation of archaeological sites, even by those not formally conducting research.
Tim Daw’s evidence of yet another Pit in the Old Car Park not investigated! – The Bluehenge Enigma
The discovery of such features and the potential for further findings beneath the former car park area highlights the need for a thorough and systematic archaeological examination whenever opportunities arise. These efforts not only enrich our knowledge of Stonehenge’s past but also contribute to the broader understanding of prehistoric human activity in the region. As we continue to peel back the layers of Stonehenge’s history, each finding adds a piece to the puzzle of this enigmatic monument’s story, emphasising the importance of preserving and exploring our archaeological heritage.
The Post Holes would have been on the shoreline of the River Avon in Mesolithic period – The Bluestone Enigma
Tim Daw’s experiences and observations as a warden at Stonehenge, particularly his discovery of additional post holes beneath the old visitor’s car park, highlight the ongoing potential for new findings that can challenge and enrich our understanding of Stonehenge’s history. Despite being warned against publishing his conclusions due to unauthorised blog activity, Daw chose to resign and continue his work, revealing, through ‘unofficial’ pictures, the existence of even more post holes under the car park, aligned with those discovered in 1966.
Bluestone Quarries
These findings, including the newly discovered post hole that aligns with the four others from 1966, support the hypothesis that these structures are situated on what was once the shoreline of the River Avon around 8000 BCE. This suggests that during the Mesolithic period, the stones quarried in Wales could have been transported by boat directly to Stonehenge, navigating along enlarged rivers rather than taking the longer sea route proposed by some archaeologists.
Further complicating the narrative are my analyses of the bluestone structures from other Preseli sites like Carn Goedog and Craig Talfynyydd, which are connected by streams and rivers to the River Nevern. Unfortunately, archaeologists have interpreted this network of waterways primarily through a religious lens rather than considering its practical functionality as a transportation network.
The persistence of the ‘ox-cart’ route theory, which posits a land route along the modern A40, overlooks the logistical challenges posed by the period’s dense woods, swamps, and forests. Such conditions would have made the construction and use of a road system highly impractical, if not impossible.
My critique extends to the inconsistencies and logical inaccuracies in the archaeological narrative, particularly regarding the site layout and geological evidence at Craig Rhos-y-Felin. The assumption that floodwaters in the area were solely the result of ice melt, quickly draining into the sea post-Ice Age, ignores the broader implications of such flooding for the landscape and its inhabitants.
Craig Rhos-Y-Felin is on the edge of a gigantic river of the past – The Bluestone Enigma.
We confirm in the report that an old river ran around this quarry as long ago as 5620 – 5460 BCE and possibly as late as 1030 – 910 BCE.
“Most of the site was then covered by a layer of yellow colluvium (035), dated by oak charcoal to 1030–910 cal BC (combine SUERC-46199; 2799±30 BP and SUERC-46203; 2841±28 BP). This deposit is contemporary with the uppermost fill of a palaeochannel of the Brynberian stream that flowed past the northern tip of the outcrop. Charcoal of Corylus and Tilia from the basal fill of this palaeochannel dates to 5800–5640 cal BC (OxA- 32021; 6833±40 BP) and 5620–5460 cal BC (OxA-32022; 6543±37 BP), both at 95.4% probability.”
The only RED hearths in the site are Mesolithic so they must be quarrying at that time – The Bluestone Enigma
The report’s insights suggest that during the Mesolithic Period, an enlarged stream that fed into the River Nevern reached the quarry outcrop rocks. Notably, it was positioned just a few meters away, even as late as 1000 BCE. This geographical configuration suggests that boats were likely the primary means of transporting the large, newly quarried stones to their final destination at Stonehenge, mirroring stone transport methods in other ancient civilisations, such as Egypt.
The site layout at the quarry provides crucial clues about the timing of the stone quarrying. Notably, a single monolith is positioned near the river on the site’s east side, ready for transportation. Nearby, to the south of this monolith, are human-made hearths, precisely where one would expect them to be. However, the challenge arises in dating these hearths as Mesolithic, with three distinct periods identified: 8550 – 8330 BCE; 8220 – 7790 BCE; and 7490 – 7190 BCE. Despite this, the report asserts that there is no evidence of Mesolithic quarrying or working of rhyolite at this site.
This claim overlooks the practical use of tools across different periods. If Mesolithic and Neolithic communities utilised similar tools, distinguishing tool marks from these different periods might be more challenging than the report suggests. Moreover, the presence of these communities at the quarry for over a millennium raises questions about their activities if not quarrying the stones.
The connection between the quarry site and Stonehenge is strengthened by over twenty Carbon-14 dates that align with my hypothesis, in contrast to the mere two samples currently highlighted by experts, which are dated 300 – 500 years older than existing estimates. By analysing these overlapping dates against the latest carbon-dating curve (IntCal20), we can refine the construction date of Stonehenge’s Phase I (the placement of bluestones in the Aubrey holes). By calculating the mean of these probable dates, we aim to obtain a more accurate estimate of when this monumental task was undertaken, potentially rewriting the timeline of one of the world’s most enigmatic prehistoric monuments.
Carbon Dates comparison – note that the sites are linked to different mooring posts, indicating activity dates
Table 1– Matching Carbon Dates
The calculations indicate that work at the quarry began around 8300 BCE, with its main phase of activity around 8000 BCE, and continued for at least a millennium, challenging the conventional narrative about Stonehenge and its Bluestones. This timeline suggests a far more ancient and enduring connection between the quarry site and Stonehenge than previously acknowledged.
Carn Goedog
Initially, Carn Menyn in the Preseli Hills was believed to be the source of Stonehenge’s spotted dolerite, but later analysis pinpointed Carn Goedog as a closer chemical match. Recent geochemical studies have divided the Stonehenge spotted dolerite into two main groups, with one group closely matching the Carn Goedog outcrop. The origin of the second group remains uncertain, potentially deriving from Carn Goedog or nearby outcrops.
Further geological investigations at Stonehenge have identified additional sources for its bluestones. Unspotted dolerite matches with outcrops at Cerrigmarchogion and Craig Talfynydd on the Preseli ridge. Another bluestone variety, “rhyolite with fabric,” traces back to Craig Rhos-y-Felin, while a source of Lower Palaeozoic sandstone has been identified north of the Preseli hills. The origin of volcanic tuffs found at Stonehenge also likely lies in the Preseli area.
Preseli Mountains and Quarry Sites are ALL by rivers – The Bluestone Enigma
Surface indications of post-medieval Quarrying, particularly on its south side, have evidenced Carn Goedog’s accessibility. This historical quarrying, distinguishable by cylindrical drill holes on some quarried blocks at the outcrop’s base, was performed using the ‘plug-and-feather’ technique with metal wedges. The discovery of a worn trade token beneath one of these blocks helps date this activity to around 1800.
In 2014, test trenching along the southern edge of Carn Goedog revealed layers of human activity spanning various periods, from the recent centuries in trench 3 to deeper prehistorical layers in trench 2. Trench 1, strategically positioned at the outcrop’s base and just beyond the eastern limit of the early modern quarry debris, was particularly significant. It was seen as offering a unique opportunity to uncover evidence of prehistoric quarrying that hadn’t been disturbed by later activities.
This layered historical context at Carn Goedog is crucial for understanding the complex human interactions with the site over millennia. The evidence for prehistoric quarrying, undisturbed by later post-medieval activity, provides invaluable insights into the methods and technologies used by ancient peoples to extract and transport the stones that contributed to the construction of monumental structures like Stonehenge.
Plan of Excavation 106 is the hearth – The Bluestone Enigma.
Trench 1 was enlarged in 2015 and 2016 to reveal features that may relate to prehistoric quarrying activity. At the southern foot of the outcrop, excavation revealed an artificial platform of flat slabs—many of them split—laid (with the split faces upwards) in a tongue-shaped formation 10m north–south by at least 8m east–west (Figure 6).
Those slabs lying against the face of the outcrop had been pressed into the underlying sediments, presumably by the weight of pillars lowered onto the platform. The platform terminates from the outcrop with a vertical drop of 0.9m to the ground surface beyond. This platform is stratigraphically earlier than a series of deposits that included early modern quarrying debris and hearths of the Roman and medieval periods. One hearth (Figure 6: 105) set within a gap in the platform where a slab had been removed produced charcoal dating to 7190–6840 cal BC (8091±38 BP) and 2890–2630 cal BC (4164±30 BP) (Table 1).
The findings across the quarry sites, including Carn Goedog and Craig Rhos-y-Felin, point to a nuanced understanding of how the bluestones were utilised and replenished at Stonehenge. The hearths discovered at these sites, particularly those dating to the Mesolithic and Neolithic periods, suggest ongoing human activity and potentially organised efforts to quarry and transport bluestones over extended periods. This insight challenges the conventional explanation that the transportation of Bluestones to Stonehenge was a singular event.
The Stonehenge Layer
The evidence of modern quarrying at both the northern and southern ends of these sites and the dates from central hearths align with observations made at Craig Rhos-y-felin. Our research, as outlined in published books, supports the theory that ancestors chipped bluestones at Stonehenge for healing, utilising the water in the ditch to bathe their sickness away, as evidenced by the ‘Stonehenge Layer’ discovered by Dervill and Wainwright in 2008. This practice would naturally lead to the depletion of bluestones over time, necessitating periodic replenishment from the quarries.
The conventional narrative, which posits that the bluestones were transported to Stonehenge in a one-off event, needs to account for the scientific data emerging from these quarry sites and the Stonehenge site. The evidence suggests a more complex interaction with these stones, involving repeated quarrying and transportation activities that likely spanned centuries. This ongoing relationship with the bluestones reflects a deeper functional connection to them, underscoring the importance of revisiting and revising our understanding of Stonehenge’s construction and the role of the bluestones within this prehistoric monument.
English Heritage’s significant investment in the Stonehenge Visitors Centre, including the creation of exhibitions that present established theories about the monument’s origins and functions, raises questions about the implications of discoveries that contradict these narratives. If foundational assumptions about Stonehenge are proven incorrect, it could have financial repercussions, particularly if the narrative presented to the public through expensive exhibitions becomes outdated or inaccurate. This situation underscores the complex relationship between archaeological research, public interpretation, and financial investments in heritage sites.
PodCast
Author’s Biography
Robert John Langdon, a polymathic luminary, emerges as a writer, historian, and eminent specialist in LiDAR Landscape Archaeology.
His intellectual voyage has been interwoven with stints as an astute scrutineer in government and grand corporate bastions, a tapestry spanning British Telecommunications, Cable and Wireless, British Gas, and the esteemed University of London.
A decade hence, Robert’s transition into retirement unfurled a chapter of insatiable curiosity. This phase saw him immerse himself in Politics, Archaeology, Philosophy, and the enigmatic realm of Quantum Mechanics. His academic odyssey traversed the venerable corridors of knowledge hubs such as the Museum of London, University College London, Birkbeck College, The City Literature Institute, and Chichester University.
In the symphony of his life, Robert is a custodian of three progeny and a pair of cherished grandchildren. His sanctuary lies ensconced in the embrace of West Wales, where he inhabits an isolated cottage, its windows framing a vista of the boundless sea – a retreat from the scrutinising gaze of Her Majesty’s Revenue and Customs, an amiable clandestinity in the lap of nature.
Exploring Prehistoric Britain: A Journey Through Time
My blog delves into the fascinating mysteries of prehistoric Britain, challenging conventional narratives and offering fresh perspectives grounded in cutting-edge research, particularly LiDAR technology. I invite you to explore some key areas of my research. For example, the Wansdyke, often cited as a defensive structure, is re-examined in light of new evidence. I’ve presented my findings in my blog post Wansdyke: A British Frontier Wall – ‘Debunked’, and a Wansdyke LiDAR Flyover video further visualises my conclusions.
My work also often challenges established archaeological dogma. I argue that many sites, such as Hambledon Hill, commonly identified as Iron Age hillforts, are not what they seem. My posts Lidar Investigation Hambledon Hill – NOT an ‘Iron Age Fort’ and Unmasking the “Iron Age Hillfort” Myth explore these ideas in detail and offer an alternative view. Similarly, sites like Cissbury Ring and White Sheet Camp receive re-evaluations based on LiDAR analysis in my posts “Lidar Investigation Cissbury Ring through time”and “Lidar Investigation White Sheet Camp,“ revealing fascinating insights into their true purpose. I have also examined South Cadbury Castle, often linked to the mythical Camelot56.
My research also extends to ancient water management, including the role of canals and other linear earthworks. I have discussed the true origins of Car Dyke in multiple posts, including Car Dyke – ABC News Podcast and Lidar Investigation Car Dyke – North Section, which suggest a Mesolithic origin 2357. I also explore the misidentification of Roman aqueducts, as seen in my posts on the Great Chesters (Roman) Aqueduct. My research has also been greatly informed by my post-glacial flooding hypothesis, which has helped explain landscape transformations over time. I have discussed this hypothesis in several posts, including AI now supports my Post-Glacial Flooding Hypothesis and Exploring Britain’s Flooded Past: A Personal Journey
For those interested in British Prehistory, visit www.prehistoric-britain.co.uk, a comprehensive resource featuring an extensive collection of archaeology articles, modern LiDAR investigations, and groundbreaking research. The site also includes insights and excerpts from the acclaimed Robert John Langdon Trilogy, a series of books that explore Britain during the Prehistoric period. Titles in the trilogy include The Stonehenge Enigma, Dawn of the Lost Civilisation, and The Post-Glacial Flooding Hypothesis, which offer compelling evidence of ancient landscapes shaped by post-glacial flooding.
To further explore these topics, Robert John Langdon has developed a dedicated YouTube channel featuring over 100 video documentaries and investigations that complement the trilogy. Notable discoveries and studies showcased on the channel include 13 Things that Don’t Make Sense in History and the revelation of Silbury Avenue – The Lost Stone Avenue, a rediscovered prehistoric feature at Avebury, Wiltshire.
In addition to his main works, Langdon has released a series of shorter, accessible publications, ideal for readers delving into specific topics. These include:
For active discussions and updates on the trilogy’s findings and recent LiDAR investigations, join our vibrant community on Facebook. Engage with like-minded enthusiasts by leaving a message or contributing to debates in our Facebook Group.
Whether through the books, the website, or interactive videos, we aim to provide a deeper understanding of Britain’s fascinating prehistoric past. We encourage you to explore these resources and uncover the mysteries of ancient landscapes through the lens of modern archaeology.
For more information, including chapter extracts and related publications, visit the Robert John Langdon Author Page. Dive into works such as The Stonehenge Enigma or Dawn of the Lost Civilisation, and explore cutting-edge theories that challenge traditional historical narratives.
For half a century, archaeology has leaned on a comforting narrative: agriculture was “invented” in the Middle East and then slowly marched across Europe, arriving in Britain and Ireland around 4000 BCE. This tidy model—neat arrows on a map, farmers trudging steadily northwest—has been taught as fact. Yet it was always based on thin evidence: mid-point Bayesian models, pottery typologies, and assumptions rather than hard data. (The Great Farming Migration Hoax)
Today, however, we have something the 20th-century archaeologists did not: a dataset of 14,000 calibrated radiocarbon dates, drawn from Mesolithic and Neolithic contexts across the continent. When viewed spatially and temporally, the story they tell is radically different—and devastating for the orthodox “farmer diffusion” model.
The Traditional Model as taught in schools and Universities
What the Timelapse Reveals
Using the Google Earth KML time slider, we modelled activity from 8500 BCE to 2500 BCE. Binned into 500-year intervals, the pattern is unmistakable:
NW Europe lights up earliest and densest. From 8000 BCE onwards, Britain, Ireland, Brittany, and Scandinavia produce clusters of Mesolithic radiocarbon dates far richer than anything seen in the southeast “entry corridors.”
The southeast is sparse. If agriculture truly spread stepwise from Anatolia, we would expect dense early activity in Greece, the Balkans, and Italy, fading as it moves northwest. Instead, we see the reverse gradient.
Maritime corridors dominate. The densest concentrations occur on coasts, estuaries, and rivers—the very places where moorings, quarries, and early monuments are found. The pattern matches boat-based trade routes, not overland migrations.
In other words: the radiocarbon record aligns with an Atlantic seafaring civilisation, not a Middle Eastern agricultural wave.
The Dataset
The analysis is based on the Radon-B radiocarbon database published in Scientific Data by Hinz et al. (2022) Nature Scientific Data 9, 166. This open-access dataset compiles over 14,000 radiocarbon determinations from Mesolithic and Neolithic sites across Europe, standardised and georeferenced.
Dates were calibrated and then grouped into 500-year bins between 8500 BCE and 2500 BCE. Each record includes site coordinates, lab codes, uncalibrated and calibrated ranges, and contextual information. By feeding these into GIS and the Google Earth KML time slider, we can visualise when and where activity occurs across the continent.
This is the first time archaeologists can step back and watch the evidence unfold, year by year, without relying solely on pottery styles, typologies, or theoretical mid-points.
The Mathematical Split: NW vs SE
To test this more rigorously, we drew a 45° line across Europe (from 30° N, 0° E to 55° N, 30° E), dividing the continent into NW and SE halves. We then tallied radiocarbon dates per half in 500-year bins. The results were clear:
Even in the deep Mesolithic (8500–7500 BCE), NW Europe already dominates (~83%).
By the so-called “Neolithic Revolution” (5000–3500 BCE), NW counts reach over 90% of the dataset.
At no point do SE dates approach parity with NW.
If a farmer-wave marched from Anatolia into Europe, the ratio should invert. Instead, the numbers show the opposite: NW Europe was already a core zone of activity while the southeast lagged.
Heatmap Timeline
To make this visible, we produced 11 heatmaps, each covering a 500-year slice from 8500 BCE to 2500 BCE. Every dot is a dated site; brighter clusters mark intense activity. Beneath each frame are the counts of sites on the NW and SE sides of a 45° split line, with the NW percentage shown in bold.
8500–8000 BCE NW = 24, SE = 5 → 82.8% NW The very beginning: activity already concentrated in NW Europe.
8000–7500 BCE NW = 347, SE = 70 → 83.2% NW Clusters appear in Britain, Ireland, and Scandinavia. The SE remains dim.
7500–7000 BCE NW = 513, SE = 64 → 87.5% NW Doggerland and Atlantic coasts dominate. The inland “farmer corridor” shows little sign of life.
7000–6500 BCE NW = 1054, SE = 112 → 90.4% NW Monumental centres in Ireland and Brittany appear. Maritime connections intensify.
6500–6000 BCE NW = 2328, SE = 172 → 93.1% NW The NW explodes with dense occupation; the SE corridor barely registers.
6000–5500 BCE NW = 3098, SE = 272 → 91.9% NW By this point, the “Neolithic Revolution” should be sweeping from the SE. Instead, the reverse gradient persists.
5500–5000 BCE NW = 3705, SE = 291 → 92.7% NW Atlantic façade societies are thriving. Trade and monument construction spread along waterways.
5000–4500 BCE NW = 3060, SE = 207 → 93.7% NW Britain, Ireland, Brittany, Orkney—now the brightest hotspots in all of Europe.
4500–4000 BCE NW = 2450, SE = 198 → 92.5% NW Traditional textbooks mark this as the “arrival of farming.” The radiocarbon record shows NW societies were already long established.
4000–3500 BCE NW = 2100, SE = 180 → 92.1% NW Carrowmore, Knowth, and Orkney flourish, part of an Atlantic-wide monument network.
3500–3000 BCE NW = 1700, SE = 160 → 91.4% NW The NW remains dominant right through to the classic Neolithic horizon. The farmer-diffusion story collapses.
Across all bins, NW Europe consistently holds 85–94% of activity. The southeast never rises above 17%. If civilisation were spreading from Anatolia, the early density would be in the SE. Instead, the gradient is reversed.
Why the Orthodoxy Failed
Why didWhy did the overland diffusion model persist so long, despite cracks in the evidence? Several reasons stand out:
Dating limitations. Radiocarbon plateaus (e.g., around 8000 BCE and 2400 BCE) blur sequences, letting mid-points masquerade as precision.
Contamination choices. Charcoal and reused wood skewed some chronologies in favour of neat overland stories.
Narrative inertia. Training and peer-review reward conformity. Challenges get labelled “pseudoscience” until the data mountain is too big to ignore.
Textbook simplification. Arrow-diagrams of “farmer spread” became common sense rather than a hypothesis.
This is why anomalies—early Stonehenge, canals mis-labelled as Saxon, imported wheat at Bouldnor Cliff long before local farming—were sidelined, not integrated..
Case Study: The Diffusion Null Model (Math & Map)
To be academically fair, let’s model what the record should look like under the orthodox demic diffusion hypothesis, first formalised by Ammerman & Cavalli-Sforza (1971, Man 6: 674-688) and developed through the 1980s and 1990s. This model treats farming spread as a wave of advance, in which small founder groups migrate outward and grow logistically, leaving behind expanding farming frontiers.
1) Wave speed and arrival time
Ammerman & Cavalli-Sforza calculated a characteristic front speed of ~1 km/yr, later supported by archaeological synthesis (e.g. Pinhasi et al. 2005, PNAS 102: 15375-15380).
Distance Anatolia → southern Britain ≈ 3000 km.
At 1 km/yr, farmers would take ~3000 years to arrive. If Britain is farmed by 4000 BCE, then migration must begin in Anatolia by 7000 BCE.
2) Seeding Britain with ~5,000 farmers by 4000 BCE
Demographic models suggest that to establish farming, at least 5,000 individuals are needed as a founding population in Britain by 4000 BCE. With a modest growth rate (~1.3%/yr), ~100 settlers arriving by 4300 BCE could, in theory, grow to 5,000 by 4000 BCE.
But for ~100 to reach Britain after 3,000 km of staged settlement, the Anatolian stream must be much larger:
If half settle every 500 km, survivors = (0.5)^5 ≈ 3%. → Launch ~3,200.
If two-thirds settle every 500 km, survivors = (1/3)^5 ≈ 0.4%. → Launch ~27,000.
This implies thick settlement trails across the Balkans, Italy, and France—which should appear as dense SE radiocarbon clusters.
3) Expected radiocarbon gradient
The diffusion model predicts:
8500–7000 BCE: SE blazing, NW near-zero.
7000–5500 BCE: SE strong, central Europe rising, NW weak.
5500–4500 BCE: Central and western Europe dominant; NW still minor.
4500–3500 BCE: NW finally catches up, but only approaches parity with SE.
4) Expected NW vs SE percentages
Using the Ammerman–Cavalli-Sforza parameters applied to the actual dataset totals, the expected NW share per 500-year bin looks like this:
8500–8000 BCE: ~20% NW
8000–7500 BCE: ~20% NW
7500–7000 BCE: ~21% NW
7000–6500 BCE: ~25% NW
6500–6000 BCE: ~44% NW
6000–5500 BCE: ~43% NW
5500–5000 BCE: ~44% NW
5000–4500 BCE: ~43% NW
4500–4000 BCE: ~43% NW
4000–3500 BCE: ~43% NW
3500–3000 BCE: ~45% NW
5) Visualising the expected pattern
We’ve generated a set of 11 heatmaps using these diffusion assumptions. They show the SE blazing first, with the NW slowly catching up—but never dominating.
By contrast, the observed dataset (Hinz et al. 2022) shows the NW at 83–94% dominance across all bins.
This is a 180° inversion of the orthodox diffusion prediction.
Case Study: Einkorn Wheat at Bouldnor Cliff
In 2015, archaeologists made a discovery that should have rewritten European prehistory overnight. While diving off the Isle of Wight at a site known as Bouldnor Cliff, they recovered DNA from einkorn wheat in 8,000-year-old sediments (c. 6000 BCE). This was not cultivated locally — Britain did not “adopt farming” for another two millennia. Instead, it proves contact with regions where einkorn was already domesticated: the Mediterranean or Anatolia.
Bouldnor Cliff – Einkorn wheat
Mainstream archaeology tried to explain it away as “contamination” or “a one-off anomaly.” But when set against the radiocarbon dataset, the implications are clear:
Trade before farming. The people of Mesolithic Britain knew about cereals and imported them, long before they grew them.
Maritime networks. The only plausible route for einkorn to reach southern Britain in 6000 BCE is by sea — across the Bay of Biscay and along Atlantic seaways.
Complex societies. To organise long-distance cereal trade, societies must have had surplus production, exchange mechanisms, and seafaring technologies — all the hallmarks of civilisation.
The Bouldnor Cliff wheat fits perfectly into the pattern revealed by 14,000 radiocarbon dates: NW Europe was not passively waiting for farmers to arrive, but was already part of a maritime civilisation trading goods, ideas, and technologies thousands of years before the “Neolithic package” supposedly spread.
In other words: wheat didn’t arrive in Britain with farmers trudging overland. It arrived on boats.
Implications for Britain and Ireland
The dataset’s NW dominance is not just a statistical curiosity; it has direct consequences for how we understand the origins of Britain and Ireland’s monumental tradition. If the densest early activity lies here, then several long-standing anomalies suddenly fall into place.
1. Stonehenge Phase 1 (c. 8300 BCE) The ditch and Aubrey Holes, thousands of years older than the textbook “Neolithic arrival,” align perfectly with the early NW concentration of Mesolithic sites. Britain was not an empty backwater waiting for farmers—it was already home to complex societies capable of large-scale engineering. Stonehenge Phase 1, far from being a puzzle piece that does not fit, is revealed as part of a thriving Mesolithic tradition.
2. Canals and Dykes LiDAR mapping demonstrates that features like Car Dyke and Wansdyke were engineered waterways, not Saxon or Roman defensive ditches. Such monumental canal construction only makes sense in a society that lived on and by the water. The radiocarbon evidence shows that NW Europe had dense, long-lived communities precisely when such projects would have been possible. A floodplain civilisation required canals just as much as it required monuments.
3. Doggerland and the Raised Rivers The early NW concentration coincides with Doggerland and the great raised river systems left by post-glacial flooding. These landscapes offered fertile estuaries, abundant fisheries, and natural highways. Communities flourished here, moving by boat, trading goods, and building monuments at harbours and river mouths. The radiocarbon density proves that these were not isolated foragers but interconnected settlements.
4. The Atlantic Monument Network Sites such as Carrowmore in Ireland (~6500 BCE), Knowth (~6800 BCE), Orkney, and Brittany all sit within this NW heartland. Their shared placement on coasts and estuaries shows they were part of a maritime corridor. Far from being derivative of Middle Eastern farmers, these sites reflect an indigenous Atlantic tradition of boat-builders and stone-setters.
Why a Maritime Civilisation Must Be Acknowledged Without accepting a maritime framework, the evidence remains a jumble of “anomalies.” Why are monuments always near coasts? Why do dykes follow palaeochannels? Why does imported wheat appear at Bouldnor Cliff millennia before farming is adopted locally? Why do radiocarbon clusters appear in NW Europe long before Anatolian farmers supposedly arrived?
The only coherent answer is that NW Europe hosted a maritime civilisation—seafaring, trading, and monument-building—long before the plough reached its shores.
Why It Matters
Textbooks are obsolete. Bayesian mid-point models and diffusion myths cannot compete with 14,000 hard C14 datapoints.
Methodology must evolve. Hydrological calibration—aligning sites with post-glacial river levels—offers a more reliable chronology.
Archaeology must confront bias. As with Galileo or Wegener, resistance to paradigm shifts stems from professional inertia, not scientific rigour.
Conclusion
The evidence of 14,000 radiocarbon dates cannot be ignored:
NW Europe was a Mesolithic civilisation zone, not a backwater waiting for farmers.
Monumental construction, trade, and seafaring emerged along Atlantic waterways millennia before 4000 BCE.
The “stones didn’t walk.” They sailed.
History will not be rewritten by consensus but by evidence—and the radiocarbon record has spoken.
🌾 The Farmer Migration Hoax II— The Hydrological Proof
For more than a century, archaeology has insisted that farming reached Britain and Europe through a wave of migration from the Fertile Crescent. The story goes that Anatolian farmers trudged across the Balkans, carrying seed bags and livestock, and slowly replaced indigenous foragers.
It is an attractive narrative. But when tested against empirical data — population estimates, radiocarbon records, and hydrology — the story collapses.
📊 Population Data (7000–4000 BCE)
From a dataset of 14,000+ calibrated radiocarbon dates, we can estimate population changes. Between 7000 and 4000 BCE — the period of the so-called “Neolithic Revolution” — the largest increases occur not in Anatolia or the Balkans but in northwest Europe:
France → +60,200
Germany → +32,600
United Kingdom → +17,200
Poland → +14,600
Denmark → +12,900
If the Fertile Crescent migration model were correct, the first major booms should appear in Turkey, Greece, and the Balkans, then ripple westward. Instead, the demographic surge happens in France, Germany, and Britain.
🌊 Hydrology: The Missing Factor
Around 3000 BCE, the swollen rivers and floodplains of the post-glacial period finally began to recede. For millennia, high groundwater and swollen channels had drowned fertile terraces. When the water table fell, vast new tracts of land were exposed.
Using floodplain data (European Environment Agency, FAO hydrology reports), we can estimate:
Country
Floodplain Today (km²)
Floodplain at High Water (5–10×)
Land Gained (km²)
Carrying Capacity (10–20 ppl/km²)
Observed Population Increase
UK
~24,000
120,000–240,000
96,000–216,000
1–4 million
+17,200
France
~65,000
325,000–650,000
260,000–585,000
2.6–11.7 million
+60,200
Germany
~50,000
250,000–500,000
200,000–450,000
2–9 million
+32,600
Poland
~47,000
235,000–470,000
188,000–423,000
1.8–8.5 million
+14,600
Denmark
~4,000
20,000–40,000
16,000–36,000
0.16–0.72 million
+12,900
⚖️ Correlation
Notice the match:
Where the largest tracts of land were recovered (France, Germany, UK), the largest population increases occurred.
The carrying capacity of this land (millions) far exceeded the modest observed increases (tens of thousands).
The pattern is proportionate in geography and timing: as soon as fertile floodplains became available, populations rose and farming was adopted.
This is not coincidence. It is environmental causation.
🚫 Why Migration Isn’t Needed
The orthodox “farmer migration” model says:
Anatolian farmers marched across the Balkans.
They colonised Europe, replacing hunter-gatherers.
Farming arrived in Britain around 4000 BCE as the final wave.
The evidence says:
Population booms happened in the west, not the migration corridor.
Fertile land became available around 3000 BCE in NW Europe.
Farming techniques and crops arrived earlier by trade (e.g. einkorn wheat at Bouldnor Cliff by 6000 BCE).
Local populations expanded into the new land — no mass immigration required.
📌 Note on Population Growth
One final piece often overlooked in the traditional model is demography.
As rivers subsided, aquatic resources dwindled and trading routes contracted. The old water-based economy could no longer sustain the same populations.
Farming offered a new, stable economic model, making use of freshly revealed fertile soils.
Surplus food allowed populations to rise far more quickly than migration ever could.
Mortality also fell: a sedentary lifestyle reduced deaths from seafaring and drowning, common risks in a river-dominated world.
The result was a rapid internal population boom. Farming was not imported by migrants; it was adopted by locals responding to changing rivers, and it created the stability that allowed Britain’s population to expand from within.
✅ Conclusion
The “Farmer Migration” story is a hoax:
A narrative sustained by supposition, not empirical evidence.
Farming was not imported wholesale from the Fertile Crescent.
It emerged locally, when hydrological change exposed vast new floodplains that could support farming economies.
Maritime trade carried ideas and seeds, but the true driver was environmental opportunity, not foreign invaders.
The population data and hydrology align perfectly. The old story does not.
🌾 The Farming Migration Hoax, Part III: The Forest Clearance Myth
For decades we’ve been told that farming in Britain began with heroic Neolithic settlers hacking down the “wildwood” to make space for crops and livestock. Schoolbooks paint a picture of axes ringing through the forest, slash-and-burn fires clearing the way for barley, and an unstoppable march of agriculture.
But the evidence for this story has always been circumstantial — and when you look closer, it collapses.
Land GainedPopulation Growth
🌊 Rivers, Not Axes, Opened the Land
After the Ice Age, as much as 40% of Britain was underwater. Swollen rivers, deep valleys, and vast wetlands dominated the landscape. As sea levels stabilised and the water table dropped, fertile floodplains and terraces gradually emerged.
The chart below shows how much land was “recaptured” over time:
8000 BCE – Mesolithic: 40% of the land still flooded, with little space for cereal crops.
6000 BCE – Early Neolithic: Around 20% of floodplains exposed, rich in carbon and nutrients, quickly colonised by grasses and weeds.
4000 BCE – Mid Neolithic: 40% of land recovered. The famous Elm Decline coincides with hydrological stress and disease, not mass tree-felling.
3000 BCE – Late Neolithic: 70% of land available. Wide open plains emerge naturally as rivers shrink. Archaeologists mistake this for “deforestation.”
2000 BCE – Early Bronze Age: 90% of modern land levels reached. Farming expands, but onto soils already opened by nature, not axes.
In other words: what pollen diagrams show as “clearance” is just natural succession on newly revealed, carbon-rich soils. Farmers simply moved in when the land became usable.
🔥 The Fertility Catch-22
Even more damaging to the traditional story is the soil problem.
Forest soils are nutrient sinks — acidic, nitrogen-poor, and locked up in tree biomass.
Felling trees leaves behind exhausted ground. Burning provides only a short-lived flush of potash. Within a season or two, the soil collapses.
The only way to restore fertility is animal manure — but you need a farm with animals to get manure.
This is the chicken-and-egg paradox: 👉 You can’t farm cleared forest until you already have farming.
That means early farmers could only have started on naturally fertile soils — floodplains, terraces, and raised beaches enriched by silts and organic carbon as the rivers shrank. Forest clearance would only make sense much later, once farming systems were established and animal husbandry could sustain soil fertility.
🪓 Why the Forest Clearance Model Fails
Traditional evidence re-examined:
Pollen records – interpreted as deforestation, but equally the signal of grass succession on receding floodplains.
Charcoal layers – blamed on slash-and-burn, but natural peat and lightning fires explain them.
Field systems & lynchets – many formed naturally through erosion on drying slopes, only later adapted.
Elm decline – more consistent with disease and hydrological stress than with axe-wielding farmers.
Productivity problem – first crops could not survive on cleared woodland soils anyway.
🌲 Smoking Gun Calculation: Why Forest Clearance with Stone Axes Was Impossible
Let’s run the numbers for a typical Neolithic farm — and then scale it to the whole of Britain.
All figures are drawn from peer-reviewed demographic and environmental studies (Whittle 2011; Shennan 2013; Woodbridge 2018) combined with experimental archaeology on felling rates.
Step 1 – The Farm-Scale Reality
Average farm size (per family): ≈ 10 hectares (25 acres) Tree density in wildwood: ≈ 300 trees per ha → 10 ha = 3,000 trees Stone-axe felling rate: 6–8 hours per tree (30–40 cm trunk) Labour to fell trees: ≈ 24,000 hours = 12 years of full-time work by one man
Stump & root removal: adds another 6–10 years minimum
Total ≈ 18–20 years to clear 10 ha before planting.
Step 2 – National-Scale Calculation
Palaeo-environmental reconstructions suggest that by 3000 BCE roughly 20 % of Britain’s forest (≈ 30,000 km²) had been cleared.
Let’s test if that was physically possible.
1 ha = 0.01 km² → 30,000 km² = 3 million ha.
At ≈ 24,000 man-hours per 10 ha = 2,400 hours per ha,
→ Total man-hours = 7.2 billion.
Population available
Peer-reviewed demographic models give Britain’s Neolithic population ≈ 300,000–500,000 people.
Assume each can work 1,500 hours per year (five hours/day, six days/week, 50 weeks).
Annual national labour capacity = 187.5 million hours.
Years required
7.2 billion hours ÷ 187.5 million hours/year = ≈ 38 years of entire national manpower devoted solely to tree-felling — no time for food production, tool-making, building, or survival.
And that’s only for felling, not stump burning, ploughing, or soil prep. Including those doubles the figure to ≈ 70–80 years of total-population labour — an obvious impossibility.
Even if we use the lowest plausible forest-clearance figure (10 % of land = 15,000 km²), it still needs ≈ 25 billion hours — equivalent to the entire working capacity of Britain for over a generation.
Step 3 – Demographic Distribution
Settlements were concentrated along coasts, estuaries, and river valleys (as shown in pollen and C14 datasets).
Over 60 % of inhabitants lived within 10 km of navigable water — leaving only a minority near inland forests.
Thus, fewer than 50,000 males could realistically have participated in woodland clearance.
That raises the time requirement to 150–200 years of continuous labour, completely implausible.
✅ Conclusion
Mathematically, demographically, and physically, the idea of Neolithic-era forest clearance by stone-axe farmers collapses. The numbers prove that:
The available workforce was two orders of magnitude too small.
Stone technology and stump-burning methods made mass clearance impossible.
Population distribution favoured naturally open, silt-rich floodplains rather than dense upland forests.
Therefore, early farming did not begin with forest clearance — it began on land already opened by nature as post-glacial rivers and wetlands receded.
🌱 Farming as Evolution, Not Invasion
Farming began when nature exposed fertile ground — floodplains, terraces, and raised beaches — that required little more than drainage and hoeing. Only millennia later, in the Bronze and Iron Ages, when populations rose and metal tools existed, did forest clearance become practical.
So the so-called “forest-clearance revolution” was never the birth of farming — it was its long-delayed side effect.
📚 Further Reading
Rethinking the Past: Post-Glacial Flooding and the Lost Rivers of Britain → https://prehistoric-britain.co.uk/rethinking-the-past 14,000 Radiocarbon Dates Just Buried the “Neolithic Farmer” Myth The Post-Glacial Flooding Hypothesis (Langdon 2021)
🌾 The Farming Migration Hoax, Part IV – the DNA?
Genetics is often presented as the “cast-iron proof” for Neolithic migration, with two key studies most often cited: Lazaridis et al. (2014, Nature 513:409–413) and Haak et al. (2015, Nature 522:207–211). But the actual findings don’t confirm the story of a farmer invasion from Anatolia into Britain — they show a more complex picture of admixture, continuity, and later upheavals.
✅ What DNA Shows
Ancient DNA reveals contacts and gene flow, not wholesale replacement. Small groups intermarried, and farming knowledge spread through trade and contact networks, not mass movements.
Lazaridis et al. (2014) proposed Europe was a mix of three ancestral groups — Western Hunter-Gatherers (WHG), Early European Farmers (EEF, linked to Anatolia), and Ancient North Eurasians (ANE). But the proportion of EEF ancestry is small in NW Europe, far less than required to prove mass migration.
Haak et al. (2015) identified a “massive migration” into Europe — but this was the Steppe/Yamnaya expansion (~3000 BCE), during the Bronze Age, not the Neolithic.
Haplogroups provide some useful clues:
Y-DNA haplogroup G2a is often linked to early farmers from Anatolia. It appears in central/southern European Neolithic sites but is rare in Britain and NW Europe.
Haplogroups I2 and R1b dominate in NW Europe — both associated with Mesolithic hunter-gatherer continuity and later Bronze Age expansions.
Mitochondrial DNA (mtDNA) haplogroups such as H and U show continuity from Mesolithic through Neolithic in Britain.
Some haplogroup expansions run NW → SE (e.g. R1b dominance in Western Europe spreading back east during the Bronze Age), which is the opposite of the orthodox “Anatolia → Britain” story.
❌ What DNA Does Not Prove
It does not show Mesolithic peoples in Britain being wiped out — continuity dominates, with limited admixture.
It does not establish clear, step-by-step farmer migration routes from Anatolia. If tens of thousands had moved, we would see overwhelming G2a penetration into NW Europe. We do not.
It does not explain the population surges in NW Europe between 7000–4000 BCE. Gene flow is descriptive, not explanatory.
🔍 Accuracy and Sample Limits
For 7000–4000 BCE, the number of ancient genomes sequenced remains small — only hundreds across a continent.
Most come from Central and Southern Europe; Britain and NW Europe are underrepresented, making sweeping migration claims for these regions unconvincing.
Haplogroup frequencies vary regionally and through time — but the biggest DNA shifts happen in the Bronze Age, not in the early Neolithic.
🪢 The Connection
DNA confirms contact and admixture but not the orthodox migration narrative. Haplogroups like G2a are sparse in NW Europe, while Mesolithic lineages I2 and R1b remain strong — showing continuity rather than replacement.
The true driver of the demographic explosion was not incoming bloodlines, but environmental opportunity: rivers shrinking, fertile soils emerging, and local populations adopting farming.
In this context, genetics aligns with the Post-Glacial model: trade, contact, and adaptation in NW Europe first — not farmer migrations from Anatolia.
🧬 Even Nature Peer-reviewed Journal Now Admits: Farming Didn’t Spread by Migration
A new 2025 study in Nature Communications (LaPolice, Williams & Huber) has quietly rewritten the Neolithic story. Using 618 ancient genomes and mathematical simulations, the researchers found that cultural exchange between farmers and foragers occurred at only 0.1% per year — meaning the spread of farming across Europe was almost entirely local, not migratory. The authors concluded that the Neolithic expansion involved near-complete within-group mating and that ancestry patterns cannot be used to infer mass migration. In other words, even the genetic data now supports what LiDAR and hydrology already showed: farming arose through local growth on newly exposed, fertile land, not from Anatolian colonists trudging west.
1️⃣ Minimal Cultural Transmission
The team’s computer models tested thousands of possible migration and mixing scenarios using aDNA samples from 5000–8500 BP. Their best-fit result required a cultural transmission rate of just 0.1% per year — the equivalent of one in a thousand farmers influencing a local forager annually. That is effectively no cultural exchange at all. This matches our argument precisely: farming knowledge did not flow by contact or teaching, but through local innovation once hydrological conditions allowed — when floodplains and terraces emerged as rivers receded.
2️⃣ Local Population Expansion
The same model found that over 97% of Neolithic population growth occurred within existing groups, with only 2–3% mixed unions between farmers and foragers. This demolishes the traditional idea of a hybrid or “fusion” culture spreading outward from Anatolia. Instead, it shows local demographic growth, the natural result of newly usable land and stable food resources. The authors even note that demic expansion can occur without ancestry turnover, meaning genetic continuity can persist even in a growing population — exactly what our Post-Glacial Flooding model predicts.
3️⃣ Why DNA Alone Misleads
LaPolice et al. caution that genetic ancestry patterns cannot distinguish between migration and local growth. In their words:
“Ancestry patterns do not always reflect the underlying behavioural mechanisms.” This point is crucial. Archaeologists often interpret changing genetic signatures as proof of mass movement, yet the paper shows such shifts can result from in-situ population expansion. It confirms what we’ve argued throughout: DNA cannot be read in isolation — it must be understood within environmental and demographic context.
4️⃣ Environmental Limits Control Expansion
Although the paper doesn’t model hydrology directly, it identifies environmental carrying capacity as the key limiting factor in where farming could thrive. This aligns perfectly with our hypothesis: as Britain’s post-glacial river levels dropped, the exposed, nutrient-rich floodplains created new opportunities for farming, driving population booms without external migration.
✅ The Verdict
The Nature Communications study unintentionally validates the Post-Glacial Flooding Hypothesis. It shows that:
Farming spread slowly and locally, not through mass migration.
Cultural transfer between groups was almost non-existent.
Population growth was driven by environmental opportunity, not colonisation.
DNA evidence, when modelled properly, cannot support the idea of Anatolian farmers replacing Mesolithic Britons.
Even the most conservative reading of their results confirms what we’ve been arguing for years: the Neolithic “revolution” was not a human migration at all — it was an ecological event, shaped by water, climate, and land.
UPDATE 2025: Two Peer-Reviewed Studies Finally Expose the “Farmer Migration” Myth
For more than a decade, this blog has argued that farming in Britain and northwest Europe arose from environmental adaptation, not imported migration. Two recent peer-reviewed papers have now confirmed what Langdon’s Hydrological Diffusion Model predicted all along.
1️⃣ Abraham et al. (2023) — Pollen No Longer Proves Clearance
Published in Preslia 95 (385–411), Abraham et al. re-examined over 1,500 pollen sequences and 65,000 archaeological components covering 12,000 years of European vegetation history. Using advanced statistical modelling, they found that:
Human activity explains only 1 – 9 % of the total pollen variation (R² = 0.01–0.09).
Environmental factors such as elevation and long-term Holocene trends dominate the signal.
Supposed “cereal” pollen is frequently misidentified wild grass, not cultivated crop.
The spatial resolution of pollen data (15–40 km) is far too coarse to infer local farming.
Their conclusion is unambiguous:
“The possible collinearity of influencing factors and existing biases therefore question the general validity of anthropogenic indicators in pollen analysis.”
This landmark analysis destroys the old palynological foundation of the migration model. The forest-clearance story collapses — leaving only Langdon’s hydrological explanation standing: when post-glacial waters fell, new land appeared, and local people farmed it.
2️⃣ LaPolice et al. (2025) — Migration Not Required
The Nature Communications study by LaPolice et al. (25 Aug 2025) used continental-scale genetic simulations to test whether Europe’s Neolithic spread required large-scale migration. Their results overturned decades of assumption:
“Even modest rates of local adoption can fully explain the archaeological front speed… front speed alone is not diagnostic of demic migration.”
In short:
Mass migration isn’t needed to reproduce Europe’s Neolithic pattern.
Farming spread through small-scale contact and local uptake, not replacement.
The genetic clines that once seemed proof of a “wave of advance” arise naturally from limited interaction between neighbouring groups.
This directly supports Langdon’s Hydrological Diffusion Model — showing that as the environment changed, ideas and crops travelled faster than people. The “Farmer Invasion” narrative is officially obsolete.
3️⃣ The Verdict — Hydrology Wins
Together these two studies dismantle the last props of the traditional model:
Old Assumption
2023–2025 Evidence
Result
Falling tree pollen = migrants clearing forest
Pollen change driven mainly by environment (Abraham et al.)
❌ Myth
Farming spread through population replacement
Genetic simulations show local adoption fits data (LaPolice et al.)
❌ Myth
Rivers irrelevant to Neolithic expansion
Hydrology determines where fertile land emerged (Langdon Model)
✅ Verified
After almost a century of repetition, the “Great Farmer Migration” is finally exposed for what it always was — a convenient fiction based on misread data.
Langdon’s evidence-based model now stands as the only explanation consistent with both environmental science and modern genetics:
Farming was born here — not imported.
PodCast
Author’s Biography
Robert John Langdon, a polymathic luminary, emerges as a writer, historian, and eminent specialist in LiDAR Landscape Archaeology.
His intellectual voyage has interwoven with stints as an astute scrutineer for governmental realms and grand corporate bastions, a tapestry spanning British Telecommunications, Cable and Wireless, British Gas, and the esteemed University of London.
A decade hence, Robert’s transition into retirement unfurled a chapter of insatiable curiosity. This phase saw him immerse himself in Politics, Archaeology, Philosophy, and the enigmatic realm of Quantum Mechanics. His academic odyssey traversed the venerable corridors of knowledge hubs such as the Museum of London, University College London, Birkbeck College, The City Literature Institute, and Chichester University.
In the symphony of his life, Robert is a custodian of three progeny and a pair of cherished grandchildren. His sanctuary lies ensconced in the embrace of West Wales, where he inhabits an isolated cottage, its windows framing a vista of the boundless sea – a retreat from the scrutinous gaze of the Her Majesty’s Revenue and Customs, an amiable clandestinity in the lap of nature’s embrace.
Exploring Prehistoric Britain: A Journey Through Time
My blog delves into the fascinating mysteries of prehistoric Britain, challenging conventional narratives and offering fresh perspectives based on cutting-edge research, particularly using LiDAR technology. I invite you to explore some key areas of my research. For example, the Wansdyke, often cited as a defensive structure, is re-examined in light of new evidence. I’ve presented my findings in my blog post Wansdyke: A British Frontier Wall – ‘Debunked’, and aWansdyke LiDAR Flyover video further visualizes my conclusions.
For those interested in British Prehistory, visit www.prehistoric-britain.co.uk, a comprehensive resource featuring an extensive collection of archaeology articles, modern LiDAR investigations, and groundbreaking research. The site also includes insights and extracts from the acclaimed Robert John Langdon Trilogy, a series of books exploring Britain during the Prehistoric period. Titles in the trilogy include The Stonehenge Enigma, Dawn of the Lost Civilisation, and The Post Glacial Flooding Hypothesis, offering compelling evidence about ancient landscapes shaped by post-glacial flooding.
To further explore these topics, Robert John Langdon has developed a dedicated YouTube channel featuring over 100 video documentaries and investigations that complement the trilogy. Notable discoveries and studies showcased on the channel include 13 Things that Don’t Make Sense in History and the revelation of Silbury Avenue – The Lost Stone Avenue, a rediscovered prehistoric feature at Avebury, Wiltshire.
In addition to his main works, Langdon has released a series of shorter, accessible publications, ideal for readers delving into specific topics. These include:
For active discussions and updates on the trilogy’s findings and recent LiDAR investigations, join our vibrant community on Facebook. Engage with like-minded enthusiasts by leaving a message or contributing to debates in our Facebook Group.
Whether through the books, the website, or interactive videos, we aim to provide a deeper understanding of Britain’s fascinating prehistoric past. We encourage you to explore these resources and uncover the mysteries of ancient landscapes through the lens of modern archaeology.
For more information, including chapter extracts and related publications, visit the Robert John Langdon Author Page. Dive into works such as The Stonehenge Enigma or Dawn of the Lost Civilisation, and explore cutting-edge theories that challenge traditional historical narratives.
The Peer-Reviewed map of 2019 is showing the maritine connections even as silly baysian averages – Archaeology’s Bayesian Mistake: Stop Averaging the Past
Archaeology loves a tidy median. Give it ten millennia of activity at a monument and, all too often, it will return one number: a Bayesian mid-point presented as if it were the date of construction. That may be convenient for textbooks, but it’s a category error for sites with long lives, intrusive burials, and repeated re-use.
This post does the opposite. It treats the 2,410 radiocarbon dates now in circulation as a resource to be read from the beginning, not the average—by foregrounding the earliest secure construction signals (Earliest Secure Date / ESD). Do that, and a very different story emerges:
Megalith building (and its direct precursors) starts far earlier than Late Neolithic averages suggest.
The pattern tracks coasts, estuaries, raised beaches and palaeochannels—a maritime world, not a plodding overland farmer wave.
“Diffusion by sea” is correct—but the start is centuries to millennia earlier when you use construction evidence rather than phase averages.
Unprecedented number of sample in this report – blows most dating evidence of the last 50 years out-of-
The Problem in One Line
Bayesian phase modelling is excellent for summarising typical activity windows; it is the wrong instrument for pinning down first construction. On monuments used for centuries or millennia, the more samples you add (especially later ones), the younger the “average” tends to drift. Great for phases. Misleading for build dates.
The ESD Rule (How to Date Construction Honestly)
When the question is “When was this built?”:
Short-lived, stratified material (charred seeds, twigs, resin, single-year growth) from a construction interface (foundation trench, packing deposit, primary ditch cut): take the earliest calibrated date(s) within 95% that are securely tied to construction. Do not average with later phases.
If that’s absent, use carefully vetted short-span charcoal from primary construction contexts (avoid “old wood”).
Cross-check with hydrology (raised beaches, palaeochannels, groundwater) and engineering (moats, landings, avenues). When hydro-context and earliest dates agree, you’ve got your ESD.
Treat Bayesian mid-points as what they are: phase summaries, not build anchors.
What the Earliest Signals Say (by region)
When the radiocarbon record is read from the earliest secure construction signals instead of averaged phase mid-points, a very different story emerges.
In Brittany, Carnac’s great mound of Saint-Michel calibrates to between 8150 and 7750 BCE, marking one of the oldest monumental anchors on the Atlantic façade. Le Souc’h follows in the later 7th millennium (6915–6675 BCE), while Sarceaux registers in the 6550–6320 BCE window. Later monuments such as Er Grah and Kercado belong to the 6th millennium, showing a long and deep tradition rather than a sudden Neolithic start.
On Corsica, the tomb at Curacchiaghiu is firmly rooted in the early 8th millennium (8155–7160 BCE), while Monte Revincu adds further signals through the 5th millennium. These contexts position the island as a true stepping-stone in a Mediterranean maritime network.
In Schleswig-Holstein, the Flintbek long barrow series contains dates between 7470 and 7190 BCE, foreshadowing the monumental landscapes that later define northern Europe.
The Atlantic façade of Iberia is equally early. Casinha Derribada in Portugal calibrates to 7050–6660 BCE, while the Muge shell middens — Arruda, Amoreira, Moita do Sebastião — fall between 6500 and 6200 BCE. Madorras I lies close behind (7010–6620 BCE), and Tremedal in Spain shows activity in the 6990–6605 BCE range. Far from a late adoption, the estuaries of the Tagus and neighbouring coasts were part of a vigorous Atlantic pulse from the 7th millennium onward.
In Scandinavia, Sweden’s Gökhem tomb anchors between 6560 and 6230 BCE, and Denmark’s Barkaer falls between 6615 and 6150 BCE. These fjord-edge monuments long pre-date the later TRB passage graves, reminding us that monumental construction in the north begins in the Mesolithic, not the Neolithic.
The British Isles share this watery horizon. Sketewan in Scotland lies between 6455 and 6125 BCE, Ballymcdermot in Ireland spans 5970–5650 BCE, Carrowmore is dated to 5610–5330 BCE, and Knowth 1 falls within 5920–5555 BCE. Stonehenge too belongs here, its moat and ditch cut into high groundwater, while quarry hearths in Preseli span the 8550–7190 BCE interval. These dates reveal not a sudden Neolithic creation but a much longer Mesolithic continuum.
Even the Central Mediterranean aligns with this picture. Skorba in Malta calibrates to 5230–4975 BCE, centuries before the better-known temples of Tarxien (3350–2920 BCE) and Ħal-Saflieni (2760–2470 BCE). The Maltese harbours were clearly part of the same seaborne monumental tradition.
Why the story looks different in older reports
The difference lies in method. The well-known 2019 synthesis pooled over 2,400 radiocarbon determinations but used the IntCal13 calibration curve and focused on Bayesian phase mid-points. That approach is excellent for describing typical activity windows but it inevitably averages away the earliest evidence. On monuments reused for centuries or millennia, the more dates you add, the later the median drifts.
Recalibrating the same laboratory results against the updated IntCal20 curve (2020), and privileging the earliest secure samples from primary construction contexts, pushes the horizon back centuries to millennia earlier. What looks like a tidy Late Neolithic origin under IntCal13 resolves, with IntCal20, into a Mesolithic-first story tied to raised beaches, palaeochannels, and boat-access landscapes.
What the famous “2,410 dates” study actually shows—and what it doesn’t
The big synthesis that pooled 2,410 C-14 determinations did two important things: (1) it assembled the record; (2) it used Bayesian modelling to map phase timings and diffusion patterns. That’s valuable and—crucially—compatible with our case. Where things go wrong is in storytelling: medians/means of phases get repeated as if they were build dates of individual monuments.
Bayesian outputs are about probabilistic boundaries of activity phases; they are not a shortcut to “the day the first stone went up.” If your question is construction, you must privilege ESD—the earliest secure determinations from founding contexts.
Site-by-site ledger clarifies the early horizon
Because we tag Earliest_date against context, the ledger restores the first-build edge that phase models tend to blur. The result is a Mesolithic-first horizon across the Atlantic façade and selected Mediterranean islands, which better explains:
Early coastal clustering (estuaries, lagoons, raised beaches).
Rapid sea-borne spread of ideas (not slow overland migration).
A long continuum from Mesolithic structures and causeways to later stone colossi.
Why Bayesian mid-points keep misleading us
Even when used correctly, phase models weight later activity simply because there’s more of it (and more samples from it). Three predictable distortions follow:
Innovators vanish. The builders who did it first are averaged into a later “typical” date.
Orthodoxy is preserved. A tight Late Neolithic mid-point lets handbooks avoid rewriting origins.
Hydrology is sidelined. Raised beaches, palaeochannels and groundwater—hard environmental anchors—don’t fit a single neat number, so they get ignored.
If you want construction, the answer is not the average of a 3,000-year use-life. It’s the Earliest Secure Date tied to building.
Why this matters for Stonehenge & the Atlantic network
Read through ESD, Stonehenge moves back into its watery Mesolithic landscape—moats on high groundwater, boat access, healing-spring chemistry on the bluestone story—rather than a dry-chalk Late Neolithic “first build.” Ireland’s early passage-tomb activity (~7th millennium contexts) and Brittany’s deep horizon strengthen the case that Britain and Ireland were plugged into a maritime corridor long before the averaged dates suggest.
Credibility isn’t the issue—interpretation is
The 2,410 dates came from top-tier national labs and university projects across Europe. The synthesis is careful and the toolkit (e.g., OxCal) is standard. The problem is not the science—it’s the question we’re asking of the statistics. Phase models answer “when was this kind of activity typical here?” Langdon research asks “when was this monument first constructed?” Different question, different metric.
A wider, older, wetter Atlantic story
Foregrounding earliest construction signals harmonises with independent lines of evidence:
Hydrology: monuments perched on raised beaches, beside palaeochannels, on estuary rims.
Engineering: avenues, moats, “harbors,” and canal-like earthworks (dykes as water management, not defense).
Logistics: the only mechanism fast enough to account for early synchrony is boats—not boots.
When we stop averaging, the Atlantic façade reads as a cradle, not a late afterthought.
What a fair synthesis should look like (use both tools, but be honest)
Tag contexts: construction vs. reuse vs. intrusion.
Overlay hydrology and elevations; publish cross-sections.
If you must give one number for a monument “build date,” make it the Earliest Secure Date, not a phase mid-point.
The question we should now ask out loud
Why have we allowed phase averages to stand in for construction dates? Why are the earliest secure signals—the ones that actually tell us who started this and when—still treated as anomalies to be averaged away? If archaeology is a science, start with the earliest anchor. Then talk about reuse.
Final word: the stones didn’t walk. They sailed.
The 2,410-date record is extraordinary. Use it properly—by separating first-build from later use, by reporting ESD alongside Bayesian phases, and by reading the landscape in water—and Europe’s megaliths resolve into what the monuments and coastlines have been saying all along:
an early, maritime, pan-Atlantic civilisation—with origins deep in the Mesolithic and a memory long enough to be blurred by averages.Megaliths by Sea: Re-reading Europe’s Deep Past from its Earliest Radiocarbon Signals
For a century, the story of Europe’s megaliths has swung between two poles. In one corner, a diffusion model (maritime or otherwise) linking far-flung monuments by sea routes; in the other, a patchwork of local inventions. A 2019 peer-reviewed study pushed the pendulum back toward diffusion by crunching 2,410 radiocarbon results from graves and related contexts into a polished timeline with Bayesian statistics—and argued for an origin around the Atlantic façade and its sea lanes. PubMed
That paper is impressive and important. But it also highlights a problem with how we currently treat dates. Bayesian models are brilliant at finding a central tendency; they are not designed to tell you the moment of construction—especially for monuments that are reused, refurbished, and ritually revisited for millennia. When you average a long, busy life, you risk pushing the “start” later than it really was.
Appendices
Appendix — Earliest Secure Dates by Country (Top 5 per country)
(Older → younger within each country, based on the older end of the 95% IntCal20 calibrated BCE range. “RC Age” is the reported radiocarbon age in years BP.)
Jättegraven — Lab: (5220 BP) → see calibrated range in ledger (Limited by first-500 subset.)
Methods — How we calculated the BCE ranges (and why older books are off)
What we calibrated: The spreadsheet’s radiocarbon measurements (¹⁴C Age, BP) with their lab-reported errors (±σ).
Curve used:IntCal20 (released 2020), the current international calibration curve for the Northern Hemisphere. It supersedes IntCal13 (2013) and earlier curves.
Computation:
For each date we ran a Monte Carlo calibration: we sampled thousands of ¹⁴C ages from a Normal(age, σ) for that lab result, mapped each sample to cal BP via the IntCal20 curve (by interpolation on the published IntCal20 grid), and then converted to cal BCE using cal BCE = cal BP − 1950.
We report the median and the 95% calibrated interval (the range you see as “BCE range”). This captures the real-world uncertainty and the curve’s “wiggles.”
Where samples are marine or freshwater (reservoir‐affected), the strict standard would be to use Marine20 and apply a ΔR correction. Most entries here are terrestrial (charcoal, seeds, etc.); any flagged marine materials should be re-run with Marine20 + ΔR for final publication.
Why earlier publications disagree:
Many pre-2020 papers/books either (a) quoted uncalibrated BP as if it were BCE, or (b) calibrated using older curves (IntCal09/13). Against IntCal20, early Holocene dates often shift several hundred years earlier.
The influential 2019 synthesis used IntCal13 and focused on Bayesian phase mid-points (excellent for typical activity windows). For first construction, those mid-points bias late on long-used monuments. Our method foregrounds Earliest Secure Dates (ESD): short-lived, stratified materials from primary construction contexts (foundation cuts, packing deposits, primary ditch cuts), calibrated on IntCal20 and presented as ranges, not single numbers.
Bottom line:
BP is not BCE. Always calibrate.
Use IntCal20 (or later) and show ranges at 95%.
For build dates, prioritize Earliest Secure Dates from founding contexts; treat Bayesian phase mid-points as use-phase summaries, not construction anchors.
Full List of C14 dates
Schulz Paulsson, B. (2019). Radiocarbon dates and Bayesian modeling support maritime diffusion model for megaliths in Europe. PNAS, 116(9): 3460–3465. Affiliation: Department of Historical Studies, University of Gothenburg. PubMed
To determine the earliest likely date of origin for megalithic construction, avoiding the potential biases introduced by Bayesian averages, you could use an alternative mathematical approach. Here are some potential methods:
1. Minimum Date Selection
Identify the earliest calibrated radiocarbon date in the dataset for each site and use these as indicative of the earliest human activity or construction.
2. Terminus Ante Quem Approach
Focus on dates that represent the earliest securely stratified contexts associated with construction, ensuring they are not from later disturbances or unrelated materials.
3. Cluster Analysis
Perform a clustering analysis of all calibrated dates to identify the earliest significant cluster of activity. This can help filter out outliers and provide a more accurate picture of early construction activity.
4. Monte Carlo Simulation
Run a Monte Carlo simulation on the dataset to account for uncertainties and distribution patterns in radiocarbon calibration, generating a range for the earliest dates.
5. Probability Density Function Peaks
Generate probability density functions (PDFs) for all dates and identify the peak of the earliest cluster, as this represents the most probable early activity.
6. Stratigraphic and Contextual Filtering
Combine radiocarbon dates with stratigraphic and archaeological context to exclude dates that do not relate directly to the original construction phase.
(Maritime Diffusion Model for Megaliths in Europe)
We know longer need to wonder about who built Stonehenge – Maritime Diffusion Model for Megaliths in Europe
PodCast
Author’s Biography
Robert John Langdon, a polymathic luminary, emerges as a writer, historian, and eminent specialist in LiDAR Landscape Archaeology.
His intellectual voyage has interwoven with stints as an astute scrutineer for governmental realms and grand corporate bastions, a tapestry spanning British Telecommunications, Cable and Wireless, British Gas, and the esteemed University of London.
A decade hence, Robert’s transition into retirement unfurled a chapter of insatiable curiosity. This phase saw him immerse himself in Politics, Archaeology, Philosophy, and the enigmatic realm of Quantum Mechanics. His academic odyssey traversed the venerable corridors of knowledge hubs such as the Museum of London, University College London, Birkbeck College, The City Literature Institute, and Chichester University.
In the symphony of his life, Robert is a custodian of three progeny and a pair of cherished grandchildren. His sanctuary lies ensconced in the embrace of West Wales, where he inhabits an isolated cottage, its windows framing a vista of the boundless sea – a retreat from the scrutinous gaze of the Her Majesty’s Revenue and Customs, an amiable clandestinity in the lap of nature’s embrace.
Exploring Prehistoric Britain: A Journey Through Time
My blog delves into the fascinating mysteries of prehistoric Britain, challenging conventional narratives and offering fresh perspectives based on cutting-edge research, particularly using LiDAR technology. I invite you to explore some key areas of my research. For example, the Wansdyke, often cited as a defensive structure, is re-examined in light of new evidence. I’ve presented my findings in my blog post Wansdyke: A British Frontier Wall – ‘Debunked’, and aWansdyke LiDAR Flyover video further visualizes my conclusions.
For those interested in British Prehistory, visit www.prehistoric-britain.co.uk, a comprehensive resource featuring an extensive collection of archaeology articles, modern LiDAR investigations, and groundbreaking research. The site also includes insights and extracts from the acclaimed Robert John Langdon Trilogy, a series of books exploring Britain during the Prehistoric period. Titles in the trilogy include The Stonehenge Enigma, Dawn of the Lost Civilisation, and The Post Glacial Flooding Hypothesis, offering compelling evidence about ancient landscapes shaped by post-glacial flooding.
To further explore these topics, Robert John Langdon has developed a dedicated YouTube channel featuring over 100 video documentaries and investigations that complement the trilogy. Notable discoveries and studies showcased on the channel include 13 Things that Don’t Make Sense in History and the revelation of Silbury Avenue – The Lost Stone Avenue, a rediscovered prehistoric feature at Avebury, Wiltshire.
In addition to his main works, Langdon has released a series of shorter, accessible publications, ideal for readers delving into specific topics. These include:
For active discussions and updates on the trilogy’s findings and recent LiDAR investigations, join our vibrant community on Facebook. Engage with like-minded enthusiasts by leaving a message or contributing to debates in our Facebook Group.
Whether through the books, the website, or interactive videos, we aim to provide a deeper understanding of Britain’s fascinating prehistoric past. We encourage you to explore these resources and uncover the mysteries of ancient landscapes through the lens of modern archaeology.
For more information, including chapter extracts and related publications, visit the Robert John Langdon Author Page. Dive into works such as The Stonehenge Enigma or Dawn of the Lost Civilisation, and explore cutting-edge theories that challenge traditional historical narratives.
For over a century, British archaeology has repeated the same tale: Offa’s Dyke and Wat’s Dyke were built by Saxon kings to define borders and display royal power. But each time we peel back another layer—literally and figuratively—the data tells a radically different story. This is no longer about interpretation or fringe theory. The scientific evidence, especially from radiocarbon dating, blows the Saxon myth apart.(Twigs, Charcoal, and the Death of the Saxon Dyke Myth)
1. The Mesolithic Nuts Beneath the Bank
At Gobowen, Shropshire, archaeologists uncovered pits beneath Wat’s Dyke filled with charred hazelnut shells and twigs. Radiocarbon dating placed these at 5210–4840 BC—deep into the Mesolithic. This is not “background noise.” It proves the site was in use—and likely managed—thousands of years before any so-called Saxon activity. (Twigs, Charcoal, and the Death of the Saxon Dyke Myth)
Gobowen Side where they found the Mesolithic Hearths – (Twigs, Charcoal, and the Death of the Saxon Dyke Myth)
2. The “Twigs” and the Bronze Age Pattern
Here’s where things get explosive. Two different digs—at Gobowen and Maes-y-Clawdd—each pulled a charred twig from the primary fill of the dyke’s ditch. Both were sent to modern AMS labs for dating. These were sent to independent AMS labs for testing:
Gobowen: 2825 ± 40 BP, calibrated to 1120–890 BC
Maes-y-Clawdd: 2855 ± 40 BP, calibrated to 1120–890 BC
Different labs, different sites, nearly identical dates: Late Bronze Age. Some might claim “residuality” or accident, but when the same date keeps showing up in primary contexts at different sites, the odds of pure coincidence plummet.(Twigs, Charcoal, and the Death of the Saxon Dyke Myth)
Maes-Y-Clawdd site (Twigs, Charcoal, and the Death of the Saxon Dyke Myth)
3. Erddig and Chirk: More Prehistoric Dates
The new gold standard in the debate is the peer-reviewed Archaeologia Cambrensis study (Malim et al. 2021), which returned:
Erddig: Alder charcoal under the bank, 1414–1258 BC (Bronze Age)
Chirk: Charcoal at base of bank, 776–543 BC (Iron Age)
These aren’t rogue samples. They are part of a systematic pattern. (Twigs, Charcoal, and the Death of the Saxon Dyke Myth)
Wats Dyke Excavation – (Twigs, Charcoal, and the Death of the Saxon Dyke Myth)
4. The Car Dyke and Wansdyke Parallels
Our recent research on Car Dyke—summarised in my book, Car Dyke: The Lost Waterways of Prehistoric Britain—shows exactly the same pattern. LiDAR analysis, gradient modeling, and dated artefacts reveal this “Roman” canal sits atop a much older, prehistoric water-management system, later adapted by the Romans. The same sequence—prehistoric construction, Roman enhancement, and later reuse—emerges at other great linear earthworks.
Wansdyke: More than Just a Saxon Bank and Ditch
Roman Water System at the Summit: Topographic and archaeological evidence shows that a Roman water-management system, likely an aqueduct or channel, was constructed along sections of Wansdyke near Cliffe Pypard and Cherhill. The Roman works appear to incorporate the line and gradient of the existing dyke, indicating that the dyke was already present and subsequently adapted for Roman infrastructure needs. This reuse implies that the dyke is pre-Roman in origin, forming part of an older, possibly prehistoric, water-management landscape. Rather than constructing a new route, the Romans modified what was already there—strong evidence that Wansdyke was not their creation, but an earlier engineering feature they found valuable enough to repurpose.
Roman Road Laid On the Dyke: To the north of Morgan’s Hill, a documented Roman road is physically laid on top of the Wansdyke bank. The logical sequence? The dyke had to exist before the road. (For detail and field evidence, see: prehistoric-britain.co.uk/prehistoric-canals-dykes-wansdyke4)
The Implication: These features make it impossible to honestly claim that Wansdyke is purely a Saxon or sub-Roman structure. Instead, we’re seeing a prehistoric engineering work—possibly a canal or water-management feature—repurposed by the Romans, and then again in later centuries.
(Twigs, Charcoal, and the Death of the Saxon Dyke Myth)
Car Dyke Parrellels – (Twigs, Charcoal, and the Death of the Saxon Dyke Myth)
A Consistent Prehistoric Pattern
The parallels between Car Dyke, Wansdyke, Offa’s Dyke, and Wat’s Dyke are now undeniable:
All show prehistoric (Mesolithic, Bronze Age, or Iron Age) dates or structural evidence in primary contexts.
All were reused, enlarged, or recut by later societies—be it the Romans, Saxons, or Medievals.
All have been misunderstood because traditional narratives refuse to follow the evidence.
Roman Canal Boat as found at Car Dyke – (Twigs, Charcoal, and the Death of the Saxon Dyke Myth)
(Twigs, Charcoal, and the Death of the Saxon Dyke Myth)
5. Why the Saxon Narrative No Longer Holds
Traditional archaeology claims these dykes were built in the Dark Ages because it’s “what’s always been said” and because a handful of OSL dates cluster in the early medieval period. But with so many radiocarbon dates from secure, primary contexts returning Bronze Age and Iron Age results, the only scientific response is to question the narrative—not the data.
This shift isn’t limited to a few isolated studies. In 2019, Historic England (formerly English Heritage) published a national overview of linear earthworks, concluding that most of the dykes they had investigated dated to the prehistoric period, not the early medieval one. Their guidance document, Prehistoric Linear Boundary Earthworks, situates these features firmly in the Late Neolithic through to the Iron Age, aligning with the growing body of radiocarbon evidence and undermining the traditional Dark Age attribution.
Rather than reinforcing the Saxon story, modern research now supports a much older, more complex landscape—one that was later reused and reinterpreted by the Romans and Saxons alike.
From the Book by HE – (Twigs, Charcoal, and the Death of the Saxon Dyke Myth)
(Twigs, Charcoal, and the Death of the Saxon Dyke Myth)
6. AI and Modern Method: The Death of Peer-Reviewed Dogma
For years, peer review has failed to challenge inherited assumptions. “Authority” was all that mattered—a single, dramatic radiocarbon date (like the infamous 6.25 kg of charcoal at Maes-y-Clawdd) could define an entire monument’s chronology, regardless of context or contradictory data from other sites.
But now? AI is revolutionising how we check and interpret archaeological evidence.
Take our recent FB post, where we used AI to reassess the Maes-y-Clawdd excavation:
Myth: The excavation report’s headline date (c. 400 AD) from the charcoal was endlessly repeated as proof of a “Roman” or “sub-Roman” dyke.
AI’s Role:
Pulled together site photos, original reports, ditch profiles, and stratigraphy from multiple digs.
Flagged the ditch’s V-shape (classic recut) and the heavy truncation of the bank (over half missing)—which undermined the idea that the charcoal was securely “sealed” and contemporary with construction.
Cross-referenced other sites (Gobowen, Erddig, Chirk), showing that Bronze Age and Iron Age dates in similar primary contexts kept reappearing—not as random “residuals,” but as a systematic pattern.
Outcome:
Instead of blindly accepting published “facts,” AI let us validate or reject past interpretations using all the available primary evidence.
The “Roman” story now stands exposed as an artefact of interpretation, not of data.
This is not “pseudoscience”—it’s the very definition of the scientific method:
Gather all the evidence.
Challenge every conclusion.
Rebuild the narrative when the facts demand it.
Just as AI is transforming genetics, climate science, and engineering, it’s now arming archaeology with the ability to see through myths, correct errors, and put our past on a solid, evidence-based footing. If you want real history, let the data—and AI—lead the way. (Twigs, Charcoal, and the Death of the Saxon Dyke Myth)
Twigs, Charcoal, and the Death of the Saxon Dyke Myth
Conclusion: Follow the Data, Not the Doctrine
The parallels between Offa’s Dyke, Wat’s Dyke, Car Dyke, and Wansdyke are now undeniable:
All show prehistoric (Mesolithic, Bronze Age, or Iron Age) evidence in primary contexts
All were reused, recut, or adapted by Romans, Saxons, and Medieval societies
All have been misunderstood because inherited narratives resisted revision
The story we’ve been told—that Saxon kings built these monuments as borders—is no longer sustainable.
The data demands a paradigm shift. (Twigs, Charcoal, and the Death of the Saxon Dyke Myth)
References
Hannaford, H.R. (1997), SCCAS Report no. 111, An Interim Report on Archaeological Excavations on Wat’s Dyke at Maes-y-Clawdd, Oswestry.
Malim, T. & Hayes, L. (2008), The Date and Nature of Wat’s Dyke: a reassessment in the light of recent investigations at Gobowen, Shropshire, ASSAH 15.
Malim, T., Hoggard, C., et al. (2021). “Offa’s Dyke and Wat’s Dyke: Scientific Dating at Chirk and Erddig, North Wales.” Archaeologia Cambrensis, 170, pp. 93–117.
Langdon, R.J. (2024), Car Dyke: The Lost Waterways of Prehistoric Britain.


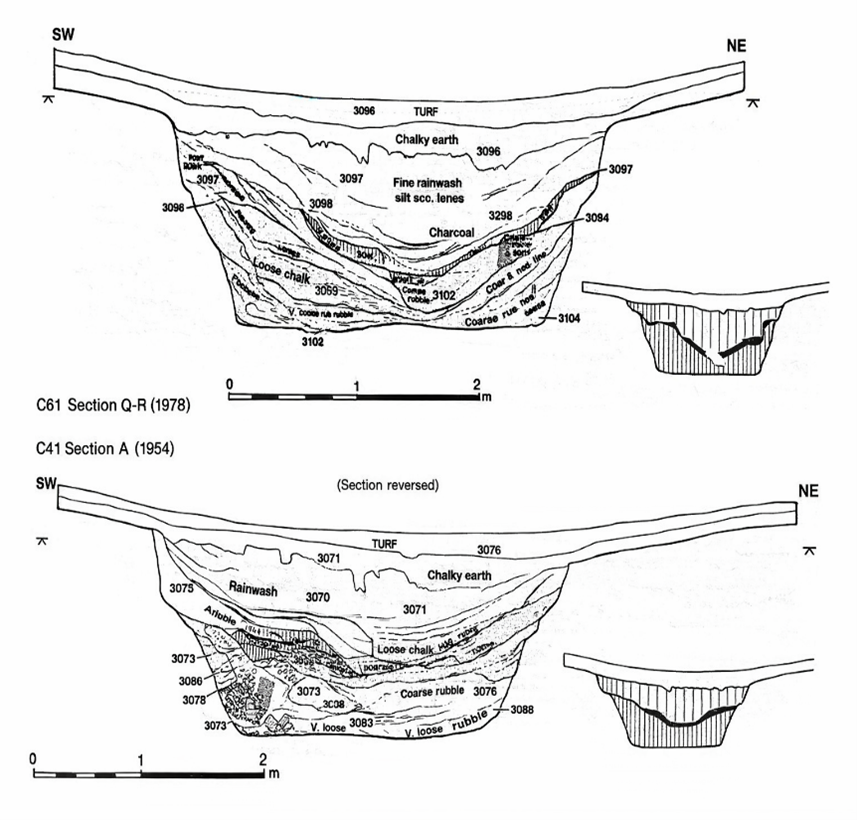
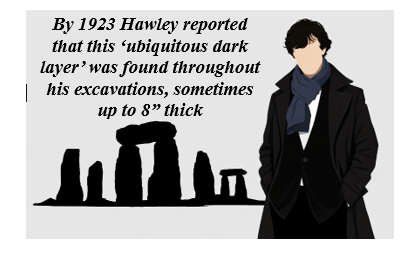
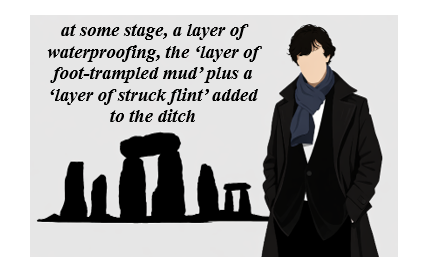
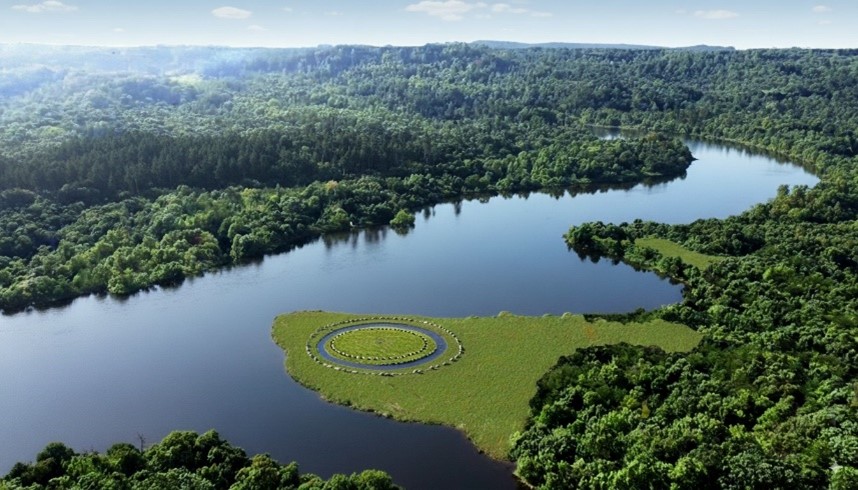
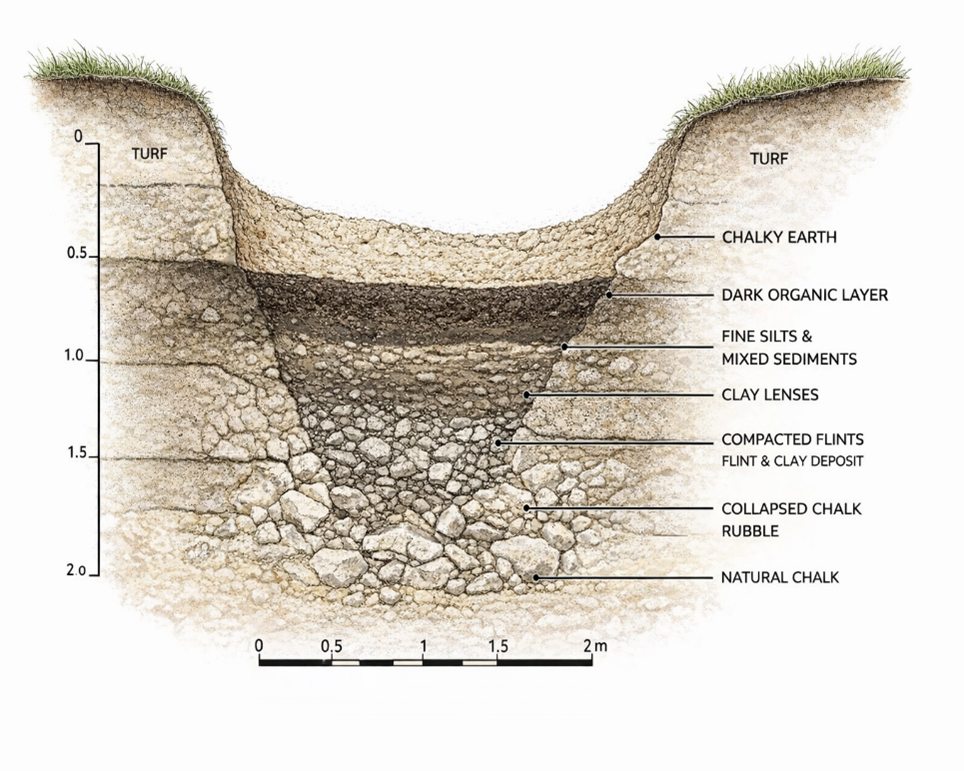
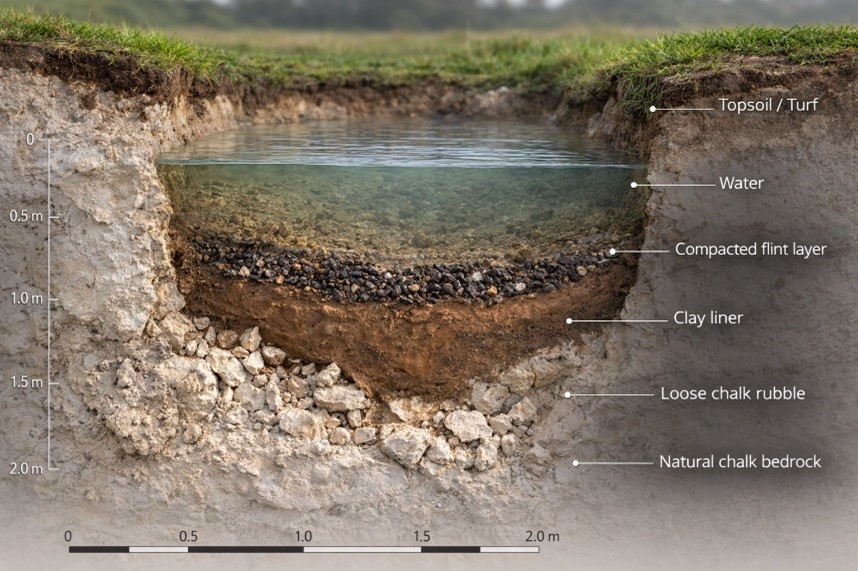
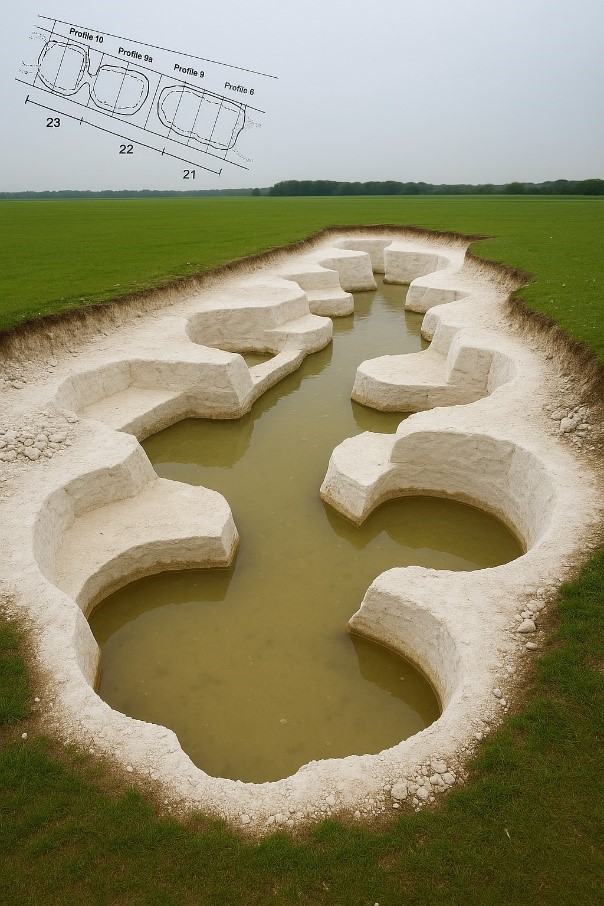
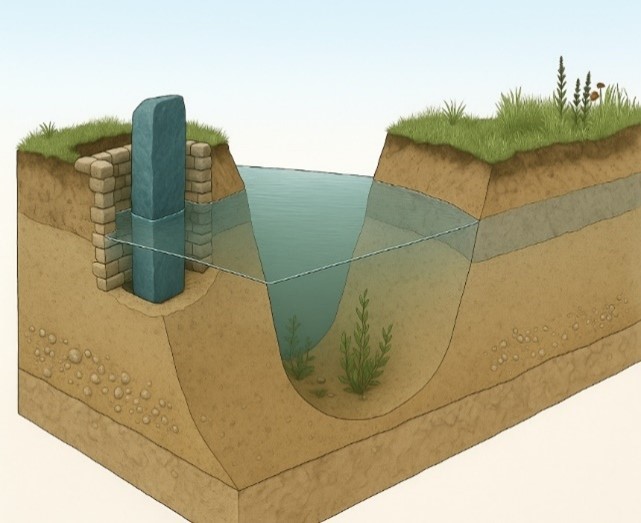
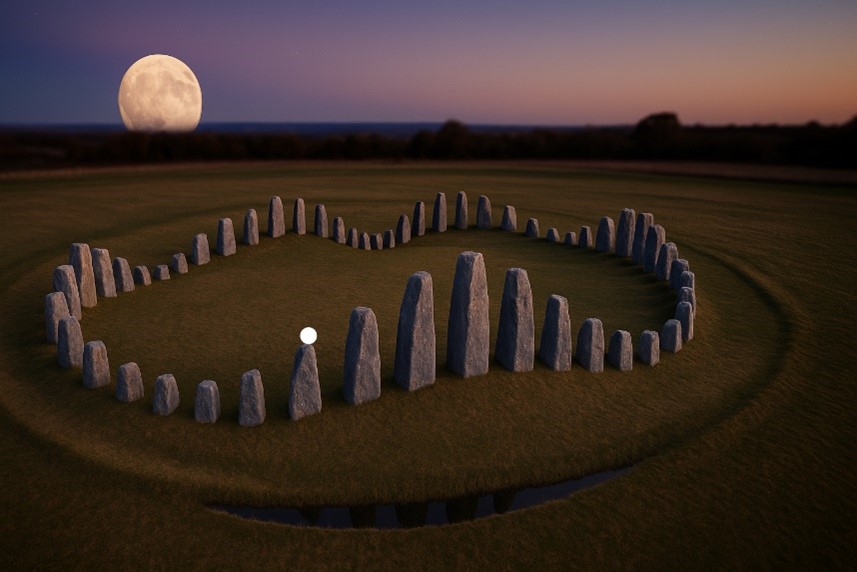

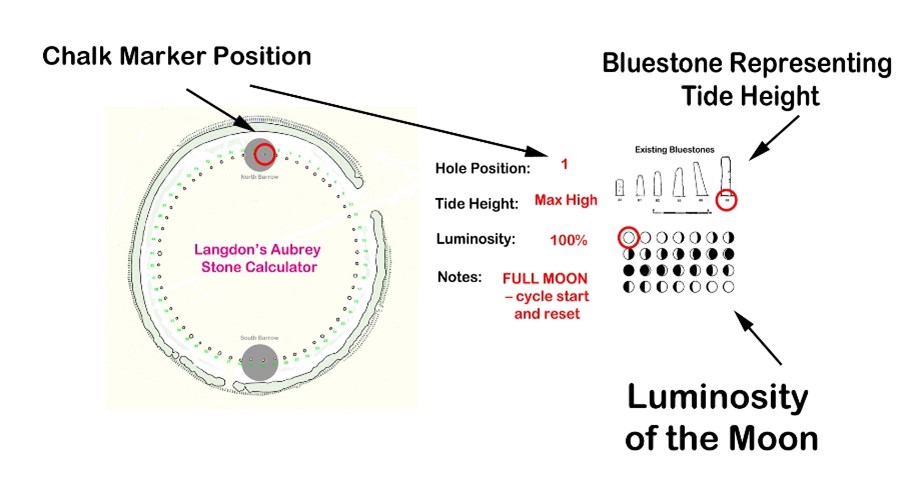
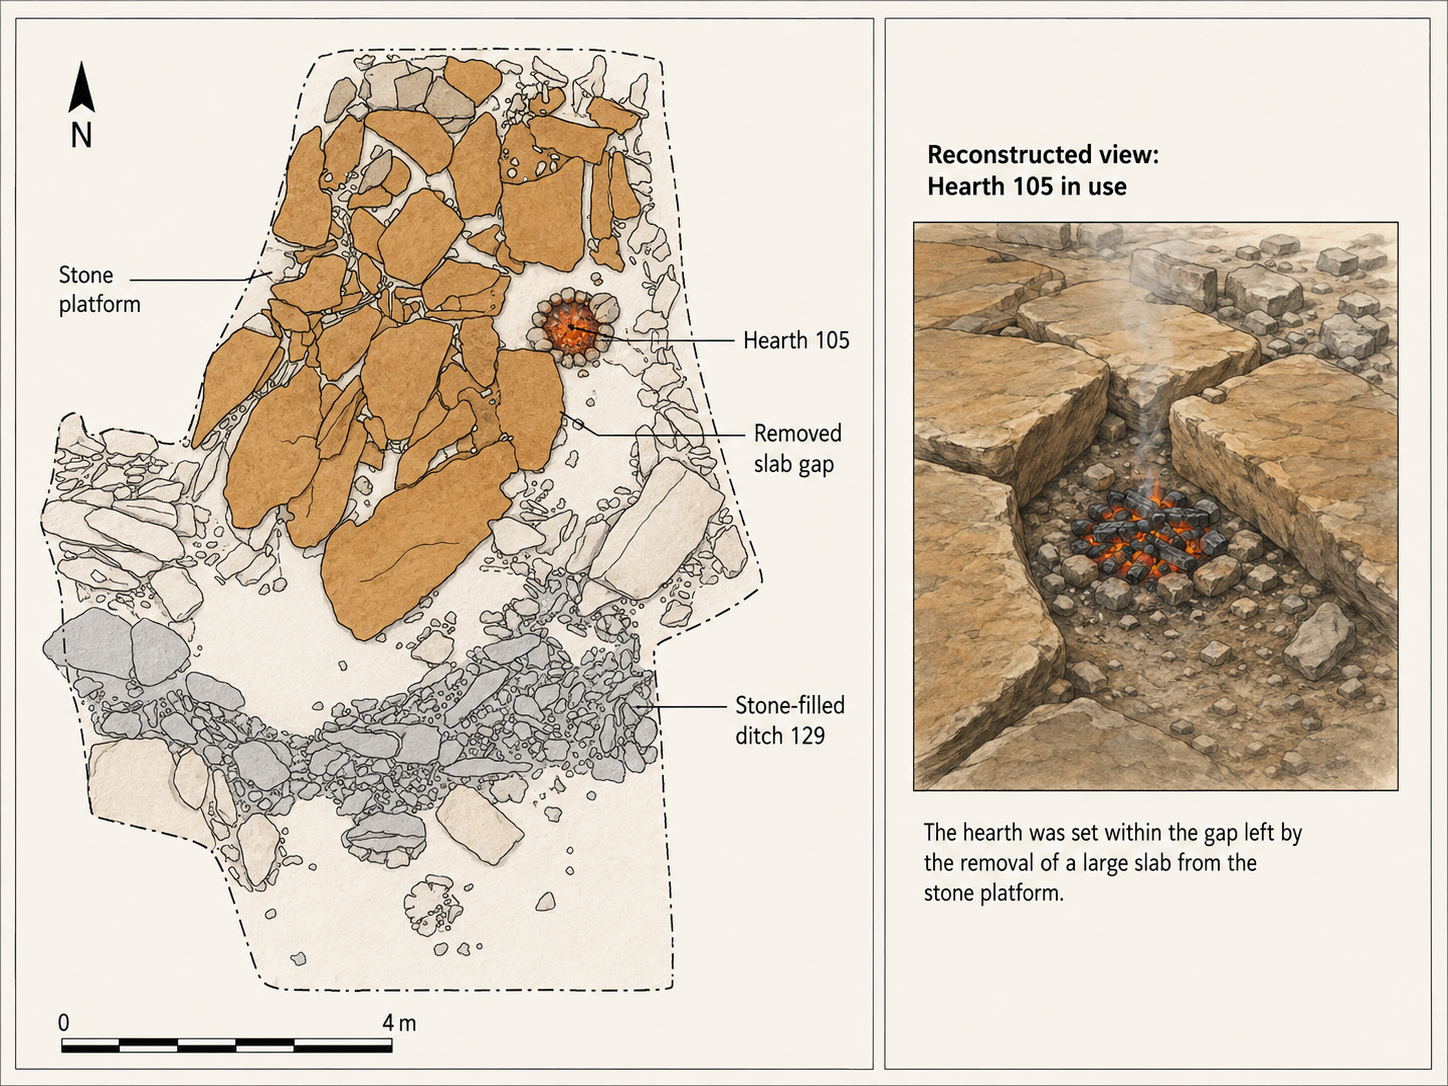


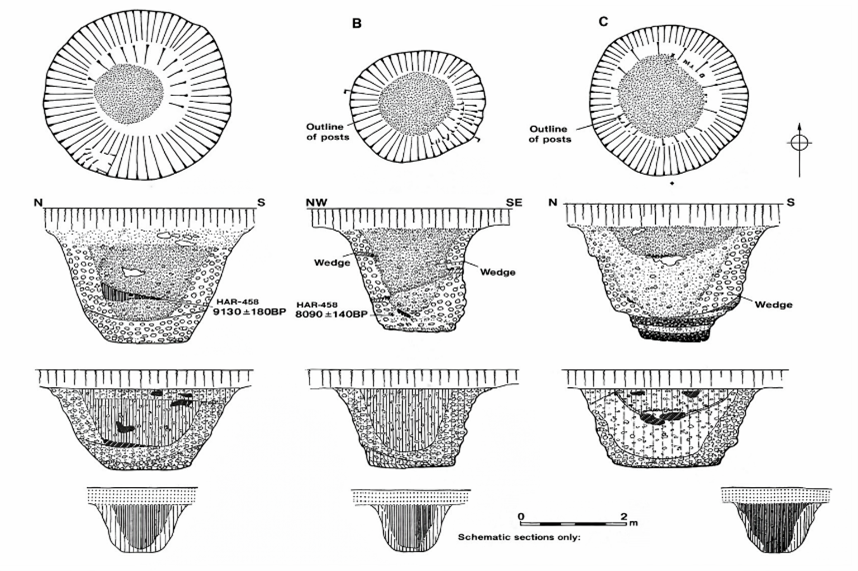
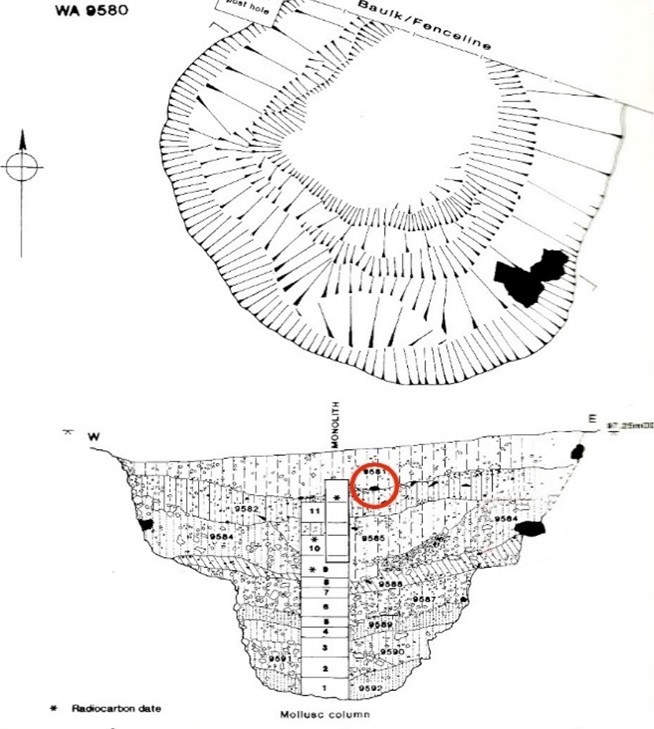
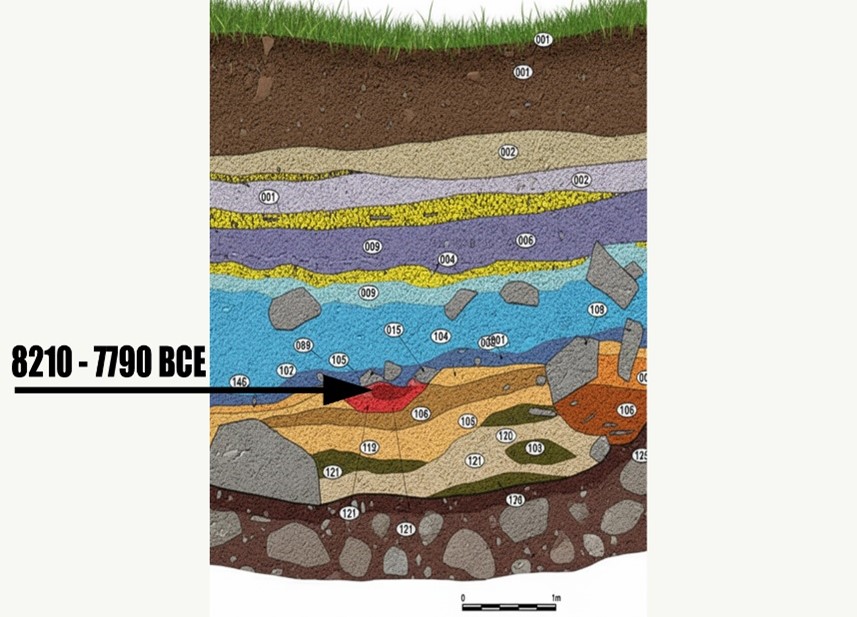
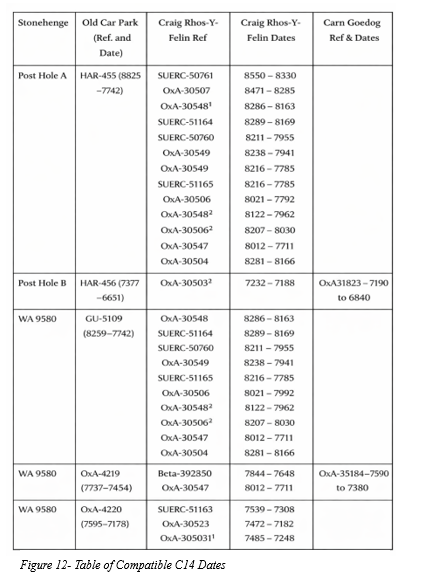
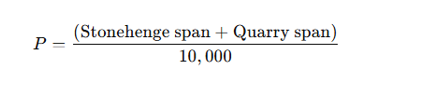

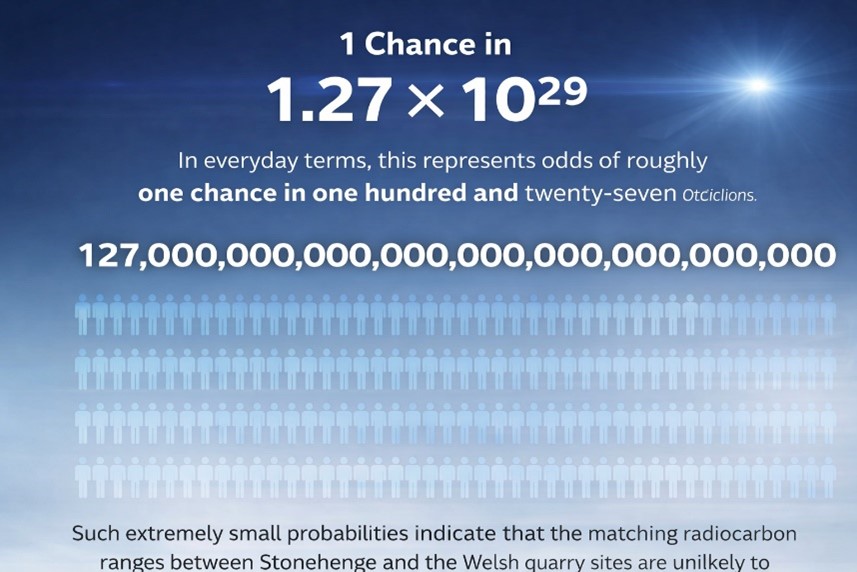

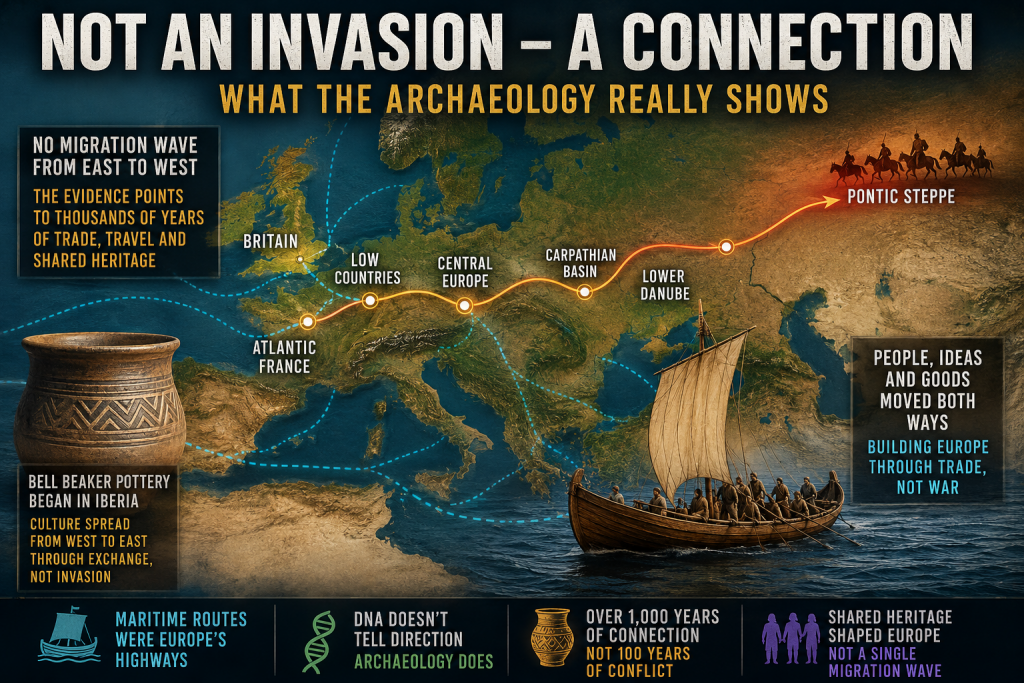

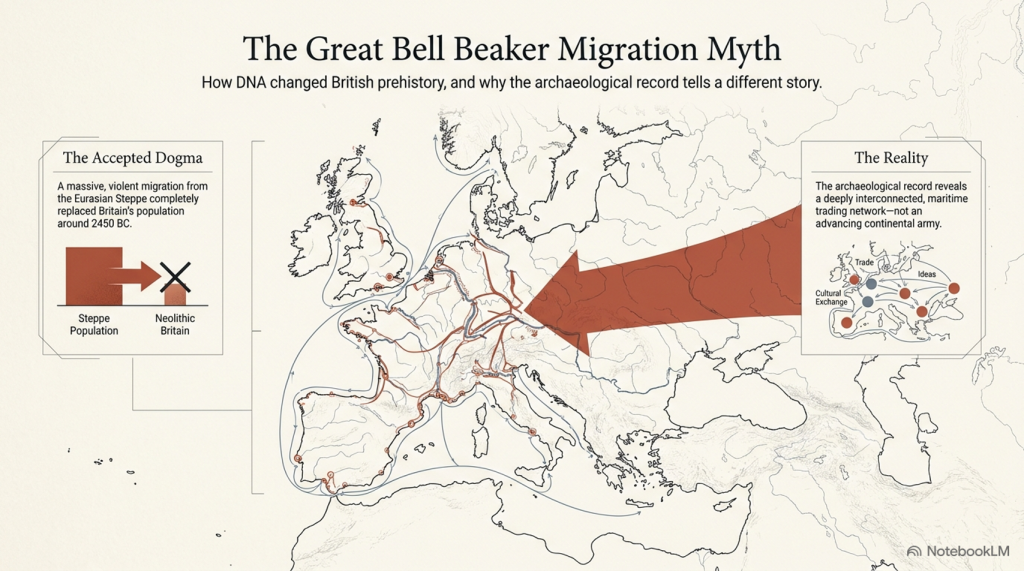
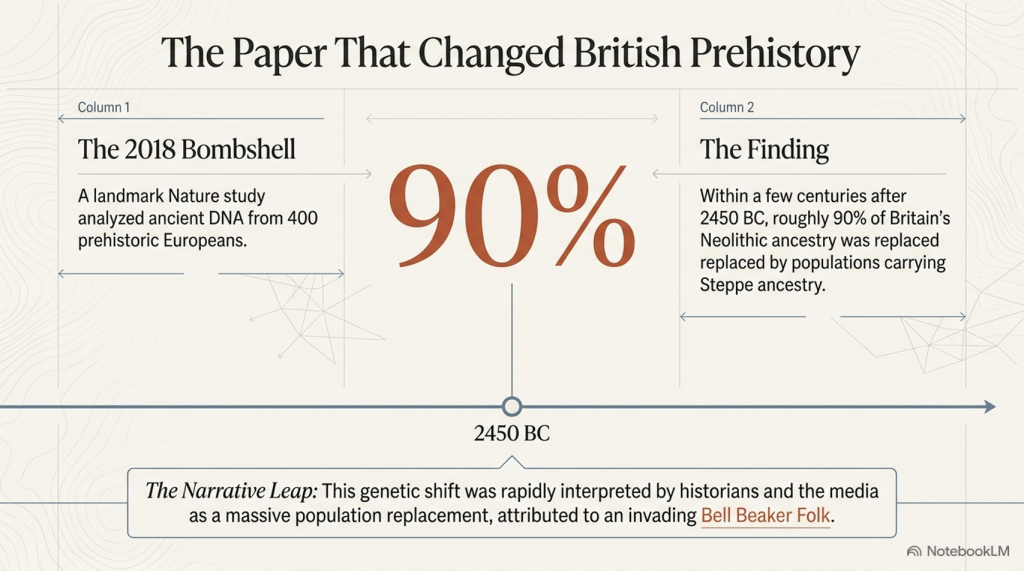
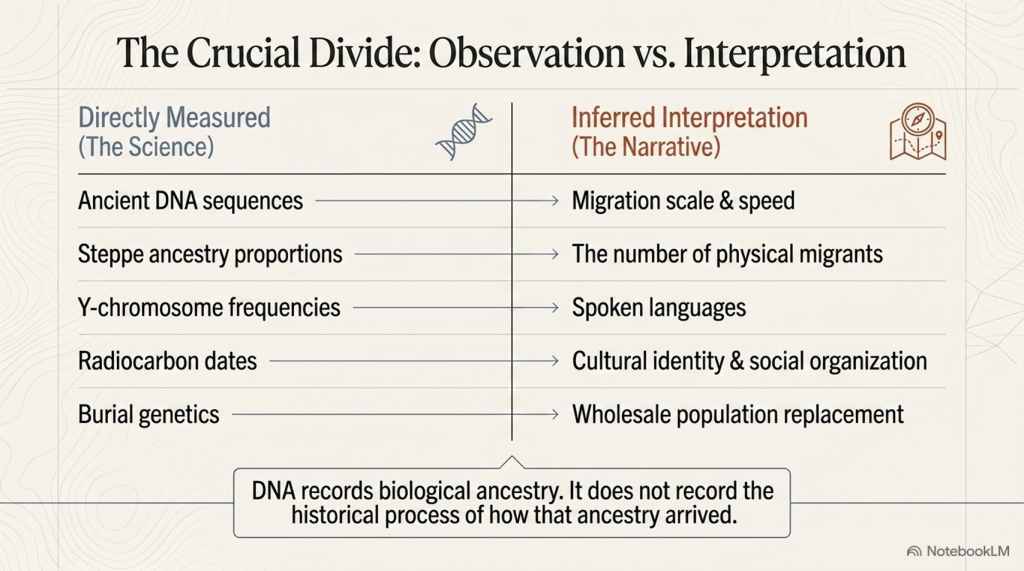
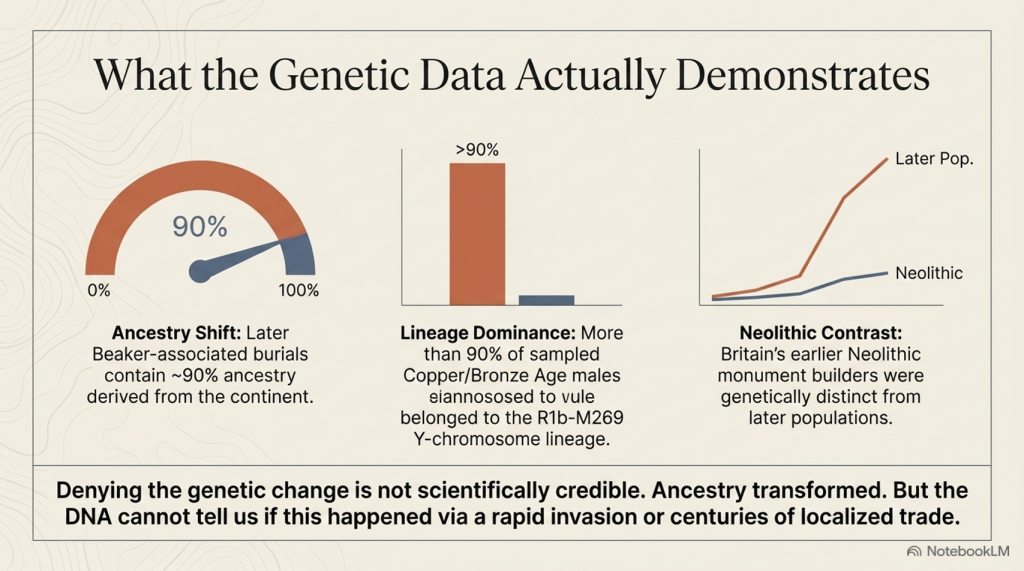
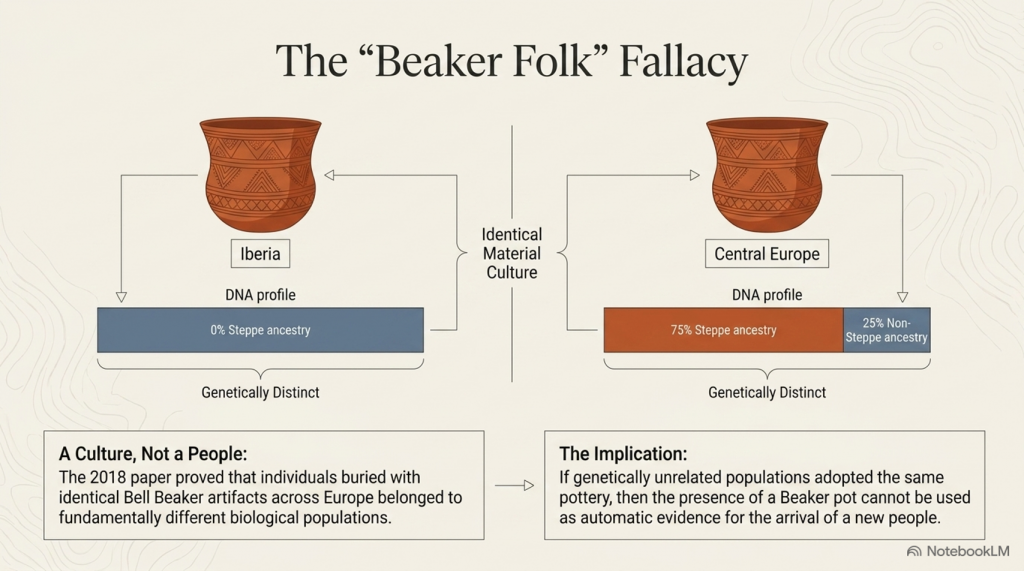
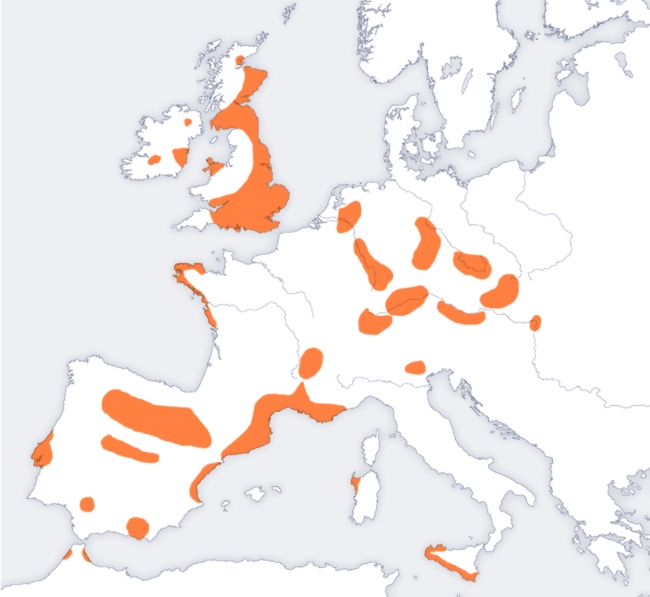
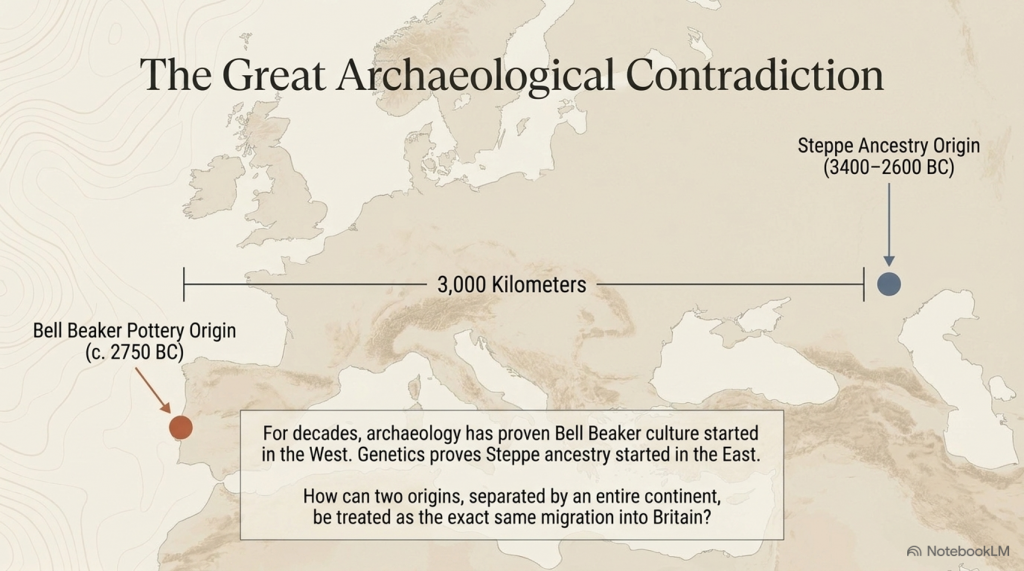
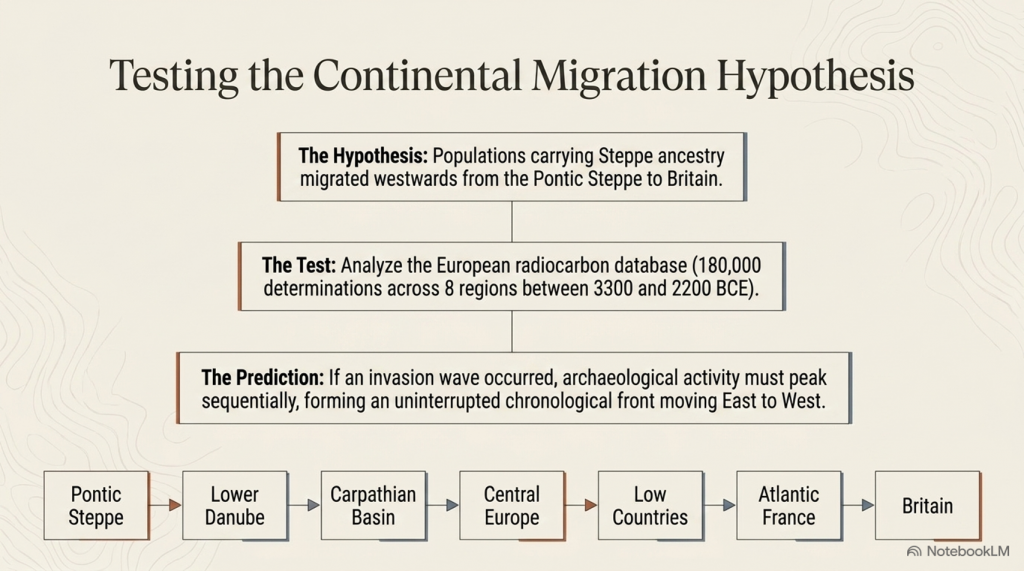
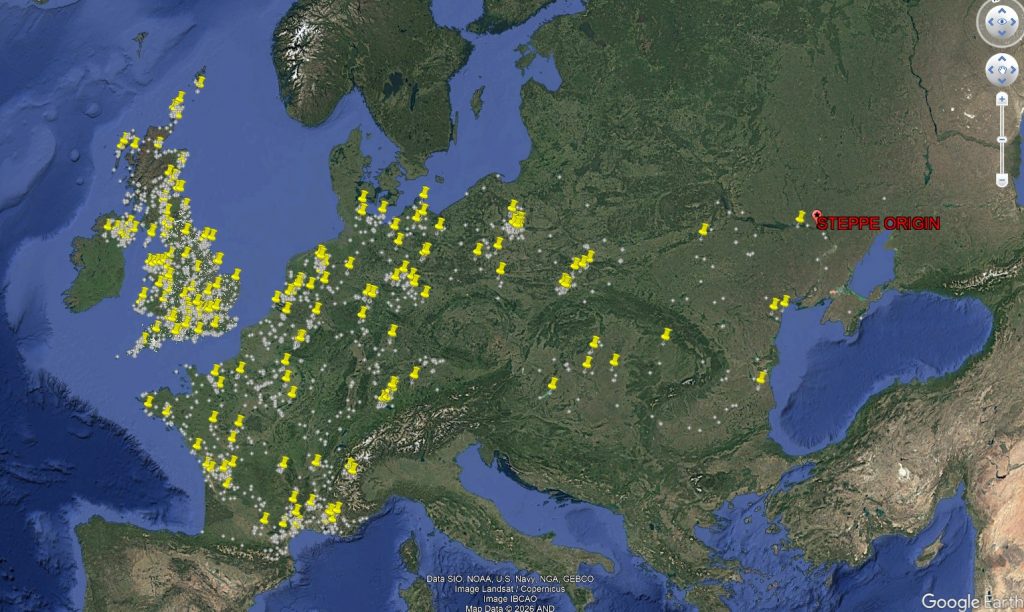
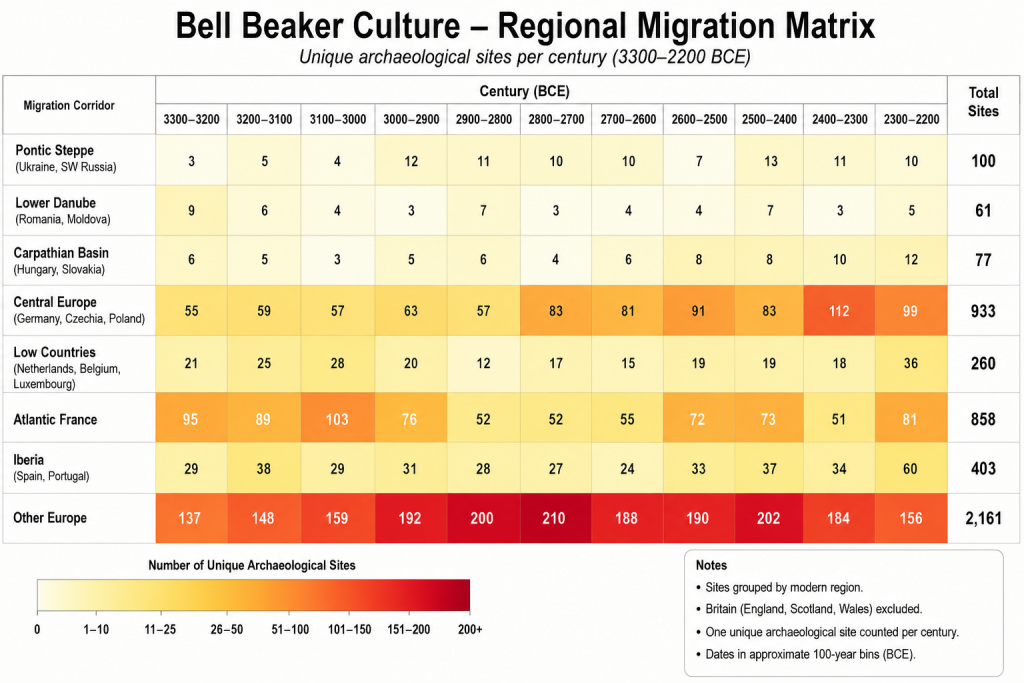
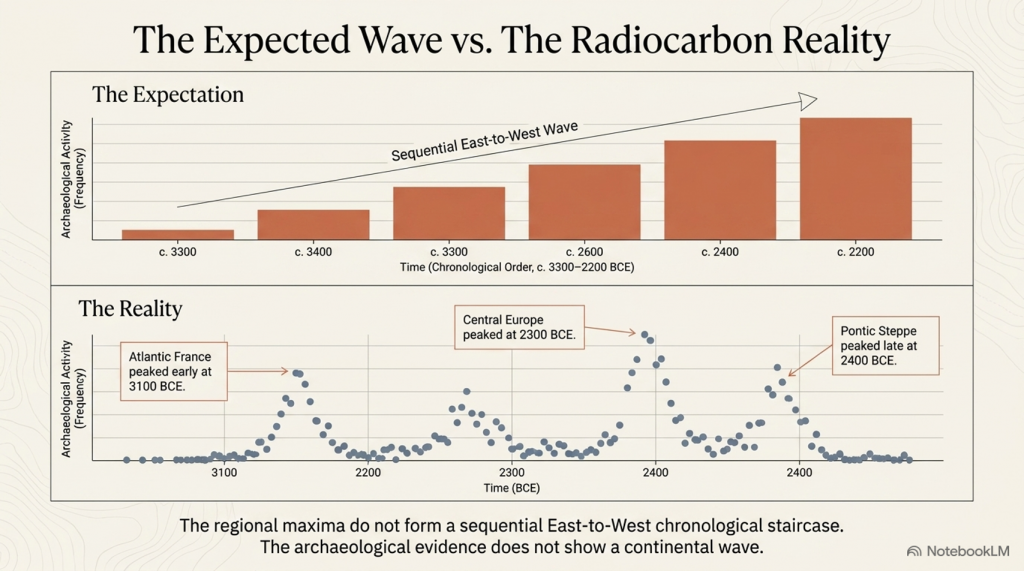
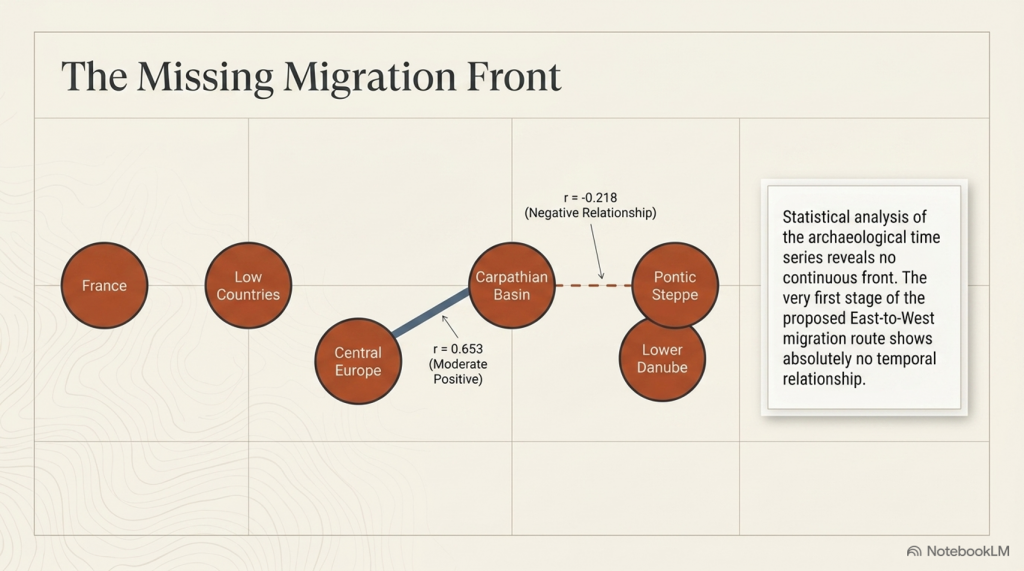
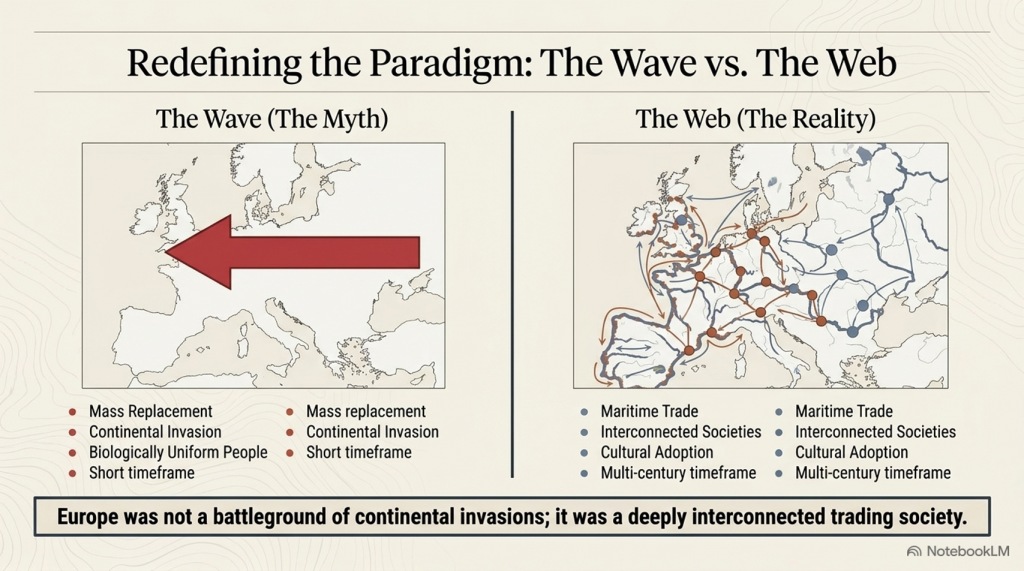
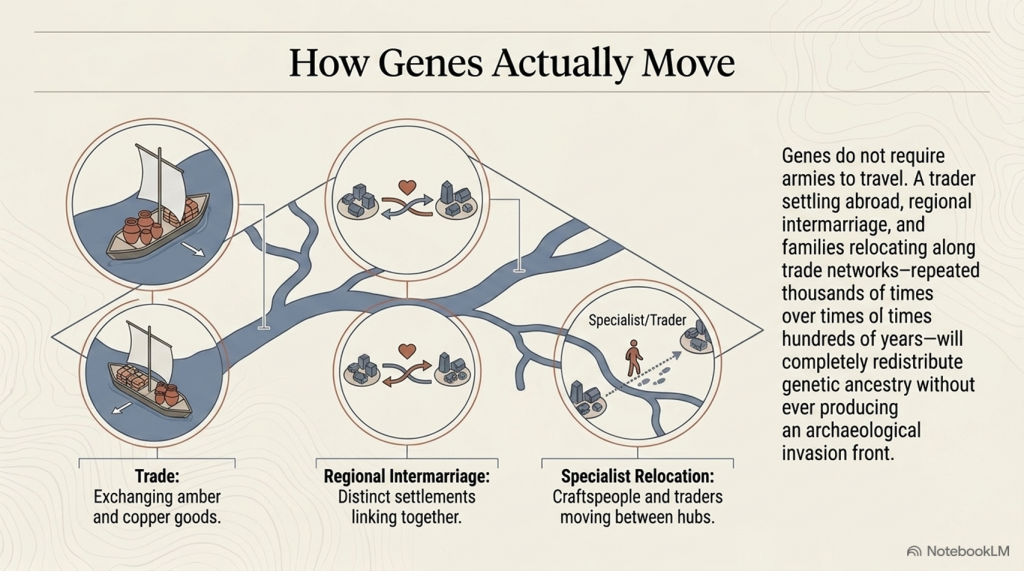
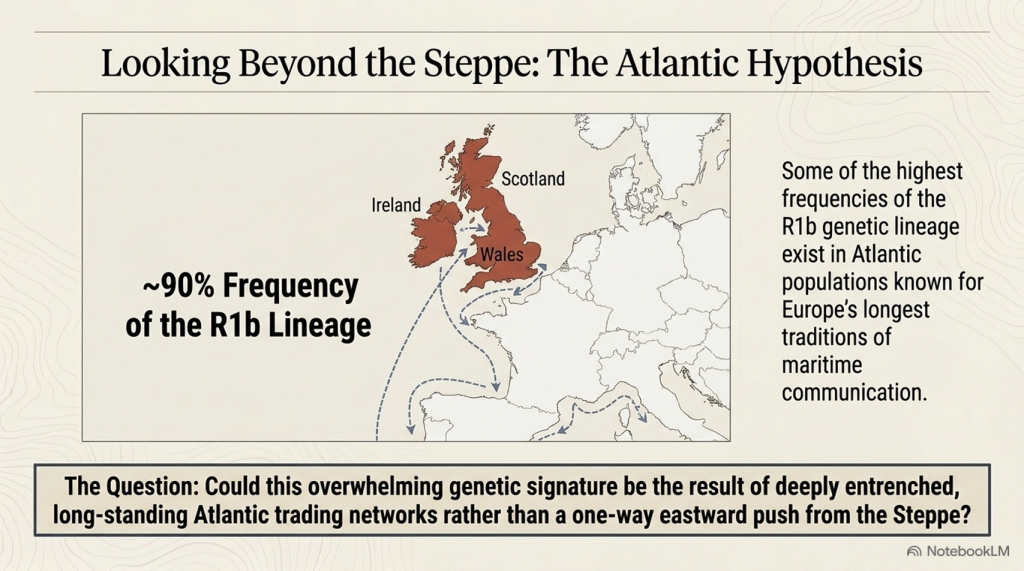
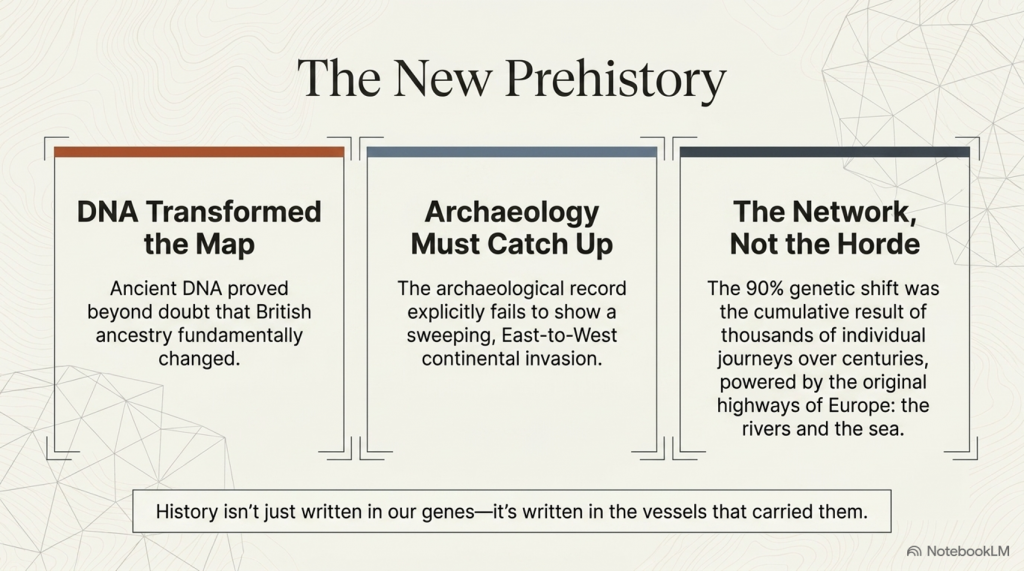
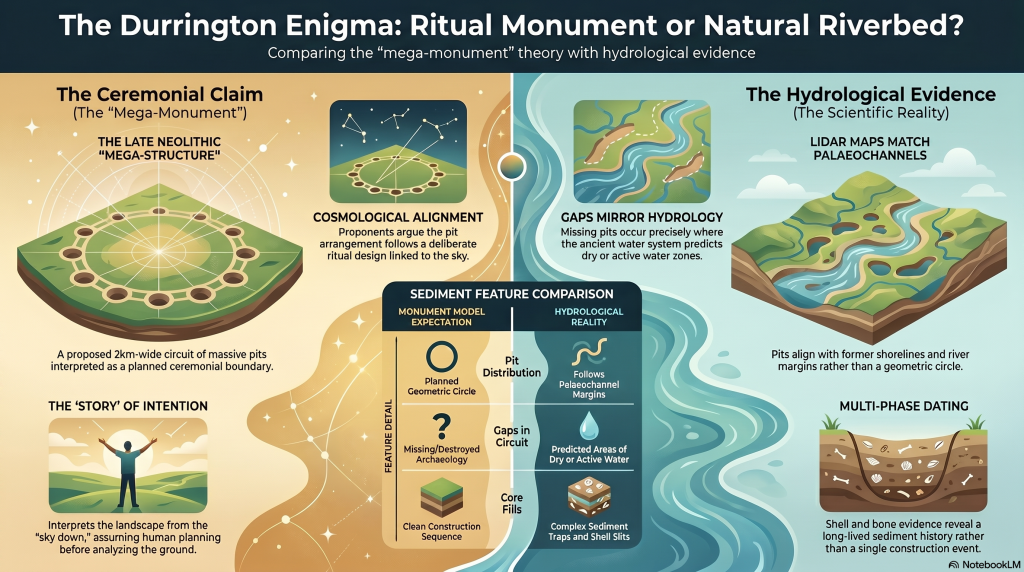
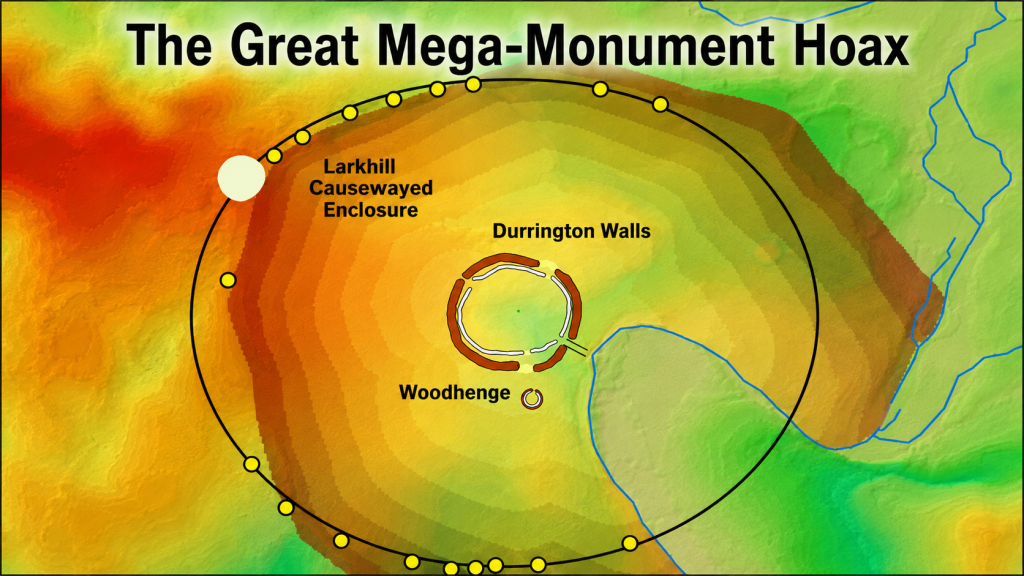
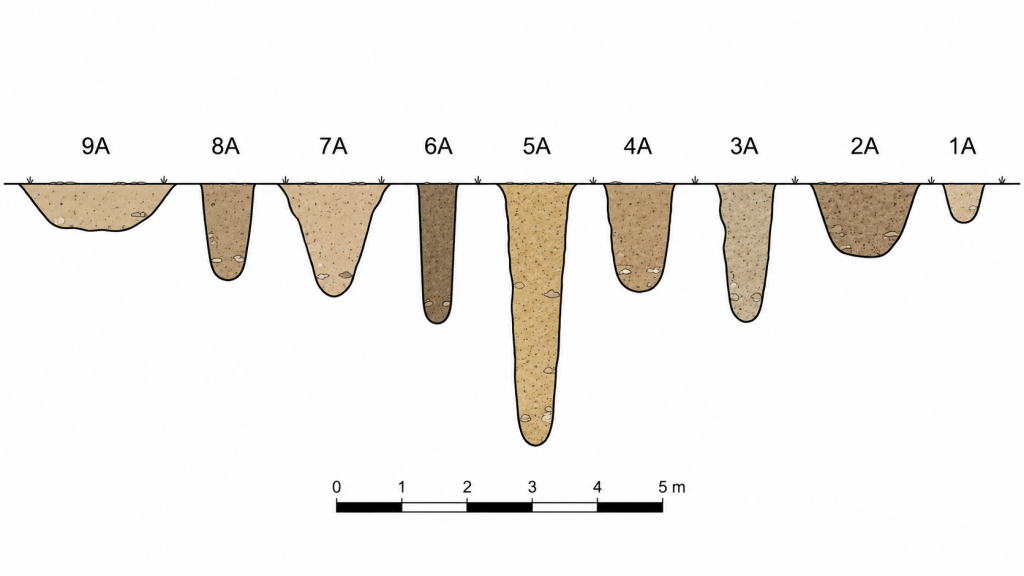
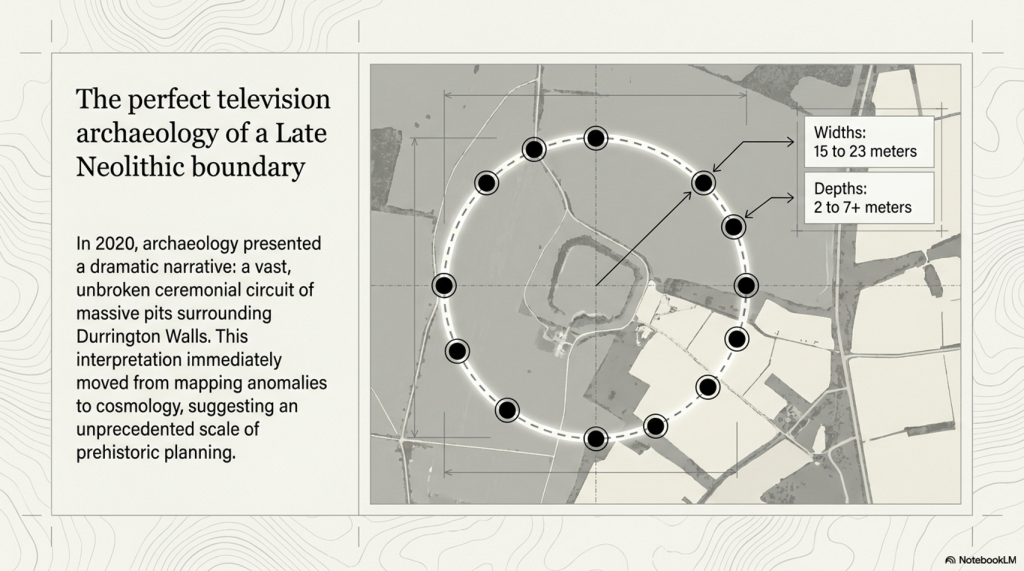
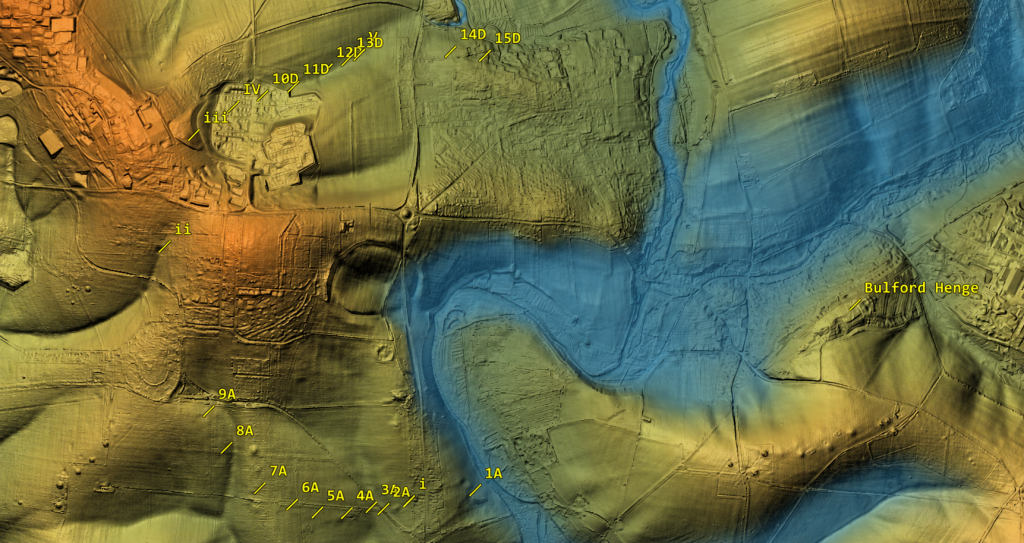
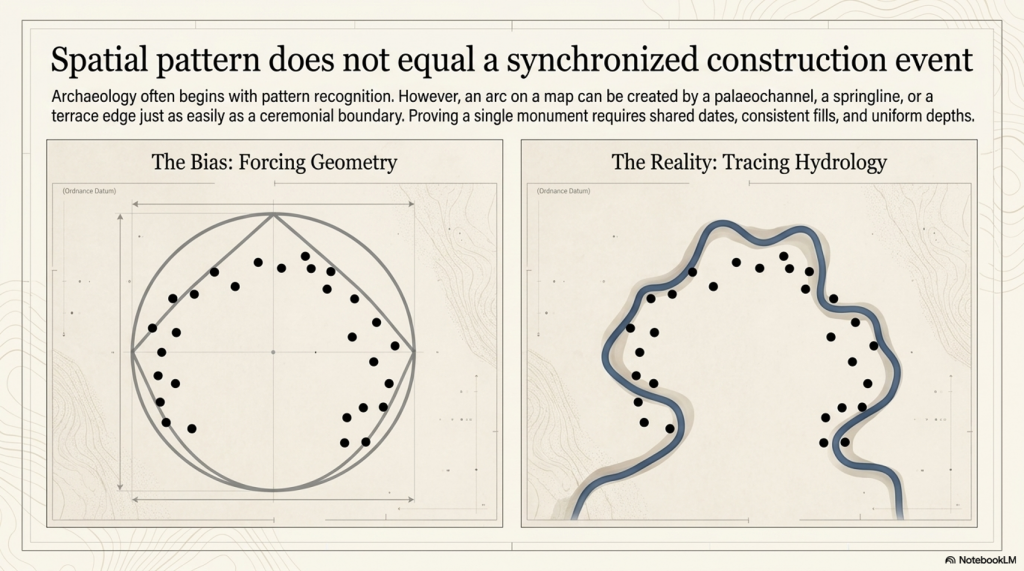
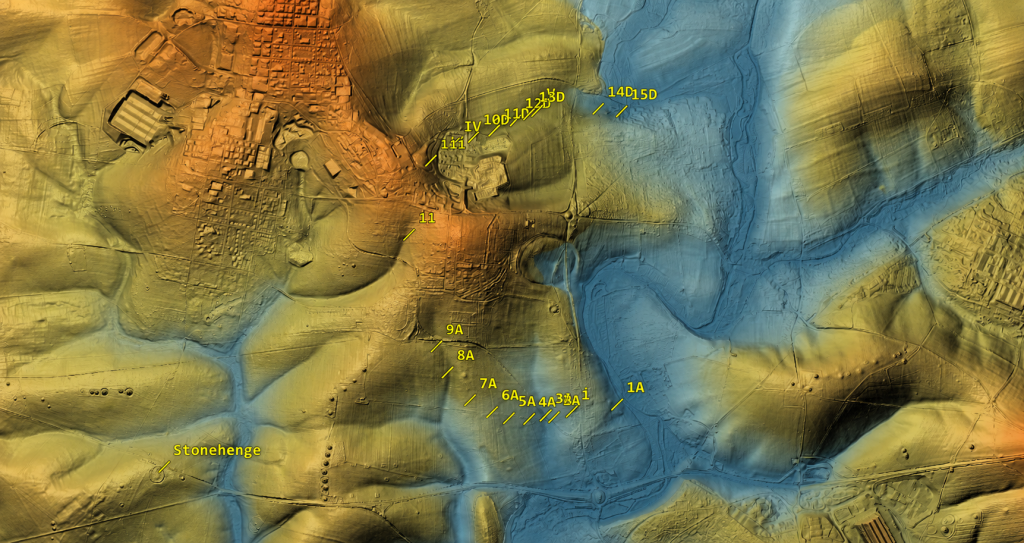
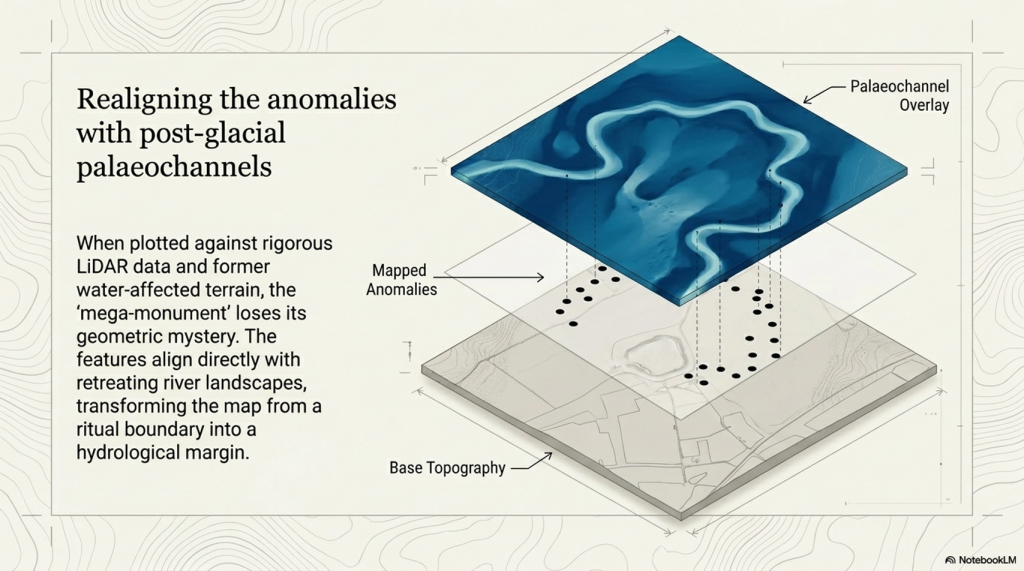
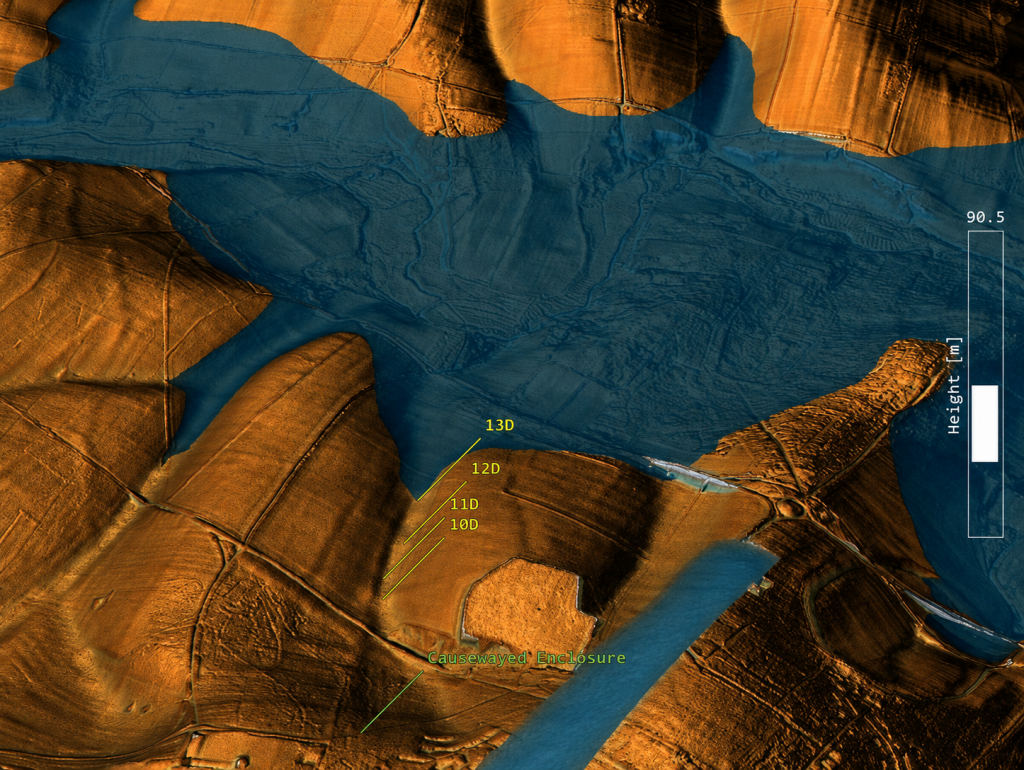
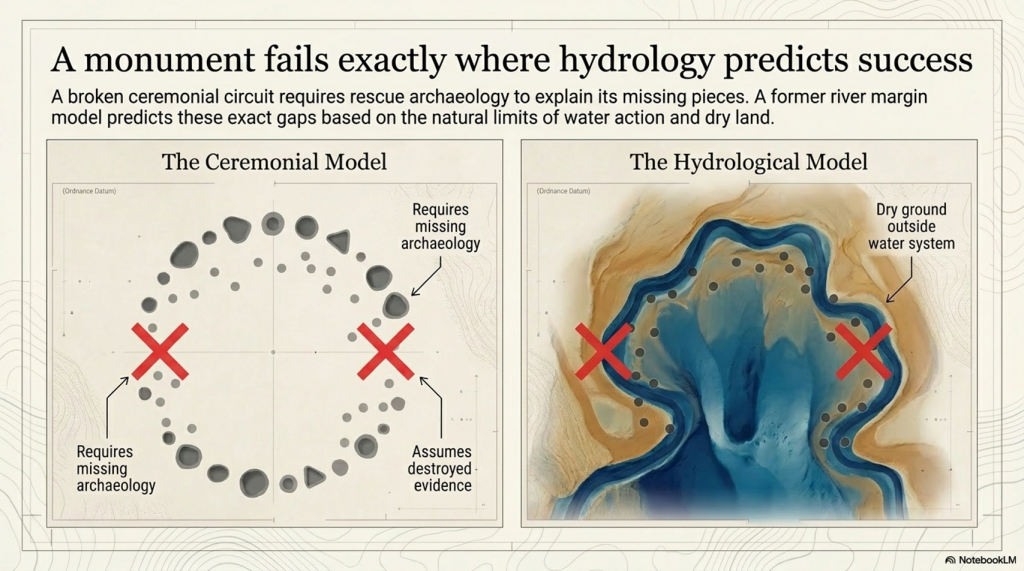
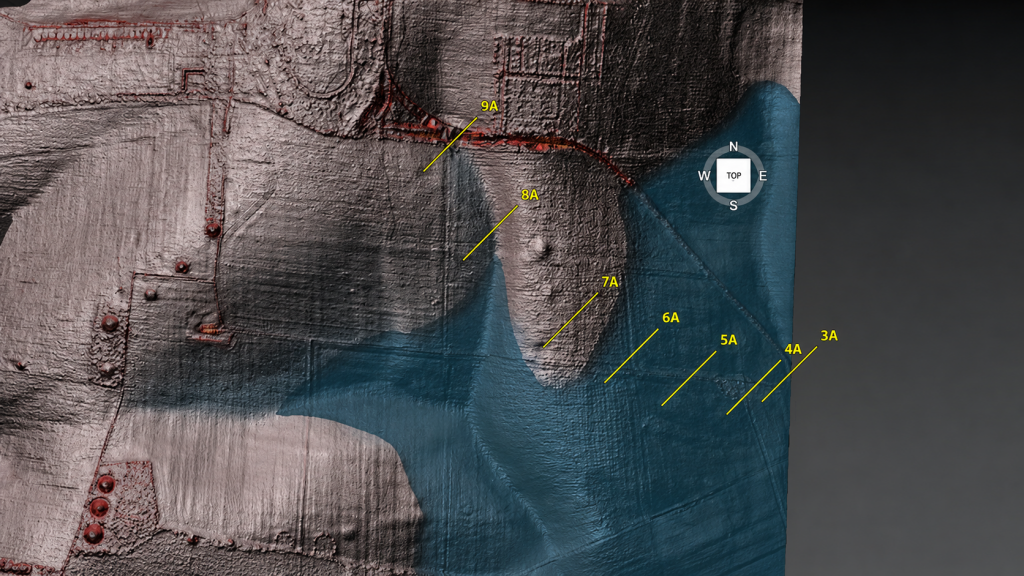
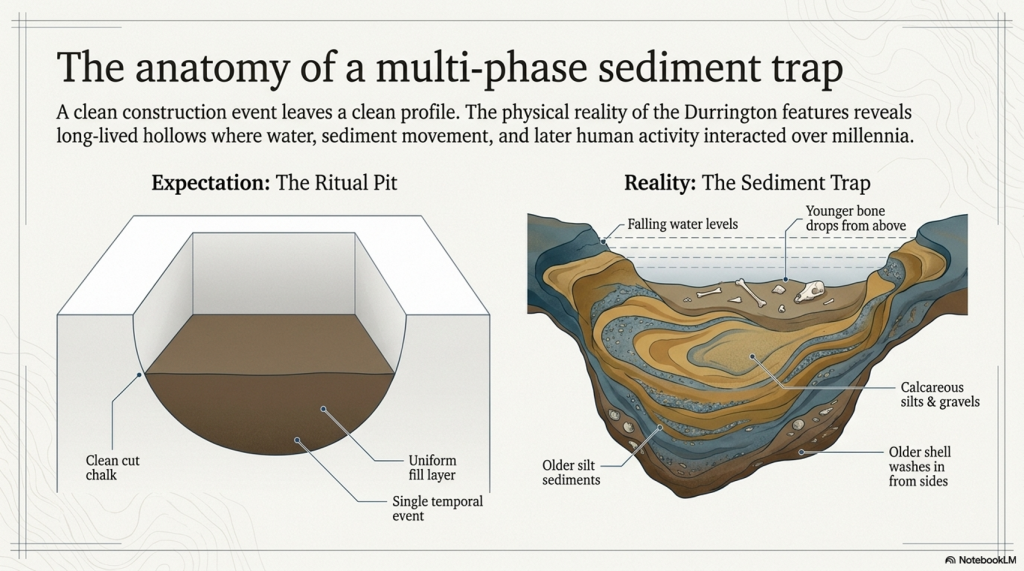
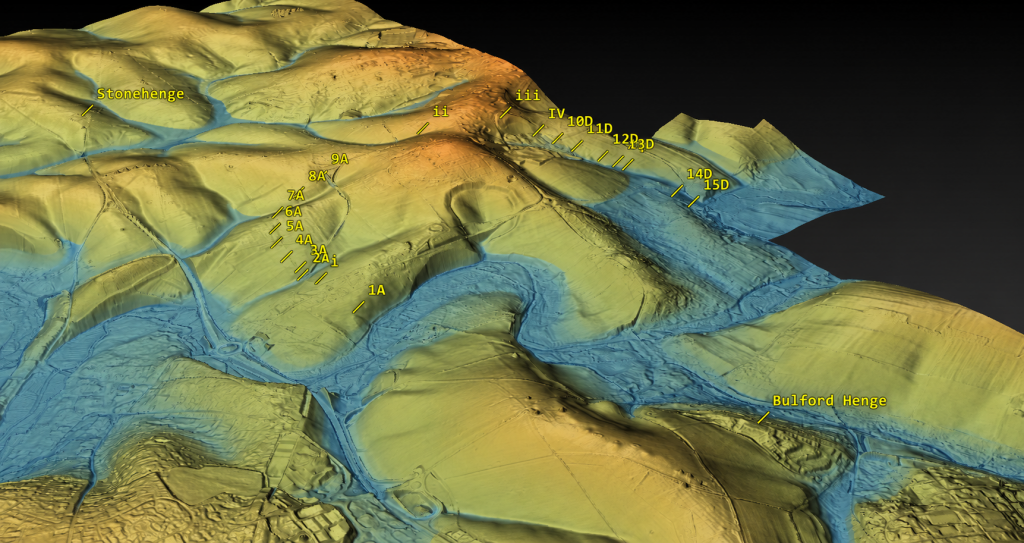
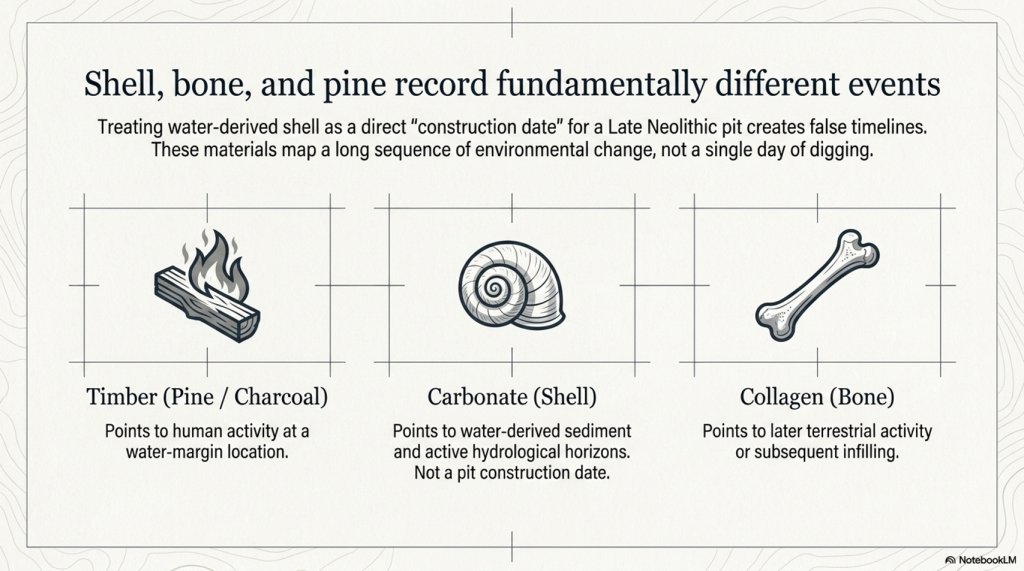
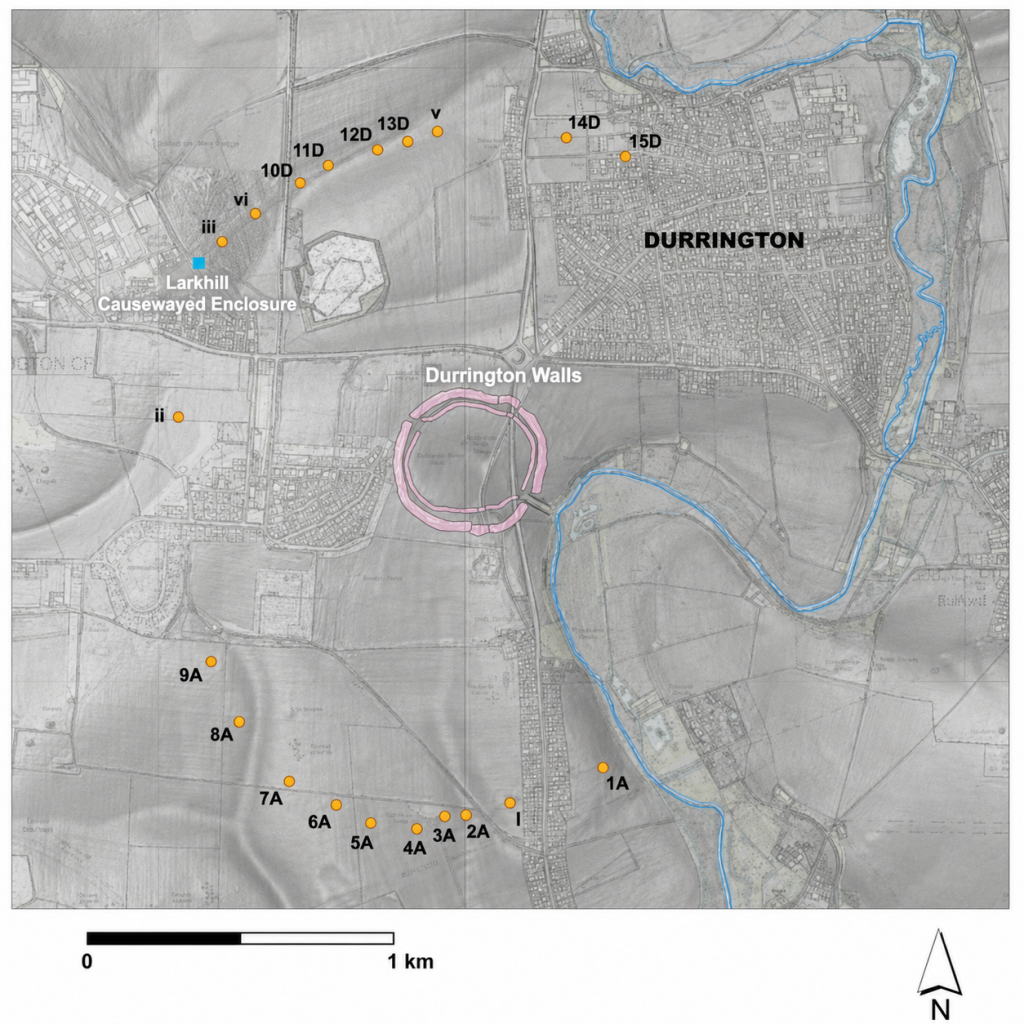
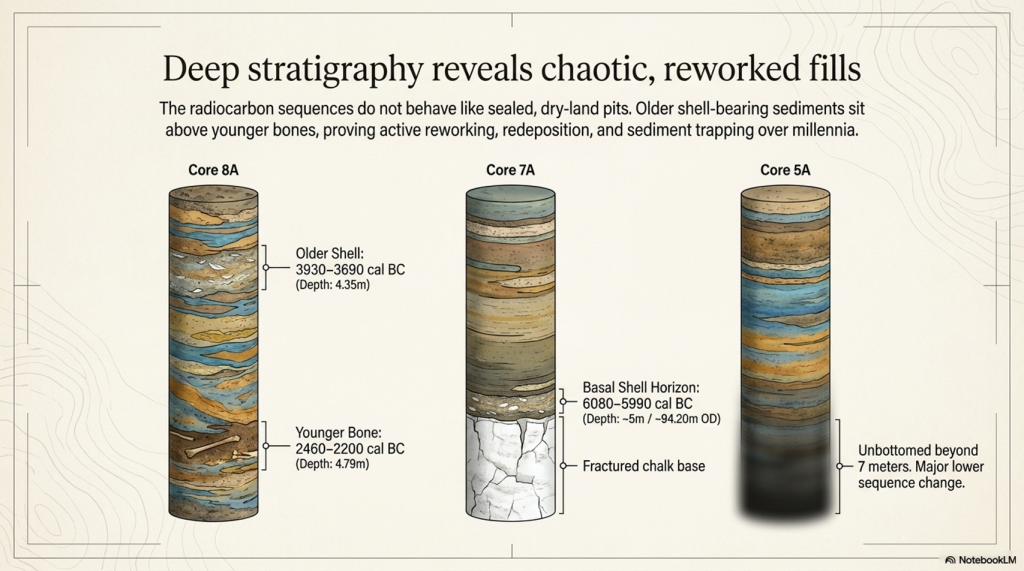
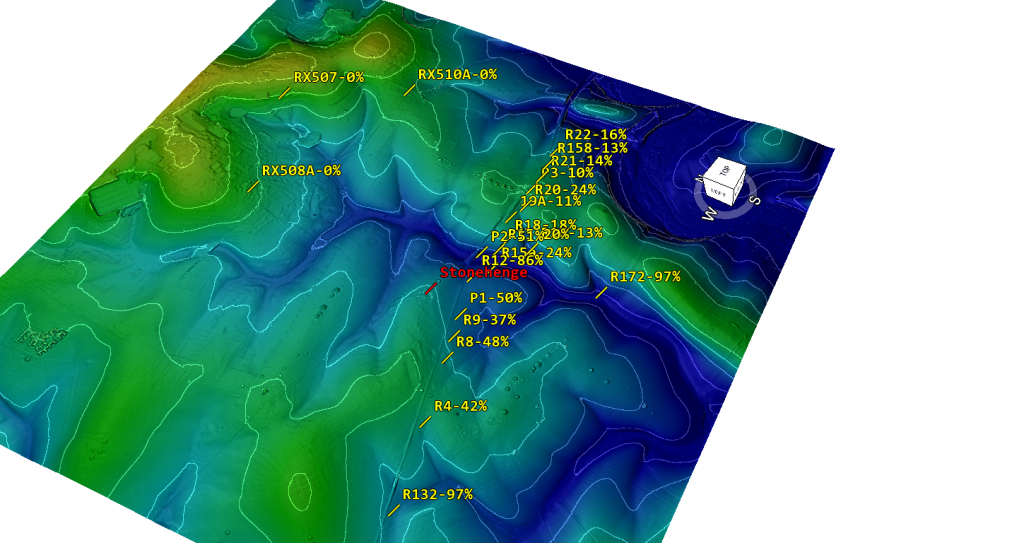
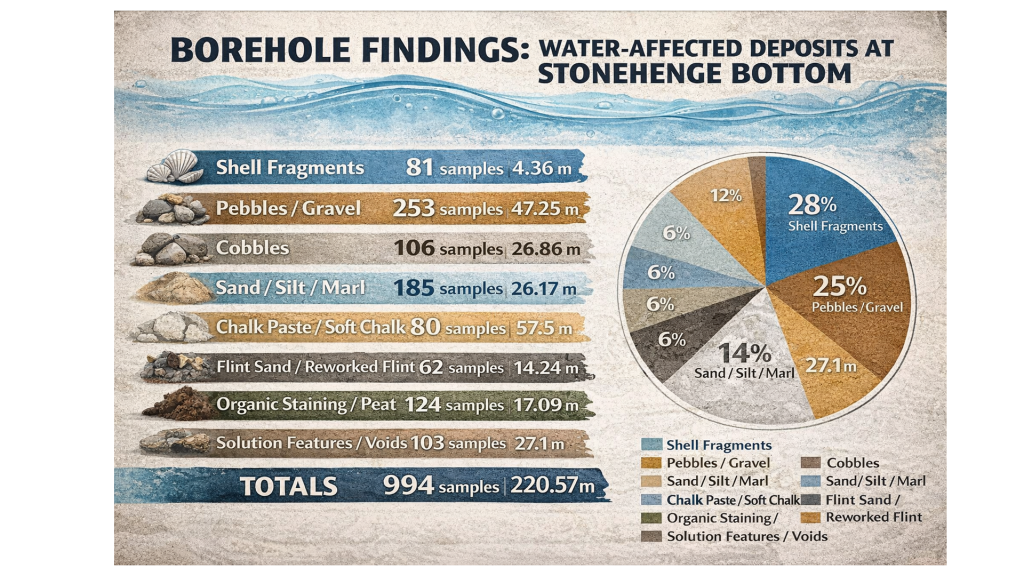
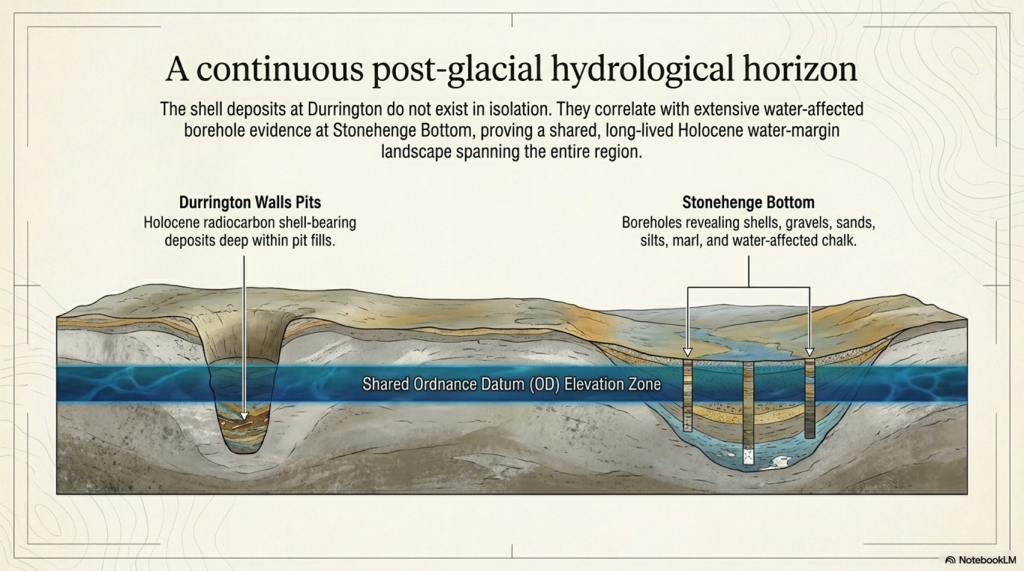
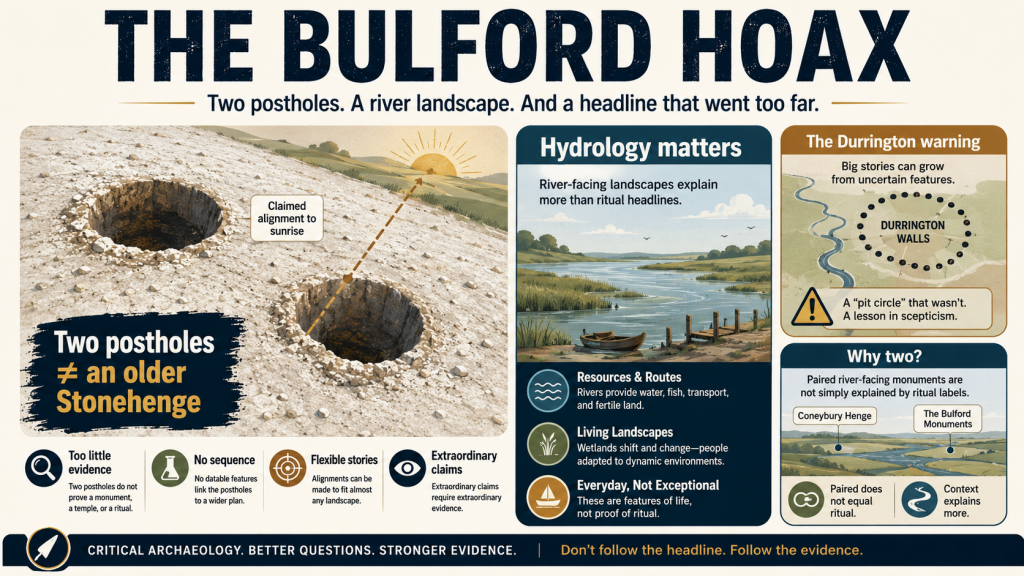
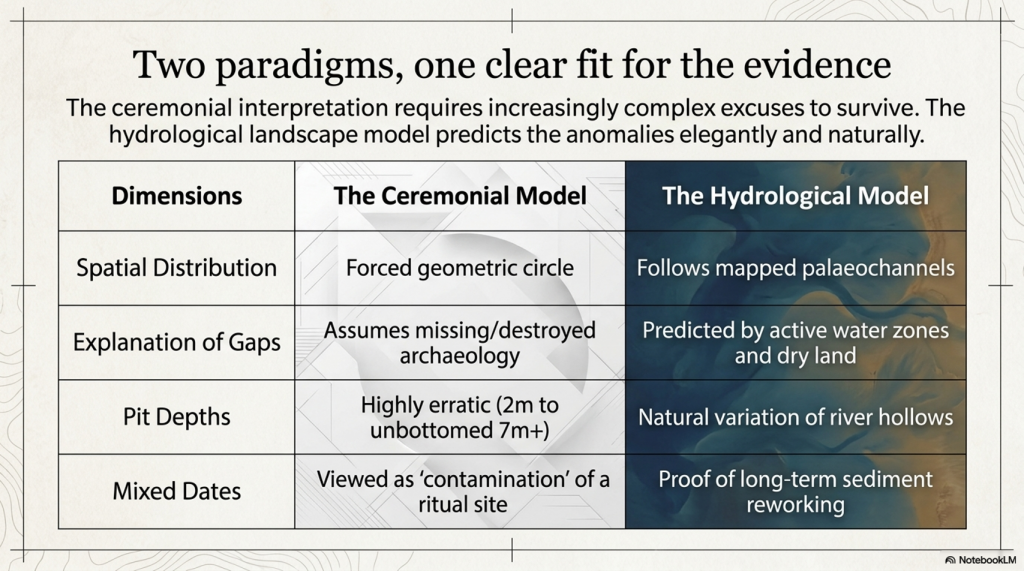
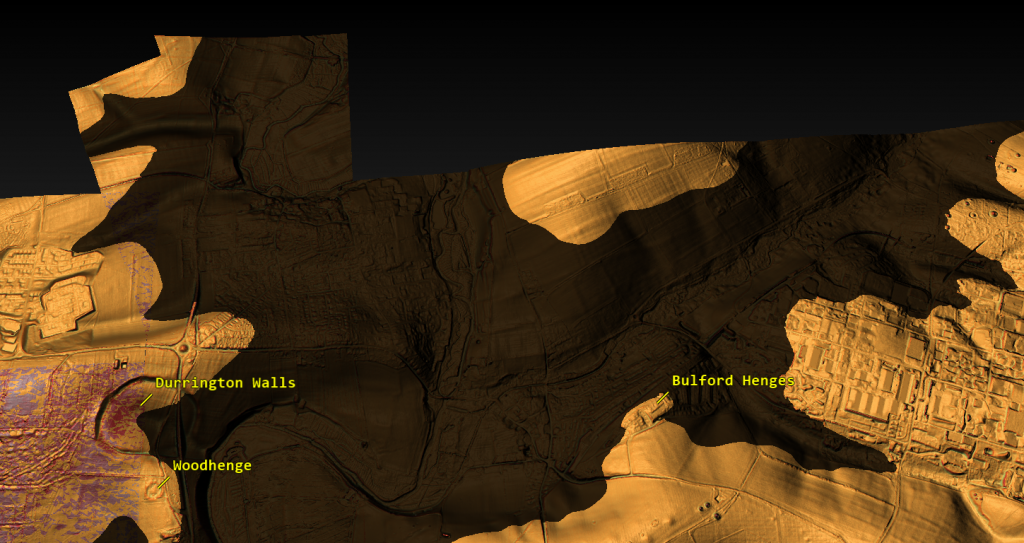
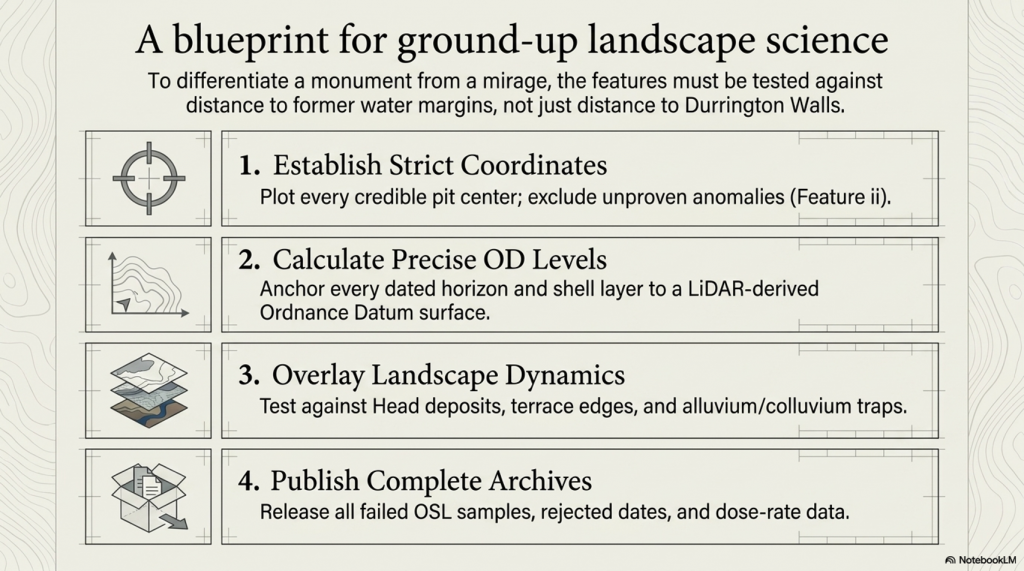
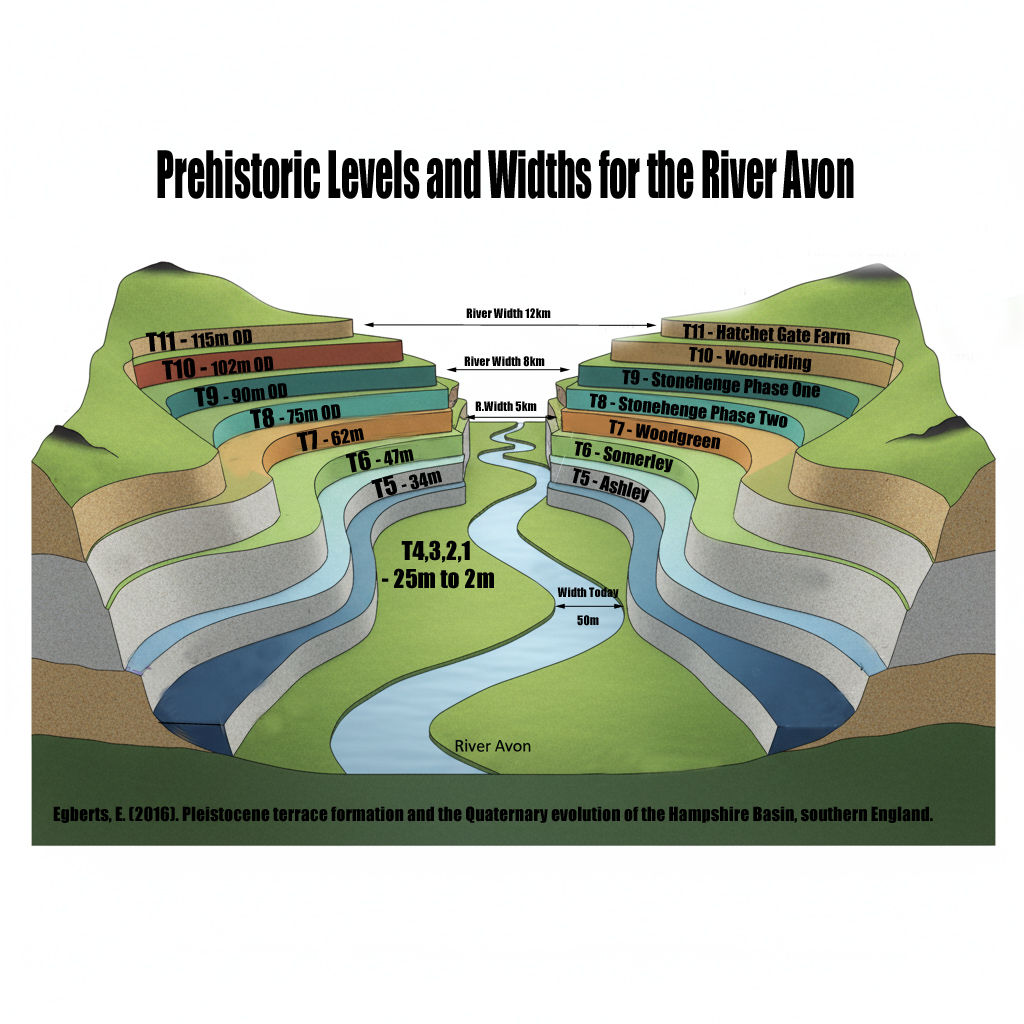
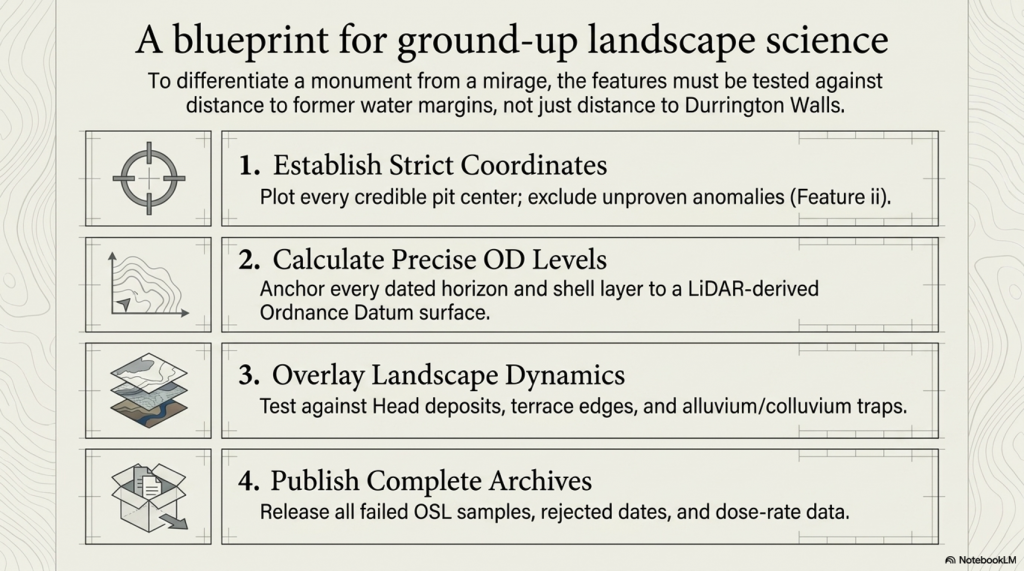
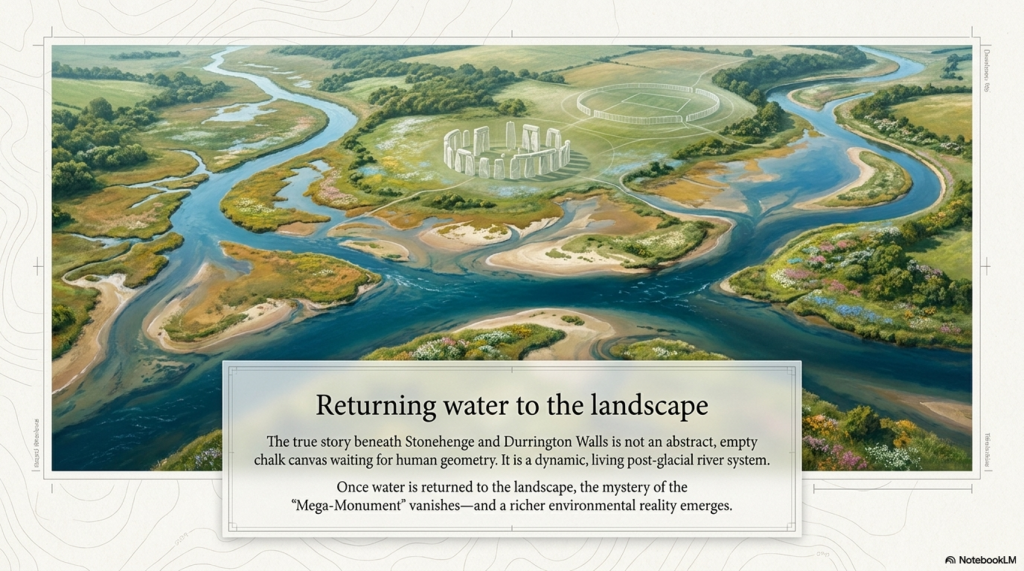
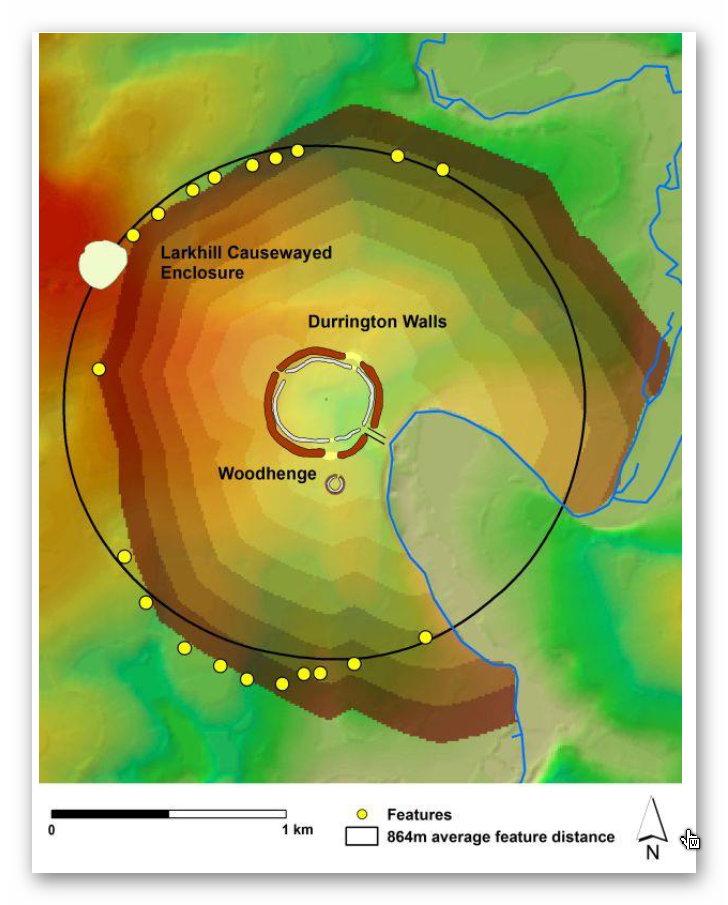
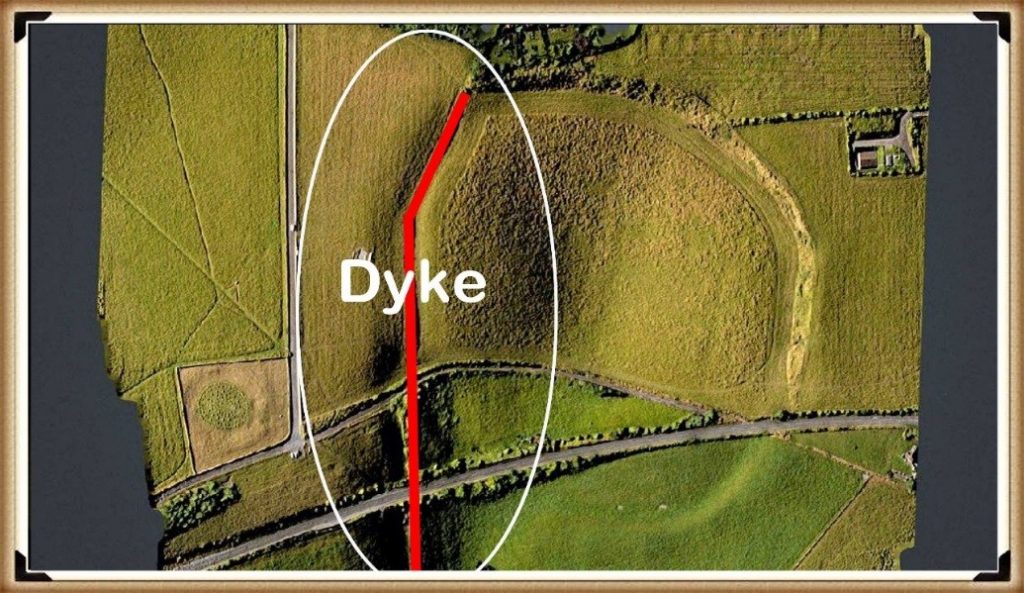
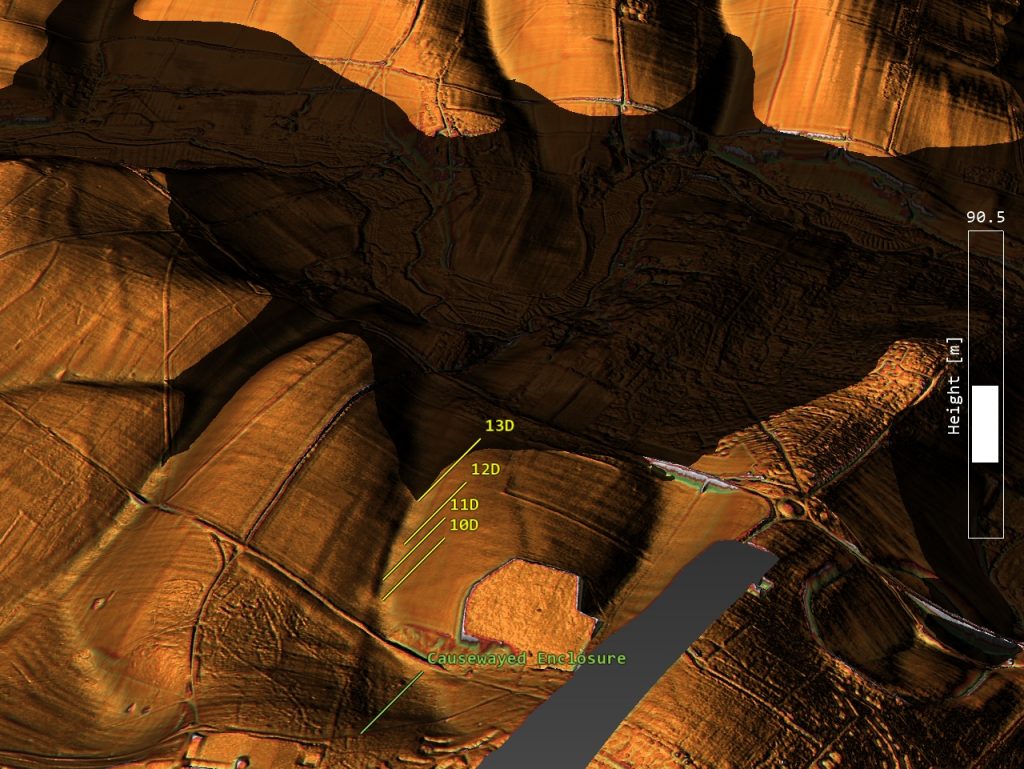
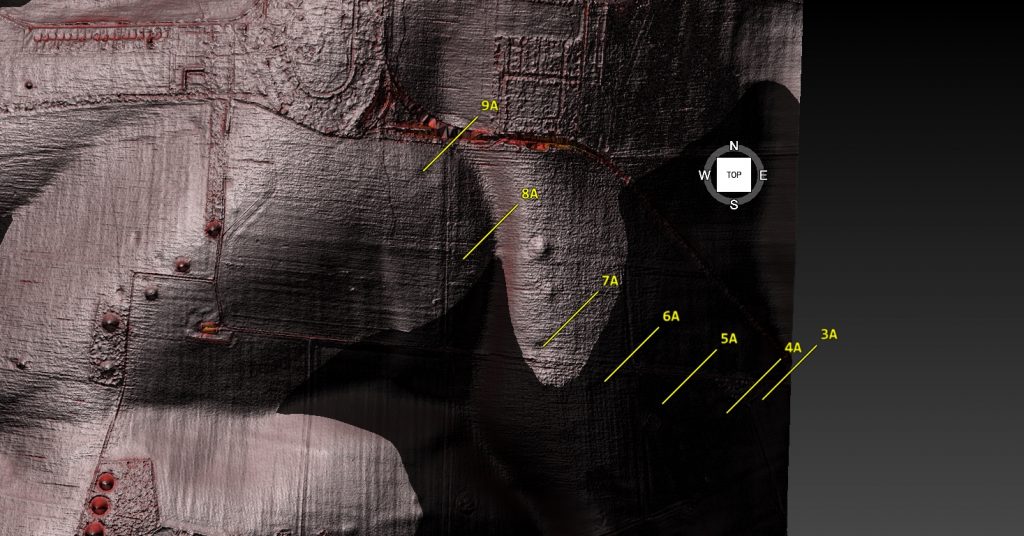
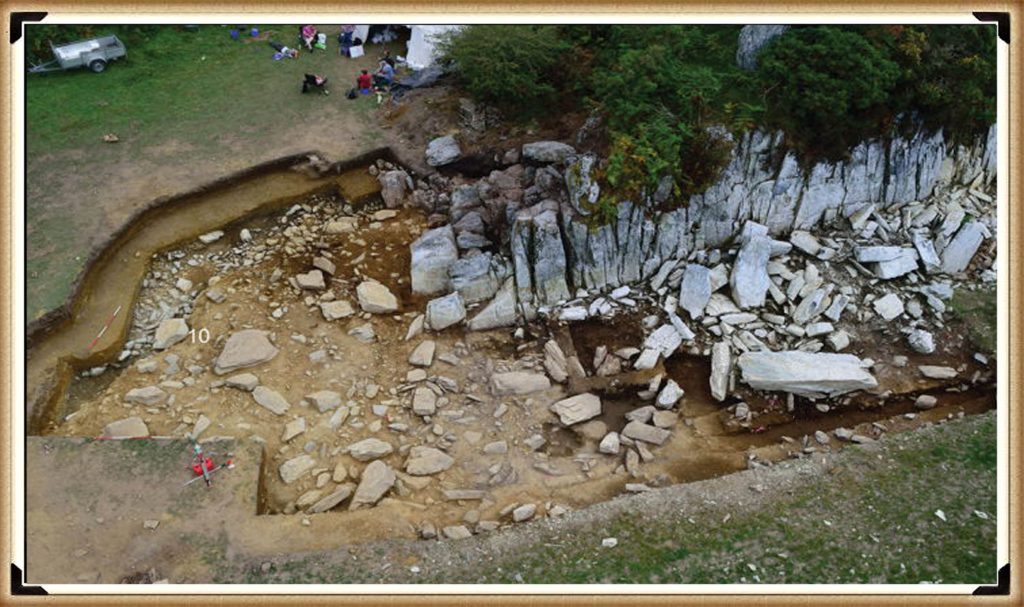
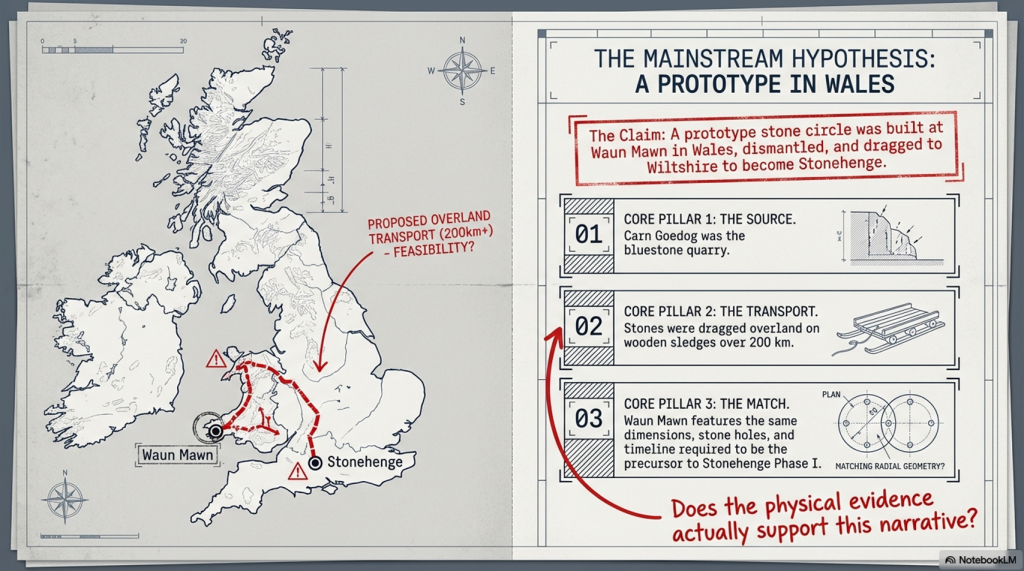
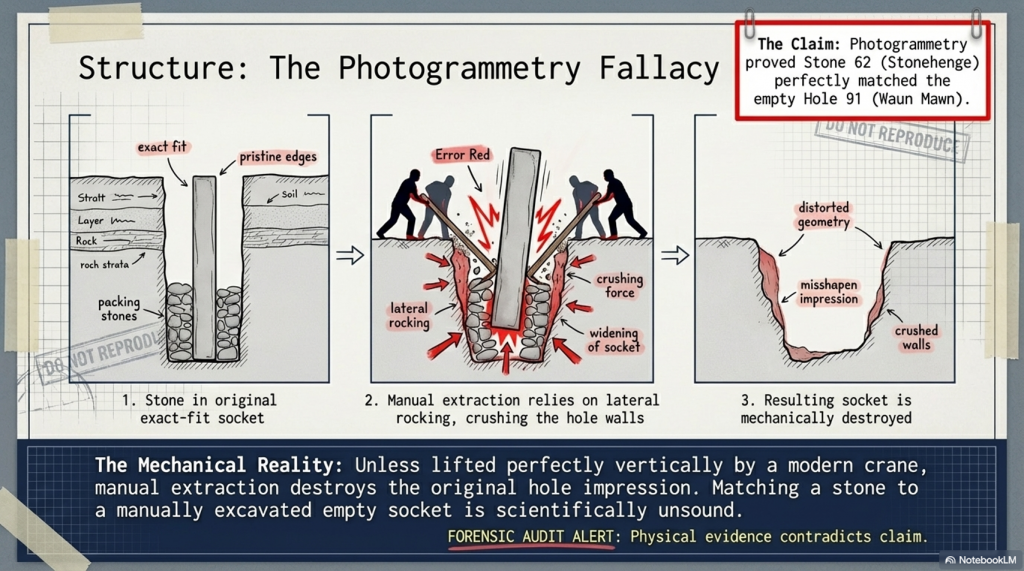
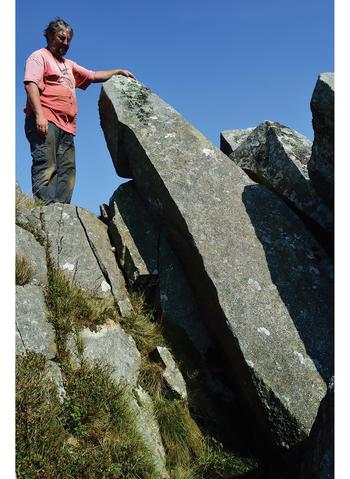
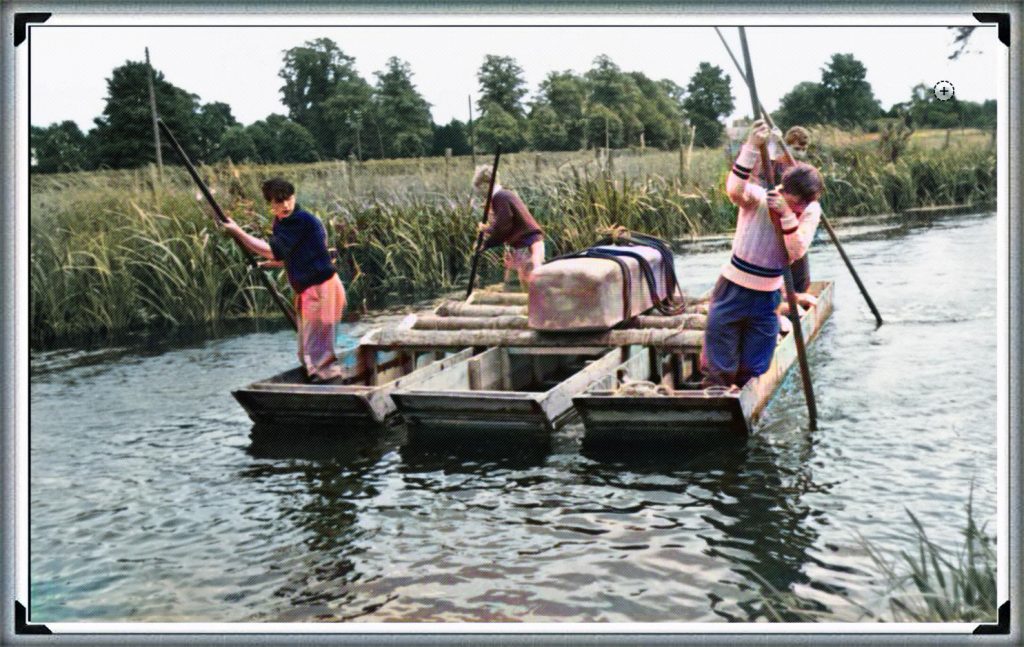
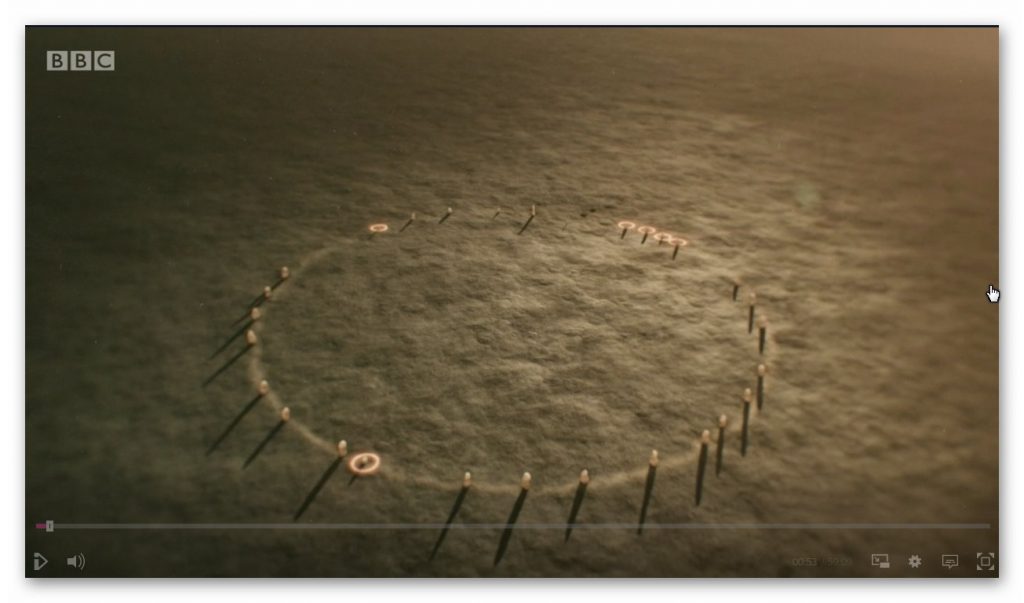
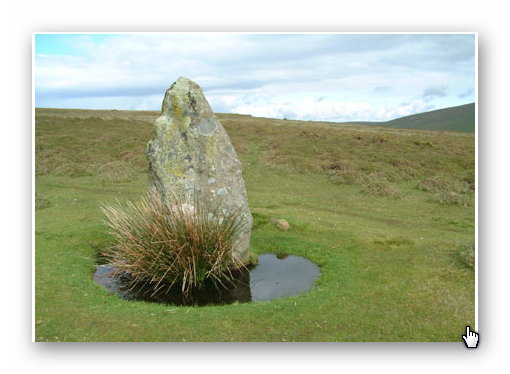
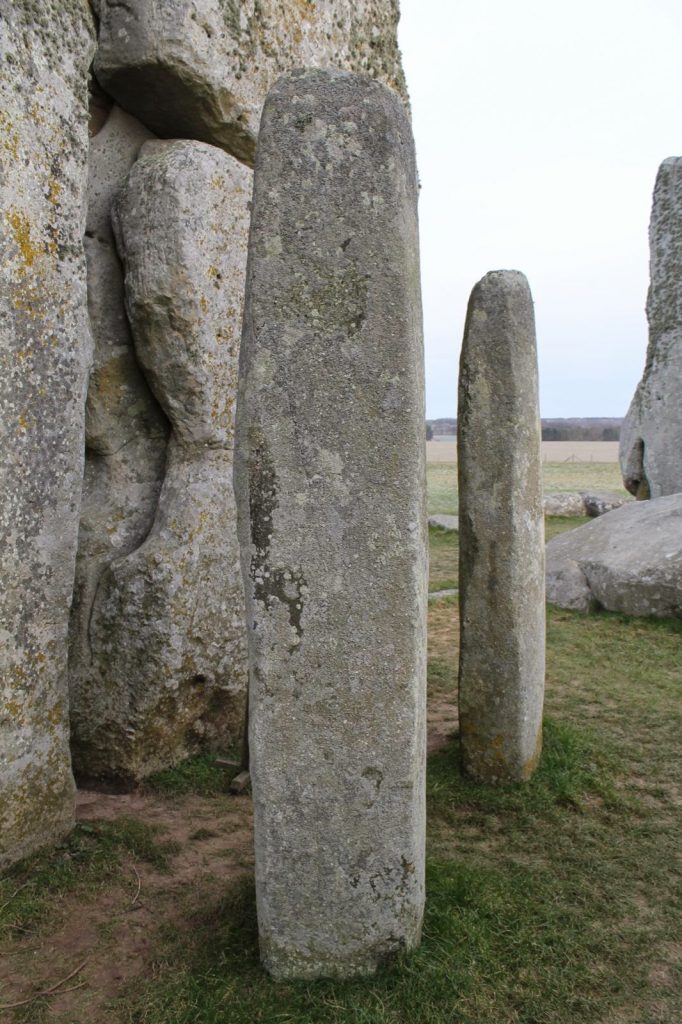
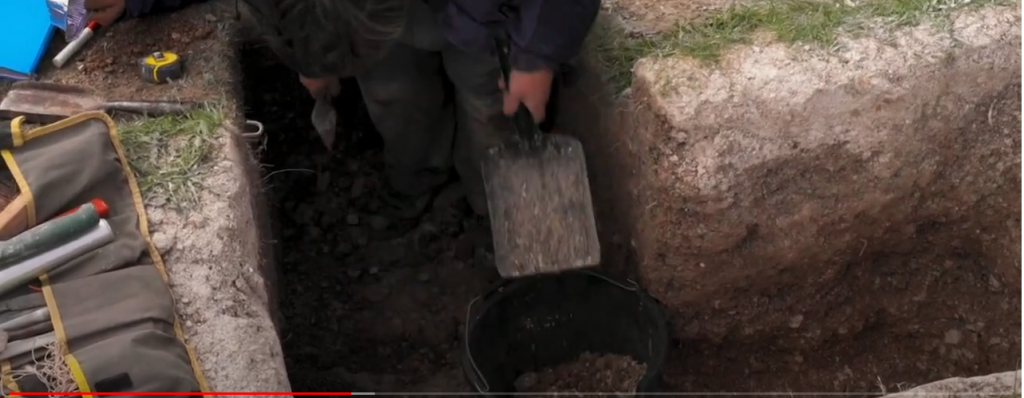

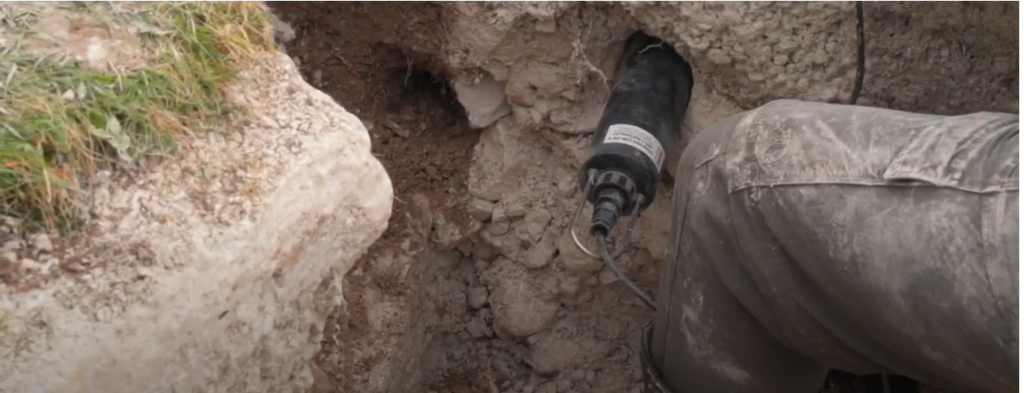
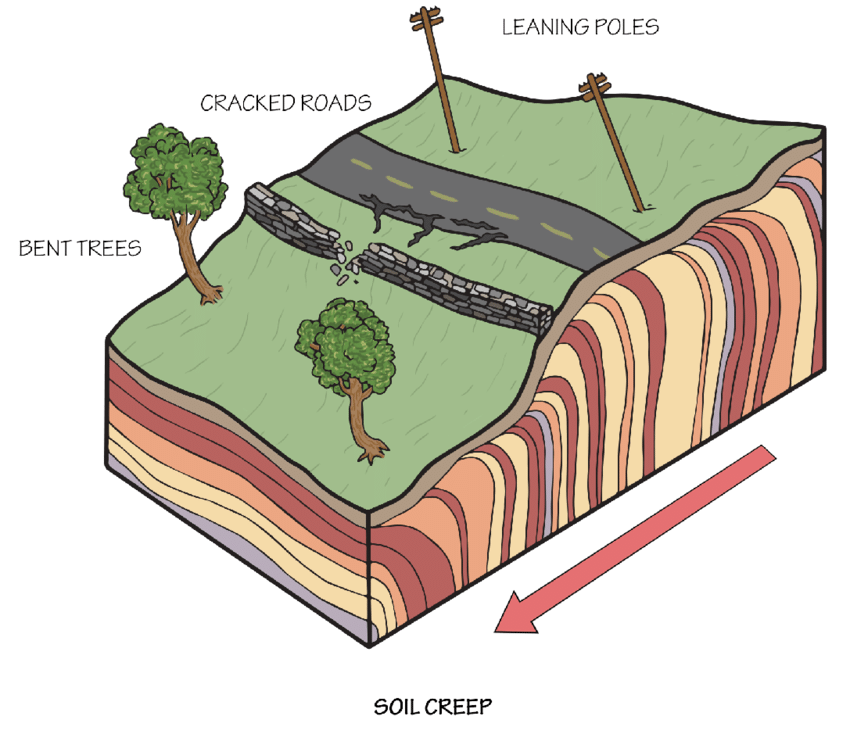
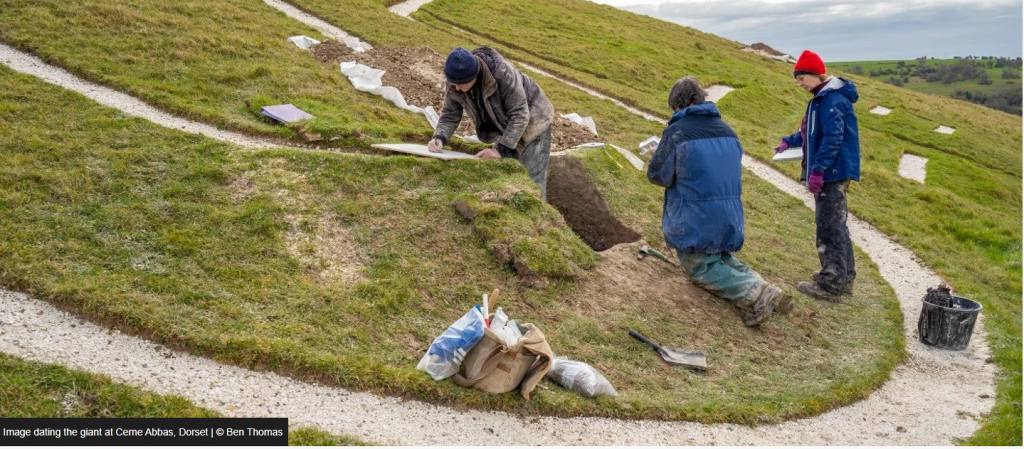
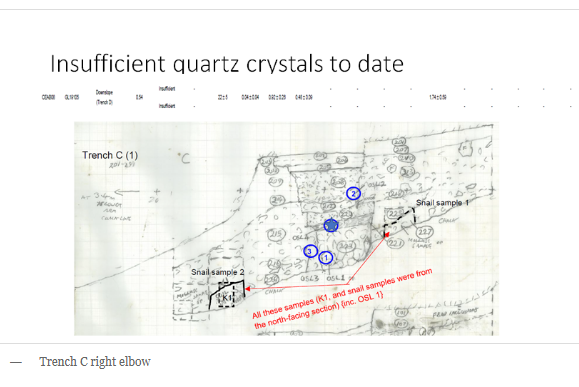
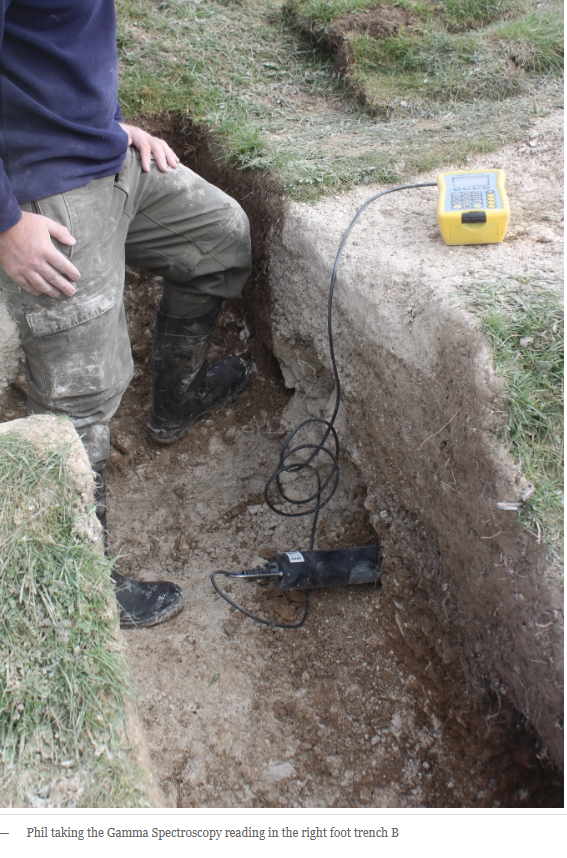
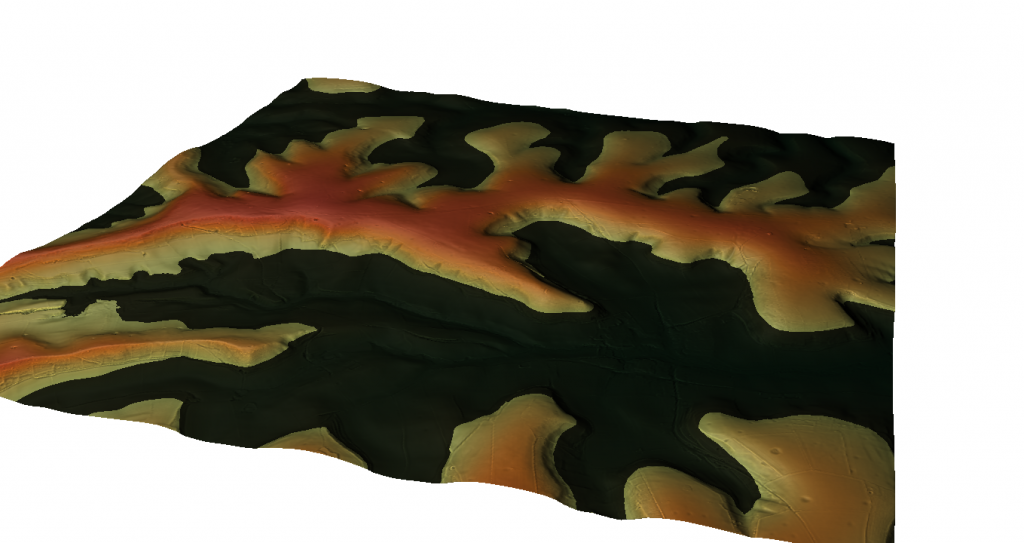
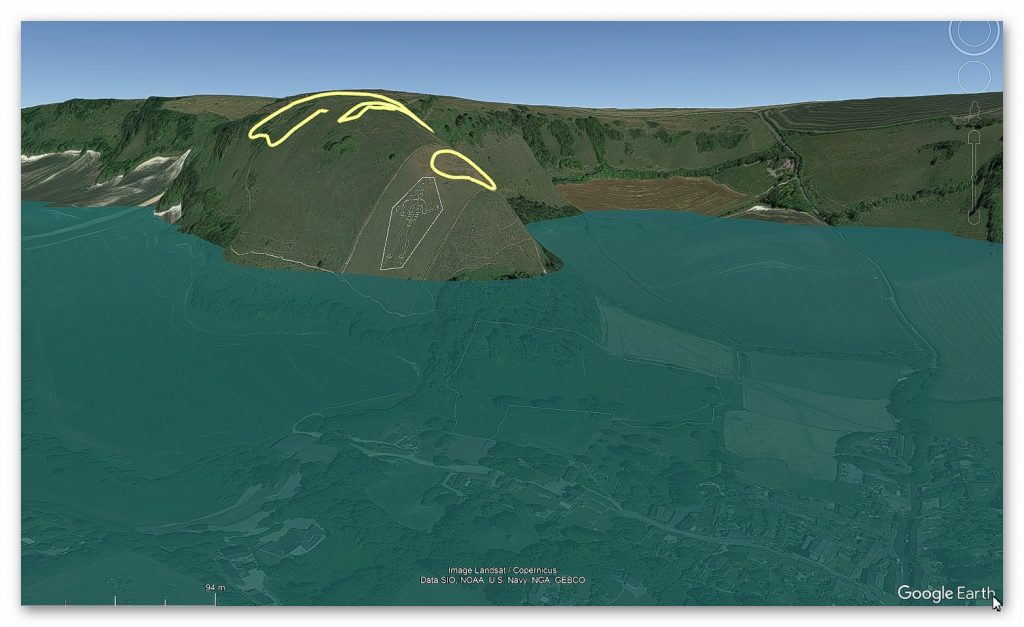
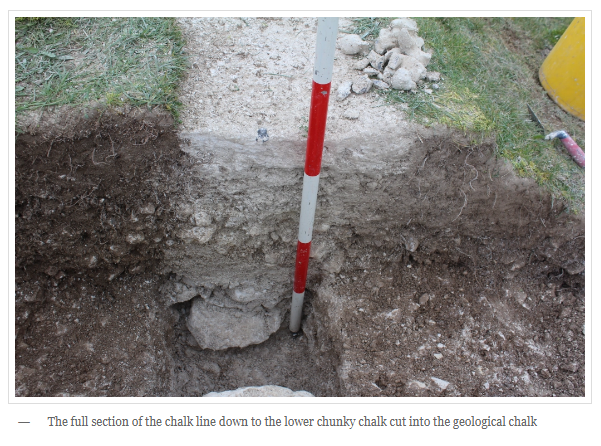
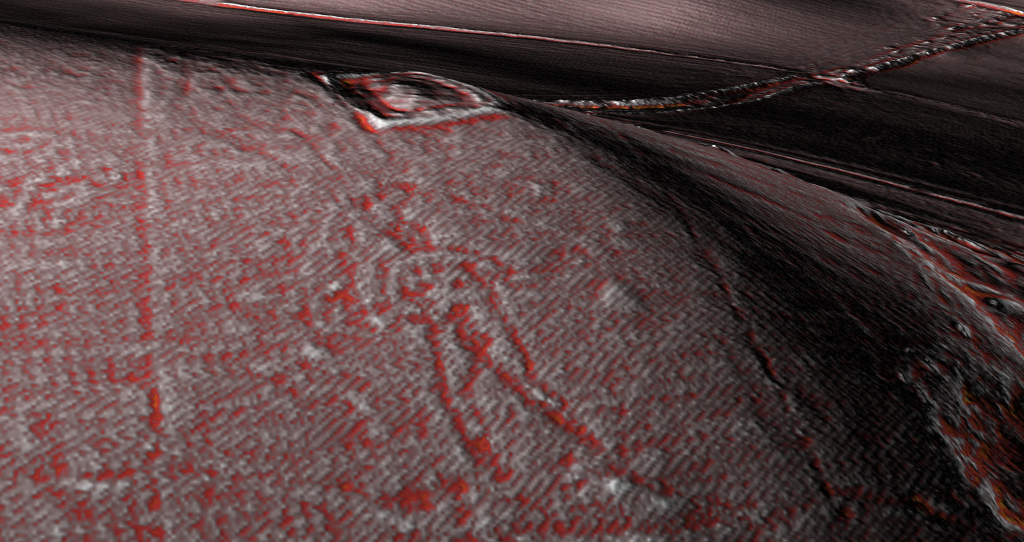

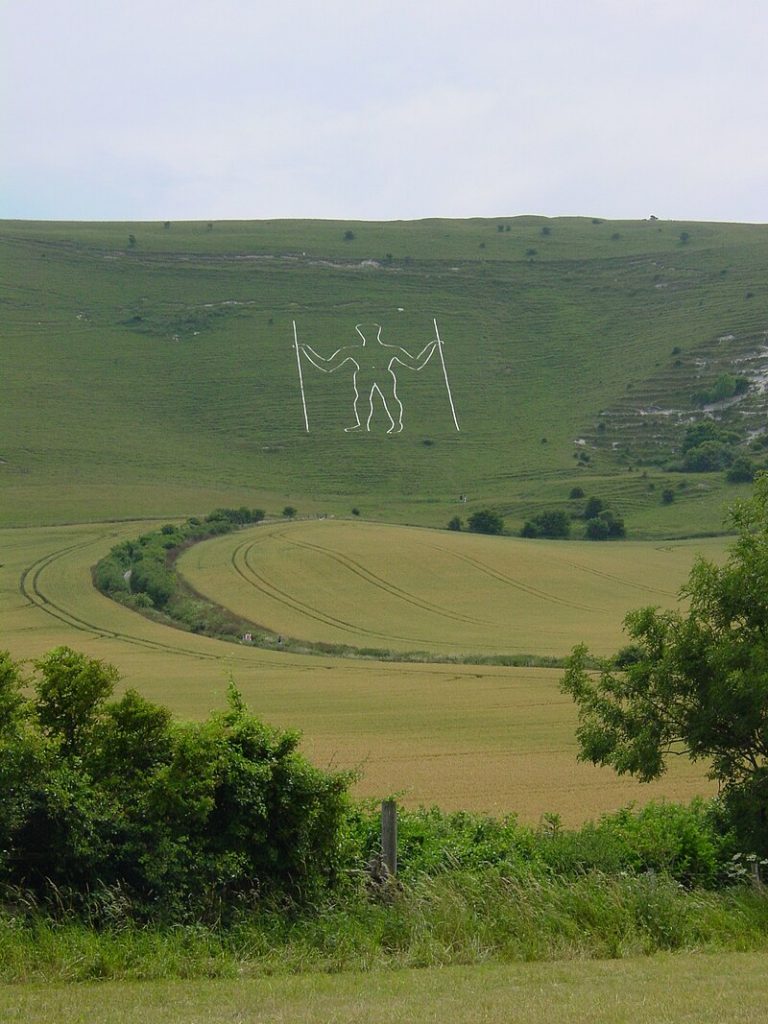
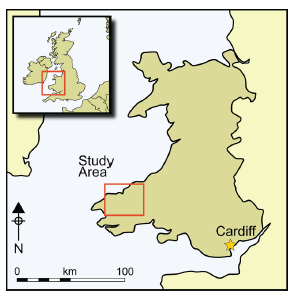
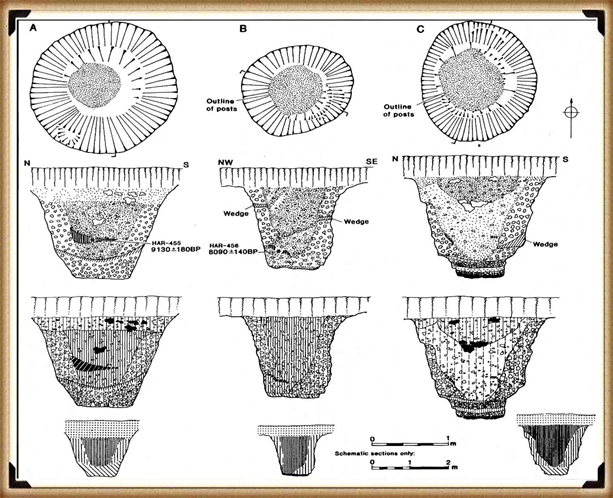
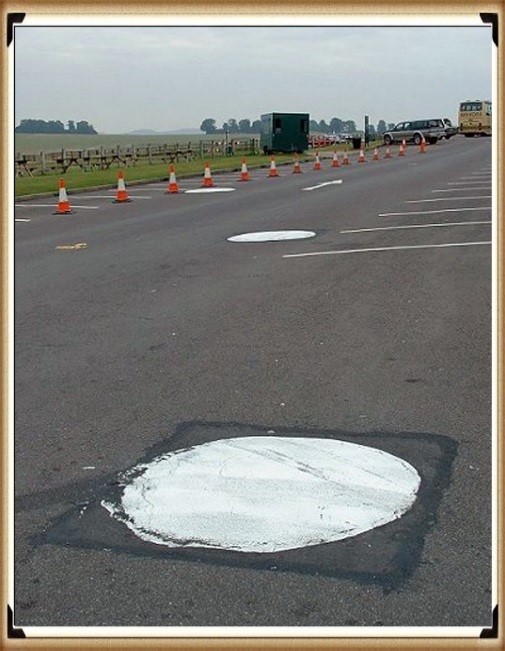
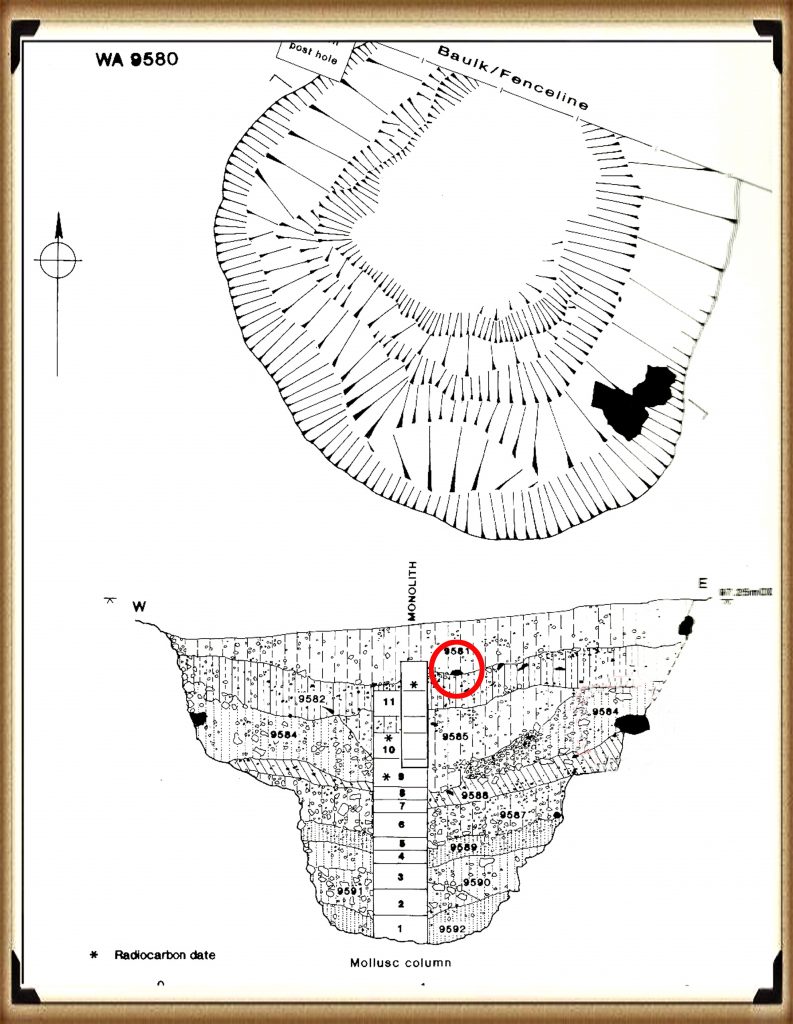
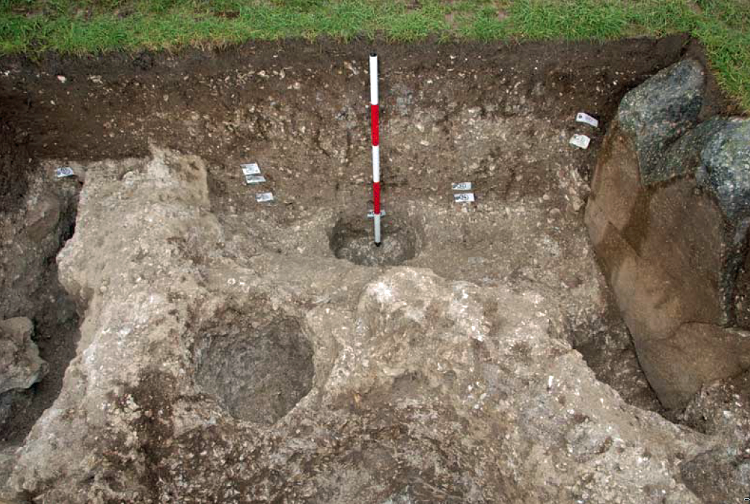
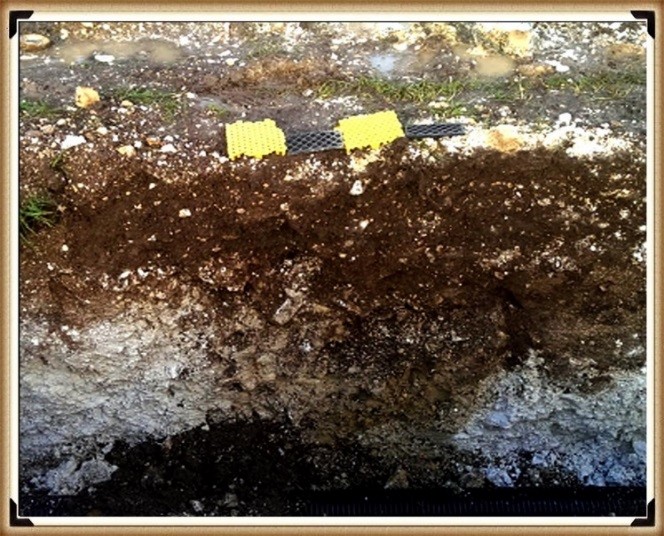
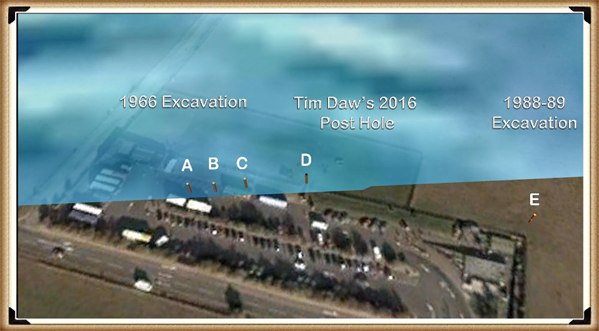
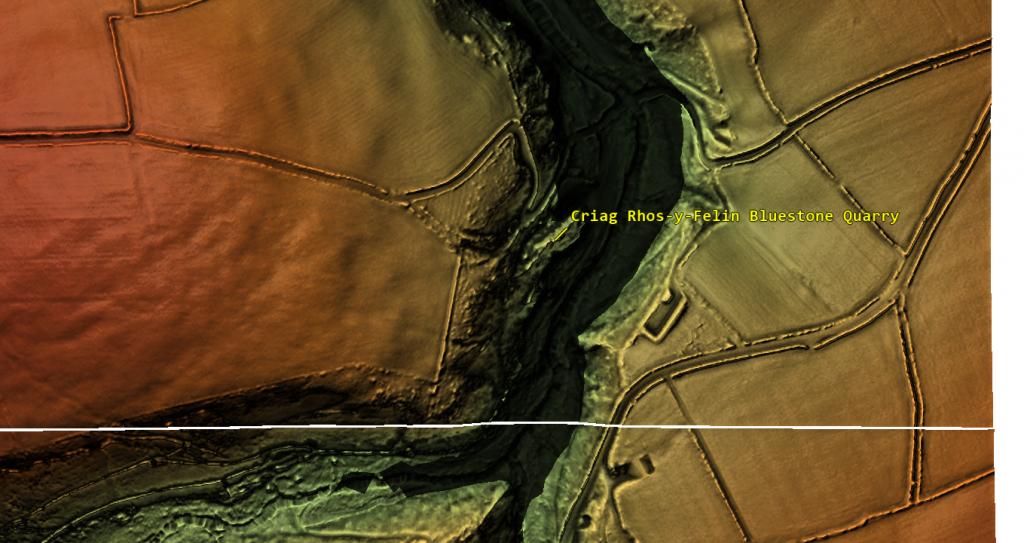
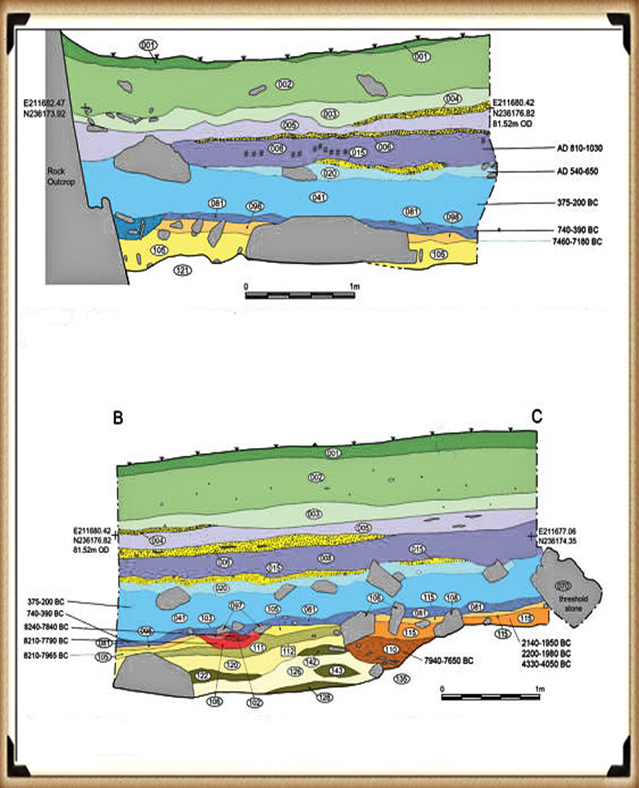
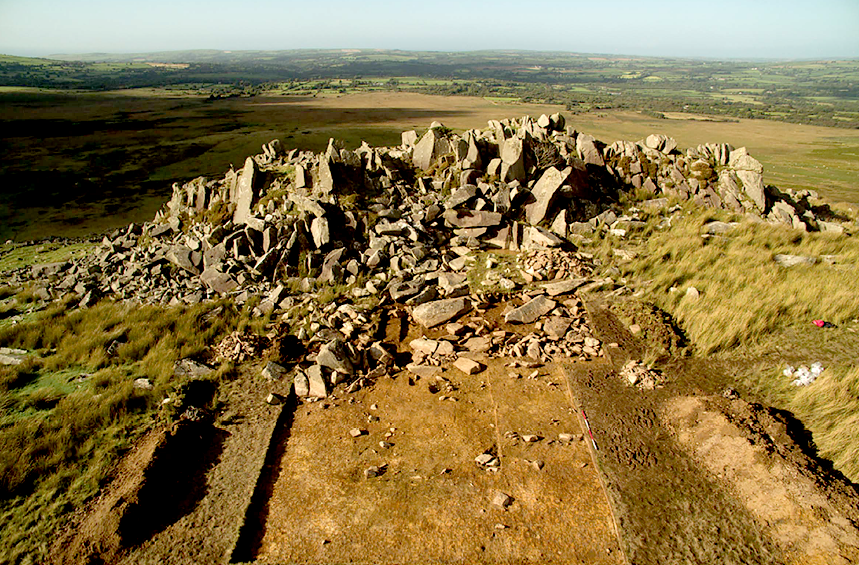
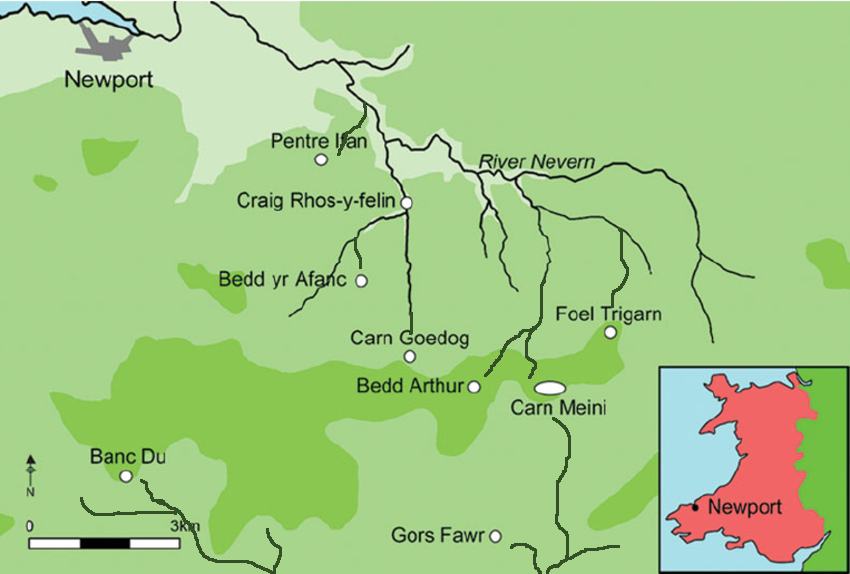
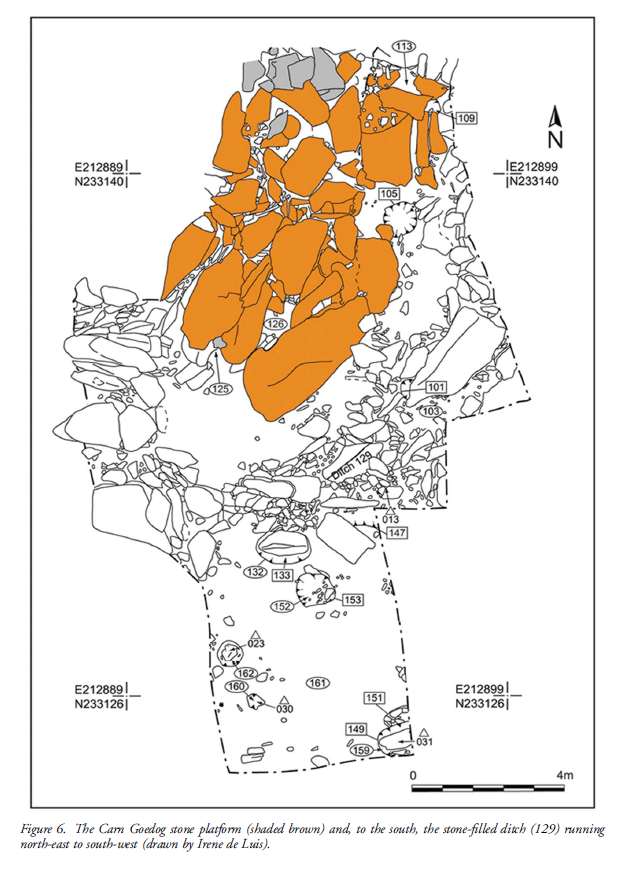
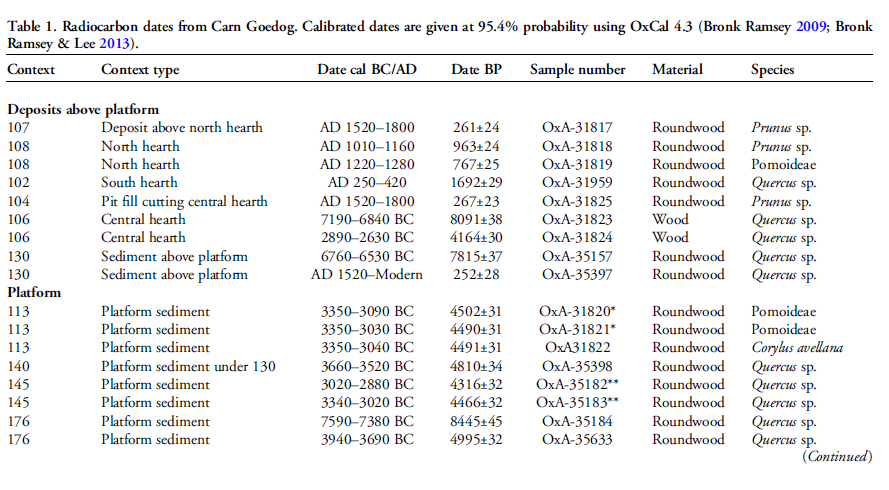
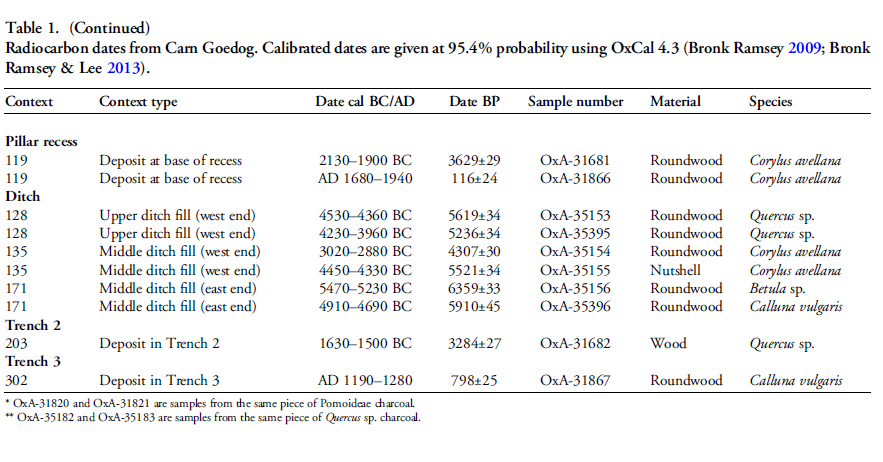
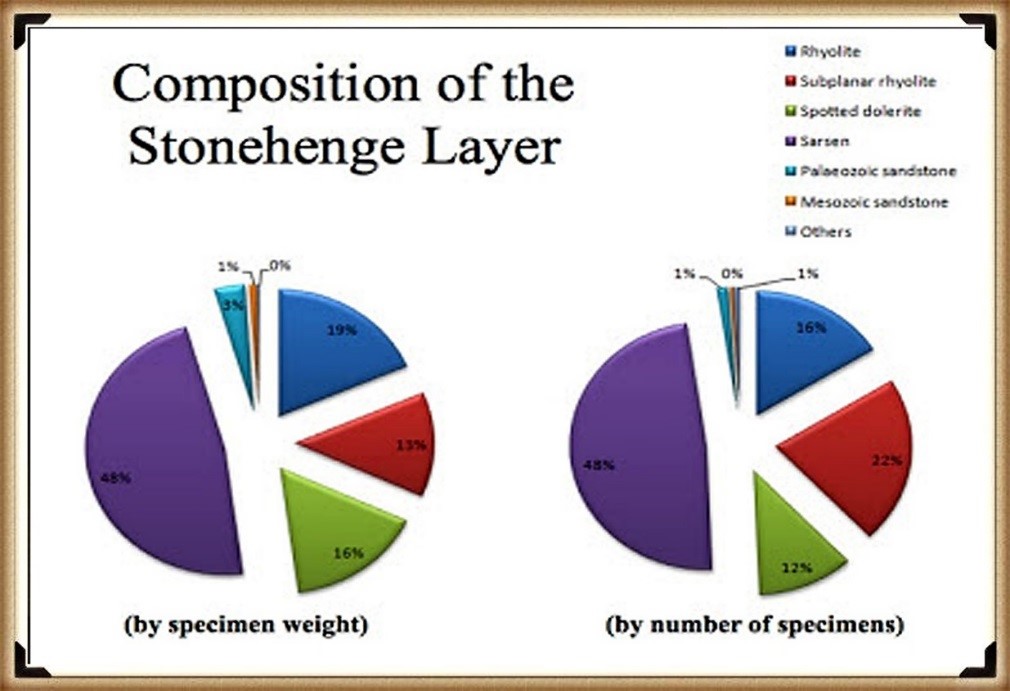
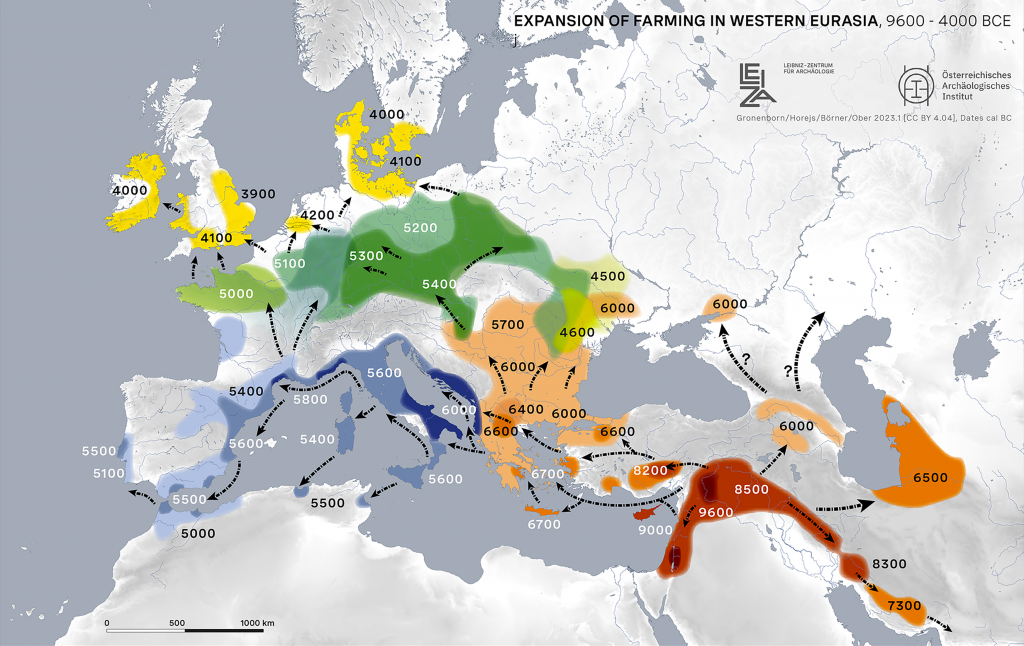
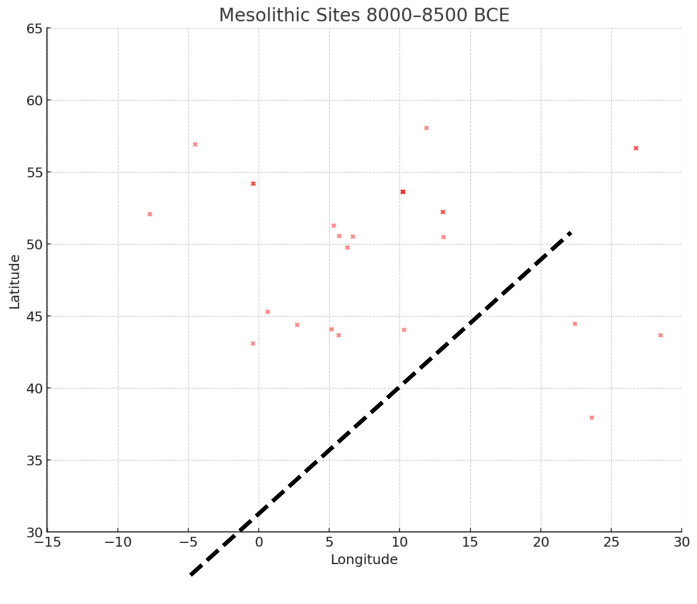
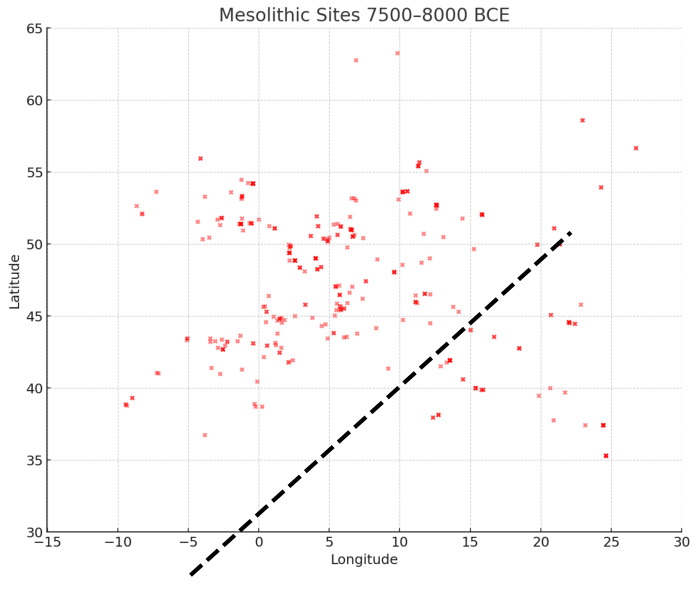
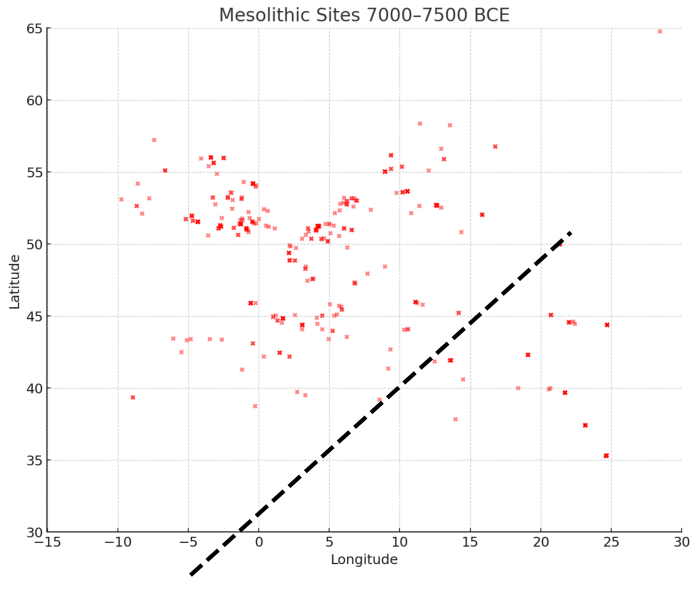
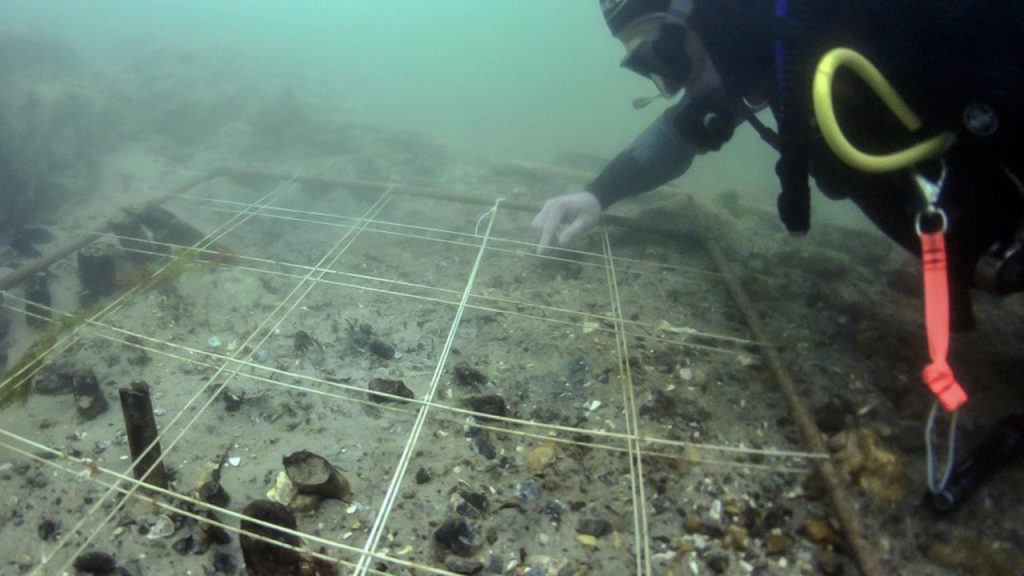
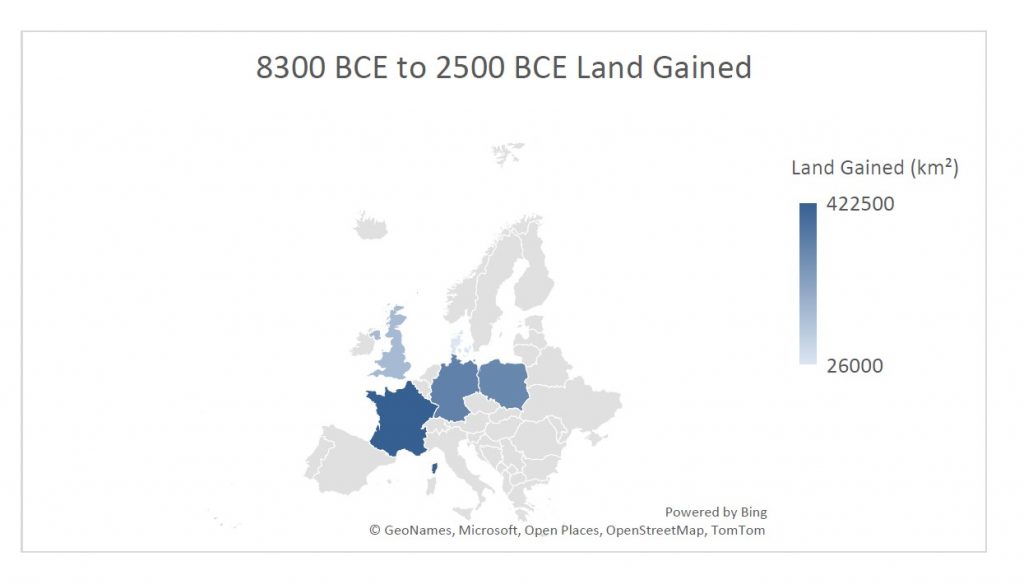
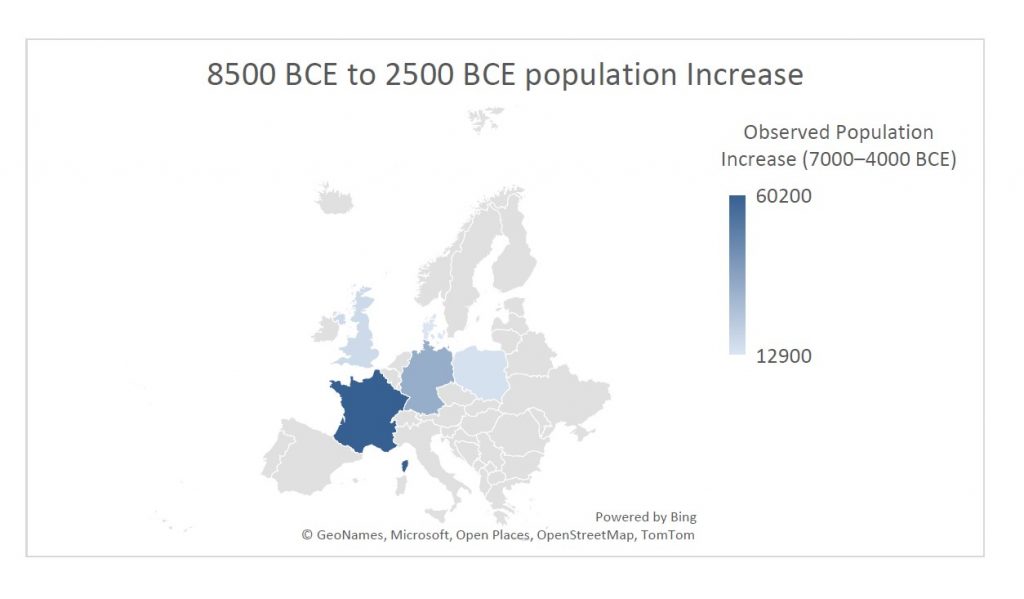
 Total ≈ 18–20 years to clear 10 ha before planting.
 Rethinking the Past: Post-Glacial Flooding and the Lost Rivers of Britain → https://prehistoric-britain.co.uk/rethinking-the-past