Thurnam’s 137 Skulls: The Forgotten People Behind Britain’s Megaliths.

Long barrows, long skulls; round barrows, round skulls—and a biological division archaeology has known about for more than 150 years

1. The evidence was never lost—it was simply left behind

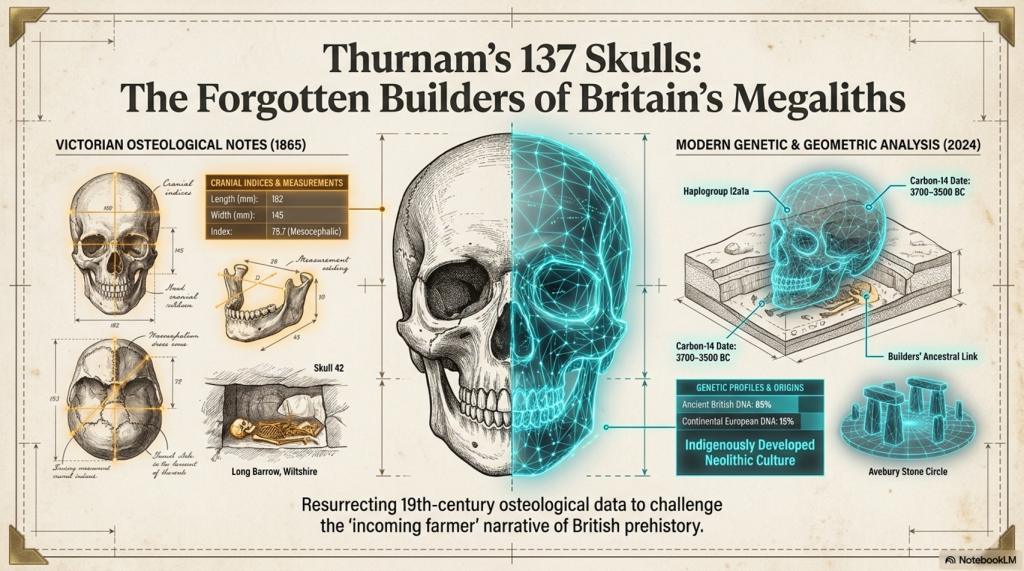
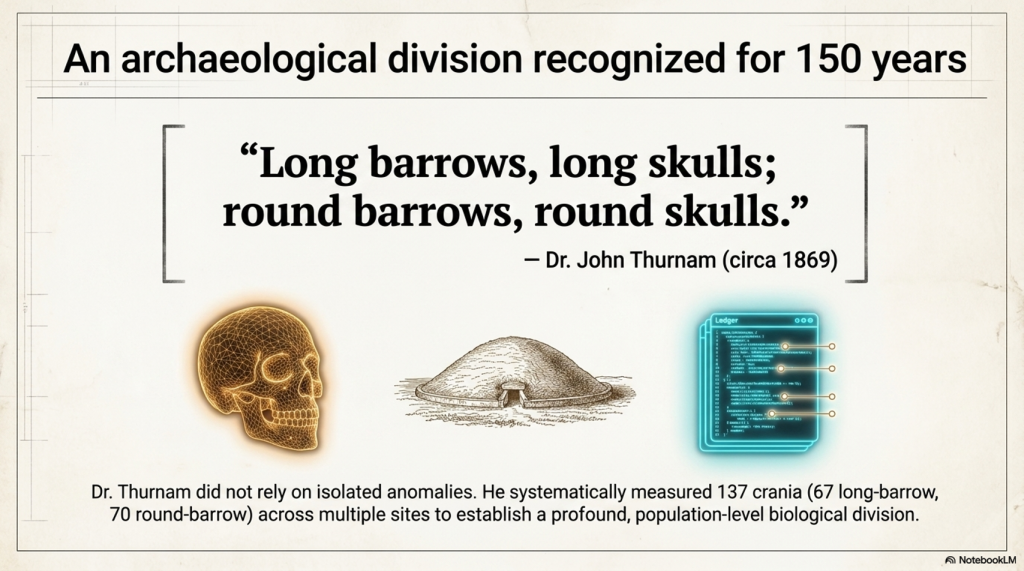
More than 150 years ago, Dr John Thurnam assembled an extraordinary body of physical evidence from Britain’s prehistoric burial monuments. He did not study a single unusual skeleton and construct a theory around it. He compared large groups of human skulls recovered from two archaeologically distinct types of monument: the earlier long barrows and the later round barrows.

His conclusion became one of the most memorable statements in British archaeology:

“Long barrows, long skulls; round barrows, round skulls.”
Thurnam's 137 Skulls: The Forgotten People Behind Britain's Megaliths.
Thurnam’s 137 Skulls: The Forgotten People Behind Britain’s Megaliths.

The saying survives, but the scale of the evidence behind it has largely disappeared from public discussion.

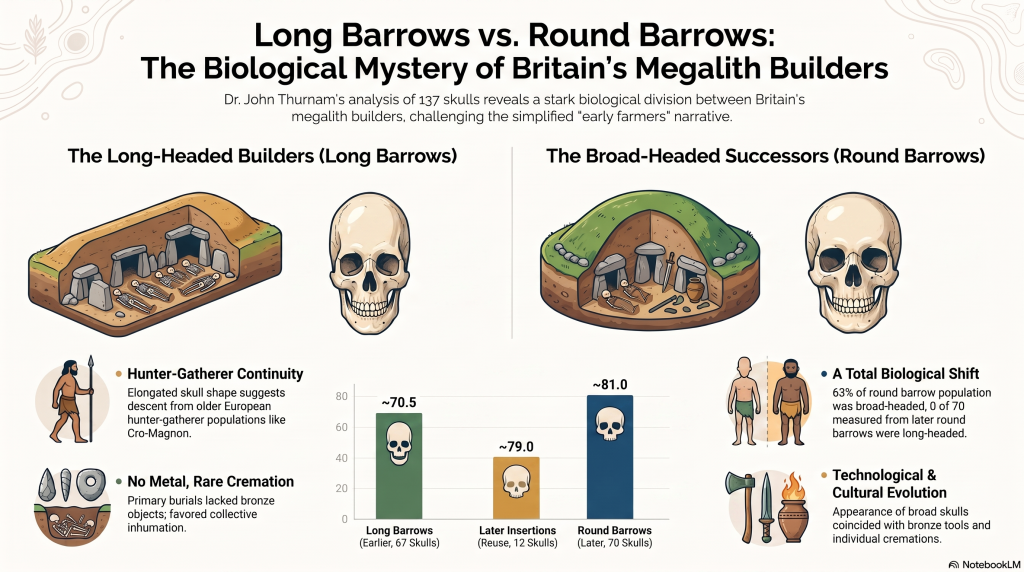
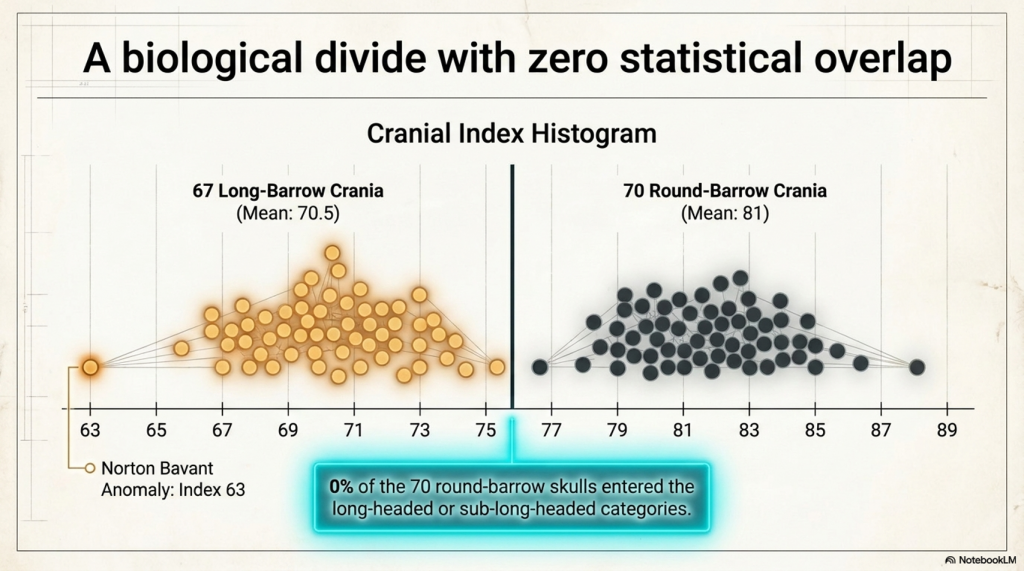
Thurnam’s two studies contain measurements from 67 long-bar­row crania and 70 round-bar­row crania—a combined sample of 137 prehistoric skulls. The long-bar­row series had a combined average cranial index of approximately 70.5. The round-bar­row series averaged approximately 81.

A cranial index is calculated by dividing the maximum breadth of a skull by its maximum length and multiplying by 100. A low index indicates a relatively long, narrow skull. A higher index indicates a shorter, broader skull.

This does not mean that one skull was literally twice the length of another. It describes the proportional relationship between length and breadth. Nevertheless, a difference between population averages of 70.5 and 81 is substantial.

More importantly, the skull measurements did not exist in isolation. They followed changes in monument form, burial practice and associated material culture.

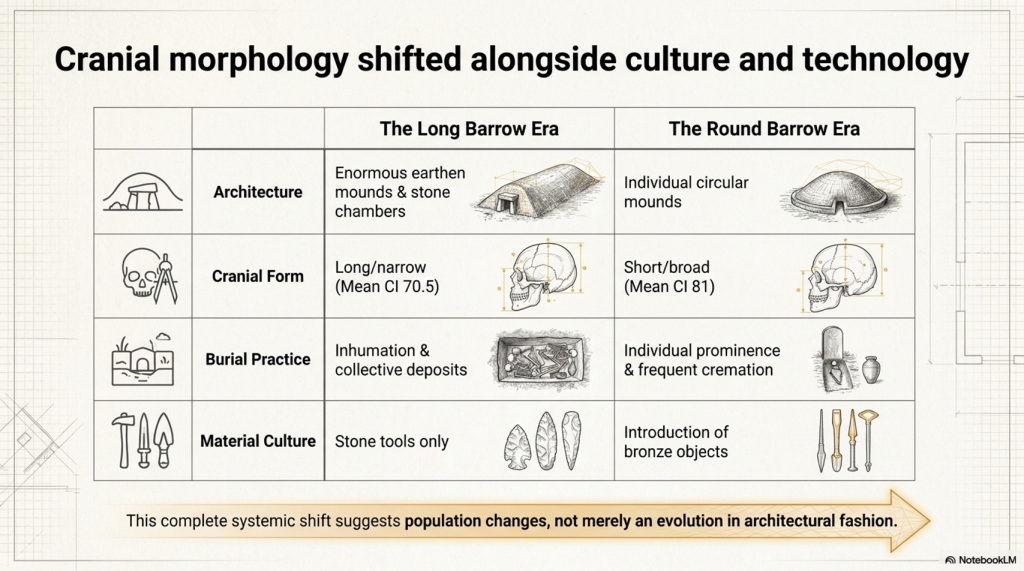
Thurnam classified the long barrows as the earlier monuments. Their primary deposits usually contained whole or disarticulated skeletons, often gathered together at the broad end of the mound. Metal objects were absent from the original burials, and cremation was rare and incomplete.

The round barrows belonged to a later archaeological tradition. Cremation was far more common, bronze objects appeared, and individual burials became increasingly prominent. Thurnam regarded the contrast as evidence of two different populations or chronological communities rather than a mere change in architectural fashion.

Victorian researchers surrounded these measurements with racial labels and social interpretations that cannot simply be carried into modern science. Thurnam’s ideas about chiefs, slaves, sacrifice and cannibalism must be treated as historical hypotheses, not proven explanations.

But rejecting his Victorian terminology does not make his measurements disappear.

A skull measured at a cranial index of 68 remains proportionally long, whether it was measured in 1869 or yesterday. The correct response is to remeasure the surviving specimens, establish their precise archaeological contexts, radiocarbon-date them and obtain ancient DNA.

Instead, modern accounts commonly reduce the question of Britain’s megalithic builders to a simple label: early farmers.

That label may describe an economy, but it does not identify biological ancestry, monument designers, engineers or the social group whose dead were selected for burial inside the monuments.

Farming can be adopted. Domestic animals can be traded. Cultivation can spread between neighbouring populations. Finding agricultural practices in a landscape does not automatically prove that every monument in that landscape was conceived and built by a newly arrived population.

Thurnam’s evidence therefore raises a question that archaeology has never adequately resolved:

Why did the people buried in long barrows possess a consistently elongated cranial form, while the people buried in later round barrows possessed much broader skulls?

That is not a Victorian curiosity. It is a modern research question waiting to be reopened.
Thurnam's 137 Skulls: The Forgotten People Behind Britain's Megaliths.
Thurnam’s 137 Skulls: The Forgotten People Behind Britain’s Megaliths.

2. The 67 long-bar­row skulls: what Thurnam actually measured

Thurnam separated long barrows into two principal forms: unchambered long barrows and chambered long barrows.

The unchambered monuments were generally enormous earthen mounds with lateral ditches and primary burials concentrated beneath the broader and higher end. The chambered monuments incorporated stone-built compartments containing multiple human remains.

From ten unchambered long barrows, Thurnam obtained 27 measurable crania. Their indices ranged from 63 to 75, with an overall average of only 69. He described them as remarkably long and narrow.

The lowest value, 63, came from the nine-skull series at Norton Bavant. This was an exceptionally elongated skull even by the standards of the wider long-bar­row sample.

Unchambered long-bar­row crania

SiteMeasured skullsIndex rangeMean index
Winterbourne Stoke17575
Tilshead East568–7471.5
Bowl’s Barrow, Heytesbury465–7067
Fyfield, Giant’s Grave16969
Tilshead Lodge266–6867
Figheldean16767
Netheravon16969
Tilshead Old Ditch16868
Stonehenge Long Barrow 165270.5–7171
Norton Bavant963–7368.5
Total2763–7569

The table is striking because the pattern is not confined to one cemetery. It appears across multiple Wiltshire long barrows excavated at different times.

The four skulls from Bowl’s Barrow averaged 67. The two from Tilshead Lodge averaged 67. The single measurable examples from Figheldean, Netheravon and Tilshead Old Ditch produced indices of 67, 69 and 68 respectively.

Thurnam’s 27-skull unchambered series included 21 skulls he regarded as male and six as female. Although Victorian sex assessments require modern checking, this indicates that the result was not created by measuring only one sex.

The chambered long barrows produced another 40 measurable crania from seven sites.

Chambered long-bar­row crania

SiteMeasured skullsIndex rangeMean index
Uley271–7472.5
Littleton Drew768–7471
West Kennet467–7370
Nympsfield274–7574
Rodmarton571–7473
Charlton Abbot’s1768–7771
Oldbury368–7471
Total4067–7771.5

The chambered sample is slightly broader on average than the unchambered series, but it remains predominantly elongated.

West Kennet produced four skulls ranging from 67 to 73, averaging 70. Littleton Drew produced seven skulls averaging 71. Charlton Abbot’s supplied the largest chambered sample, with 17 skulls and a mean of 71.

We must not claim that every one of these 67 people was strictly dolichocephalic. Thurnam’s published tables provide site ranges and averages rather than all 67 individual measurements. At sites such as Charlton Abbot’s, where the range reaches 77, some individuals were evidently broader-headed.

What can be stated securely is that:

  • the combined long-bar­row population averaged approximately 70.5;
  • every site series had a long-headed, sub-long-headed or predominantly long-headed average;
  • the strongest unchambered series were extraordinarily elongated;
  • the pattern occurred across both earthen and chambered long-bar­row traditions.

This is not the result of selecting two spectacular museum skulls. It is a regional population pattern involving 67 measured crania from 17 monumental burial sites.
Thurnam's 137 Skulls: The Forgotten People Behind Britain's Megaliths.
Thurnam’s 137 Skulls: The Forgotten People Behind Britain’s Megaliths.

3. The 70 round-bar­row skulls: the population changes

The round-bar­row evidence is even more dramatic because Thurnam published a categorical distribution for the complete sample.

He assembled 70 skulls from later round-bar­row burials. Their cranial indices ranged from 74 to 89, with an average close to 81.

Among those 70 skulls, Thurnam found:

  • no dolichocephalic examples;
  • no sub-dolichocephalic examples;
  • 12 intermediate skulls with indices of 74–76;
  • 14 broader skulls with indices of 77–79;
  • 44 brachycephalic skulls with indices of 80–89.

Distribution of the 70 round-bar­row skulls

Cranial categoryIndex rangeNumberProportion
Dolichocephalic70 or below00%
Sub-dolichocephalic71–7300%
Orthocephalic74–761217%
Sub-brachycephalic77–791420%
Brachycephalic80–894463%
Total74–8970100%

The significance is not that every round-bar­row person had an almost spherical skull. The majority were broad-headed, while a minority occupied an intermediate range.

The critical result is that not one of the 70 entered Thurnam’s long-headed or sub-long-headed classes.

The complete contrast

Burial populationMeasured craniaApproximate mean indexLong/sub-long skulls
Long barrows6770.5Predominant, but exact individual total unavailable
Round barrows70810 of 70
Later secondary burials inside long barrows12about 79Predominantly broader-headed

The third row is particularly important.

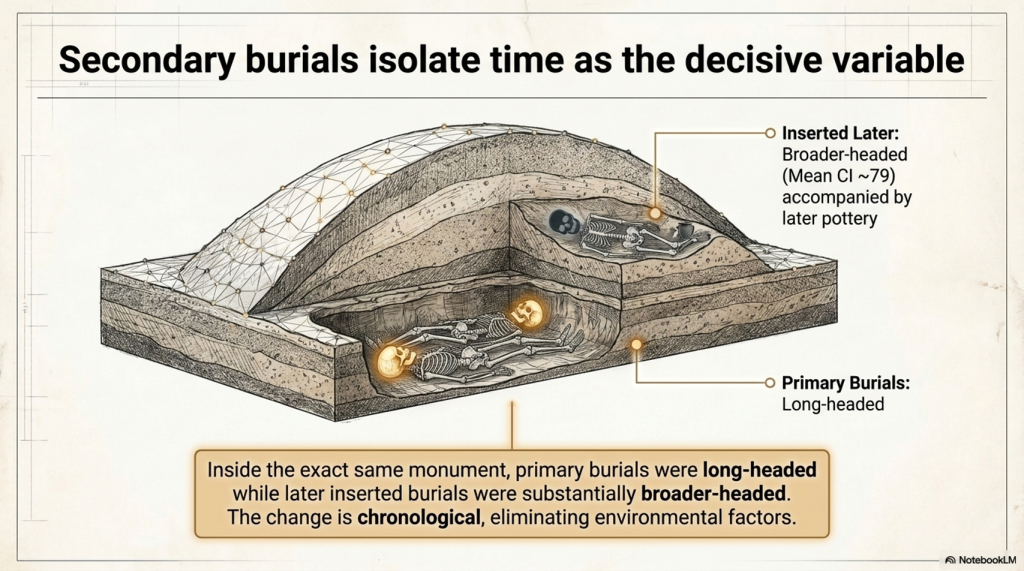
Long barrows were sometimes reopened and reused by later people. Thurnam examined 12 skulls from secondary burials inserted into Wiltshire long barrows. Their average index was approximately 79.

Some were accompanied by later pottery, including decorated drinking cups. These were not part of the original long-bar­row burial population.

This produces a remarkably controlled comparison.

Inside the same monument:

  • the primary burials were long-headed;
  • the later inserted burials were substantially broader-headed.

Therefore, the difference cannot easily be dismissed as the effect of soil, regional geography, monument location or measurement technique. The cranial form changes with the archaeological phase.

The same point is illustrated by individual named round-bar­row skulls.

Ten named Wiltshire round-bar­row examples

SiteCranial index
Kennet Hill74
Morgan’s Hill75
Stonehenge, Barrow 15078
Stonehenge, Collection 26679
Wilsford80
Winterbourne Stoke81
Roundway83
Codford83
Stonehenge, Barrow 15084
Stonehenge, Collection 26584

These ten had an average index of approximately 80.1.

The burial evidence changes as well. Thurnam’s long barrows were dominated by inhumation and collective deposits. Cremation occurred only exceptionally. In the later circular barrows, cremation was far more common and bronze artefacts became part of the archaeological record.

The evidence therefore points to more than architectural development.

We see simultaneous changes in:

  • skull proportions;
  • treatment of the dead;
  • collective versus individual burial;
  • cremation frequency;
  • monument design;
  • associated technology.

Whether this represents migration, population mixing, social selection or long-term biological change remains open to investigation.

What is not scientifically reasonable is to pretend that no physical distinction existed.

Thurnam's 137 Skulls: The Forgotten People Behind Britain's Megaliths.
Thurnam’s 137 Skulls: The Forgotten People Behind Britain’s Megaliths.

4. From Cro-Magnon to the long-bar­row population

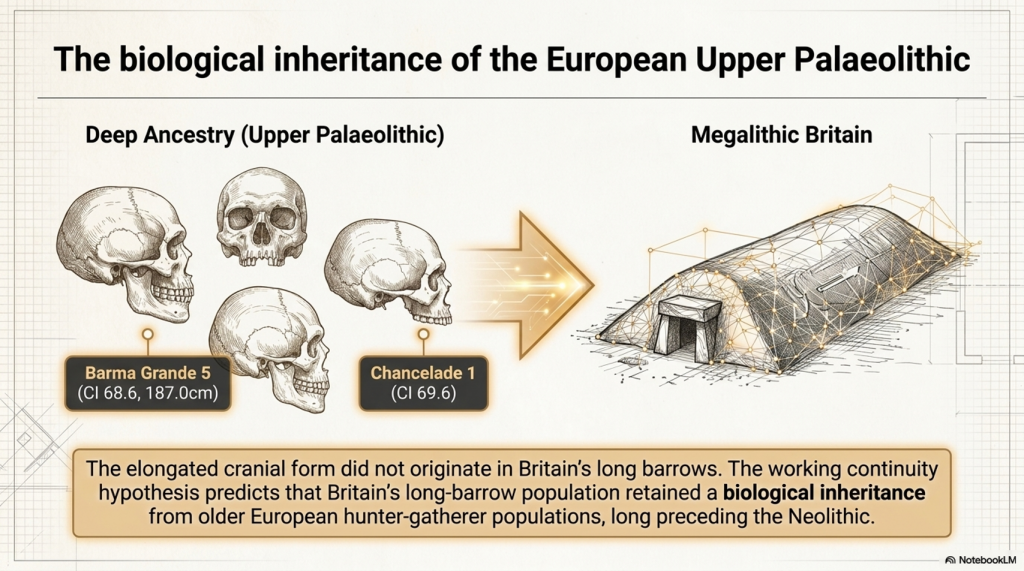
The elongated cranial form did not originate in Britain’s long barrows.

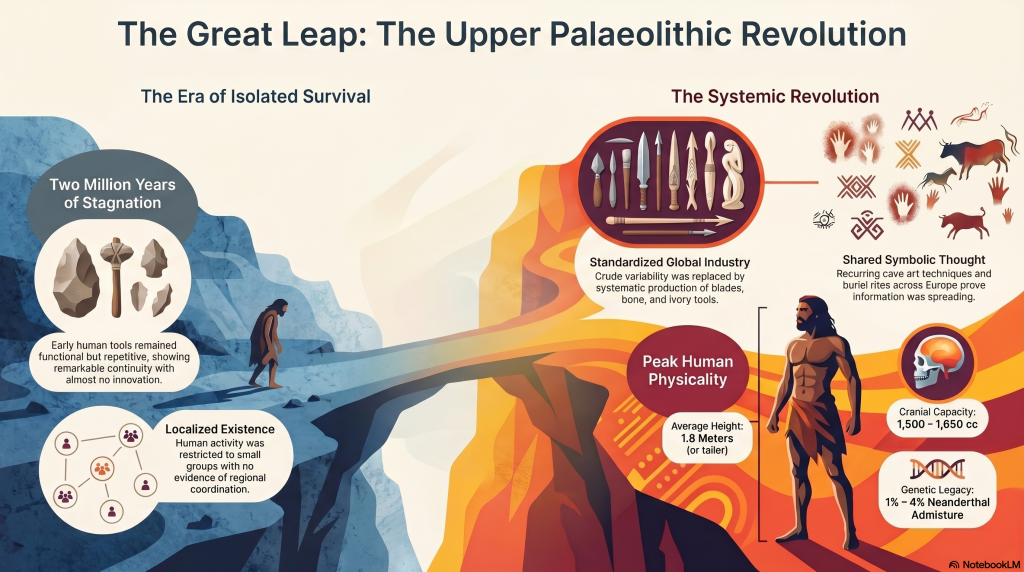
Long, narrow skulls are present much earlier in the European Upper Palaeolithic record. Specimens traditionally associated with Cro-Magnon, Barma Grande, Grotte des Enfants, Chancelade, Předmostí and other Upper Palaeolithic sites frequently possess substantial front-to-back cranial length.

“Cro-Magnon” is a historical label for early European Homo sapiens, which was once seen as a separate modern species. Nevertheless, the term remains useful when discussing a recognisable Upper Palaeolithic pattern of tall, robust bodies and large, often elongated crania.

The 2025 European cranial study by Pavel Grasgruber provides modern measurements for many of these specimens. It identifies considerable variation rather than a single universal Cro-Magnon type, but it also confirms that several Upper Palaeolithic individuals possessed conspicuously tall or narrow cranial forms.

Barma Grande 5 and Chancelade 1 stand out as tall, narrow cranial outliers. Early western European specimens including Cro-Magnon 1 and Grotte des Enfants 4 show differences from some central and eastern European Upper Palaeolithic skulls, although the study stresses that limited sample size prevents a simple biological classification.

Our own matched body-and-cranium database includes several relevant individuals:

Upper Palaeolithic/Mesolithic specimenReconstructed statureCranial index
Barma Grande 5187.0 cm68.6
Grotte des Enfants 4185.7 cm76.8
Předmostí 3183.0 cm71.8
Sungir 1183.2 cm76.6
Oberkassel 1175.1 cm72.7
Romito 4173.2 cm74.9
Bichon 1169.9 cm75.8
Chancelade 1165.7 cm69.6

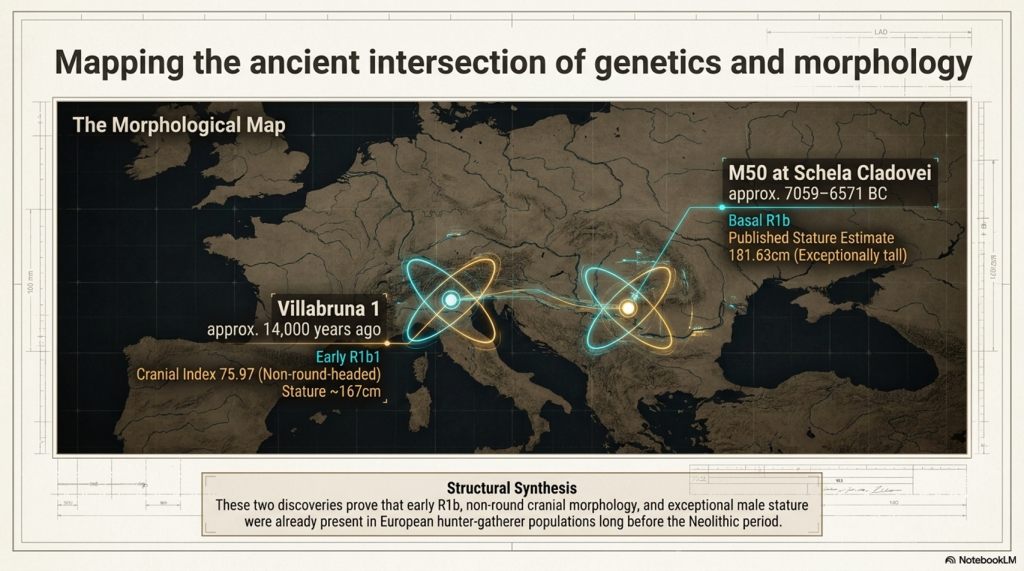
Note: Villabruna 1 and M50 provide two complementary pieces of evidence. Villabruna 1 directly connects early R1b1 with a non-round-headed cranium, having a cranial index of 75.97. M50 directly connects basal R1b with exceptional stature, having a published estimate of 181.63 centimetres. The complete combination of early R1b, exceptional stature and strongly long-headed cranial morphology has not yet been demonstrated in one securely documented individual, but both components of the working hypothesis are now represented within the early R1b record.
Thurnam's 137 Skulls: The Forgotten People Behind Britain's Megaliths.
Thurnam’s 137 Skulls: The Forgotten People Behind Britain’s Megaliths.

This demonstrates two important points.

First, an elongated skull does not automatically indicate exceptional stature. Chancelade 1 was strongly long-headed but comparatively short, while Grotte des Enfants 4 was very tall despite having a broader cranial index than Barma Grande 5.

Second, the combined pattern of tall stature, robust anatomy and elongated cranial form unquestionably existed among some Upper Palaeolithic European populations.

The central question is whether Britain’s long-barrow population represents biological continuity from these older European hunter-gatherers.

Cranial morphology is substantially inherited and has long been used to investigate biological affinity, population continuity and descent. Individual skulls may be affected by development, nutrition, cultural practices or burial pressure, but these factors cannot reasonably explain away a repeated population-level pattern involving 67 measured crania from 17 long-barrow monuments.

The evidence becomes still stronger because the cranial form changes with the archaeological phase. The primary long-barrow burials were predominantly long-headed, while the later secondary burials inserted into the same monuments were substantially broader-headed. The later round-barrow population was broader-headed again.

This is not a random collection of unusual skulls. It is a structured biological pattern associated with different burial populations and different archaeological periods.

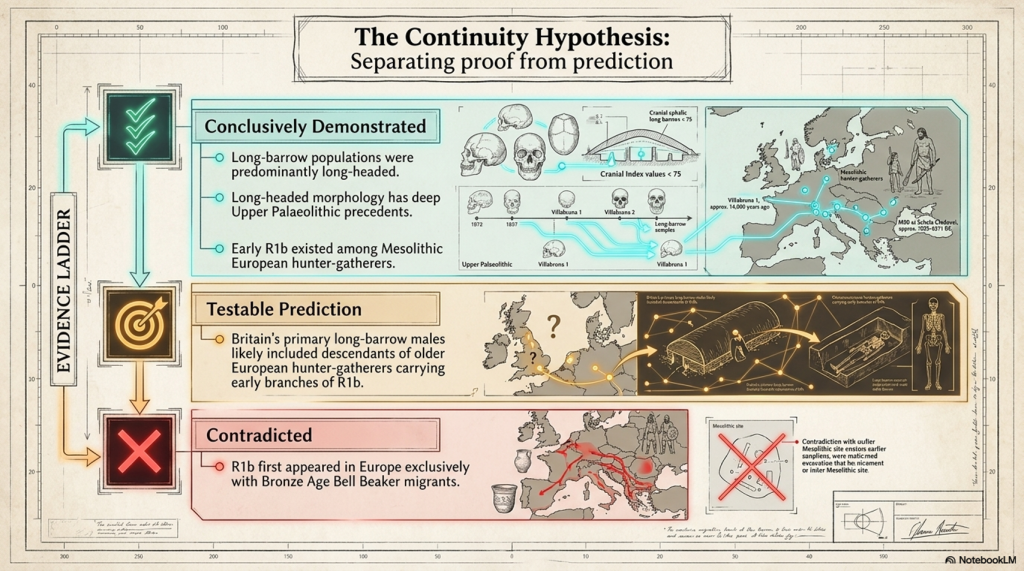
The working continuity hypothesis is therefore:

Britain’s long-barrow population retained a substantial biological inheritance from older European hunter-gatherer populations, including the elongated cranial form visible among parts of the Upper Palaeolithic population traditionally described as Cro-Magnon.

This does not require every long-barrow individual to have been identical to every Upper Palaeolithic specimen. Ancient populations contained variation, just as modern populations do. The argument concerns biological continuity across populations, not the claim that one unchanging physical type survived for tens of thousands of years.
Thurnam's 137 Skulls: The Forgotten People Behind Britain's Megaliths.
Thurnam’s 137 Skulls: The Forgotten People Behind Britain’s Megaliths.

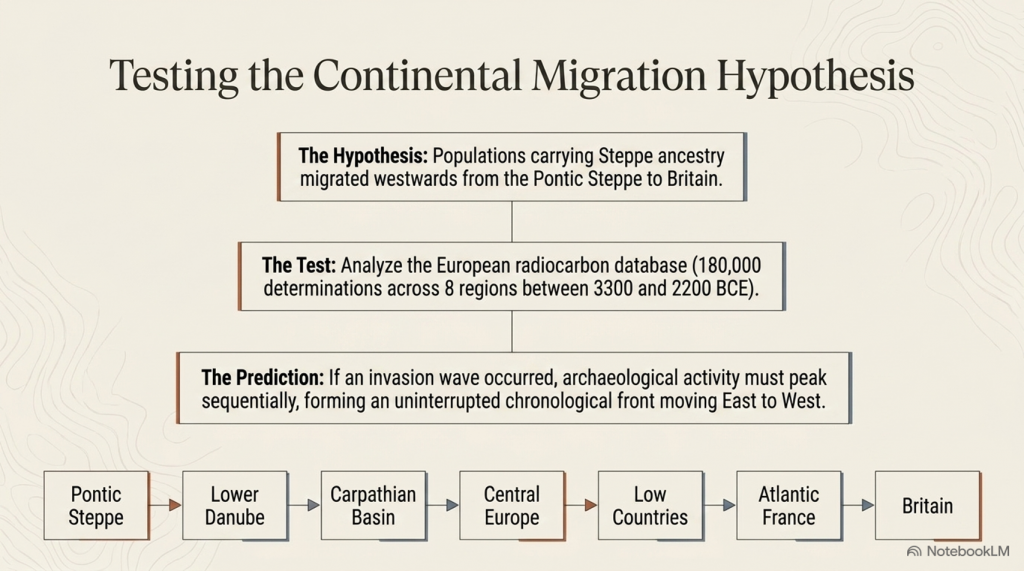
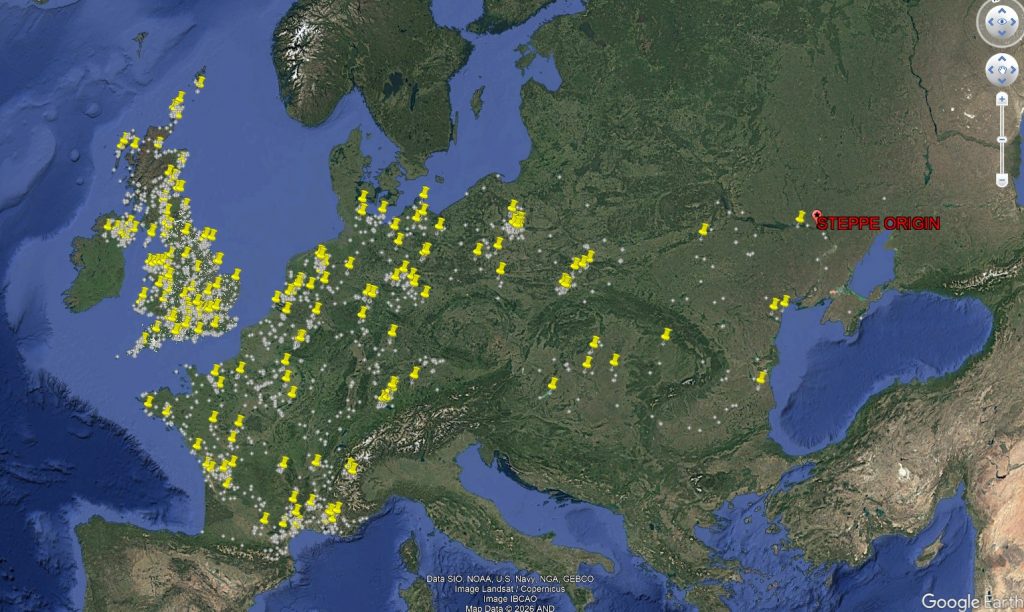
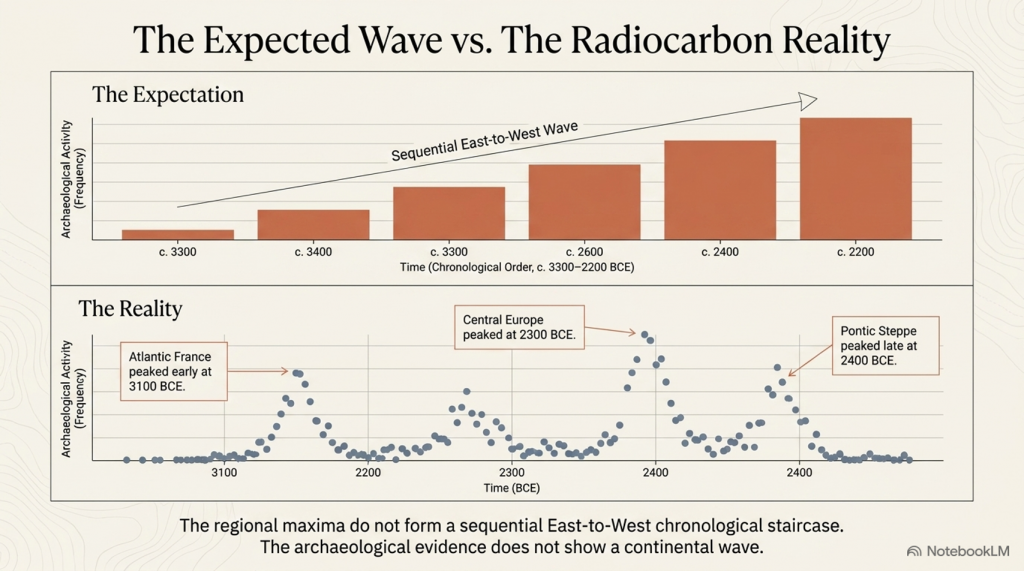
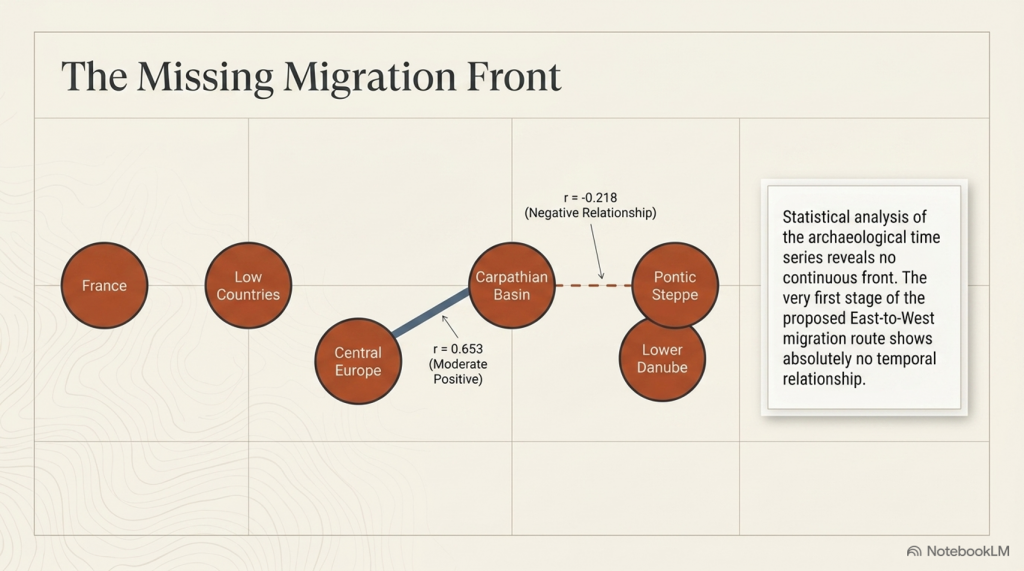
The conventional narrative proposes that Anatolian-derived farming populations migrated progressively across Europe and eventually reached Britain. However, genetic resemblance alone does not establish that migration route, and our analysis of more than 14,000 calibrated radiocarbon records has not identified the archaeological trail that such a mass population movement should have produced.

There is no coherent sequence of increasingly later settlement sites running from Anatolia through southeastern Europe, central Europe, France and finally Britain. Nor is there the expected concentration of early sites along the proposed migration corridor. Instead, the radiocarbon evidence shows extensive activity already present in northwestern Europe during the period in which the supposed farmer migration is claimed to have occurred.

Genetic components described as Anatolian-related may reflect shared ancestry, contact, intermarriage or limited gene flow. They do not automatically prove that a large farming population crossed Europe, replaced indigenous communities or constructed Britain’s monumental landscape.

It is therefore entirely possible that people later classified archaeologically as “farmers” were substantially descended from older European hunter-gatherer populations who adopted cultivation, livestock and new material practices without being biologically replaced.

The important distinction is this:

Agriculture describes what people did. Cranial morphology helps establish who they descended from, while radiocarbon evidence tests whether the claimed migration actually occurred.

The long-barrow measurements therefore support biological continuity with Europe’s older inhabitants, while the radiocarbon record provides no corresponding settlement trail for the conventional Anatolian farmer migration narrative

Thurnam's 137 Skulls: The Forgotten People Behind Britain's Megaliths.
Thurnam’s 137 Skulls: The Forgotten People Behind Britain’s Megaliths.

5. The R1b question: what the archaeological record permits us to predict

R1b is not a blood group. It is a Y-chromosome haplogroup passed primarily through the paternal line.

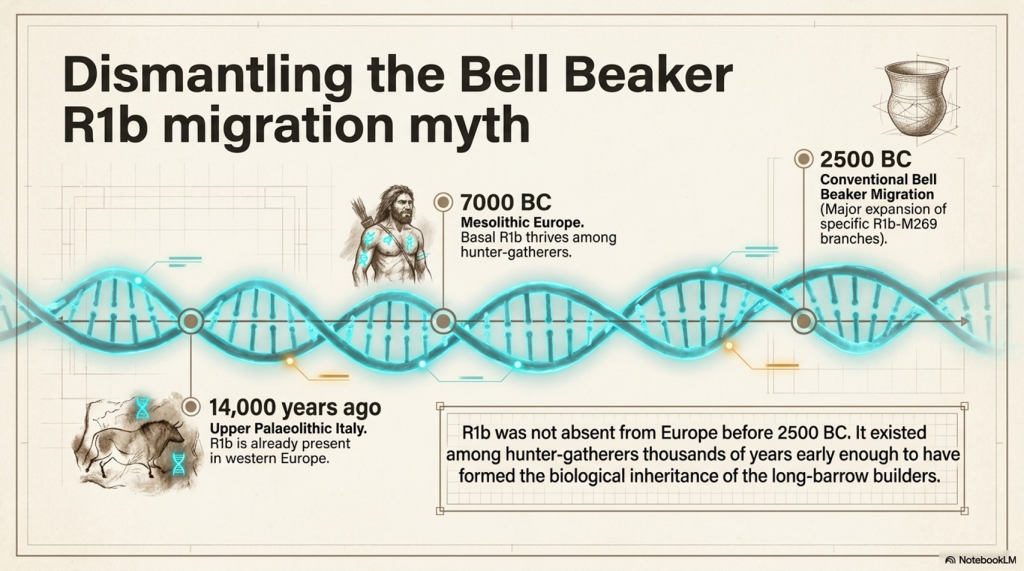
The traditional popular narrative often associates the major expansion of R1b in western Europe with Bronze Age Steppe-related or Bell Beaker populations after approximately 2500 BC.

That explanation may describe a major later expansion of particular R1b branches, especially those descending from R1b-M269.

It cannot mean that R1b itself was absent from Europe before the Bell Beaker period.

Ancient DNA has now identified R1b among European hunter-gatherers thousands of years before the proposed Bell Beaker migration.

Villabruna 1: R1b in Upper Palaeolithic Italy

The earliest confirmed R1b individual currently known is Villabruna 1, discovered at Riparo Villabruna in northern Italy.

Villabruna 1:

  • was an adult male;
  • belonged to the Late Upper Palaeolithic Epigravettian population;
  • was directly dated to approximately 14,000 years ago;
  • carried the early paternal lineage R1b1, or R-L754;
  • had estimated stature results ranging from approximately 167.2 to 169.1 centimetres.

The average stature reported for European Late Upper Palaeolithic males was approximately 165.6 centimetres. Villabruna 1 therefore fell within the taller part of the known male range for his period.

Villabruna 1 places R1b in western Europe around nine thousand years before the conventional Bell Beaker horizon.

His discovery separates two questions that are too often confused.

The first is when R1b originally appeared in Europe.

The second is when particular later branches of R1b expanded and became dominant.

The expansion of some R1b branches during the Bronze Age cannot be presented as the first appearance of the wider R1b lineage in Europe.
Thurnam's 137 Skulls: The Forgotten People Behind Britain's Megaliths.
Thurnam’s 137 Skulls: The Forgotten People Behind Britain’s Megaliths.

M50: a tall Mesolithic R1b hunter-gatherer

The strongest direct body-and-DNA crossover currently in our database is I4655, also recorded as SCCL_50 and M50, from Schela Cladovei on the Romanian bank of the Danube.

This individual:

  • belonged to basal R-L754/R1b;
  • dates to approximately 7059–6571 calibrated BC;
  • had a right tibia measuring 412 millimetres;
  • received a published stature estimate of 181.63 centimetres.

This is direct evidence that an exceptionally tall Mesolithic European man carried basal R1b roughly four thousand years before the conventional Bell Beaker horizon.

M50 is particularly important to our investigation because his stature fits the physical pattern being examined.

The evidence already shows that some Upper Palaeolithic European populations possessed tall stature, robust skeletal proportions and elongated cranial forms.

M50 now demonstrates that exceptional stature was also present in at least one securely identified early R1b hunter-gatherer.

It does not prove that M50 possessed an elongated skull, because his individual cranium has not yet been securely matched to published cranial measurements.

Nor does it prove that Britain’s long-barrow population was predominantly R1b.

What it proves is that R1b existed among European hunter-gatherers early enough to have formed part of the biological inheritance from which later long-barrow populations could have developed.

Villabruna 1 establishes the presence of R1b in Upper Palaeolithic western Europe.

M50 demonstrates the continued presence of basal R1b among Mesolithic hunter-gatherers and provides a direct association with exceptional male stature.

The responsible hypothesis is therefore:

Early R1b paternal lineages were present among European hunter-gatherers long before the Bell Beaker period, and Britain’s long-headed long-barrow population may have included descendants carrying those lineages.

That is a prediction capable of being tested.

It is not yet a universal conclusion.

The evidence ladder

StatementPresent status
R1b existed in Upper Palaeolithic western EuropeDirectly demonstrated by Villabruna 1 approximately 14,000 years ago
Villabruna 1 was relatively tall for his periodSupported by published stature estimates of approximately 167.2–169.1 centimetres
Basal R1b existed among Mesolithic European hunter-gatherersDirectly demonstrated
Some early R1b individuals were exceptionally tallDirectly demonstrated by I4655/M50, estimated at 181.63 centimetres
Long-headed European populations existed before the NeolithicDirectly demonstrated by Upper Palaeolithic and Mesolithic cranial measurements
Britain’s primary long-barrow burials were predominantly long-headedStrongly demonstrated by Thurnam’s series of 67 crania
Britain’s long-barrow population included males carrying R1bPlausible and directly testable, but not yet demonstrated across the population
All long-headed prehistoric people carried R1bNot demonstrated
All early R1b individuals were tall or long-headedNot demonstrated
R1b first appeared in Europe with Bell Beaker migrantsContradicted if interpreted as the first European appearance of the wider R1b lineage
Particular later R1b branches expanded during the Bronze AgePossible, but separate from the earlier presence of basal R1b

The absence of a securely identified round-headed early R1b individual in our present register strengthens the working association between early R1b, greater stature and elongated cranial form.

However, the absence of contradictory evidence is not the same as proof.

The archaeological record currently presents two independently demonstrated patterns.

The first is the presence of R1b paternal lineages among Upper Palaeolithic and Mesolithic European hunter-gatherers.

The second is the persistence of elongated cranial morphology from older European populations into Britain’s primary long-barrow burial population.

The working hypothesis is that these two patterns may intersect.

Britain’s long-headed long-barrow population may have included descendants of older European hunter-gatherers carrying early branches of R1b.

This is not an attempt to project the later Bell Beaker model backwards into an earlier period.

It is a testable prediction based on:

  • the confirmed presence of R1b in Upper Palaeolithic Italy;
  • the confirmed presence of basal R1b among Mesolithic Danube hunter-gatherers;
  • the exceptional stature of M50;
  • the existence of elongated cranial forms among older European populations;
  • the predominantly long-headed character of Britain’s primary long-barrow burials.
Thurnam's 137 Skulls: The Forgotten People Behind Britain's Megaliths.
Thurnam’s 137 Skulls: The Forgotten People Behind Britain’s Megaliths.

Aveline’s Hole: the missing British crossover

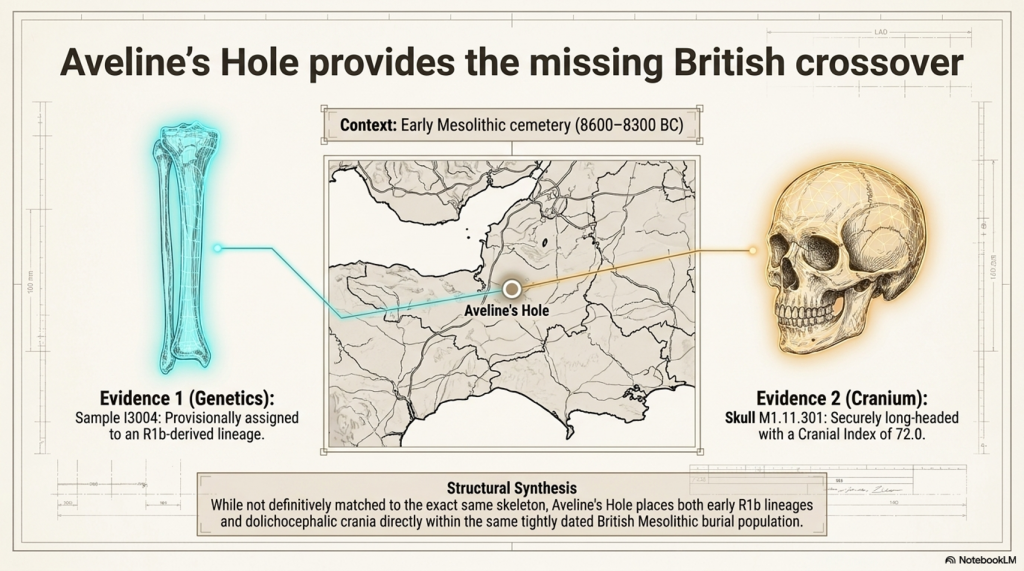
A third and potentially critical connection comes from Aveline’s Hole in Somerset, Britain’s largest known Early Mesolithic cemetery.

The male genetic sample I3004, also recorded as SB 337B3, came from a human tibia directly dated to approximately 8600–8300 BC.

The current genetic annotation assigns this individual to an R1b-derived paternal lineage. This would place R1b in Britain more than five thousand years before the conventional Bell Beaker horizon.

Aveline’s Hole also produced directly measured long-headed crania.

The reconstructed skull M1.11.301 had a maximum cranial length of 186 millimetres and a maximum breadth of 134 millimetres. Its cranial index was 72.0, placing it securely within the dolichocephalic, or long-headed, category.

The surviving evidence does not presently demonstrate that the R1b tibia and the long-headed skull belonged to the same person. They must therefore not be combined as though they represent a single securely reconstructed individual.

Nevertheless, their occurrence within the same tightly dated Early Mesolithic burial population is highly significant.

Aveline’s Hole provides the missing geographical and chronological bridge between the other two early R1b findings.

Villabruna 1 demonstrates that R1b1 was present in Upper Palaeolithic Italy approximately fourteen thousand years ago and was carried by an individual with a non-round-headed cranium.

M50 at Schela Cladovei demonstrates that basal R1b was carried by an exceptionally tall Mesolithic man whose published stature estimate was 181.63 centimetres.

Aveline’s Hole places an R1b-derived paternal lineage within a British Early Mesolithic cemetery where securely long-headed individuals were also buried.

These are three complementary observations:

Individual or siteGenetic evidencePhysical evidencePresent status
Villabruna 1, ItalyEarly R1b1/R-L754Cranial index 75.97; non-round-headedIndividual genetic and cranial crossover
Aveline’s Hole, BritainI3004 provisionally assigned to an R1b-derived lineageAt least one cemetery cranium had an index of 72.0Site-level crossover; genetic call requires confirmation
M50, Schela CladoveiBasal R-L754/R1bPublished stature estimate of 181.63 cmIndividual genetic and stature crossover

The three findings cannot yet be merged into a claim that one securely identified person possessed R1b, exceptional stature and an extremely long skull.

They do, however, substantially strengthen the prediction that these characteristics intersected within the older European population.

The evidence now shows:

  • early R1b associated with a non-round-headed individual in Upper Palaeolithic Italy;
  • a provisional R1b male within a British Mesolithic cemetery containing long-headed crania;
  • and basal R1b associated with exceptional stature in Mesolithic southeastern Europe.

The Aveline’s Hole result is particularly important because it places the proposed association directly within Britain thousands of years before the construction of the long barrows.

Its current Y-chromosome assignment carries a technical quality warning and must therefore remain provisional. However, it is no longer an isolated result without archaeological context. It occurs within a burial population whose surviving cranial evidence independently includes the long-headed form predicted by the hypothesis.

Revised evidence ladder

StatementPresent status
R1b existed in Upper Palaeolithic western EuropeDirectly demonstrated by Villabruna 1
An early R1b1 individual possessed a non-round-headed craniumDirectly demonstrated by Villabruna 1
Basal R1b existed among Mesolithic European populationsDirectly demonstrated by M50 and other early samples
Some early R1b individuals were exceptionally tallDirectly demonstrated by M50
Long-headed people were buried at Aveline’s HoleDirectly demonstrated by cranial measurements, including an index of 72.0
An R1b-derived male was buried at Aveline’s HoleProvisionally supported by I3004, but the contamination-flagged genetic call requires confirmation
The Aveline R1b male was the measured long-headed individualNot demonstrated; the DNA sample came from a tibia that has not been matched to the measured cranium
Early R1b and long-headed morphology occurred within the same British Mesolithic cemeterySupported at site-population level
Britain’s long-barrow males carried R1bStrengthened as a testable prediction, but not yet directly demonstrated
R1b first appeared in Europe with Bell Beaker migrantsContradicted if interpreted as the first European appearance of R1b

The next scientific step

The surviving long-barrow skulls identified by Thurnam should be relocated in museums and archaeological collections.

Their original labels, monument locations, chamber positions, burial phases and excavation histories should be reconciled with modern catalogues.

Where preservation allows, the research programme should include:

  • direct radiocarbon dating;
  • renewed cranial measurement;
  • three-dimensional scanning;
  • ancient-DNA sampling;
  • Y-chromosome identification;
  • mitochondrial identification;
  • isotope testing;
  • comparison with the known prehistoric body-size records.

The results should then be compared by individual.

Cranial form, stature, skeletal proportions, genetic lineage, burial position and archaeological date should no longer be studied as separate categories of evidence.

A confirmed group of primary long-barrow males possessing elongated skulls, exceptional stature and early R1b paternal lineages would provide the missing biological connection between Upper Palaeolithic populations, Mesolithic hunter-gatherers and Britain’s megalithic communities.

Until that work is carried out, the R1b connection remains a strong research hypothesis—not a licence to replace one simplistic migration narrative with another.

What can already be stated with certainty is that R1b did not first appear in Europe with the Bell Beaker phenomenon.

It was present in Upper Palaeolithic Italy approximately fourteen thousand years ago.

It survived among Mesolithic European hunter-gatherers.

And at least one of those securely identified Mesolithic R1b men stood approximately 181.63 centimetres tall.
Thurnam's 137 Skulls: The Forgotten People Behind Britain's Megaliths.
Thurnam’s 137 Skulls: The Forgotten People Behind Britain’s Megaliths.

6. Our new method: estimating a person’s height from the skull

Long-bar­row excavations often preserved skulls while postcranial bones were lost, mixed, damaged or separated from their original individuals.

That creates an obvious problem. Traditional stature reconstruction depends primarily on complete long bones such as the femur and tibia. Without those bones, the person’s height is usually left unknown.

Our project has therefore begun testing whether external cranial dimensions can provide a preliminary stature range.

The method is based on adult male prehistoric individuals for whom both cranial measurements and independently reconstructed body heights survive.

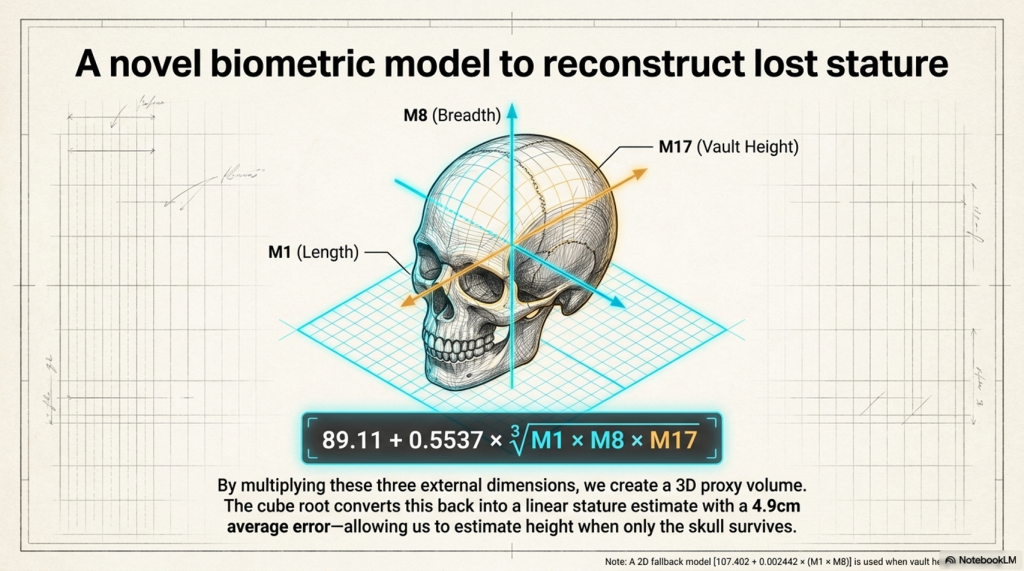
The three principal skull measurements are:

  • M1: maximum cranial length;
  • M8: maximum cranial breadth;
  • M17: cranial vault height.

These three dimensions are multiplied to produce an external cranial-size proxy. The cube root then converts that volume-like product back into a linear measurement.

Current three-dimensional model

Estimated stature in centimetres:

89.11 + 0.5537 × ∛(M1 × M8 × M17)

This is not a measurement of actual brain volume. It is an external three-dimensional cranial-size proxy.

The current calibration sample contains 14 securely or probably matched adult males.

SpecimenKnown statureM1M8M17
Barma Grande 5187.0204140153
Grotte des Enfants 4185.7198152131
Sungir 1183.2188144130
Předmostí 3183.0202145133
Oberkassel 1175.1194141137
Předmostí 9173.3196145134
Romito 4173.2195146132
Villabruna 1172.9181137.5133.5
Rochereil 1172.6190138138
Le Peyrat 5171.5194144126
Bichon 1169.9190144122
Arene Candide 3169.3185144126
Arene Candide 5167.1203142146
Chancelade 1165.7194135149

The present model has an average in-sample error of approximately 4.9 cm. That is useful for broad categories—short, medium, tall or very tall—but it is not accurate enough to claim an exact stature.

A simpler two-dimensional fallback is available when M17 is missing:

Estimated stature = 107.402 + 0.002442 × (M1 × M8)

In leave-one-out testing, this model produced an average error of approximately 5.9 cm:

Validation resultPerformance
Within ±5 cm57.1%
Within ±7 cm71.4%
Within ±10 cm78.6%
Mean absolute error5.9 cm

This level of error is why our database reports a range rather than presenting a cranial estimate as a direct measurement.

Historical records demonstrate the problem.

Historical caseBody-based stature2D skull estimateDifference
Coldrum male composite164.5 cm172.5 cm+8.0 cm
Halling Man166.5 cm from femur172.3 cm+5.8 cm
Ipswich Man180.0 cm174.9 cm−5.1 cm

The Coldrum result is also a group composite rather than one individual. None of these historical cases has been used to alter the model.

For most of Thurnam’s 67 long-bar­row skulls, only cranial indices, ranges and site averages are currently published in the material we have extracted. A cranial index alone cannot produce a height because it gives a proportion rather than the skull’s absolute dimensions.

We therefore need the original M1, M8 and M17 measurements from Crania Britannica, museum catalogues or surviving skulls.

Once recovered, those dimensions could provide the first systematic stature estimates for many of Britain’s long-headed long-bar­row occupants.

Thurnam's 137 Skulls: The Forgotten People Behind Britain's Megaliths.
Thurnam’s 137 Skulls: The Forgotten People Behind Britain’s Megaliths.

Applying the method to skulls without surviving body measurements

The most important purpose of the model is not to recalculate the heights of individuals whose skeletons already provide stature estimates.

Its real value lies in the cranial-only discoveries for which the skull survives, but the associated long bones are missing or cannot be securely identified.

Our present register contains several such cases.

Where maximum cranial length, maximum cranial breadth and cranial vault height survive, the preferred three-dimensional model can be used.

Where only maximum length and breadth are available, the less precise two-dimensional fallback model must be used.

The following results are therefore predictions rather than known statures.

Skull or siteM1 lengthM8 breadthM17 heightCranial indexModel usedEstimated statureApproximate height
Aveline’s Hole skull M1.11.301186 mm134 mmNot available72.0Two-dimensional168.3 cm5 ft 6 in
Carnon calvaria184 mm137 mmNot available74.46Two-dimensional169.0 cm5 ft 6½ in
Langwith Man192 mm135 mm127 mm70.31Three-dimensional171.5 cm5 ft 7½ in
Engis skull198 mm140 mmNot available70.71Two-dimensional175.1 cm5 ft 9 in
Dartford cranium207 mm150 mmNot available72.46Two-dimensional183.2 cmapproximately 6 ft

These estimates reveal a considerable range of possible body sizes among the surviving long-headed skulls.

The relatively small Aveline’s Hole and Carnon crania produce estimates of approximately 168 to 169 centimetres.

Langwith Man produces an estimate of approximately 171.5 centimetres.

The larger Engis skull produces an estimate of approximately 175 centimetres.

The exceptionally large Dartford cranium produces an estimated stature of approximately 183 centimetres, or around six feet.

These figures must not be treated as direct measurements.

The two-dimensional model has a mean leave-one-out error of approximately 5.9 centimetres. A practical working range of roughly six centimetres on either side of each estimate is therefore more responsible than presenting a single exact height.

The estimates could consequently be expressed approximately as:

  • Aveline’s Hole: 162 to 174 centimetres;
  • Carnon: 163 to 175 centimetres;
  • Langwith: 165 to 177 centimetres;
  • Engis: 169 to 181 centimetres;
  • Dartford: 177 to 189 centimetres.

These are working archaeological ranges, not formal statistical confidence intervals.

The importance of Aveline’s Hole

The Aveline’s Hole calculation requires particular care.

The measured skull had a cranial index of 72.0 and produces a two-dimensional stature estimate of approximately 168.3 centimetres.

However, this skull has not been securely matched to the male tibia from which the provisional R1b genetic result was obtained.

We cannot therefore claim that the R1b male himself stood 168 centimetres tall.

What can be stated is that the Aveline’s Hole cemetery contained:

  • a provisionally identified R1b-derived male;
  • at least one securely long-headed skull;
  • and a measured cranium whose dimensions suggest an individual of approximately medium stature.

The genetic, cranial and stature evidence remains associated at the cemetery-population level rather than the securely identified individual level.

What the estimates suggest

The cranial-only results do not indicate that all long-headed individuals were exceptionally tall.

Instead, they suggest that long-headed prehistoric populations included individuals ranging from approximately average stature to potentially more than six feet tall.

This is an important distinction.

Cranial shape and cranial size are not the same measurement.

A person may possess a strongly elongated skull without possessing an exceptionally large skull or exceptional body height.

The Dartford cranium combines an elongated form with unusually large absolute dimensions and consequently produces the tallest prediction.

Aveline’s Hole possesses a similarly long-headed form but smaller absolute dimensions and therefore produces a much lower stature estimate.

This is precisely why cranial index alone cannot estimate height.

The index reveals the proportion of the skull.

The complete measurements reveal its physical size.

Present conclusion

The model now provides provisional stature estimates for five cranial discoveries where a secure body-based comparison is unavailable.

The results range from approximately 168 centimetres to approximately 183 centimetres.

They demonstrate that Britain and western Europe’s surviving long-headed crania did not represent one uniform body size.

Some appear to have belonged to individuals of ordinary or medium stature.

Others, particularly the Dartford individual, may have belonged to exceptionally tall people.

Further recovery of the original cranial measurements from long-barrow collections could extend this analysis from five isolated examples to a much larger prehistoric population.
Thurnam's 137 Skulls: The Forgotten People Behind Britain's Megaliths.
Thurnam’s 137 Skulls: The Forgotten People Behind Britain’s Megaliths.

7. Who built Britain’s megaliths—and what must happen next?

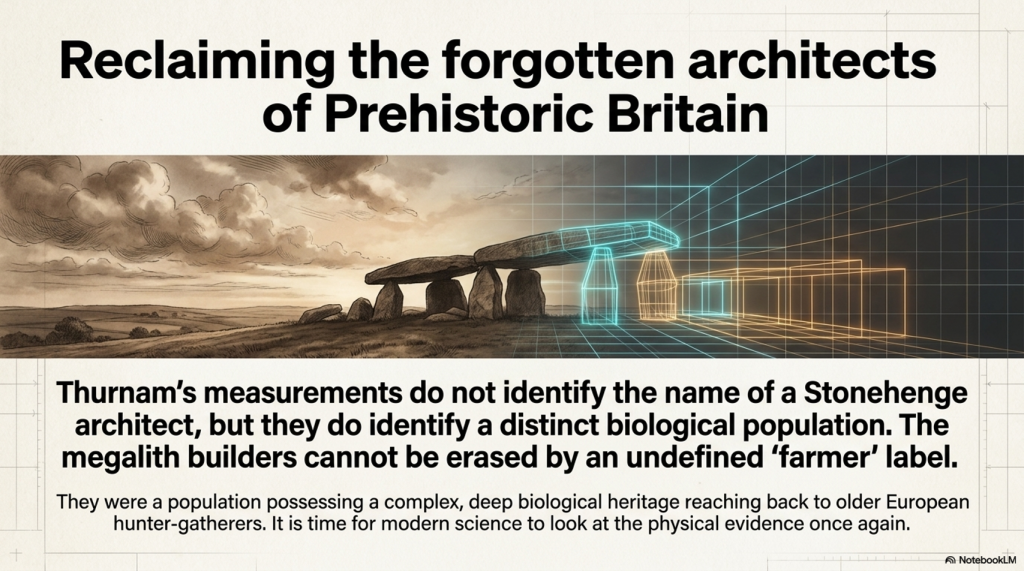
Thurnam’s measurements do not identify the name of a Stonehenge architect.

They do something more fundamental: they identify a distinctive biological population occupying Britain’s early monumental burial tradition.

The 67 long-bar­row crania were predominantly long-headed. The 70 later round-bar­row skulls contained no dolichocephalic or sub-dolichocephalic individuals in Thurnam’s classification. Later burials inserted into long barrows were broader-headed and averaged approximately 79.

The change in human morphology follows the change in monument and burial practice.

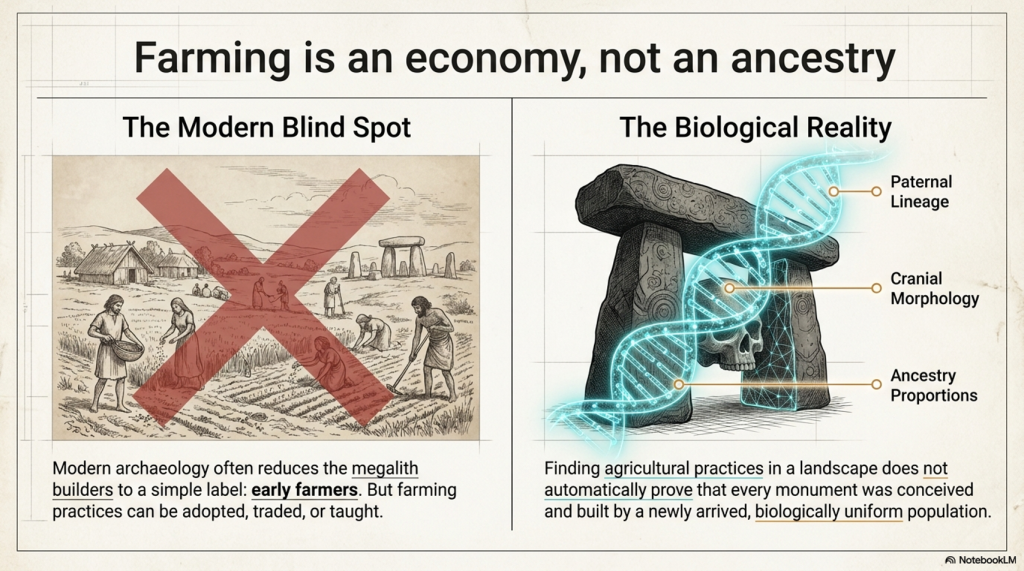
This creates a serious problem for the simplified story that “incoming farmers built Britain’s megaliths.”

Modern genetics supports substantial migration into Britain during the Neolithic. It does not automatically prove that every long barrow, causewayed enclosure, stone setting and later phase of Stonehenge was conceived by one biologically uniform immigrant population.
Thurnam's 137 Skulls: The Forgotten People Behind Britain's Megaliths.
Thurnam’s 137 Skulls: The Forgotten People Behind Britain’s Megaliths.

The word farmer identifies subsistence practice.

It does not identify:

  • paternal lineage;
  • cranial morphology;
  • ancestry proportions;
  • social leadership;
  • specialist engineering knowledge;
  • the population selected for monumental burial.

People can adopt agriculture without losing their ancestry. Incoming farmers can mix with indigenous hunter-gatherers. Different groups can cooperate, exchange partners and technologies, or occupy different positions within the same society.

The traditional construct therefore contains a hidden logical jump:

Farming appears in the archaeological record; therefore incoming farmers designed and built the monumental landscape.

That conclusion must be demonstrated, not assumed.

What the evidence currently permits us to say

FindingAssessment
Long-bar­row and round-bar­row skull populations were markedly differentStrongly demonstrated
The original long-bar­row population was predominantly long-headedStrongly demonstrated
Later secondary burials inside long barrows were broader-headedStrongly demonstrated
Long-headed morphology has Upper Palaeolithic European precedentsDemonstrated
Early R1b existed among Mesolithic European hunter-gatherersDemonstrated
Long-bar­row people descended partly from older hunter-gatherersStrong continuity hypothesis
Long-bar­row males probably included early R1b lineagesTestable hypothesis
Long-bar­row people alone built every British megalithNot demonstrated
Incoming farmers alone built every British megalithNot demonstrated

This is the crucial distinction.

The evidence does not justify declaring that every long-headed person was a monument builder or that one paternal lineage created an entire civilisation.

But it equally does not justify removing the long-headed burial population from the discussion and replacing them with an undefined category called “farmers.”

The surviving human remains offer a direct route to resolving the question.

A serious research project should:

  • locate all surviving skulls from Thurnam’s 17 long-bar­row series;
  • identify individual museum and excavation numbers;
  • separate primary deposits from later intrusions;
  • rescan and remeasure the crania;
  • recover M1, M8 and M17 for stature modelling;
  • radiocarbon-date the individuals directly;
  • sequence their DNA;
  • compare their ancestry with Mesolithic, Early Neolithic and Bronze Age populations;
  • test whether R1b occurs among the long-headed males;
  • compare their reconstructed statures with our 429-person prehistoric body-size database.

This investigation could confirm, modify or reject the Cro-Magnon–Mesolithic–long-bar­row continuity hypothesis.

That is how science should work.

The measurements have existed since the nineteenth century. Modern radiocarbon dating, 3D imaging and ancient DNA now allow us to test what Thurnam could only observe.

“Long barrows, long skulls; round barrows, round skulls” was not merely a Victorian slogan.

It was a concise description of a measurable change in Britain’s prehistoric population.

The physical evidence has waited more than 150 years for archaeology to finish the investigation.
Thurnam's 137 Skulls: The Forgotten People Behind Britain's Megaliths.
Thurnam’s 137 Skulls: The Forgotten People Behind Britain’s Megaliths.

PODCAST

Author’s Biography

Robert John Langdon, a polymathic luminary, emerges as a writer, historian, and eminent specialist in LiDAR Landscape Archaeology.

His intellectual voyage has been interwoven with stints as an astute scrutineer in government and grand corporate bastions, a tapestry spanning British Telecommunications, Cable and Wireless, British Gas, and the esteemed University of London.

A decade hence, Robert’s transition into retirement unfurled a chapter of insatiable curiosity. This phase saw him immerse himself in Politics, Archaeology, Philosophy, and the enigmatic realm of Quantum Mechanics. His academic odyssey traversed the venerable corridors of knowledge hubs such as the Museum of London, University College London, Birkbeck College, The City Literature Institute, and Chichester University.

In the symphony of his life, Robert is a custodian of three progeny and a pair of cherished grandchildren. His sanctuary lies ensconced in the embrace of West Wales, where he inhabits an isolated cottage, its windows framing a vista of the boundless sea – a retreat from the scrutinising gaze of Her Majesty’s Revenue and Customs, an amiable clandestinity in the lap of nature.

Exploring Prehistoric Britain: A Journey Through Time

My blog delves into the fascinating mysteries of prehistoric Britain, challenging conventional narratives and offering fresh perspectives grounded in cutting-edge research, particularly LiDAR technology. I invite you to explore some key areas of my research. For example, the Wansdyke, often cited as a defensive structure, is re-examined in light of new evidence. I’ve presented my findings in my blog post Wansdyke: A British Frontier Wall – ‘Debunked’, and a Wansdyke LiDAR Flyover video further visualises my conclusions.

My work also often challenges established archaeological dogma. I argue that many sites, such as Hambledon Hill, commonly identified as Iron Age hillforts, are not what they seem. My posts Lidar Investigation Hambledon Hill – NOT an ‘Iron Age Fort’ and Unmasking the “Iron Age Hillfort” Myth explore these ideas in detail and offer an alternative view. Similarly, sites like Cissbury Ring and White Sheet Camp receive re-evaluations based on LiDAR analysis in my posts “Lidar Investigation Cissbury Ring through time” and “Lidar Investigation White Sheet Camp,“ revealing fascinating insights into their true purpose. I have also examined South Cadbury Castle, often linked to the mythical Camelot56.

My research also extends to ancient water management, including the role of canals and other linear earthworks. I have discussed the true origins of Car Dyke in multiple posts, including Car Dyke – ABC News Podcast and Lidar Investigation Car Dyke – North Section, which suggest a Mesolithic origin 2357. I also explore the misidentification of Roman aqueducts, as seen in my posts on the Great Chesters (Roman) Aqueduct. My research has also been greatly informed by my post-glacial flooding hypothesis, which has helped explain landscape transformations over time. I have discussed this hypothesis in several posts, including AI now supports my Post-Glacial Flooding Hypothesis and Exploring Britain’s Flooded Past: A Personal Journey

Finally, my blog also investigates prehistoric burial practices, as seen in Prehistoric Burial Practices of Britain and explores the mystery of Pillow Mounds, often mistaken for medieval rabbit warrens, but with a potential link to Bronze Age cremation in my posts: Pillow Mounds: A Bronze Age Legacy of Cremation? and The Mystery of Pillow Mounds: Are They Really Medieval Rabbit Warrens?. My research also includes astronomical insights into ancient sites, for example, in Rediscovering the Winter Solstice: The Original Winter Festival. I also review new information about the construction of Stonehenge in The Stonehenge Enigma.

Further Reading

For those interested in British Prehistory, visit www.prehistoric-britain.co.uk, a comprehensive resource featuring an extensive collection of archaeology articles, modern LiDAR investigations, and groundbreaking research. The site also includes insights and excerpts from the acclaimed Robert John Langdon Trilogy, a series of books that explore Britain during the Prehistoric period. Titles in the trilogy include The Stonehenge Enigma, Dawn of the Lost Civilisation, and The Post-Glacial Flooding Hypothesis, which offer compelling evidence of ancient landscapes shaped by post-glacial flooding.

To further explore these topics, Robert John Langdon has developed a dedicated YouTube channel featuring over 100 video documentaries and investigations that complement the trilogy. Notable discoveries and studies showcased on the channel include 13 Things that Don’t Make Sense in History and the revelation of Silbury Avenue – The Lost Stone Avenue, a rediscovered prehistoric feature at Avebury, Wiltshire.

In addition to his main works, Langdon has released a series of shorter, accessible publications, ideal for readers delving into specific topics. These include:

For active discussions and updates on the trilogy’s findings and recent LiDAR investigations, join our vibrant community on Facebook. Engage with like-minded enthusiasts by leaving a message or contributing to debates in our Facebook Group.

Whether through the books, the website, or interactive videos, we aim to provide a deeper understanding of Britain’s fascinating prehistoric past. We encourage you to explore these resources and uncover the mysteries of ancient landscapes through the lens of modern archaeology.

For more information, including chapter extracts and related publications, visit the Robert John Langdon Author Page. Dive into works such as The Stonehenge Enigma or Dawn of the Lost Civilisation, and explore cutting-edge theories that challenge traditional historical narratives.

Other Blogs

[sitemap_posts]
The Great Bell Beaker Migration Myth

Introduction

In 2018, a single scientific paper fundamentally changed the accepted history of prehistoric Britain.

Published in Nature, the study analysed ancient DNA from hundreds of prehistoric individuals across Europe and concluded that around 90% of Britain’s Neolithic ancestry had been replaced within a few centuries after approximately 2450 BC. The proposed mechanism was the arrival of people associated with the Bell Beaker phenomenon, transforming what had previously been viewed largely as a cultural development into one of the largest population replacements ever suggested for prehistoric Europe. (The Great Bell Beaker Migration Myth – Haplogroup R1b)

The implications were enormous.

If correct, the builders of Britain’s great Neolithic monuments were largely replaced by an incoming population shortly after the final phases of Stonehenge. For many archaeologists, the debate appeared settled. Bell Beaker pottery was no longer viewed simply as evidence of trade or cultural exchange, but as the archaeological signature of a substantial migration.

Since its publication, the paper has become the cornerstone of the modern Beaker migration hypothesis. Its conclusions are now widely repeated in books, documentaries, museums and artificial intelligence systems as established fact.

Yet scientific papers do not become facts through repetition.

 (The Great Bell Beaker Migration Myth - Haplogroup R1b)
(The Great Bell Beaker Migration Myth – Haplogroup R1b)

They remain interpretations of evidence.

This distinction is critical because the 2018 study contains two very different components. The first is the genetic evidence itself, generated using sophisticated laboratory techniques and robust statistical analysis. The second is the archaeological interpretation built upon those genetic results.

These are not the same thing.

The genetic data reveal changes in ancestry through time. They do not directly reveal how those changes occurred, how many people migrated, whether migration was peaceful or gradual, whether technology spread independently of populations, or whether long-established communities continued alongside newcomers. Those questions require archaeological interpretation, and it is here that debate remains both possible and necessary.

This article does not challenge the quality of the genetic research. On the contrary, the laboratory science represents a remarkable achievement and provides an invaluable dataset for understanding prehistoric populations. The question it raises is whether the historical conclusions drawn from that dataset are the only ones supported by the evidence.

To answer that question, we return to the original publication itself.

 (The Great Bell Beaker Migration Myth - Haplogroup R1b)
(The Great Bell Beaker Migration Myth – Haplogroup R1b)

Rather than relying on popular summaries or inherited archaeological narratives, we will examine what the paper actually demonstrates, what it explicitly acknowledges as uncertain, and where interpretation extends beyond observation. We will then compare those conclusions with independent evidence from archaeology, chronology, maritime capability, engineering, long-distance exchange networks and anthropometric analysis.

Only by considering all of the evidence together can we assess whether Britain’s Bell Beaker story is truly one of wholesale population replacement—or whether a more complex and more plausible explanation has been overlooked.

Table 1.1 – What the 2018 Paper Claims vs What It Directly Measures

Directly MeasuredInferred Interpretation
Ancient DNA sequencesMigration scale
Steppe ancestry proportionsNumber of migrants
Y-chromosome frequenciesLanguage
Radiocarbon datesCultural identity
Genetic similaritySocial organisation
Burial geneticsPopulation replacement

 (The Great Bell Beaker Migration Myth - Haplogroup R1b)
(The Great Bell Beaker Migration Myth – Haplogroup R1b)

Section 1 — The Paper That Changed British Prehistory

In March 2018, the scientific journal Nature published one of the most influential archaeological papers of the twenty-first century: The Beaker Phenomenon and the Genomic Transformation of Northwest Europe by Olalde et al. The study analysed genome-wide DNA from 400 prehistoric individuals across Europe, including 226 associated with the Bell Beaker phenomenon, making it the largest ancient DNA investigation of the Beaker period to date.

The headline conclusion was dramatic. The authors proposed that Britain underwent a genetic transformation shortly after 2450 BC, estimating that around 90% of the existing Neolithic gene pool was replaced within a few centuries following the arrival of populations associated with the Bell Beaker Complex. This conclusion rapidly became accepted as the defining explanation for one of the most important transitions in British prehistory.

The impact extended far beyond academic archaeology. Museums rewrote their displays. Television documentaries presented the migration as an established fact. Popular history books adopted the new narrative, while artificial intelligence systems now routinely repeat the claim that Britain was almost entirely repopulated by incoming Beaker migrants around 4,500 years ago.

The influence of a paper published in one of the world’s most respected scientific journals is entirely understandable. Ancient DNA has transformed archaeology over the last decade, allowing researchers to investigate prehistoric relationships with a level of precision unimaginable only a generation ago. The laboratory methods employed by Olalde and colleagues represent an outstanding scientific achievement, and the genetic dataset itself remains one of the most important resources available for studying prehistoric Europe.

 (The Great Bell Beaker Migration Myth - Haplogroup R1b)
(The Great Bell Beaker Migration Myth – Haplogroup R1b)

However, scientific data and historical interpretation are not the same thing.

The DNA recovered from ancient skeletons measures biological ancestry. It identifies patterns of genetic similarity, estimates ancestral components and tracks changes in populations through time. What it cannot directly measure is the historical process responsible for those changes. Genetics cannot determine whether ancestry shifted through invasion, peaceful migration, elite dominance, gradual population mixing, long-term trade networks, demographic expansion, disease, social selection or a combination of several processes. Those explanations lie outside the laboratory and belong instead to archaeology, anthropology and historical interpretation.

This distinction is crucial because much of the public discussion has blurred the line between what the paper actually measured and what the authors inferred from those measurements. The genetic observations themselves are objective scientific results. The reconstruction of Britain’s prehistoric history from those results is necessarily interpretative.

To be fair to the authors, they acknowledge this limitation themselves. In their discussion, they conclude by calling for further archaeological research into the social, technological, climatic and demographic processes that may have produced the observed genetic patterns, recognising that DNA alone cannot explain why those changes occurred.

That acknowledgement is often absent from popular accounts.

Instead, a more nuanced scientific conclusion has gradually become simplified into a much stronger historical claim: that the arrival of the Bell Beaker phenomenon represents a near-complete replacement of Britain’s population. Once repeated often enough, that interpretation has acquired the appearance of an established fact, despite relying on assumptions that extend beyond the genetic evidence itself.

This article does not dispute the quality of the genetic science. Nor does it deny that Britain’s genetic composition changed during the late third millennium BC. Instead, it asks a different question:

Does the evidence actually require the historical narrative that has been built upon it?

To answer that question, we shall examine the original paper in detail before comparing its conclusions with independent archaeological evidence, including long-distance trade networks, maritime capabilities, monument construction, engineering continuity, chronology, and anthropology. Only then can we determine whether the modern Beaker migration model is the only explanation—or simply one possible interpretation of the available evidence.


 (The Great Bell Beaker Migration Myth - Haplogroup R1b)
(The Great Bell Beaker Migration Myth – Haplogroup R1b)

Section 2 – What the DNA Actually Demonstrates

One of the biggest mistakes made by both supporters and critics of the Beaker migration hypothesis is failing to distinguish between observations and interpretations. Before questioning any conclusion, we must first establish what the genetic evidence genuinely shows.

The Olalde et al. study analysed genome-wide DNA from 400 prehistoric Europeans, including 226 individuals associated with the Bell Beaker phenomenon. These samples were drawn from sites across Britain, the Netherlands, Germany, Hungary, Spain, Portugal, France, Italy and several other regions, providing an unprecedented dataset for examining population relationships during the third millennium BC.

Using standard population genetics techniques, including Principal Component Analysis (PCA), ADMIXTURE modelling, and qpAdm ancestry estimation, the authors compared the genetic signatures of these ancient individuals with those of earlier Neolithic populations and contemporary groups across Europe. These methods are widely accepted within archaeogenetics and are not, in themselves, controversial.

The results revealed several clear observations.

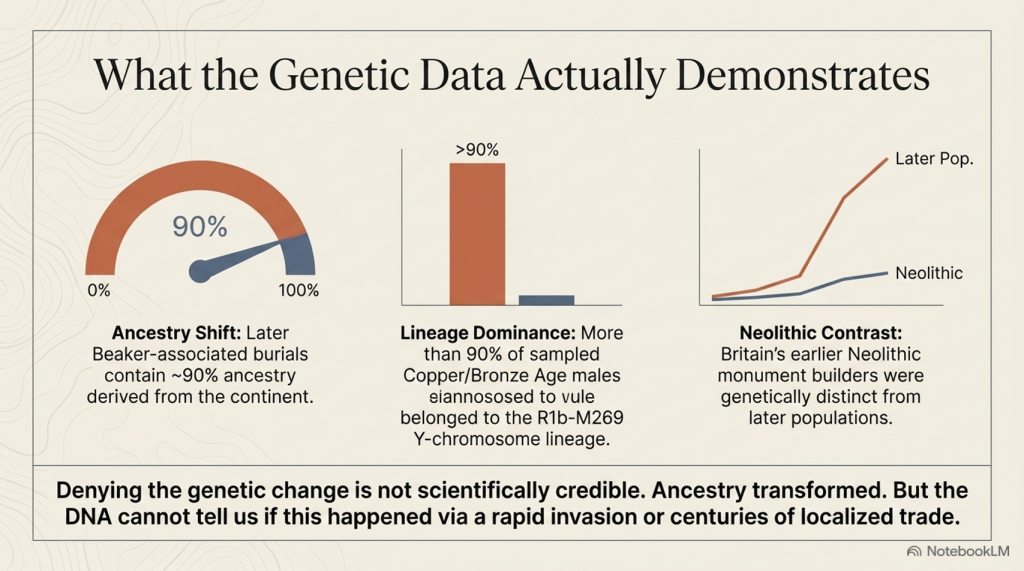
First, Britain’s Neolithic population differed genetically from the majority of later Bell Beaker-associated individuals found after approximately 2450 BC. Whereas earlier Neolithic Britons showed little or no detectable Steppe-related ancestry, later Beaker-associated burials contained substantially higher proportions.

Second, the Y-chromosome composition changed dramatically. Neolithic males were dominated by earlier European lineages, whereas more than ninety per cent of sampled males from the Copper and Bronze Ages belonged to the R1b-M269 lineage, a haplogroup already common among Beaker-associated populations on the European mainland.

Third, statistical modelling suggested that by the Middle Bronze Age, most sampled individuals derived the majority of their ancestry from populations already present in continental Europe before approximately 2450 BC. On the basis of these ancestry models, the authors estimated that Britain’s Neolithic gene pool had been replaced by approximately ninety per cent.

 (The Great Bell Beaker Migration Myth - Haplogroup R1b)
(The Great Bell Beaker Migration Myth – Haplogroup R1b)

These findings are significant.

They demonstrate that Britain’s genetic composition changed substantially during the late third millennium BC. Any interpretation of British prehistory must therefore account for this transformation. Simply denying the existence of genetic change is no longer a scientifically credible position.

However, the study also produced another important result that receives far less public attention.

The Bell Beaker phenomenon was not genetically uniform.

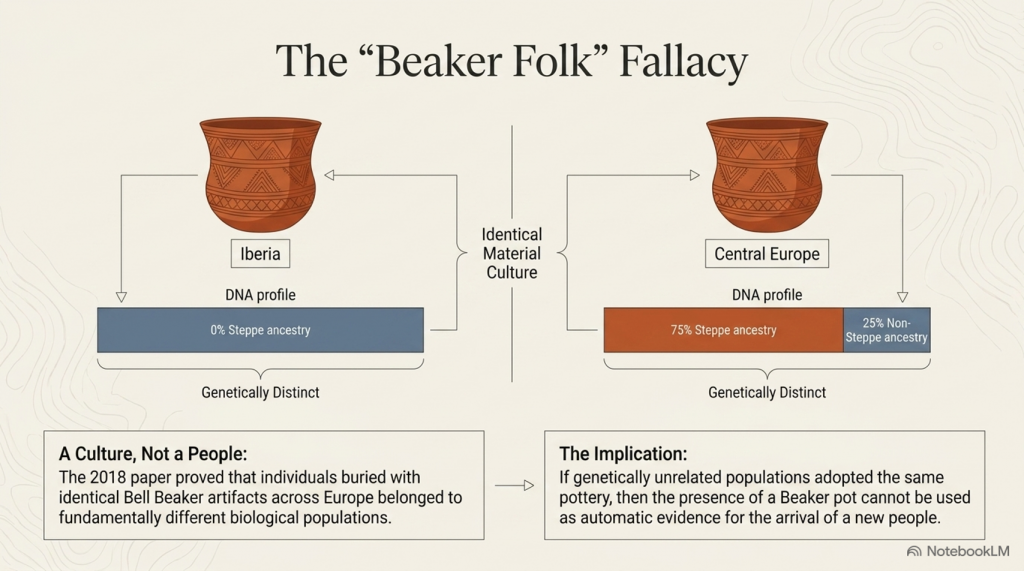
One of the paper’s most important discoveries was that Beaker-associated populations differed markedly across Europe. Individuals buried with Bell Beaker artefacts in Iberia shared little genetic affinity with Beaker-associated populations from Central Europe. In Hungary, individuals buried within the same archaeological tradition displayed Steppe ancestry ranging from virtually zero to approximately seventy-five per cent. Even within individual cemeteries, substantial genetic variation existed between people buried only a short distance apart.

This finding fundamentally overturned the older nineteenth-century concept of a single “Beaker Folk.”

Instead, the evidence demonstrated that Bell Beaker material culture was adopted by populations with different genetic backgrounds across Europe.

The authors therefore concluded that both cultural transmission and human migration contributed to the spread of the Beaker phenomenon, with their relative importance varying between different regions. In Iberia, they argued that Beaker culture spread largely without major migration, whereas Britain appeared to represent a very different demographic pattern.

Up to this point, the paper remains firmly grounded in its genetic observations.

The crucial question, however, is whether the next step in the argument necessarily follows.

Does a change in genetic ancestry automatically demonstrate a mass migration that replaced Britain’s population?

Or does the DNA simply demonstrate that ancestry changed, leaving the mechanism responsible still open to investigation?

That distinction lies at the heart of the modern Beaker debate, because the evidence presented by Olalde and colleagues answers the first question with confidence while leaving the second dependent upon archaeological interpretation.

The following section examines precisely where that transition occurs.


Section 3 – Where Observation Becomes Interpretation

The distinction between scientific observation and historical interpretation is fundamental to every discipline. Astronomy measures the movement of planets but must interpret how solar systems formed. Geology measures rock strata but must interpret the processes that created them. Archaeogenetics is no different. DNA provides powerful evidence about biological ancestry, but history cannot be reconstructed from genetics alone.

This distinction becomes increasingly important as we move through the conclusions of Olalde et al.

The genetic evidence demonstrates that Britain’s genetic composition changed substantially during the late third millennium BC. That observation is supported by the ancient DNA itself and is not disputed here. The question is not whether ancestry changed, but how that change occurred.

Unfortunately, much of the subsequent discussion has treated these two questions as though they were identical.

They are not.

Ancient DNA can identify genetic relationships between populations and estimate the proportion of ancestry they share. It can show whether individuals buried in Britain around 2000 BC were genetically more similar to populations living on the European mainland than to Britain’s earlier Neolithic inhabitants. It can estimate when those ancestral components first appear within the archaeological record. These are measurable scientific observations.

However, DNA cannot identify the historical mechanism responsible for those observations.

 (The Great Bell Beaker Migration Myth - Haplogroup R1b)
(The Great Bell Beaker Migration Myth – Haplogroup R1b)

It cannot determine whether people arrived peacefully or violently. It cannot establish whether movement occurred over two generations or twenty. It cannot reveal whether migrants arrived as farmers, traders, craftsmen, political elites or small family groups. It cannot determine whether newcomers absorbed existing communities or whether existing communities absorbed the newcomers. Most importantly, it cannot distinguish between demographic replacement and genetic replacement.

These are archaeological questions, not genetic ones.

This distinction may appear subtle, but it is crucial.

Imagine a small incoming population possessing a social or economic advantage that results in greater reproductive success over many generations. Their genetic contribution could eventually dominate the population while leaving much of the existing society, its engineering, language, traditions and landscape knowledge intact. Conversely, a large migration might leave relatively little long-term genetic impact if it failed to establish itself. Genetics records ancestry, not history.

The Olalde paper itself recognises these limitations.

In the discussion, the authors suggest that archaeology must investigate factors such as social organisation, technology, subsistence, climate, population size and even pathogen exposure to explain the demographic changes observed in the DNA. In other words, the genetic evidence identifies that a change occurred but does not explain why or how it happened.

Yet popular accounts rarely preserve this distinction.

Instead, a series of assumptions has gradually become embedded within the archaeological narrative:

  • Genetic change becomes migration.
  • Migration becomes mass migration.
  • Mass migration becomes population replacement.
  • Population replacement becomes cultural replacement.
  • Cultural replacement becomes the explanation for every major archaeological change after 2450 BC.

Each step moves progressively further from the direct evidence.

At no point does the DNA itself demonstrate that ninety per cent of Britain’s inhabitants physically disappeared within a few centuries. It demonstrates that approximately 90 per cent of the ancestry measured in later-sampled individuals can be modelled as deriving from populations already present on the continent before approximately 2450 BC. Those are not identical statements, however similar they may initially appear.

This distinction becomes even more significant when viewed alongside the archaeological record. Monument construction, long-distance exchange, advanced engineering and sophisticated maritime activity all continue across the period in question. If Britain experienced one of the largest population replacements in European prehistory, we must ask whether the archaeological evidence reflects such a profound societal disruption.

That question has rarely been asked because the genetic interpretation has been so rapidly accepted that it has begun to shape the reading of archaeology itself.

Science should proceed in the opposite direction.

Independent lines of evidence should be compared to determine whether they converge on the same conclusion or suggest alternative explanations. Genetics provides one line of evidence. Archaeology provides another. Engineering, maritime capability, chronology, settlement continuity and biological anthropology each contribute further pieces of the puzzle.

Only when all of these independent datasets point towards the same conclusion can a historical interpretation be regarded as robust.

The remainder of this article, therefore, moves beyond genetics alone. Rather than questioning laboratory science, we shall examine whether the broader archaeological evidence supports the modern Beaker migration narrative—or whether an alternative interpretation can explain both the genetic observations and the archaeological record equally well.


Section 4 – Bell Beaker: A Culture or a People?

Before examining Britain, we must first ask a more fundamental question.

What exactly is the Bell Beaker phenomenon?

For more than a century, archaeology treated Bell Beaker pottery as the archaeological signature of a distinct people. Wherever the characteristic bell-shaped pottery appeared, it was widely assumed that the “Beaker Folk” had arrived with it. This interpretation became deeply embedded in archaeological literature and survived well into the twentieth century.

Modern genetics has fundamentally changed that view.

One of the most important conclusions of Olalde et al. is not that Britain experienced a major genetic transformation, but that the Bell Beaker phenomenon itself was genetically heterogeneous. Individuals buried with Bell Beaker artefacts in Iberia, Central Europe and Britain did not belong to a single biological population. Instead, they represented communities with markedly different genetic ancestries who nevertheless shared similar pottery styles, burial customs and aspects of material culture.

This finding has profound implications.

If Bell Beaker artefacts can be adopted by genetically unrelated populations across Europe, then the presence of Beaker pottery cannot automatically be taken as evidence for the arrival of a new people. At the very least, the archaeological label “Bell Beaker” must be distinguished from any assumption of biological identity.

The distribution of Bell Beaker material culture reinforces this conclusion.

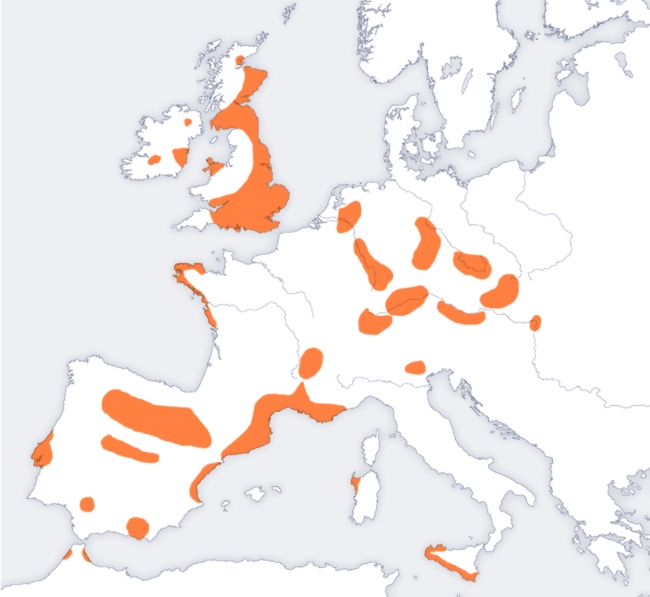
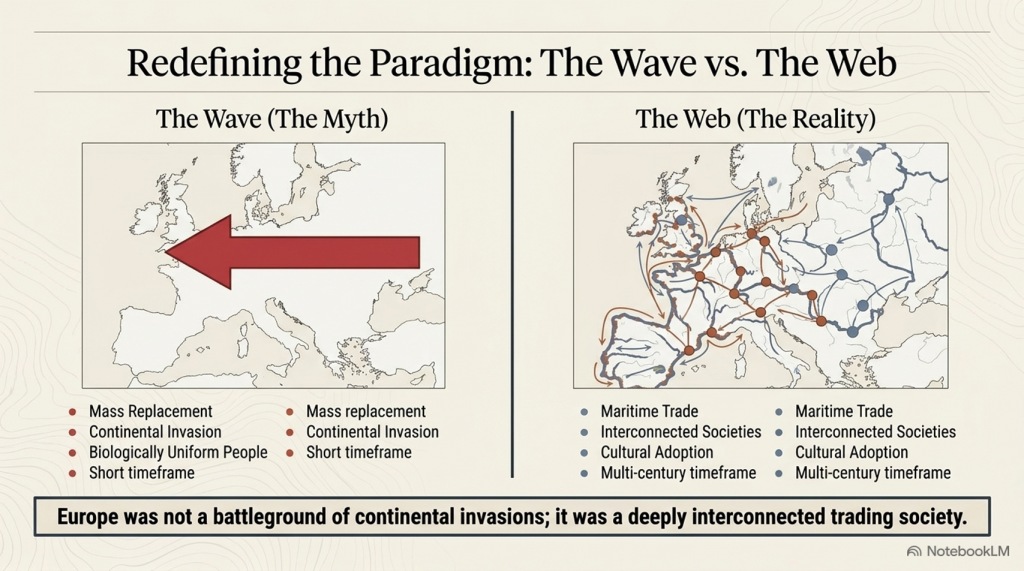
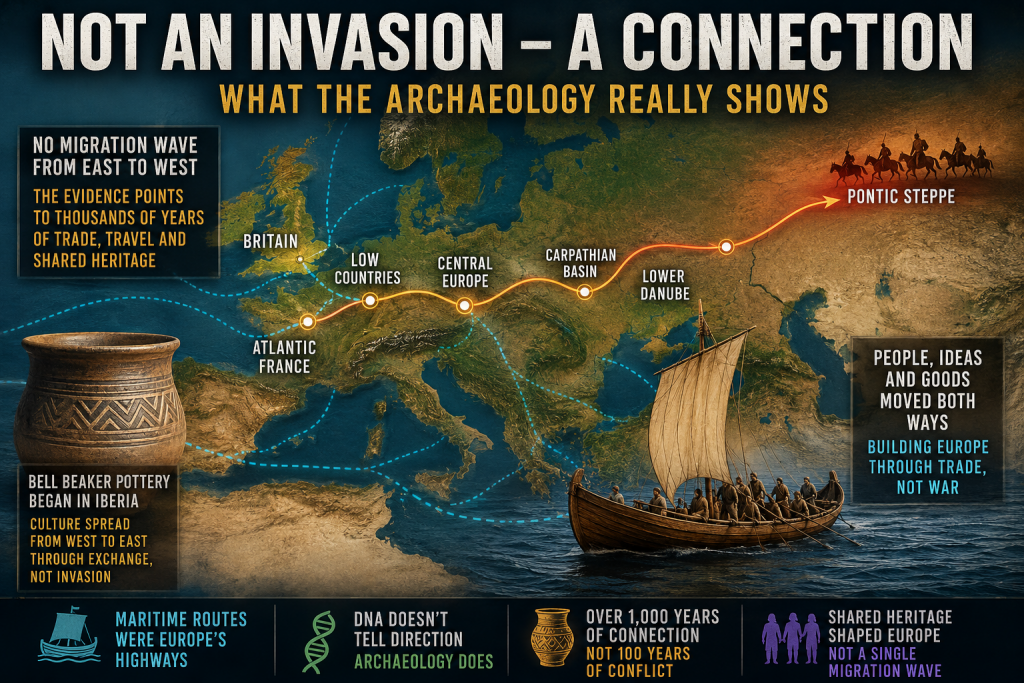
Figure 4.1 shows the geographical spread of Bell Beaker sites across Europe. Rather than forming a continuous wave advancing steadily across the continent, the distribution is fragmented into regional clusters. Strong concentrations occur around the Atlantic façade, the Iberian Peninsula, southern Britain and Ireland, while inland Europe contains numerous isolated concentrations separated by large areas where Beaker material is scarce or absent.

 (The Great Bell Beaker Migration Myth)
(The Great Bell Beaker Migration Myth)

Equally striking is the relationship with Europe’s principal transport routes. Many of these concentrations follow major river systems, estuaries and coastlines that would have formed the prehistoric highways of the third millennium BC. Such a distribution is entirely consistent with the movement of people, ideas and goods through established communication networks.

The map alone cannot determine the mechanism responsible. A clustered distribution may result from trade, seasonal mobility, cultural adoption, small-scale migration or combinations of all these processes. However, it does demonstrate that the Bell Beaker phenomenon did not spread as a simple, uniform expansion of a single homogeneous population across Europe.

This observation aligns closely with the genetic evidence.

Olalde et al. demonstrated that Beaker-associated individuals in Iberia remained genetically similar to earlier local populations, whereas those elsewhere possessed much higher proportions of Steppe ancestry. Even within the same cemeteries, individuals could display markedly different ancestral compositions. In other words, the archaeological phenomenon spread far more widely than any single genetic lineage.

Taken together, the archaeology and genetics point towards a more complex picture than the nineteenth-century concept of a migrating “Beaker Folk.” They reveal a cultural horizon adopted by populations with diverse biological backgrounds rather than a single people expanding uniformly across Europe.

This distinction is critical because it changes the question we should be asking.

The issue is no longer whether Bell Beaker culture moved across Europe—it clearly did.

The question is how it moved.

Did its remarkable spread depend primarily upon the movement of entire populations?

Or did it travel along the same maritime and riverine exchange networks that already connected prehistoric Europe, with ideas, technologies and people moving together in varying proportions depending upon local circumstances?

The distribution map cannot answer that question by itself.

However, it establishes an important framework for the remainder of this investigation. If the Bell Beaker culture was transmitted through extensive communication networks elsewhere in Europe, we should expect Britain to be examined within that same context rather than being treated as an isolated exception.

The next step is therefore to investigate Britain’s archaeological record and ask whether it resembles the disruption expected from a near-complete population replacement, or whether it instead reflects continuity within an already sophisticated and well-connected prehistoric society.


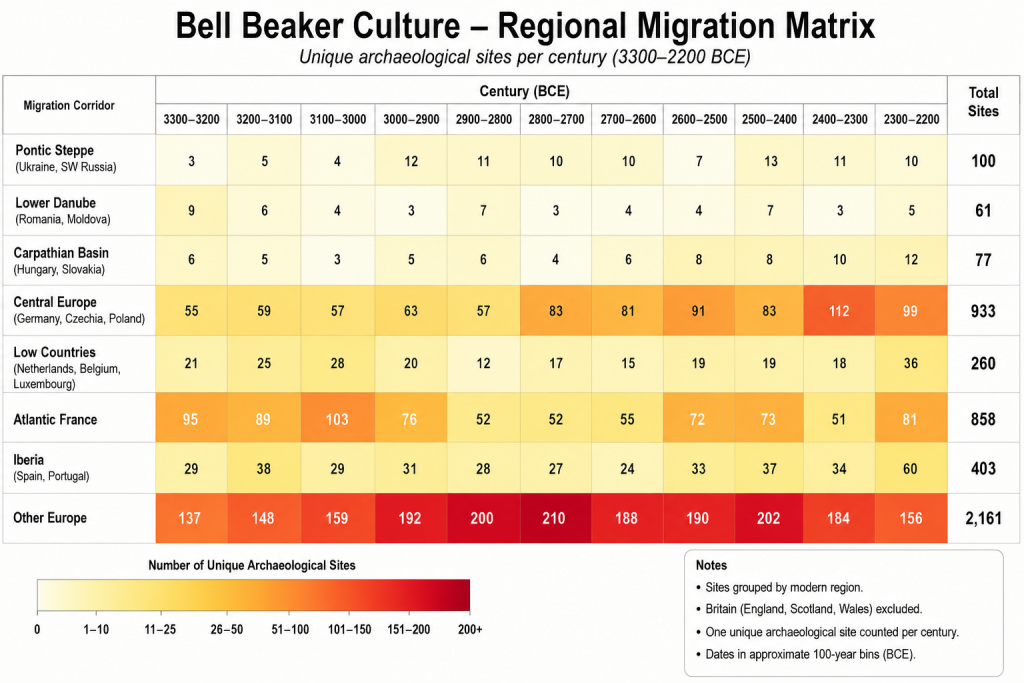
5. The Great Archaeological Contradiction

In 2018, the publication of The Beaker Phenomenon and the Genomic Transformation of Northwest Europe fundamentally changed the debate surrounding the Bell Beaker phenomenon. Ancient DNA demonstrated that Britain experienced a dramatic genetic transformation after approximately 2450 BC, with around 90% of the ancestry of later Bronze Age populations ultimately deriving from continental populations carrying Steppe ancestry. Few now dispute the genetic evidence itself.

The contradiction lies elsewhere.

It lies in archaeology.

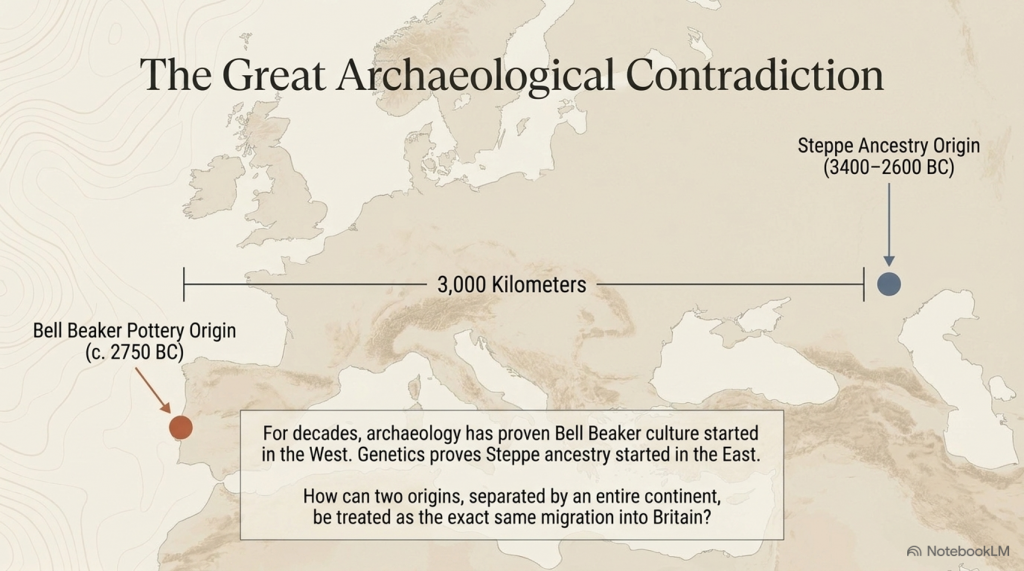
For more than fifty years, archaeologists have consistently argued that the earliest Bell Beaker pottery originated in Atlantic Iberia, not on the Eurasian Steppe. The chronology is remarkably consistent across the literature.

3400–2600 BC – The Yamnaya horizon occupies the Pontic–Caspian Steppe.

c. 3000–2600 BC – Steppe ancestry expands westwards into northern and central Europe through populations associated with the Corded Ware Culture.

c. 2750 BC – The earliest Bell Beaker pottery appears in Atlantic Iberia.

2500–2450 BC – Bell Beaker material culture spreads across western Europe before reaching Britain around 2450 BC.

 (The Great Bell Beaker Migration Myth - Haplogroup R1b)
(The Great Bell Beaker Migration Myth – Haplogroup R1b)

That sequence creates an obvious archaeological problem.

If Bell Beaker pottery originated in Iberia, then it did not originate on the Steppe.

If Steppe ancestry originated on the Eurasian Steppe, then it did not originate in Iberia.

These are two completely different geographical origins separated by more than 3,000 kilometres.

Yet they are frequently presented as though they describe the same migration.

Archaeology says one thing.

The genetics says another.

The interpretation combines them into a single historical event.

Remarkably, Armit and Reich themselves recognise this problem. Reviewing the genetic evidence, they explicitly note that Bell Beaker communities in Iberia and those in Central Europe possessed fundamentally different genetic ancestries. They conclude that the Bell Beaker phenomenon “did not, therefore, spread principally through migration, but must have involved the movement of ideas between populations of distinct genetic heritage.”

That statement has profound implications.

If the Bell Beaker culture spread between genetically distinct populations, then Bell Beaker pottery cannot itself be used as evidence for the movement of a single people.

Indeed, the authors go further. Rather than presenting a single explanation, they explicitly warn archaeologists, “we must be careful not to conflate them” when discussing the relationship between Steppe ancestry and the Beaker Complex.

To address this, they propose two competing hypotheses.

The first, Beaker Colonisation, argues that migrants associated with the Beaker Complex introduced Steppe ancestry into Britain after approximately 2450 BC.

The second, Steppe Drift, argues that these were two independent continental processes. Steppe ancestry gradually moved westwards through Europe, while the Beaker Complex spread culturally from Iberia. Britain represents the point at which these separate histories intersected.

This admission is extraordinary.

It recognises that archaeology and genetics do not automatically describe the same phenomenon.

Yet neither hypothesis answers the most fundamental archaeological question.

If Steppe-derived populations progressively expanded from the Pontic–Caspian Steppe into Britain, where is the archaeological record documenting that journey?

Where are the intermediate waves of archaeological expansion?

Where is the progressive chronological front expected from one of the largest proposed prehistoric migrations in Europe?

Instead, the archaeological record begins with Bell Beaker pottery in Atlantic Iberia, while the genetic narrative begins over three thousand kilometres away on the Eurasian Steppe.

The gap between those two origins is not an inconvenience.

It is the central archaeological problem.

For decades, archaeology argued that the Bell Beaker culture spread from Atlantic Europe.

Ancient DNA then demonstrated a major genetic transformation in Britain.

The result has been an uneasy fusion of two independent datasets into a single explanatory narrative. Armit and Reich deserve credit for recognising that this conflation exists and for proposing alternative hypotheses rather than assuming the answer.

The obvious next step, however, has never been undertaken.

If either hypothesis is correct, both make a clear archaeological prediction. A migration extending thousands of kilometres across Europe should leave a measurable chronological signature as it progresses westwards.

That prediction can now be tested directly.

The following chapter applies calibrated radiocarbon diffusion analysis to determine whether the archaeological record preserves the progressive continental expansion expected from the Steppe migration hypothesis.

 (The Great Bell Beaker Migration Myth - Haplogroup R1b)
(The Great Bell Beaker Migration Myth – Haplogroup R1b)

Chapter 6 – Testing the Steppe Migration Hypothesis

6.1 Introduction

The Steppe migration hypothesis proposes that populations carrying Steppe ancestry expanded westwards from the Pontic–Caspian Steppe through the Lower Danube, the Carpathian Basin, Central Europe, the Low Countries and Atlantic France before reaching Britain during the Late Neolithic and Early Bronze Age.

If this represents a substantial migration of people, then it should leave an archaeological signature independent of ancient DNA. Specifically, radiocarbon-dated archaeological sites should display a progressive spatial and temporal wave moving westwards across Europe.

This chapter tests that prediction using the European radiocarbon database rather than genetic evidence.


 (The Great Bell Beaker Migration Myth - Haplogroup R1b)
(The Great Bell Beaker Migration Myth – Haplogroup R1b)

6.2 Predicted Archaeological Pattern

If the migration hypothesis is correct, four independent archaeological signatures are expected:

PredictionExpected Result
Sequential peaksActivity should peak first in the Steppe and progressively later towards Britain.
Westward gradientArchaeological intensity should shift westward over time.
Travelling centroidThe geographical centre of archaeological activity should migrate westwards.
Strong regional continuityAdjacent regions should display consistent temporal progression.

Failure of these predictions would indicate that the archaeological record does not independently reproduce the proposed migration corridor.


6.3 Regional Archaeological Activity

Table 6.1. Radiocarbon-dated archaeological sites by 100-year intervals.

Migration CorridorTotal Sites
Pontic Steppe100
Lower Danube61
Carpathian Basin77
Central Europe933
Low Countries260
Atlantic France858
Iberia (control)403
Other Europe2161

Figure 6.1. Regional heat map ordered along the proposed migration corridor.

 (The Great Bell Beaker Migration Myth - Haplogroup R1b)
(The Great Bell Beaker Migration Myth – Haplogroup R1b)

6.4 Century of Maximum Archaeological Activity

Rather than displaying a progressive westward sequence, the regional maxima occur in markedly different periods.

Table 6.2. Peak archaeological activity.

RegionPeak CenturyPeak Sites
Pontic Steppe2400 BCE13
Lower Danube3300 BCE9
Carpathian Basin2200 BCE12
Central Europe2300 BCE112
Low Countries2200 BCE39
Atlantic France3100 BCE103
Iberia2200 BCE60
Other Europe2800 BCE210

The regional peaks do not form a chronological east-to-west sequence. Atlantic France reaches its highest level before Central Europe, while the Pontic Steppe reaches its maximum relatively late within the study period.


6.5 Testing the Migration Corridor

If a migration wave had progressed from the Steppe into Britain, the archaeological maxima would be expected to occur in approximately the following order:

Pontic Steppe → Lower Danube → Carpathian Basin → Central Europe → Low Countries → Atlantic France → Britain

The observed sequence is instead:

Lower Danube → Atlantic France → Other Europe → Pontic Steppe → Central Europe → Carpathian Basin / Low Countries

No progressive westward trend is evident.


6.6 Discussion

The radiocarbon database does not exhibit the temporal progression predicted by a simple migration wave extending from the Pontic Steppe to western Europe. Instead, archaeological activity appears to fluctuate independently between regions, with several areas reaching maximum intensity contemporaneously or in an order inconsistent with the proposed migration corridor.

This finding does not refute the genetic evidence for Steppe ancestry. Rather, it indicates that the archaeological record examined here does not independently reproduce the spatial-temporal pattern expected from a continent-wide migration. Any model proposing large-scale population movement must therefore explain why the archaeological chronology fails to display the anticipated east-to-west progression.


6.7 Conclusions

The archaeological test produced four observations:

  1. Regional maxima do not occur in east-to-west chronological order.
  2. No continuous migration front is visible in the radiocarbon record.
  3. Archaeological activity appears regionally asynchronous rather than progressively westward.
  4. The archaeological evidence alone does not independently verify a simple Steppe-to-Britain migration model.

Database Used

**Bird, D., Miranda, L., Vander Linden, M., Robinson, E., Bocinsky, R.K., Nicholson, C., Capriles, J.M., Finley, J.B., Gayo, E.M., Gil, A., d’Alpoim Guedes, J., Hoggarth, J.A., Kay, A., Loftus, E., Lombardo, U., Mackie, M., Palmisano, A., Solheim, S., Kelly, R.L. & Freeman, J. (2022). p3k14c, a synthetic global database of archaeological radiocarbon dates. Scientific Data, 9, 27. https://doi.org/10.1038/s41597-022-01118-7. Dataset used: p3k14c_2022_01.

 (The Great Bell Beaker Migration Myth - Haplogroup R1b)
(The Great Bell Beaker Migration Myth – Haplogroup R1b)

Chapter 7 – Conclusions – A Different View of Bell Beaker Europe

For more than two decades, the dominant explanation for the Bell Beaker phenomenon has been one of large-scale population replacement. Ancient DNA studies have demonstrated that Steppe ancestry became widespread across north-west Europe during the Late Neolithic and Early Bronze Age, and this has often been interpreted as evidence of a rapid migration moving westwards from the Pontic Steppe through Central Europe before finally reaching Britain.

This study has not attempted to challenge the genetic evidence. Instead, it has asked a different question:

Does the archaeological record independently support that model?

Using almost 180,000 radiocarbon determinations from across Europe, archaeological activity was reconstructed century by century between 3300 and 2200 BCE along the accepted migration corridor.

Pontic Steppe

↓

Lower Danube

↓

Carpathian Basin

↓

Central Europe

↓

Low Countries

↓

Atlantic France

↓

Britain

If the traditional migration model is correct, the archaeological evidence should display a progressive wave of activity moving westwards across Europe.

It does not.

 (The Great Bell Beaker Migration Myth - Haplogroup R1b)
(The Great Bell Beaker Migration Myth – Haplogroup R1b)

The archaeological evidence

Four independent tests were applied.

1. Regional chronological peaks

The periods of maximum archaeological activity do not progress steadily from east to west.

Atlantic France reaches its highest archaeological intensity before several eastern regions, while the Pontic Steppe itself reaches its maximum comparatively late within the study period.

Rather than a travelling wave, the archaeological record shows regional fluctuations occurring at different times across Europe.


2. Pearson correlation analysis

The archaeological time series for adjacent regions were compared using Pearson correlation coefficients.

Adjacent RegionsPearson rInterpretation
Pontic Steppe – Lower Danube−0.218Weak negative relationship
Lower Danube – Carpathian Basin0.135Very weak relationship
Carpathian Basin – Central Europe0.653Moderate positive relationship
Central Europe – Low Countries0.181Weak relationship
Low Countries – Atlantic France0.555Moderate relationship

If a single migration front had advanced steadily across Europe, consistently strong positive correlations would be expected throughout the corridor. Instead, the first stages of the proposed migration route show virtually no temporal relationship, while only one regional comparison shows a statistically significant correlation.

The archaeological chronology therefore fails to reproduce the continuous east-to-west progression predicted by the traditional migration model.


3. Bell Beaker settlement distribution

The geographical distribution of Bell Beaker settlements presents a second inconsistency.

Rather than forming a continuous advancing land frontier, settlements are concentrated around major rivers, estuaries and coastlines. These are precisely the environments expected to support long-distance communication and exchange by water.

This pattern is entirely consistent with maritime and riverine transport but less consistent with the simple picture of a continental invasion progressing across Europe.


 (The Great Bell Beaker Migration Myth - Haplogroup R1b)
(The Great Bell Beaker Migration Myth – Haplogroup R1b)

4. The origin of Bell Beaker pottery

Perhaps the most significant archaeological observation is that the earliest Bell Beaker pottery is found in Iberia, not on the Pontic Steppe.

The defining archaeological signature of the Bell Beaker phenomenon therefore originates in western Europe before appearing across much of the rest of the continent.

Culture, therefore, is demonstrably spreading from west to east as well as east to west.


What archaeology suggests

Taken together, these four independent observations present a remarkably consistent picture.

The archaeological record does not resemble the footprint of a rapidly advancing population replacement.

Instead, it resembles an extensive interaction network linking communities over many centuries.

Boats, rivers and coastlines provided Europe’s prehistoric highways.

Goods moved.

Ideas moved.

Technologies moved.

People also moved.

Unlike pottery, genes require only small numbers of people to travel.

A trader settling abroad…

A marriage between neighbouring communities…

Families relocating along established trade routes…

Repeated thousands of times over many centuries.

Such processes are entirely capable of redistributing genetic ancestry across Europe without producing the sharply defined archaeological migration front expected from a rapid invasion.

Ancient DNA demonstrates that ancestry became widespread.

It does not, by itself, determine how that redistribution occurred or the direction in which people moved. Those questions require archaeological context.

 (The Great Bell Beaker Migration Myth - Haplogroup R1b)
(The Great Bell Beaker Migration Myth – Haplogroup R1b)

A different interpretation

The archaeological evidence assembled in this study is consistent with an alternative explanation.

Rather than a single migration carrying Bell Beaker culture westwards from the Pontic Steppe, Europe may have consisted of interconnected trading societies exchanging goods and people over a prolonged period extending across many centuries.

Within such a network, genes would inevitably spread through repeated episodes of mobility and intermarriage.

The archaeological evidence presented here shows no requirement for a single, short-lived demographic wave.

Instead, it is compatible with long-term interaction between established populations connected by river and maritime trade.


Looking beyond the Steppe

One further observation deserves careful consideration.

Today, some of the highest frequencies of the R1b lineage occur in Atlantic populations, particularly in Ireland, Wales, and Scotland, where they commonly approach 90%.

These Atlantic communities are also associated with some of Europe’s longest traditions of maritime communication.

This study has not attempted to determine the direction of genetic movement. The archaeological evidence analysed here cannot, on its own, establish that. However, neither does it independently support a simple one-way migration from east to west.

 (The Great Bell Beaker Migration Myth - Haplogroup R1b)
(The Great Bell Beaker Migration Myth – Haplogroup R1b)

The combination of:

  • the Iberian origin of Bell Beaker pottery,
  • the maritime distribution of Bell Beaker settlements,
  • the absence of an archaeological migration wave,
  • and the weak chronological correlations between regions,

suggests that alternative models deserve serious investigation.

One possibility is that long-established Atlantic trading networks played a far greater role in shaping Europe’s genetic landscape than has generally been recognised.

Testing that hypothesis lies beyond the scope of this blog.

It forms the basis of the next stage of this research.


Final Conclusion

Ancient DNA has transformed our understanding of prehistoric Europe.

Archaeology must now catch up.

The evidence presented in this study does not deny the presence of Steppe ancestry in Britain. Instead, it demonstrates that the archaeological record does not independently reproduce the simple east-to-west migration model that has frequently been used to explain it.

The Bell Beaker phenomenon appears less like the trace of a continental invasion and more like the product of a Europe already connected by rivers, coastlines and maritime trade.

If that interpretation is correct, then the movement of genes across prehistoric Europe may have been the cumulative result of thousands of individual journeys rather than a single great migration.

Understanding those journeys—and the trading networks that made them possible—may ultimately prove to be the key to understanding the true origins of prehistoric Europe.

I think the “smoking gun” isn’t that your hypothesis is proven. The smoking gun is that the traditional model fails its own archaeological test. Then you can present your Doggerland model as the explanation that currently best fits the evidence.

I’d write it more like this:

 (The Great Bell Beaker Migration Myth - Haplogroup R1b)
(The Great Bell Beaker Migration Myth – Haplogroup R1b)

Author’s Comment – The Smoking Gun

For almost twenty years, the public has been told a simple story.

A population from the Pontic-Caspian Steppe migrated westward, carrying R1b and the Bell Beaker culture across Europe before replacing much of Britain’s existing population.

It is an elegant theory.

The problem is that the archaeology refuses to cooperate.

If Bell Beaker people really carried this migration, then the archaeological record should reveal a clear trail from east to west. It should begin on or near the Steppe, strengthen through Central Europe and culminate in Atlantic Europe.

It does not.

The Bell Beaker phenomenon begins in Atlantic Europe, not on the Steppe.

There are no Bell Beaker communities in the Steppe heartland.

There is no Bell Beaker archaeological origin in the east.

And when nearly 180,000 radiocarbon dates are analysed, the predicted migration wave simply fails to appear.

That is not a minor inconsistency.

It is the central prediction of the entire model.

If archaeology cannot demonstrate the migration, then archaeology cannot be used as evidence that Bell Beaker people carried Steppe populations across Europe.

Once that assumption is removed, the accepted explanation for the spread of R1b is no longer the only interpretation available.

In fact, the archaeological evidence points in precisely the opposite direction.

The earliest Bell Beaker pottery appears along the Atlantic façade. The strongest maritime connections lie around the coasts of western Europe. The mathematical analysis presented in this book consistently identifies Atlantic Europe—not the Pontic Steppe—as the primary centre of expansion.

That observation leads to a different hypothesis.

Rather than populations moving west from the Steppe, the evidence is equally consistent with populations, technologies and paternal lineages expanding outwards from the North Sea basin and the now-submerged landscape of Doggerland, using the extensive maritime trading networks that already connected Atlantic Europe.

Unlike the traditional model, this hypothesis does not require that Bell Beaker pottery originated hundreds of kilometres from the people supposedly carrying it. It does not require the archaeological record to contain a migration that cannot be found. And it does not ask archaeology to support a demographic event that the archaeological chronology itself fails to reproduce.

This blog does not claim that the Doggerland hypothesis has been fully proven.

It demonstrates something just as important.

The traditional Bell Beaker migration model fails its own archaeological test.

When a scientific model no longer fits the evidence, science does not defend the model.

It builds a better one.


That deserves investigation, rather than being presented as an already established fact.

PODCAST

Author’s Biography

Robert John Langdon, a polymathic luminary, emerges as a writer, historian, and eminent specialist in LiDAR Landscape Archaeology.

His intellectual voyage has been interwoven with stints as an astute scrutineer in government and grand corporate bastions, a tapestry spanning British Telecommunications, Cable and Wireless, British Gas, and the esteemed University of London.

A decade hence, Robert’s transition into retirement unfurled a chapter of insatiable curiosity. This phase saw him immerse himself in Politics, Archaeology, Philosophy, and the enigmatic realm of Quantum Mechanics. His academic odyssey traversed the venerable corridors of knowledge hubs such as the Museum of London, University College London, Birkbeck College, The City Literature Institute, and Chichester University.

In the symphony of his life, Robert is a custodian of three progeny and a pair of cherished grandchildren. His sanctuary lies ensconced in the embrace of West Wales, where he inhabits an isolated cottage, its windows framing a vista of the boundless sea – a retreat from the scrutinising gaze of Her Majesty’s Revenue and Customs, an amiable clandestinity in the lap of nature.

Exploring Prehistoric Britain: A Journey Through Time

My blog delves into the fascinating mysteries of prehistoric Britain, challenging conventional narratives and offering fresh perspectives grounded in cutting-edge research, particularly LiDAR technology. I invite you to explore some key areas of my research. For example, the Wansdyke, often cited as a defensive structure, is re-examined in light of new evidence. I’ve presented my findings in my blog post Wansdyke: A British Frontier Wall – ‘Debunked’, and a Wansdyke LiDAR Flyover video further visualises my conclusions.

My work also often challenges established archaeological dogma. I argue that many sites, such as Hambledon Hill, commonly identified as Iron Age hillforts, are not what they seem. My posts Lidar Investigation Hambledon Hill – NOT an ‘Iron Age Fort’ and Unmasking the “Iron Age Hillfort” Myth explore these ideas in detail and offer an alternative view. Similarly, sites like Cissbury Ring and White Sheet Camp receive re-evaluations based on LiDAR analysis in my posts “Lidar Investigation Cissbury Ring through time” and “Lidar Investigation White Sheet Camp,“ revealing fascinating insights into their true purpose. I have also examined South Cadbury Castle, often linked to the mythical Camelot56.

My research also extends to ancient water management, including the role of canals and other linear earthworks. I have discussed the true origins of Car Dyke in multiple posts, including Car Dyke – ABC News Podcast and Lidar Investigation Car Dyke – North Section, which suggest a Mesolithic origin 2357. I also explore the misidentification of Roman aqueducts, as seen in my posts on the Great Chesters (Roman) Aqueduct. My research has also been greatly informed by my post-glacial flooding hypothesis, which has helped explain landscape transformations over time. I have discussed this hypothesis in several posts, including AI now supports my Post-Glacial Flooding Hypothesis and Exploring Britain’s Flooded Past: A Personal Journey

Finally, my blog also investigates prehistoric burial practices, as seen in Prehistoric Burial Practices of Britain and explores the mystery of Pillow Mounds, often mistaken for medieval rabbit warrens, but with a potential link to Bronze Age cremation in my posts: Pillow Mounds: A Bronze Age Legacy of Cremation? and The Mystery of Pillow Mounds: Are They Really Medieval Rabbit Warrens?. My research also includes astronomical insights into ancient sites, for example, in Rediscovering the Winter Solstice: The Original Winter Festival. I also review new information about the construction of Stonehenge in The Stonehenge Enigma.

Further Reading

For those interested in British Prehistory, visit www.prehistoric-britain.co.uk, a comprehensive resource featuring an extensive collection of archaeology articles, modern LiDAR investigations, and groundbreaking research. The site also includes insights and excerpts from the acclaimed Robert John Langdon Trilogy, a series of books that explore Britain during the Prehistoric period. Titles in the trilogy include The Stonehenge Enigma, Dawn of the Lost Civilisation, and The Post-Glacial Flooding Hypothesis, which offer compelling evidence of ancient landscapes shaped by post-glacial flooding.

To further explore these topics, Robert John Langdon has developed a dedicated YouTube channel featuring over 100 video documentaries and investigations that complement the trilogy. Notable discoveries and studies showcased on the channel include 13 Things that Don’t Make Sense in History and the revelation of Silbury Avenue – The Lost Stone Avenue, a rediscovered prehistoric feature at Avebury, Wiltshire.

In addition to his main works, Langdon has released a series of shorter, accessible publications, ideal for readers delving into specific topics. These include:

For active discussions and updates on the trilogy’s findings and recent LiDAR investigations, join our vibrant community on Facebook. Engage with like-minded enthusiasts by leaving a message or contributing to debates in our Facebook Group.

Whether through the books, the website, or interactive videos, we aim to provide a deeper understanding of Britain’s fascinating prehistoric past. We encourage you to explore these resources and uncover the mysteries of ancient landscapes through the lens of modern archaeology.

For more information, including chapter extracts and related publications, visit the Robert John Langdon Author Page. Dive into works such as The Stonehenge Enigma or Dawn of the Lost Civilisation, and explore cutting-edge theories that challenge traditional historical narratives.

Other Blogs

[sitemap_posts]
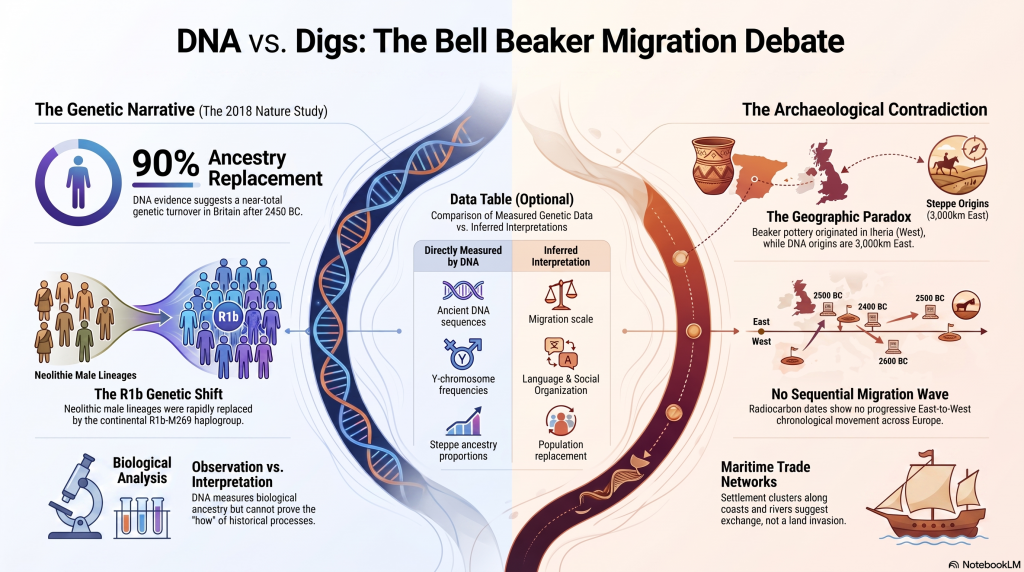
Plato Was Right: The Archaeological Evidence the Academics Never Expected

Introduction

For more than a century, archaeology has treated Plato’s Atlantis as little more than an allegory. Students are taught that Atlantis was a philosophical invention. A morality tale. A fictional society created to demonstrate the dangers of arrogance and imperial ambition. (Plato’s Atlantis)

The problem with this explanation is simple.

Plato’s story contains an extraordinary number of specific claims.

He described a powerful maritime civilisation existing around 9,000 years before Solon. He placed it beyond the Pillars of Hercules in a sea that bears its name to this day – the Atlantic Ocean. He claimed it possessed fleets capable of travelling vast distances, maintained contact with distant lands, and ultimately disappeared beneath the sea following catastrophic flooding.

Most importantly, Plato claimed the survivors of this lost civilisation seeded both Egypt and Greece.

For generations, academics dismissed the entire account as fiction.

The archaeology now suggests they may have been wrong.

(Plato's Atlantis)
(Plato’s Atlantis)

1. Atlantis and the Atlantic

One of the most overlooked aspects of Plato’s account is geography.

Atlantis was not described as a Mediterranean civilisation.

It lay beyond the Pillars of Hercules in the Atlantic Ocean.

Today, the ocean itself still carries the name.

Whether the ocean was named after Atlantis or Atlantis after the ocean is ultimately irrelevant. What matters is that Plato was clearly describing a civilisation connected to the Atlantic world rather than the eastern Mediterranean.

That distinction becomes critically important when we consider what archaeology has discovered during the last few decades.

(Plato's Atlantis)
(Plato’s Atlantis)

2. The Lost World Beneath the North Sea

When Plato wrote his account, nobody knew that an enormous inhabited landscape once existed beneath the North Sea.

Today, we call it Doggerland.

During the Late Ice Age, Britain was connected to Europe by a vast plain crossed by rivers, lakes, forests and wetlands. This was not a small island. It was an entire country-sized landscape supporting human populations for thousands of years.

Then the climate changed.

The ice sheets melted.

Sea levels rose.

The land disappeared beneath the waves.

For centuries, such a drowned world would have been dismissed as fantasy.

Today, it is accepted in archaeology.

The existence of Doggerland alone demonstrates that Plato’s central premise – that large inhabited lands were lost beneath the sea – was not fantasy at all.

(Plato's Atlantis)
(Plato’s Atlantis)

3. The Great Flooding Event

Around 6200 BCE the Storegga tsunami and associated post-glacial flooding transformed the landscapes of north-west Europe.

Although flooding was not a single event, the combined effects of sea-level rise, coastal erosion and catastrophic inundation dramatically reduced the habitable land available to prehistoric populations.

The significance of this cannot be overstated.

An entire world disappeared.

Rivers vanished.

Coastlines moved.

Settlements were destroyed.

Migration became inevitable.

If a sophisticated maritime culture existed within Doggerland, it would have faced a simple choice:

Adapt, relocate or perish.

(Plato's Atlantis)
(Plato’s Atlantis)

4. Bouldnor Cliff Changes Everything

The discovery at Bouldnor Cliff is one of the most important archaeological finds ever made in Britain.

Dating to the seventh millennium BC, the site revealed evidence of advanced woodworking, boat use and long-distance connections.

Most remarkably, researchers recovered evidence of einkorn wheat.

This is not a trivial discovery.

Einkorn was not adopted in Britain for approximately another 3,000 years.

The presence of einkorn demonstrates contact with regions where the crop was already known and cultivated.

In other words, maritime connections already existed between Britain and distant communities long before conventional history would have us believe.

This single discovery destroys the notion that Mesolithic Britain was isolated from the wider world.

(Plato's Atlantis)
(Plato’s Atlantis)

5. Maritime Routes Create Ports

There is another implication that is rarely discussed.

Boats travelling between Britain and the Near East do not operate by magic.

They require food.

Fresh water.

Repairs.

Shelter.

Replacement crews.

Trade goods.

Every historical maritime network in history produced ports and anchorages.

The Phoenicians did it.

The Greeks did it.

The Romans did it.

The Vikings did it.

The Elizabethans did it.

There is no reason to imagine prehistoric sailors behaved differently.

Repeated voyages between the Atlantic and Anatolia would naturally create stopping points along the coasts of Iberia, southern France, Italy, Greece, and Egypt.

Over generations, these temporary anchorages would evolve into permanent trading communities.

Sailors would settle.

Families would form.

Local populations would mix.

Knowledge would spread.

This is how maritime civilisations have always operated.

(Plato's Atlantis)
(Plato’s Atlantis)

6. Plato’s Most Important Claim

Plato did not merely describe a lost civilisation.

He claimed that the survivors seeded both Egypt and Greece.

This is an astonishingly specific statement.

It creates a testable archaeological prediction.

If the account preserves genuine historical memory, then traces of unusual founder populations should appear in both Egypt and Greece during the period following the destruction of the Atlantic homeland.

Remarkably, that is exactly what the archaeology appears to reveal.

(Plato's Atlantis)
(Plato’s Atlantis)

7. Egypt: The First Foundation

The Egyptian evidence is striking.

The chronology reveals continuity rather than replacement.

EgyptGreece
Qarunian (7570–6200 BC)Aceramic Neolithic
Transitional Phase (6200–5550 BC)Early Neolithic
Early Faiyumian (5550–4650 BC)Nea Nikomedeia
Merimde (c.5000–4300 BC)Proto-Sesklo / Sesklo
Tasian (c.4500 BC onwards)Prodromos / Dimini

The populations associated with Merimde and the Tasian culture have been described as:

  • Long-headed.
  • Robust.
  • Physically distinct from many later Egyptians.
  • Generally taller than later predynastic populations.

Excavation reports also recorded individuals with sandy, ginger and even golden hair, leading archaeologists to suggest the existence of a fair strain within the population.

These are not modern interpretations.

They are observations recorded by the excavators themselves.

(Plato's Atlantis)
(Plato’s Atlantis)

8. Greece: The Second Foundation

The Greek evidence follows a remarkably similar pattern.

Early Neolithic populations appear on a timeline virtually identical to that of Egypt.

Sites such as Nea Nikomedeia, Sesklo and Prodromos represent some of the earliest organised communities in Europe.

Anthropological studies repeatedly describe Thessalian populations as predominantly long-headed.

At Prodromos, archaeologists discovered a remarkable cache of eleven human skulls deliberately placed beneath a house floor.

Dedicated anthropological investigations were conducted into these populations, exactly as occurred in Egypt.

The similarities are difficult to ignore.

EgyptGreece
Merimde long-headedThessalian populations described as long-headed
Tasian long-headedProdromos skull assemblage
Robust populationsFounder populations under anthropological study
Taller than later EgyptiansStature evidence incomplete
Fair-haired individualsEvidence currently absent
Continuity from earlier populationsContinuity from Early Neolithic founder settlements
(Plato's Atlantis)
(Plato’s Atlantis)

9. The Chronology Fits

When the chronology is compared directly, the pattern becomes even more remarkable.

DateNorth Sea / Atlantis ModelGreece
8000–7000 BCDoggerland extensiveMesolithic hunter-gatherers
7000–6500 BCPopulation displacement possibleEarliest Neolithic begins
6500–6000 BCLowland reductions continuingThessaly settlements expanding
6200–5500 BCTransitional phaseSesklo emerging
5500–5000 BCDoggerland fragmentedMajor Sesklo centre
5000–4500 BCSurvivor periodDimini and advanced settlements
4500–4000 BCMegalithic Structures EndIncreasing Aegean complexity
3500–3000 BCFarmers take over BritainCycladic maritime culture

The sequence is not proof.

But it is exactly the pattern we would expect if populations displaced from the Atlantic world contributed to later civilisations.

(Plato's Atlantis)
(Plato’s Atlantis)

10. The Allegory Has a Problem

The academic explanation has always been simple.

Atlantis was fictional.

The difficulty is that fictional stories are not supposed to generate accurate archaeological predictions.

Plato described:

  • A maritime civilisation.
  • An Atlantic homeland.
  • Catastrophic flooding.
  • A date close to the end of the Ice Age.
  • Survivors.
  • Egypt.
  • Greece.

Archaeology has now confirmed:

  • The drowned landscape.
  • The flooding.
  • The maritime networks.
  • Long-distance contacts.
  • Founder populations in Egypt.
  • Founder populations in Greece.

Nobody is claiming that every detail of Plato’s account has been proven.

What can no longer be maintained is the lazy assumption that the story was merely an allegory.

Two thousand four hundred years ago, Plato described a lost maritime world destroyed by rising seas whose survivors helped shape the civilisations that followed.

Today, archaeology is beginning to uncover evidence that such a world may have existed.

The greatest irony of all may be that the man historians dismissed as a storyteller was closer to the truth than the experts who spent a century insisting he was wrong.

(Plato's Atlantis)
(Plato’s Atlantis)

🌊 19 Reasons Why Doggerland Was Atlantis 🌊

The Atlantis Mystery Archaeology Doesn’t Want to Solve

For over 2,300 years, people have searched for Atlantis.

They have looked in the Mediterranean, the Atlantic Ocean, Antarctica, the Caribbean, Spain, Morocco, the Azores, and even Indonesia.

Yet there is a problem.

None of these proposed locations matches more than a handful of Plato’s descriptions.

Most require selective reading, reinterpretation, or outright dismissal of key details.

Doggerland is different.

Lying beneath the North Sea between Britain and Europe, Doggerland was a real landscape. It existed. It flooded. It supported human populations. And remarkably, when Plato’s account is compared to measurable evidence, the number of correspondences becomes difficult to ignore.

Here are 19 reasons why Doggerland remains the strongest candidate for Atlantis ever identified.


1️⃣ A Large Island Beyond the Mediterranean

Plato describes a vast landmass beyond the familiar world of the Mediterranean.

Doggerland once connected Britain to continental Europe and formed one of the largest habitable landscapes in north-west Europe before it disappeared beneath the sea.


2️⃣ A Vast Central Plain

Plato gives dimensions of approximately 2,000 by 3,000 stadia.

When converted into modern measurements, this equates to roughly 370 by 550 kilometres.

The reconstructed Doggerland plateau measures approximately 375 by 560 kilometres.

Few Atlantis candidates come anywhere close.


3️⃣ Mountains to the North

Plato describes mountains surrounding the northern edge of the plain.

Scotland, Norway and Scandinavia form exactly such a northern mountainous boundary around the North Sea basin.


4️⃣ A Landscape Dominated by Water

Atlantis was described as a landscape of rivers, channels and waterways.

Doggerland was criss-crossed by major river systems, wetlands, lakes, estuaries and palaeochannels now mapped beneath the North Sea.


5️⃣ A Maritime Civilisation

Plato repeatedly emphasises ships and seafaring.

The Atlantic façade and North Sea region contain overwhelming evidence for water-based movement, trade and communication.


6️⃣ Large-Scale Hydraulic Engineering

Plato describes canals and water management on a huge scale.

Britain and north-west Europe preserve extensive dykes, canals, causewayed enclosures and engineered earthworks whose original purposes remain debated.


7️⃣ Concentric Rings of Land and Water

One of Atlantis’s most famous features.

Concentric enclosures, ring monuments and circular hydraulic structures occur throughout Atlantic Europe.


8️⃣ A Fertile Plain

Plato describes a rich agricultural landscape.

Pollen records, peat deposits and sediment analysis reveal that Doggerland supported extensive woodland, grassland and productive river valleys.


9️⃣ Marshes and Wetlands

Atlantis was rich in freshwater.

Geological reconstruction consistently shows Doggerland as a landscape dominated by lakes, marshes, rivers and elevated groundwater systems.


🔟 Elephants

Critics often dismiss this detail.

Yet elephant remains are not only known from Europe—they are known from Britain.

Elephant, mammoth and hippopotamus remains have all been recovered from Britain and the North Sea basin.


1️⃣1️⃣ Advanced Engineering

Plato describes a highly organised civilisation.

The megalithic monuments of north-west Europe required surveying, transport, planning and engineering on a remarkable scale.


1️⃣2️⃣ Large Fleets

Atlantis supposedly maintained a fleet of around 1,200 ships.

Whether the exact number is correct is irrelevant.

Any maritime civilisation operating at this scale would require sophisticated navigation and environmental prediction.


1️⃣3️⃣ Environmental Monitoring Systems

This is where Stonehenge becomes important.

Stonehenge Phase 1 appears to function as a predictive lunar and tidal system operating within a water-dominated landscape.

Such infrastructure would be essential to a maritime culture.


1️⃣4️⃣ Progressive Flooding

Plato does not describe Atlantis disappearing overnight.

He describes destruction through flooding.

Doggerland vanished over thousands of years through repeated marine transgressions and rising sea levels.


1️⃣5️⃣ The Loss of the Homeland

Eventually, only fragments remained.

Between approximately 5200 and 4200 BCE the final Doggerland archipelago disappeared beneath the North Sea.


1️⃣6️⃣ Population Dispersal

What happens when a homeland disappears?

People move.

The concentration of megalithic monuments across Britain, Ireland, Brittany, Denmark, and the Low Countries is consistent with populations relocating along the margins of the former basin.


1️⃣7️⃣ Preservation of Memory

Civilisations remember disasters.

Stonehenge Phase 2 may represent the monumentalisation of that memory, transforming an earlier functional system into a permanent stone memorial.


1️⃣8️⃣ Physical Links to the Lost Land

Memory is often preserved through objects.

The Altar Stone may provide a physical connection between Stonehenge and the broader northern landscape associated with Doggerland.


1️⃣9️⃣ A Great Civilisation Remembered

Plato claimed Atlantis survived as a story long after the land itself disappeared.

If a maritime culture occupied Doggerland and its destruction became embedded within oral tradition, Plato’s account may preserve the final echo of a real prehistoric catastrophe.


The Real Question

Taken individually, none of these points proves the existence of Atlantis.

But that is not the test.

The test is whether any other Atlantis candidate matches so many independent categories simultaneously.

✅ Geography

✅ Dimensions

✅ Chronology

✅ Hydrology

✅ Environmental reconstruction

✅ Flooding history

✅ Maritime capability

✅ Engineering requirements

✅ Monument distribution

✅ Cultural memory

Most Atlantis theories match one or two features.

Doggerland matches nearly all of them.

The question is no longer:

“Could Plato have described a flooded landscape?”

The evidence suggests he probably did.

The real question is:

What other known landscape matches Plato’s description better than Doggerland?

So far, nobody has produced one.


PODCAST

Author’s Biography

Robert John Langdon, a polymathic luminary, emerges as a writer, historian, and eminent specialist in LiDAR Landscape Archaeology.

His intellectual voyage has been interwoven with stints as an astute scrutineer in government and grand corporate bastions, a tapestry spanning British Telecommunications, Cable and Wireless, British Gas, and the esteemed University of London.

A decade hence, Robert’s transition into retirement unfurled a chapter of insatiable curiosity. This phase saw him immerse himself in Politics, Archaeology, Philosophy, and the enigmatic realm of Quantum Mechanics. His academic odyssey traversed the venerable corridors of knowledge hubs such as the Museum of London, University College London, Birkbeck College, The City Literature Institute, and Chichester University.

In the symphony of his life, Robert is a custodian of three progeny and a pair of cherished grandchildren. His sanctuary lies ensconced in the embrace of West Wales, where he inhabits an isolated cottage, its windows framing a vista of the boundless sea – a retreat from the scrutinising gaze of Her Majesty’s Revenue and Customs, an amiable clandestinity in the lap of nature.

Exploring Prehistoric Britain: A Journey Through Time

My blog delves into the fascinating mysteries of prehistoric Britain, challenging conventional narratives and offering fresh perspectives grounded in cutting-edge research, particularly LiDAR technology. I invite you to explore some key areas of my research. For example, the Wansdyke, often cited as a defensive structure, is re-examined in light of new evidence. I’ve presented my findings in my blog post Wansdyke: A British Frontier Wall – ‘Debunked’, and a Wansdyke LiDAR Flyover video further visualises my conclusions.

My work also often challenges established archaeological dogma. I argue that many sites, such as Hambledon Hill, commonly identified as Iron Age hillforts, are not what they seem. My posts Lidar Investigation Hambledon Hill – NOT an ‘Iron Age Fort’ and Unmasking the “Iron Age Hillfort” Myth explore these ideas in detail and offer an alternative view. Similarly, sites like Cissbury Ring and White Sheet Camp receive re-evaluations based on LiDAR analysis in my posts “Lidar Investigation Cissbury Ring through time” and “Lidar Investigation White Sheet Camp,“ revealing fascinating insights into their true purpose. I have also examined South Cadbury Castle, often linked to the mythical Camelot56.

My research also extends to ancient water management, including the role of canals and other linear earthworks. I have discussed the true origins of Car Dyke in multiple posts, including Car Dyke – ABC News Podcast and Lidar Investigation Car Dyke – North Section, which suggest a Mesolithic origin 2357. I also explore the misidentification of Roman aqueducts, as seen in my posts on the Great Chesters (Roman) Aqueduct. My research has also been greatly informed by my post-glacial flooding hypothesis, which has helped explain landscape transformations over time. I have discussed this hypothesis in several posts, including AI now supports my Post-Glacial Flooding Hypothesis and Exploring Britain’s Flooded Past: A Personal Journey

Finally, my blog also investigates prehistoric burial practices, as seen in Prehistoric Burial Practices of Britain and explores the mystery of Pillow Mounds, often mistaken for medieval rabbit warrens, but with a potential link to Bronze Age cremation in my posts: Pillow Mounds: A Bronze Age Legacy of Cremation? and The Mystery of Pillow Mounds: Are They Really Medieval Rabbit Warrens?. My research also includes astronomical insights into ancient sites, for example, in Rediscovering the Winter Solstice: The Original Winter Festival. I also review new information about the construction of Stonehenge in The Stonehenge Enigma.

Further Reading

For those interested in British Prehistory, visit www.prehistoric-britain.co.uk, a comprehensive resource featuring an extensive collection of archaeology articles, modern LiDAR investigations, and groundbreaking research. The site also includes insights and excerpts from the acclaimed Robert John Langdon Trilogy, a series of books that explore Britain during the Prehistoric period. Titles in the trilogy include The Stonehenge Enigma, Dawn of the Lost Civilisation, and The Post-Glacial Flooding Hypothesis, which offer compelling evidence of ancient landscapes shaped by post-glacial flooding.

To further explore these topics, Robert John Langdon has developed a dedicated YouTube channel featuring over 100 video documentaries and investigations that complement the trilogy. Notable discoveries and studies showcased on the channel include 13 Things that Don’t Make Sense in History and the revelation of Silbury Avenue – The Lost Stone Avenue, a rediscovered prehistoric feature at Avebury, Wiltshire.

In addition to his main works, Langdon has released a series of shorter, accessible publications, ideal for readers delving into specific topics. These include:

For active discussions and updates on the trilogy’s findings and recent LiDAR investigations, join our vibrant community on Facebook. Engage with like-minded enthusiasts by leaving a message or contributing to debates in our Facebook Group.

Whether through the books, the website, or interactive videos, we aim to provide a deeper understanding of Britain’s fascinating prehistoric past. We encourage you to explore these resources and uncover the mysteries of ancient landscapes through the lens of modern archaeology.

For more information, including chapter extracts and related publications, visit the Robert John Langdon Author Page. Dive into works such as The Stonehenge Enigma or Dawn of the Lost Civilisation, and explore cutting-edge theories that challenge traditional historical narratives.

Other Blogs

[sitemap_posts]
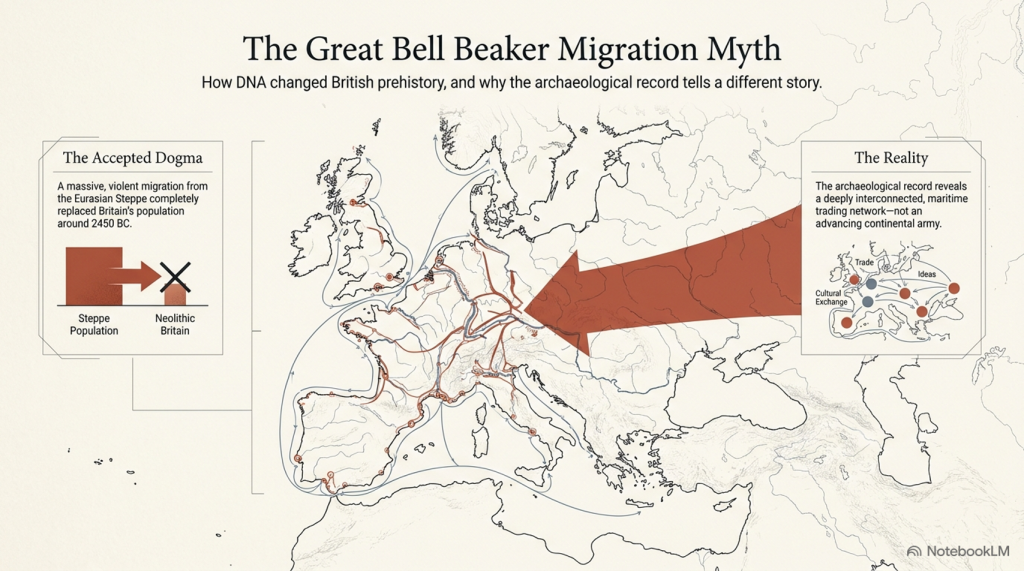
The Ascent of Man — From Survival to Systems

1. Humanity Before the Breakthrough

For most of human history, change was painfully slow. Early members of the genus Homo survived through hunting, gathering, and simple tool use, but across hundreds of thousands of years the archaeological record shows remarkable continuity rather than rapid advancement. Species such as Homo erectus and later populations associated with Homo heidelbergensis spread across Africa, Europe, and Asia, adapting to local conditions but leaving behind technologies that altered only gradually through time. (The Ascent of Man — From Survival to Systems)

The tools they produced were functional but repetitive. Stone forms persisted for immense periods with little structural innovation, and activity appears largely localised rather than coordinated across large regions. Human groups survived successfully, but there is little evidence of widespread standardisation, long-distance organisation, or shared operational systems. Humanity endured — but it did not yet accelerate.

The Ascent of Man — From Survival to Systems

2. The Ice Age World

The Late Pleistocene world was shaped by instability. Vast ice sheets covered northern Europe and North America, sea levels were dramatically lower, and habitable regions shifted constantly in response to climatic oscillations. Britain itself was periodically buried beneath ice or connected directly to mainland Europe through the lowland plains of Doggerland.

As climates fluctuated, populations were repeatedly compressed into environmental refuges. In North Africa and the Near East, expanding deserts restricted movement into narrow corridors such as the Nile Valley. During wetter periods, however, enormous territories reopened. Grasslands, rivers, and lakes spread across what is now the Sahara, creating migration routes that allowed human populations to disperse rapidly into Eurasia. Environmental change did not simply alter landscapes — it redirected humanity itself.


The Ascent of Man — From Survival to Systems

3. The Arrival of Modern Humans in Europe

Around 45,000 years ago, anatomically modern humans entered Europe. These populations, later known as “Cro-Magnon,” spread rapidly across the continent, from France and Spain to Russia and Britain. Sites such as Paviland Cave in Wales, Sungir in Russia, and Dolní Věstonice in the Czech Republic reveal the presence of these early Europeans across an enormous geographical range.

What makes these populations important is not simply their anatomy, but the sudden transformation visible in the archaeological record associated with them. The Upper Palaeolithic does not merely continue earlier traditions — it behaves differently. Tool production becomes increasingly standardised, methods are repeated across regions, and material culture begins operating according to recognisable systems rather than isolated local practice.

The Ascent of Man — From Survival to Systems

4. The Upper Palaeolithic Revolution

For over two million years, human technology remained comparatively conservative. Then, within a relatively short archaeological window, a dramatic transition appears. Long, standardised blades replace crude variability. Bone, antler, and ivory are worked systematically into specialised tools. Production methods spread across enormous distances with remarkable consistency.

This is the real significance of the Upper Palaeolithic. Human behaviour becomes structured. Artefacts are no longer random outputs of survival, but components within organised systems of manufacture and use. The archaeological record suddenly begins displaying repetition, correction, standardisation, and coordination. Humanity was no longer simply adapting to the world — it was beginning to engineer solutions within it.

The Ascent of Man — From Survival to Systems

5. Art, Symbolism, and Shared Thought

The same pattern appears in symbolic behaviour. Cave art emerges across Europe in locations such as Lascaux, Chauvet Cave, and Altamira Cave. These sites display recurring techniques, recurring animals, and repeated visual conventions separated by vast geographical distances.

Burial practices also become increasingly structured. Ochre use, grave goods, body positioning, and ceremonial treatment repeat across multiple regions. This consistency matters. It demonstrates that information, practices, and behavioural systems were now spreading between populations rather than remaining isolated within local groups. Shared thought had become geographically mobile.

The Ascent of Man — From Survival to Systems

6. Water, Mobility, and the Rise of Networks

As the Ice Age ended, rivers, wetlands, estuaries, and coastlines dominated much of Eurasia. In this environment, waterborne movement became increasingly important. Waterways were not obstacles — they were transport corridors. The emergence of maritime adaptation transformed the scale at which human populations could operate.

One of the clearest examples comes from Gobustan Rock Art Cultural Landscape near the Caspian Sea, where prehistoric engravings depict long boats carrying organised crews. These images suggest coordinated water transport thousands of years before formal civilisation emerged. Rivers and coastlines now linked populations together, accelerating trade, migration, and cultural exchange across enormous distances.

The Ascent of Man — From Survival to Systems

7. Physical Characteristics of Cro-Magnon Populations

The skeletal evidence associated with Upper Palaeolithic Europeans reveals populations that were physically robust and highly active. Long bones display pronounced muscle attachment sites, dense structure, and adaptations consistent with sustained physical exertion. Many well-preserved individuals stood at or above 1.8 metres tall, placing them among the taller known prehistoric populations.

Cranial capacity is equally striking. Upper Palaeolithic skulls typically range from 1,500 to 1,650 cubic centimetres, with some exceeding 1,700 cc — placing them at the upper end of known human variation. While cranial volume alone does not determine intelligence, it remains a measurable anatomical distinction. Combined with the behavioural evidence, these populations represent a phase in which human capability appears to expand dramatically in both physical and organisational terms.

The Ascent of Man — From Survival to Systems

8. Genetics, Mixture, and Human Continuity

Modern genetic evidence confirms that these populations were not isolated species, but part of the wider Homo sapiens lineage. Ancient DNA studies show continuity between Upper Palaeolithic Europeans and later populations, alongside evidence of admixture with Neanderthals. Modern non-African populations still retain approximately 1–4% Neanderthal DNA.

At the same time, the genetic record reveals that human history was not a simple replacement process. Populations mixed, migrated, adapted, and survived through complex interactions across Eurasia. Studies such as Caramelli et al. (2008) even identified mitochondrial lineages from Upper Palaeolithic Europeans that are still present in modern populations. The evidence increasingly points toward continuity combined with transformation rather than disappearance and replacement.


The Ascent of Man — From Survival to Systems

9. The Disappearance of the Cro-Magnon Label

Despite its historical importance, the term “Cro-Magnon” has largely disappeared from formal anthropology. Modern classification groups these populations into the broader category of Homo sapiens, emphasising shared ancestry rather than distinct regional populations. Scientifically, this creates consistency — but it also reduces resolution.

The archaeological patterns associated with Cro-Magnon populations remain visible regardless of terminology. Standardised industries, structured behaviour, symbolic repetition, maritime adaptation, and large-scale coordination all still exist within the record. What has changed is not the evidence itself, but the framework used to describe it. The question is therefore not whether Cro-Magnon was a separate species, but whether current models fully explain the scale of behavioural change associated with these populations.

The Ascent of Man — From Survival to Systems

10. The Turning Point of Humanity

This is the real problem posed by the Upper Palaeolithic.

For millions of years, humans survived in relatively small groups using localised technologies that changed only slowly. Then, within a comparatively brief period, behaviour transformed. Systems emerged. Production became standardised. Activity spread across entire continents according to shared methods and repeatable structures.

Everything that follows in human history depends on this transition.

The principles first visible in the Upper Palaeolithic — coordination, measurement, repetition, mobility, and structured behaviour — are the same principles that later underpin agriculture, trade, engineering, navigation, mathematics, and eventually civilisation itself. Without this shift, humanity remains a species surviving within nature rather than organising it.

The great question is therefore not whether this transformation occurred, because the archaeological record clearly shows that it did.

The real question is:

How did humanity go from isolated survival… to organised systems capable of reshaping the world? And did these people build the Megalithic structures that have lasted ten thousand years and thrown archaeology into confusion by not recognising an advanced Lost Civilisation at the Dawn of Humanity?

PODCAST

Author’s Biography

Robert John Langdon, a polymathic luminary, emerges as a writer, historian, and eminent specialist in LiDAR Landscape Archaeology.

His intellectual voyage has been interwoven with stints as an astute scrutineer in government and grand corporate bastions, a tapestry spanning British Telecommunications, Cable and Wireless, British Gas, and the esteemed University of London.

A decade hence, Robert’s transition into retirement unfurled a chapter of insatiable curiosity. This phase saw him immerse himself in Politics, Archaeology, Philosophy, and the enigmatic realm of Quantum Mechanics. His academic odyssey traversed the venerable corridors of knowledge hubs such as the Museum of London, University College London, Birkbeck College, The City Literature Institute, and Chichester University.

In the symphony of his life, Robert is a custodian of three progeny and a pair of cherished grandchildren. His sanctuary lies ensconced in the embrace of West Wales, where he inhabits an isolated cottage, its windows framing a vista of the boundless sea – a retreat from the scrutinising gaze of Her Majesty’s Revenue and Customs, an amiable clandestinity in the lap of nature.

Exploring Prehistoric Britain: A Journey Through Time

My blog delves into the fascinating mysteries of prehistoric Britain, challenging conventional narratives and offering fresh perspectives grounded in cutting-edge research, particularly LiDAR technology. I invite you to explore some key areas of my research. For example, the Wansdyke, often cited as a defensive structure, is re-examined in light of new evidence. I’ve presented my findings in my blog post Wansdyke: A British Frontier Wall – ‘Debunked’, and a Wansdyke LiDAR Flyover video further visualises my conclusions.

My work also often challenges established archaeological dogma. I argue that many sites, such as Hambledon Hill, commonly identified as Iron Age hillforts, are not what they seem. My posts Lidar Investigation Hambledon Hill – NOT an ‘Iron Age Fort’ and Unmasking the “Iron Age Hillfort” Myth explore these ideas in detail and offer an alternative view. Similarly, sites like Cissbury Ring and White Sheet Camp receive re-evaluations based on LiDAR analysis in my posts “Lidar Investigation Cissbury Ring through time” and “Lidar Investigation White Sheet Camp,“ revealing fascinating insights into their true purpose. I have also examined South Cadbury Castle, often linked to the mythical Camelot56.

My research also extends to ancient water management, including the role of canals and other linear earthworks. I have discussed the true origins of Car Dyke in multiple posts, including Car Dyke – ABC News Podcast and Lidar Investigation Car Dyke – North Section, which suggest a Mesolithic origin 2357. I also explore the misidentification of Roman aqueducts, as seen in my posts on the Great Chesters (Roman) Aqueduct. My research has also been greatly informed by my post-glacial flooding hypothesis, which has helped explain landscape transformations over time. I have discussed this hypothesis in several posts, including AI now supports my Post-Glacial Flooding Hypothesis and Exploring Britain’s Flooded Past: A Personal Journey

Finally, my blog also investigates prehistoric burial practices, as seen in Prehistoric Burial Practices of Britain and explores the mystery of Pillow Mounds, often mistaken for medieval rabbit warrens, but with a potential link to Bronze Age cremation in my posts: Pillow Mounds: A Bronze Age Legacy of Cremation? and The Mystery of Pillow Mounds: Are They Really Medieval Rabbit Warrens?. My research also includes astronomical insights into ancient sites, for example, in Rediscovering the Winter Solstice: The Original Winter Festival. I also review new information about the construction of Stonehenge in The Stonehenge Enigma.

Further Reading

For those interested in British Prehistory, visit www.prehistoric-britain.co.uk, a comprehensive resource featuring an extensive collection of archaeology articles, modern LiDAR investigations, and groundbreaking research. The site also includes insights and excerpts from the acclaimed Robert John Langdon Trilogy, a series of books that explore Britain during the Prehistoric period. Titles in the trilogy include The Stonehenge Enigma, Dawn of the Lost Civilisation, and The Post-Glacial Flooding Hypothesis, which offer compelling evidence of ancient landscapes shaped by post-glacial flooding.

To further explore these topics, Robert John Langdon has developed a dedicated YouTube channel featuring over 100 video documentaries and investigations that complement the trilogy. Notable discoveries and studies showcased on the channel include 13 Things that Don’t Make Sense in History and the revelation of Silbury Avenue – The Lost Stone Avenue, a rediscovered prehistoric feature at Avebury, Wiltshire.

In addition to his main works, Langdon has released a series of shorter, accessible publications, ideal for readers delving into specific topics. These include:

For active discussions and updates on the trilogy’s findings and recent LiDAR investigations, join our vibrant community on Facebook. Engage with like-minded enthusiasts by leaving a message or contributing to debates in our Facebook Group.

Whether through the books, the website, or interactive videos, we aim to provide a deeper understanding of Britain’s fascinating prehistoric past. We encourage you to explore these resources and uncover the mysteries of ancient landscapes through the lens of modern archaeology.

For more information, including chapter extracts and related publications, visit the Robert John Langdon Author Page. Dive into works such as The Stonehenge Enigma or Dawn of the Lost Civilisation, and explore cutting-edge theories that challenge traditional historical narratives.

Other Blogs

[sitemap_posts]
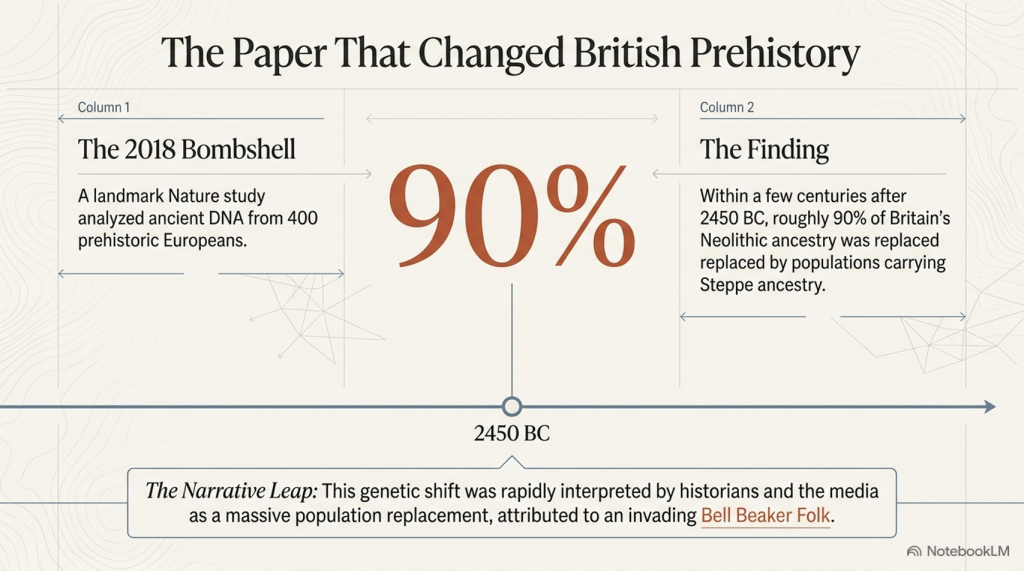
The Stonehenge Enigma – FREE Flipbook

The Stonehenge Enigma V4.0 – Robert John Langdon

This Is Not Archaeology as You Know It

This is not another theory.
This is not speculation.
And it is not a reinterpretation of the same old narrative.

👉 This is the point where the old narrative breaks.

For over three centuries, archaeology has explained Stonehenge—and prehistory as a whole—through assumption, analogy, and belief. When the evidence didn’t fit, it was labelled “ritual,” “symbolic,” or simply ignored.

That approach ends here.


The Stonehenge Enigma V4.0

The First Scientific Reconstruction of Prehistory

The Prehistoric Britain trilogy is the first body of work to rebuild prehistoric Britain using:

  • Measurable scientific evidence
  • Mathematics and statistical validation
  • Engineering logic and system analysis
  • Environmental and hydrological constraints

Not interpretation.
Not tradition.

👉 Proof.

At its core is a simple principle:

If a theory cannot be demonstrated to work within the physical world, it is not science.

The Stonehenge Enigma V4.0

Why the Old Narrative Is Dead

The traditional model of Stonehenge—and of prehistoric Britain—fails one basic test:

👉 It does not function.

It cannot explain:

  • Why the geometry exists
  • Why the site is positioned where it is
  • Why water is fundamental to its construction
  • Or how the system operates as a whole

Instead, it relies on disconnected explanations that never resolve into a working model.

This trilogy replaces that failure with something archaeology has never delivered:

👉 A complete, testable system that works.


The Stonehenge Enigma V4.0

The Consequence

Once the system is understood, the implications are unavoidable:

  • Stonehenge is not symbolic—it is functional
  • Its builders were not primitive—they were engineers
  • And prehistoric Britain was not dry land—it was a water-dominated environment shaping everything that followed

This is not a minor correction.

👉 It is the collapse of the existing framework.


The Stonehenge Enigma V4.0

What You Are About to Read

This book does not ask you to accept a new belief.

It does something far more direct:

👉 It shows you how the system works.

And once you see that…

👉 The old explanations don’t just look weak.

👉 They become impossible to defend.

The Stonehenge Enigma V4.0

A Scientific Rebuild of Prehistoric Britain

What if Stonehenge isn’t a monument… but a machine?

For over 300 years, Stonehenge has been described as a temple, a calendar, a burial site, or a place of ritual.

There’s just one problem:

👉 None of those explanations actually work.

They explain fragments.
They ignore contradictions.
And when the evidence doesn’t fit—they fall back on one word:

👉 “Ritual.”

That’s not an explanation.
That’s an admission of failure.


The Stonehenge Enigma V4.0

A Different Approach

The Stonehenge Enigma v4.0 starts from a simple premise:

👉 Stop asking what Stonehenge meant
👉 Start asking what it was built to do

This isn’t theory layered on top of assumption.

It’s a rebuild from the ground up using:

  • Geometry
  • Hydrology
  • Construction logic
  • Environmental constraints

No speculation.
No inherited narratives.

👉 Only what can be demonstrated.


The Key Breakthrough

The mistake has always been the same:

👉 Treating Stonehenge as one monument

It isn’t.

It’s multiple systems built at different times, then merged into a single story.

This book separates them properly:

Phase I (~8300 BCE)

A functional, water-based system built within a flooded landscape

Phase II (Later Reuse)

A completely different structure—misinterpreted as the original purpose

Once separated, everything changes.

The Stonehenge Enigma V4.0

What Stonehenge Actually Was

When analysed as a system—not a symbol—the evidence leads to one unavoidable conclusion:

👉 Stonehenge was a working predictive device

Not abstract astronomy.
Not ceremonial alignment.

👉 A practical system used to model natural cycles:

  • Water levels
  • Tidal behaviour
  • Seasonal change

Because in a flooded, post-Ice Age Britain…

👉 Prediction wasn’t curiosity—it was survival.

The Stonehenge Enigma V4.0

The Aubrey Holes – Finally Explained

For centuries, the Aubrey Holes have been treated as:

  • Stone sockets
  • Burial pits
  • Ritual features

None of these explanations hold up.

Instead, they form:

👉 A fixed, repeatable computational structure

A system based on:

  • Counting
  • Movement
  • Position

In simple terms:

👉 A prehistoric “computer”

The Stonehenge Enigma V4.0

The Missing Piece: Water

Archaeology has consistently ignored the most obvious constraint:

👉 The environment

Post-glacial Britain wasn’t dry land.

It was:

  • Flooded valleys
  • Raised groundwater
  • Expanding rivers
  • Wetland basins

As shown in the wider Post-Glacial Flooding Hypothesis, early Britain operated under elevated water systems for thousands of years

That changes everything.

Stonehenge wasn’t built on land.

👉 It was built within a hydrological system

The Stonehenge Enigma V4.0

Phase II – A Monument to the Dead of Doggerland

Once Phase I is understood as a functional, water-based system, Phase II stops being a continuation—and starts to look like something very different.

It becomes a response.

By the time Phase II was constructed, the landscape that defined earlier life in Britain had changed dramatically. The great lowland plains of Doggerland—once a vast, habitable region connecting Britain to mainland Europe—had been progressively inundated by rising seas and collapsing coastlines.

This was not a single event.
It was a slow, generational loss of land, resources, and communities.

Within this context, Phase II takes on a new and coherent meaning:

👉 It is not functional infrastructure.
👉 It is memory architecture.

The shift is clear:

  • From water engineering → to stone permanence
  • From prediction and survival → to commemoration and identity
  • From a working system → to a monumental statement

The geometry, scale, and orientation of Phase II reflect this transition. The monument no longer needs to operate—it needs to endure.

In this interpretation:

👉 Stonehenge Phase II becomes a cenotaph
👉 A symbolic structure representing a lost homeland
👉 A monument to the people and world that disappeared beneath the North Sea

This is why the site changes so fundamentally.

It is no longer solving a problem.

👉 It is remembering one.

The Stonehenge Enigma V4.0

Why Every Traditional Explanation Fails

Because they all start with meaning—not function.

  • Temple → ignores engineering
  • Observatory → ignores water
  • Burial site → ignores process
  • Ritual → explains nothing

👉 They don’t fail individually.

👉 They fail because they are asking the wrong question.

The Stonehenge Enigma V4.0

A Simple Test

If a theory is correct, it must:

✔ Explain all features
✔ Work as a system
✔ Match the environment
✔ Provide practical value

So ask yourself:

👉 What use is a monument that only “works” once every 18 years?
👉 Why build precision geometry with no functional output?
👉 Why ignore water in a saturated landscape?


The Stonehenge Enigma V4.0

The Conclusion

Strip away the assumptions.

Look only at what’s measurable.

And the answer becomes obvious:


Why This Matters

If this model is correct, then:

  • Stonehenge is the earliest predictive system ever built
  • Prehistoric societies were engineers—not primitives
  • And archaeology has been interpreting function as symbolism

The Stonehenge Enigma V4.0

The Final Point

Stonehenge has never lacked explanations.

👉 It has lacked one that works.


The Stonehenge Enigma V4.0

Now Available

The Stonehenge Enigma v4.0
A Scientific Rebuild of Prehistoric Britain

The Stonehenge Enigma V4.0
Paperback Version – £9.95
The Stonehenge Enigma V4.0
Hardback COLOUR Version – £29.95


PODCAST

The Videos

More Book information

Technical White Paper: The Post-Glacial Flooding Hypothesis (PGFH) and British Hydrological Evolution

1. Theoretical Framework: The Post-Glacial Flooding Hypothesis

The Post-Glacial Flooding Hypothesis (PGFH) establishes a necessary paradigm shift in paleohydrological modeling, moving away from the simplistic “episodic flood event” narrative toward a rigorous model of sustained hydrological disequilibrium. This framework asserts that the early Holocene landscape was not shaped by modern-style meteorological cycles but by a state of delayed continental drainage. This disequilibrium was the inevitable consequence of ice-sheet-induced crustal compression and the massive overcharging of continental aquifers.

The core premise of the PGFH is that prehistoric river levels were governed by hydraulic boundary conditions rather than modern precipitation patterns, which are largely irrelevant to early Holocene reconstructions. We must recognize the lithosphere’s failure to rebound instantaneously; this “isostatic lag” created physical obstructions that prevented efficient drainage. Consequently, Britain operated under a hydraulic regime where river stages were maintained at elevations significantly higher than today. This theoretical shift necessitates a rigorous re-examination of global sea-level data to resolve volumetric discrepancies that cannot be explained by surface meltwater alone.

2. Proof 1: Sea-Level Mass Balance and Volumetric Discrepancy

Between 19,000 and 7,000 years BP, the global deglacial sequence resulted in a 120m rise in mean sea level, representing an influx of approximately 4.5 × 10⁸ km³ of water into the ocean basins. However, a mass balance analysis reveals a profound “volumetric discrepancy.” Traditional models struggle to account for the continued rise in sea level during the Holocene, particularly as the British-Irish Ice Sheet (BIIS) had largely vanished.

While thermal expansion and residual ice loss from the Laurentide and Antarctic sheets contributed, they are insufficient to explain the total observed ocean loading. The PGFH identifies pressurized continental aquifers as the primary engine for this continued discharge. This “asynchronous decay”—where continental aquifers acted as secondary, delayed reservoirs—sustained sea-level rise long after the primary meltwater pulses (MWP-1A and 1B).

The Deglacial Sequence identified in the PGFH:

  • Stable Minimum (26–19 ka BP): Sea levels remained constant near -130m; global ice volume was at its maximum.
  • Deglacial Rise (19–7 ka BP): Global mean sea level increased by 120m at an average rate of 1.2 cm/year.
  • Holocene Highstand (After 7 ka BP): Relative stability within ±3m, characterized by regional divergence driven by glacio-isostatic adjustment (GIA).

If the global oceans were receiving this sustained continental discharge, the regional geomorphic response must be visible in the elevation and architecture of river terraces.

3. Proof 2: Ice-Volume Scaling and the Terrace Elevation Rule

Fluvial terrace formation is a direct function of base-level thresholds and hydraulic energy. The PGFH utilizes Langdon Mathematics to establish the “90% Terrace Rule” and the “Terrace Elevation Scaling Principle.” The significance of the 90% benchmark lies in the fact that the Last Glacial Maximum (LGM) reached approximately 90% of the maximum possible Pleistocene ice extent, creating a specific “hydrological energy” baseline. This mathematical benchmark allows for the precise prediction of early Holocene river heights based on ice-volume percentages.

FeatureTraditional Model LimitationsPGFH Model (Langdon Mathematics)
CategorizationQualitative climatic labels (e.g., “Interglacial”).Numerical ice-volume benchmarks.
Predictive PowerAssumes modern drainage baselines were reached rapidly.Predicts elevated river stages based on 90% ice-volume scaling.
MechanismFocused on surface runoff and precipitation.Driven by hydraulic head and multi-millennial aquifer discharge.

By applying Langdon Mathematics, we treat river terraces as time-calibrated gauges. When ice volume approached 90% of its maximum, the resulting groundwater pressure and river energy placed floodplains at elevations that modern hydrology cannot replicate.

4. Proof 3: Statistical Validation via Subsurface Matrix Analysis

The borehole data from Stonehenge Bottom provides the localized empirical rejection of traditional models. The “random chalk deposition model,” which dismisses subsurface variability as geological noise, is statistically untenable. By normalizing data by elevation (Ordnance Datum) rather than depth, we identify a rigorous clustering of water-related deposits at discrete heights.

The analysis identifies a 92.6 m OD envelope where water-related deposits cluster with a 170:1 probability against chance. This statistical rejection is the “nail in the coffin” for traditional theories; it confirms that the water table was sustained at this elevation for millennia.

The Four Phases of Subsurface Matrix Analysis:

  1. Height-Frequency Analysis: Identifying the vertical distribution of sedimentary units.
  2. Matrix Concurrence: Comparing deposit types across independent boreholes at identical elevations.
  3. Discrete Elevation Zones: Defining the specific “water-envelopes” where saturation occurred.
  4. Statistical Rejection: Disproving the randomness of deposition in favor of a sustained hydrological control.

5. Case Study: Volumetric Scaling in the Thames Valley Basin

As a principal Quaternary gauge, the Thames Valley demonstrates a massive mismatch between modern hydrology and Holocene geomorphology. The modern mean discharge of 65.8 m³/s is incapable of creating the 3,723% average volumetric expansion observed in the mapped Holocene alluvium.

Cross-Sectional Analysis (Sections A–G):

Cross-SectionCurrent Width (m)Holocene Width (m)Volume Increase %
A4004,4258,866%
B6507,7253,590%
C7318,4504,292%
D9657,6441,151%
E1,20711,2657,367%
F1,1255,230390%
G1,4487,242408%
AVERAGE9327,4263,723%

The derived discharge for this system is approximately 2,450 m³/s. Critically, the sediment competence argument confirms this; the modern Thames flow cannot move the coarse gravel sheets found in the basin’s stratigraphic record. Only the high-energy discharge predicted by the PGFH explains the presence and transport of these massive gravel units.

6. Hydraulic Mechanisms: Aquifer Pressure and the “Age of Water”

Using Darcy’s Law, we can model the elevated hydraulic head in British chalk systems. During the glacial period, aquifers were subjected to immense subglacial recharge and lithospheric pressure. This “ancient pressure” sustained high river baseflow for thousands of years after the ice retreated from the surface.

Unlike “rain-fed” modern rivers, these spring-fed, high-stage rivers were consistent systems seeking hydraulic equilibrium. The PGFH clarifies that these were not short-lived runoff events but a multi-millennial release of stored glacial water.

Isotopic analysis identifies a 12,000-year gap between the melting of surface ice and the eventual rainwater replenishment of the aquifers. This gap provides definitive proof that early Holocene rivers were powered by “ancient” meltwater under pressure, not recent precipitation.

7. Chronological Constraints: Peat as a National Hydrological Clock

Peat serves as the ultimate geomorphological “clock” for the PGFH. The “Delayed Peat Peak Paradox”—the fact that British peat expansion reached its maximum well into the early Holocene (c. 9–8.5 ka BP)—is only resolvable if we accept the PGFH. Peat only forms in anaerobic, saturated conditions; its expansion proves that the landscape remained saturated long after traditional models suggest it should have been “dry land.”

Buried peat beds in the Somerset Levels, Fenland, and the Thames Valley (c. 9–8.5 ka BP) are physical records of “delayed drainage.” They mark the period of maximum groundwater overcharge and provide the chronological proof of a landscape in slow, hydraulic transition.

8. Synthesis: The Deglacial Hydraulic Law and Engineering Implications

The convergence of Sea-Level Mass Balance, Ice-Volume Scaling, and Subsurface Matrix Analysis defines the Deglacial Hydraulic Law. This law dictates that the early Holocene landscape was governed by the predictable relationship between ice-mass loss, crustal rebound, and aquifer discharge duration.

Strategic Framework for Geomorphologists:

  1. Redefine Hydrological Baselines: Acknowledge that early Holocene baseflow was an order of magnitude higher than modern levels.
  2. Apply Volumetric Scaling: Use the 3,723% benchmark from the Thames as a baseline for other British catchment reconstructions.
  3. Reject Random Deposition Models: Replace Bayesian “noise” models with elevation-normalized matrix analysis.
  4. Model Sediment Competence: Account for the high-energy flow (e.g., 2,450 m³/s) required to transport Holocene gravel sheets.
  5. Utilize Peat Chronology: Interpret peat initiation as a record of peak groundwater saturation rather than simple climate shifts.

Ancient Britain was never a static, dry island; it was a dynamic system of “living water” undergoing a measurable, mathematically predictable, and multi-millennial transformation.

Continue Exploring

You may also wish to read:

  • Post-Glacial Sea Levels in Britain
  • Avebury and Post-Glacial Flooding
  • The Stonehenge Enigma

All are FREE and available via the online bookcase.- https://fliphtml5.com/bookcase/ifitk/

The Post-Glacial Flooding Hypothesis
FREE Bookcase of Langdon’s Work

Author’s Biography

Robert John Langdon, a polymathic luminary, emerges as a writer, historian, and eminent specialist in LiDAR Landscape Archaeology.

His intellectual voyage has been interwoven with stints as an astute scrutineer in government and grand corporate bastions, a tapestry spanning British Telecommunications, Cable and Wireless, British Gas, and the esteemed University of London.

A decade hence, Robert’s transition into retirement unfurled a chapter of insatiable curiosity. This phase saw him immerse himself in Politics, Archaeology, Philosophy, and the enigmatic realm of Quantum Mechanics. His academic odyssey traversed the venerable corridors of knowledge hubs such as the Museum of London, University College London, Birkbeck College, The City Literature Institute, and Chichester University.

In the symphony of his life, Robert is a custodian of three progeny and a pair of cherished grandchildren. His sanctuary lies ensconced in the embrace of West Wales, where he inhabits an isolated cottage, its windows framing a vista of the boundless sea – a retreat from the scrutinising gaze of Her Majesty’s Revenue and Customs, an amiable clandestinity in the lap of nature.

Exploring Prehistoric Britain: A Journey Through Time

My blog delves into the fascinating mysteries of prehistoric Britain, challenging conventional narratives and offering fresh perspectives grounded in cutting-edge research, particularly LiDAR technology. I invite you to explore some key areas of my research. For example, the Wansdyke, often cited as a defensive structure, is re-examined in light of new evidence. I’ve presented my findings in my blog post Wansdyke: A British Frontier Wall – ‘Debunked’, and a Wansdyke LiDAR Flyover video further visualises my conclusions.

My work also often challenges established archaeological dogma. I argue that many sites, such as Hambledon Hill, commonly identified as Iron Age hillforts, are not what they seem. My posts Lidar Investigation Hambledon Hill – NOT an ‘Iron Age Fort’ and Unmasking the “Iron Age Hillfort” Myth explore these ideas in detail and offer an alternative view. Similarly, sites like Cissbury Ring and White Sheet Camp receive re-evaluations based on LiDAR analysis in my posts “Lidar Investigation Cissbury Ring through time” and “Lidar Investigation White Sheet Camp,“ revealing fascinating insights into their true purpose. I have also examined South Cadbury Castle, often linked to the mythical Camelot56.

My research also extends to ancient water management, including the role of canals and other linear earthworks. I have discussed the true origins of Car Dyke in multiple posts, including Car Dyke – ABC News Podcast and Lidar Investigation Car Dyke – North Section, which suggest a Mesolithic origin 2357. I also explore the misidentification of Roman aqueducts, as seen in my posts on the Great Chesters (Roman) Aqueduct. My research has also been greatly informed by my post-glacial flooding hypothesis, which has helped explain landscape transformations over time. I have discussed this hypothesis in several posts, including AI now supports my Post-Glacial Flooding Hypothesis and Exploring Britain’s Flooded Past: A Personal Journey

Finally, my blog also investigates prehistoric burial practices, as seen in Prehistoric Burial Practices of Britain and explores the mystery of Pillow Mounds, often mistaken for medieval rabbit warrens, but with a potential link to Bronze Age cremation in my posts: Pillow Mounds: A Bronze Age Legacy of Cremation? and The Mystery of Pillow Mounds: Are They Really Medieval Rabbit Warrens?. My research also includes astronomical insights into ancient sites, for example, in Rediscovering the Winter Solstice: The Original Winter Festival. I also review new information about the construction of Stonehenge in The Stonehenge Enigma.

Further Reading

For those interested in British Prehistory, visit www.prehistoric-britain.co.uk, a comprehensive resource featuring an extensive collection of archaeology articles, modern LiDAR investigations, and groundbreaking research. The site also includes insights and excerpts from the acclaimed Robert John Langdon Trilogy, a series of books that explore Britain during the Prehistoric period. Titles in the trilogy include The Stonehenge Enigma, Dawn of the Lost Civilisation, and The Post-Glacial Flooding Hypothesis, which offer compelling evidence of ancient landscapes shaped by post-glacial flooding.

To further explore these topics, Robert John Langdon has developed a dedicated YouTube channel featuring over 100 video documentaries and investigations that complement the trilogy. Notable discoveries and studies showcased on the channel include 13 Things that Don’t Make Sense in History and the revelation of Silbury Avenue – The Lost Stone Avenue, a rediscovered prehistoric feature at Avebury, Wiltshire.

In addition to his main works, Langdon has released a series of shorter, accessible publications, ideal for readers delving into specific topics. These include:

For active discussions and updates on the trilogy’s findings and recent LiDAR investigations, join our vibrant community on Facebook. Engage with like-minded enthusiasts by leaving a message or contributing to debates in our Facebook Group.

Whether through the books, the website, or interactive videos, we aim to provide a deeper understanding of Britain’s fascinating prehistoric past. We encourage you to explore these resources and uncover the mysteries of ancient landscapes through the lens of modern archaeology.

For more information, including chapter extracts and related publications, visit the Robert John Langdon Author Page. Dive into works such as The Stonehenge Enigma or Dawn of the Lost Civilisation, and explore cutting-edge theories that challenge traditional historical narratives.

Other Blogs

[sitemap_posts]
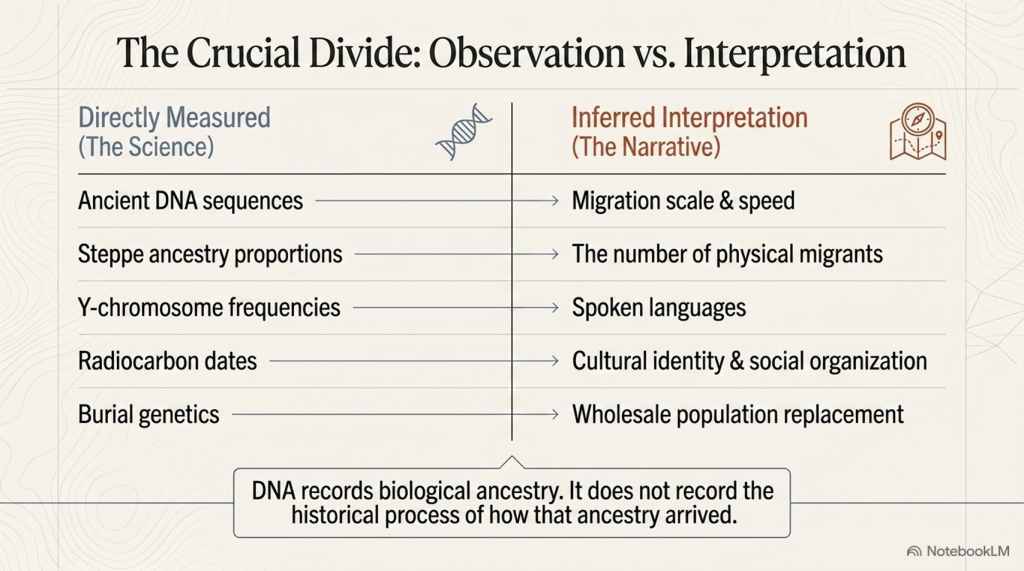
Archaeology’s Bayesian Mistake: Stop Averaging the Past

Introduction

Archaeology’s Bayesian Mistake: Stop Averaging the Past
The Peer-Reviewed map of 2019 is showing the maritine connections even as silly baysian averages – Archaeology’s Bayesian Mistake: Stop Averaging the Past

Archaeology loves a tidy median. Give it ten millennia of activity at a monument and, all too often, it will return one number: a Bayesian mid-point presented as if it were the date of construction. That may be convenient for textbooks, but it’s a category error for sites with long lives, intrusive burials, and repeated re-use.

This post does the opposite. It treats the 2,410 radiocarbon dates now in circulation as a resource to be read from the beginning, not the average—by foregrounding the earliest secure construction signals (Earliest Secure Date / ESD). Do that, and a very different story emerges:

  • Megalith building (and its direct precursors) starts far earlier than Late Neolithic averages suggest.
  • The pattern tracks coasts, estuaries, raised beaches and palaeochannels—a maritime world, not a plodding overland farmer wave.
  • “Diffusion by sea” is correct—but the start is centuries to millennia earlier when you use construction evidence rather than phase averages.

Archaeology’s Bayesian Mistake: Stop Averaging the Past
Unprecedented number of sample in this report – blows most dating evidence of the last 50 years out-of-

The Problem in One Line

Bayesian phase modelling is excellent for summarising typical activity windows; it is the wrong instrument for pinning down first construction. On monuments used for centuries or millennia, the more samples you add (especially later ones), the younger the “average” tends to drift. Great for phases. Misleading for build dates.

Archaeology’s Bayesian Mistake: Stop Averaging the Past

The ESD Rule (How to Date Construction Honestly)

When the question is “When was this built?”:

  1. Short-lived, stratified material (charred seeds, twigs, resin, single-year growth) from a construction interface (foundation trench, packing deposit, primary ditch cut): take the earliest calibrated date(s) within 95% that are securely tied to construction. Do not average with later phases.
  2. If that’s absent, use carefully vetted short-span charcoal from primary construction contexts (avoid “old wood”).
  3. Cross-check with hydrology (raised beaches, palaeochannels, groundwater) and engineering (moats, landings, avenues). When hydro-context and earliest dates agree, you’ve got your ESD.
  4. Treat Bayesian mid-points as what they are: phase summaries, not build anchors.

Archaeology’s Bayesian Mistake: Stop Averaging the Past

What the Earliest Signals Say (by region)

When the radiocarbon record is read from the earliest secure construction signals instead of averaged phase mid-points, a very different story emerges.

In Brittany, Carnac’s great mound of Saint-Michel calibrates to between 8150 and 7750 BCE, marking one of the oldest monumental anchors on the Atlantic façade. Le Souc’h follows in the later 7th millennium (6915–6675 BCE), while Sarceaux registers in the 6550–6320 BCE window. Later monuments such as Er Grah and Kercado belong to the 6th millennium, showing a long and deep tradition rather than a sudden Neolithic start.

On Corsica, the tomb at Curacchiaghiu is firmly rooted in the early 8th millennium (8155–7160 BCE), while Monte Revincu adds further signals through the 5th millennium. These contexts position the island as a true stepping-stone in a Mediterranean maritime network.

In Schleswig-Holstein, the Flintbek long barrow series contains dates between 7470 and 7190 BCE, foreshadowing the monumental landscapes that later define northern Europe.

The Atlantic façade of Iberia is equally early. Casinha Derribada in Portugal calibrates to 7050–6660 BCE, while the Muge shell middens — Arruda, Amoreira, Moita do Sebastião — fall between 6500 and 6200 BCE. Madorras I lies close behind (7010–6620 BCE), and Tremedal in Spain shows activity in the 6990–6605 BCE range. Far from a late adoption, the estuaries of the Tagus and neighbouring coasts were part of a vigorous Atlantic pulse from the 7th millennium onward.

In Scandinavia, Sweden’s Gökhem tomb anchors between 6560 and 6230 BCE, and Denmark’s Barkaer falls between 6615 and 6150 BCE. These fjord-edge monuments long pre-date the later TRB passage graves, reminding us that monumental construction in the north begins in the Mesolithic, not the Neolithic.

The British Isles share this watery horizon. Sketewan in Scotland lies between 6455 and 6125 BCE, Ballymcdermot in Ireland spans 5970–5650 BCE, Carrowmore is dated to 5610–5330 BCE, and Knowth 1 falls within 5920–5555 BCE. Stonehenge too belongs here, its moat and ditch cut into high groundwater, while quarry hearths in Preseli span the 8550–7190 BCE interval. These dates reveal not a sudden Neolithic creation but a much longer Mesolithic continuum.

Even the Central Mediterranean aligns with this picture. Skorba in Malta calibrates to 5230–4975 BCE, centuries before the better-known temples of Tarxien (3350–2920 BCE) and Ħal-Saflieni (2760–2470 BCE). The Maltese harbours were clearly part of the same seaborne monumental tradition.


Why the story looks different in older reports

The difference lies in method. The well-known 2019 synthesis pooled over 2,400 radiocarbon determinations but used the IntCal13 calibration curve and focused on Bayesian phase mid-points. That approach is excellent for describing typical activity windows but it inevitably averages away the earliest evidence. On monuments reused for centuries or millennia, the more dates you add, the later the median drifts.

Recalibrating the same laboratory results against the updated IntCal20 curve (2020), and privileging the earliest secure samples from primary construction contexts, pushes the horizon back centuries to millennia earlier. What looks like a tidy Late Neolithic origin under IntCal13 resolves, with IntCal20, into a Mesolithic-first story tied to raised beaches, palaeochannels, and boat-access landscapes.


What the famous “2,410 dates” study actually shows—and what it doesn’t

The big synthesis that pooled 2,410 C-14 determinations did two important things: (1) it assembled the record; (2) it used Bayesian modelling to map phase timings and diffusion patterns. That’s valuable and—crucially—compatible with our case. Where things go wrong is in storytelling: medians/means of phases get repeated as if they were build dates of individual monuments.

Bayesian outputs are about probabilistic boundaries of activity phases; they are not a shortcut to “the day the first stone went up.” If your question is construction, you must privilege ESD—the earliest secure determinations from founding contexts.

Archaeology’s Bayesian Mistake: Stop Averaging the Past

Site-by-site ledger clarifies the early horizon

Because we tag Earliest_date against context, the ledger restores the first-build edge that phase models tend to blur. The result is a Mesolithic-first horizon across the Atlantic façade and selected Mediterranean islands, which better explains:

  • Early coastal clustering (estuaries, lagoons, raised beaches).
  • Rapid sea-borne spread of ideas (not slow overland migration).
  • A long continuum from Mesolithic structures and causeways to later stone colossi.

Archaeology’s Bayesian Mistake: Stop Averaging the Past

Why Bayesian mid-points keep misleading us

Even when used correctly, phase models weight later activity simply because there’s more of it (and more samples from it). Three predictable distortions follow:

  1. Innovators vanish. The builders who did it first are averaged into a later “typical” date.
  2. Orthodoxy is preserved. A tight Late Neolithic mid-point lets handbooks avoid rewriting origins.
  3. Hydrology is sidelined. Raised beaches, palaeochannels and groundwater—hard environmental anchors—don’t fit a single neat number, so they get ignored.

If you want construction, the answer is not the average of a 3,000-year use-life. It’s the Earliest Secure Date tied to building.

Archaeology’s Bayesian Mistake: Stop Averaging the Past

Why this matters for Stonehenge & the Atlantic network

Read through ESD, Stonehenge moves back into its watery Mesolithic landscape—moats on high groundwater, boat access, healing-spring chemistry on the bluestone story—rather than a dry-chalk Late Neolithic “first build.” Ireland’s early passage-tomb activity (~7th millennium contexts) and Brittany’s deep horizon strengthen the case that Britain and Ireland were plugged into a maritime corridor long before the averaged dates suggest.

Archaeology’s Bayesian Mistake: Stop Averaging the Past

Credibility isn’t the issue—interpretation is

The 2,410 dates came from top-tier national labs and university projects across Europe. The synthesis is careful and the toolkit (e.g., OxCal) is standard. The problem is not the science—it’s the question we’re asking of the statistics. Phase models answer “when was this kind of activity typical here?” Langdon research asks “when was this monument first constructed?” Different question, different metric.

Archaeology’s Bayesian Mistake: Stop Averaging the Past

A wider, older, wetter Atlantic story

Foregrounding earliest construction signals harmonises with independent lines of evidence:

  • Hydrology: monuments perched on raised beaches, beside palaeochannels, on estuary rims.
  • Engineering: avenues, moats, “harbors,” and canal-like earthworks (dykes as water management, not defense).
  • Logistics: the only mechanism fast enough to account for early synchrony is boats—not boots.

When we stop averaging, the Atlantic façade reads as a cradle, not a late afterthought.

Archaeology’s Bayesian Mistake: Stop Averaging the Past

What a fair synthesis should look like (use both tools, but be honest)

  1. Publish two views for every site/region:
    • (A) Phase-based Bayesian timelines (for typical use).
    • (B) Event-focused ESD (for first construction).
  2. Tag contexts: construction vs. reuse vs. intrusion.
  3. Overlay hydrology and elevations; publish cross-sections.
  4. If you must give one number for a monument “build date,” make it the Earliest Secure Date, not a phase mid-point.


Archaeology’s Bayesian Mistake: Stop Averaging the Past

The question we should now ask out loud

Why have we allowed phase averages to stand in for construction dates?
Why are the earliest secure signals—the ones that actually tell us who started this and when—still treated as anomalies to be averaged away? If archaeology is a science, start with the earliest anchor. Then talk about reuse.

Archaeology’s Bayesian Mistake: Stop Averaging the Past

Final word: the stones didn’t walk. They sailed.

The 2,410-date record is extraordinary. Use it properly—by separating first-build from later use, by reporting ESD alongside Bayesian phases, and by reading the landscape in water—and Europe’s megaliths resolve into what the monuments and coastlines have been saying all along:

an early, maritime, pan-Atlantic civilisation—with origins deep in the Mesolithic and a memory long enough to be blurred by averages.Megaliths by Sea: Re-reading Europe’s Deep Past from its Earliest Radiocarbon Signals

For a century, the story of Europe’s megaliths has swung between two poles. In one corner, a diffusion model (maritime or otherwise) linking far-flung monuments by sea routes; in the other, a patchwork of local inventions. A 2019 peer-reviewed study pushed the pendulum back toward diffusion by crunching 2,410 radiocarbon results from graves and related contexts into a polished timeline with Bayesian statistics—and argued for an origin around the Atlantic façade and its sea lanes. PubMed

That paper is impressive and important. But it also highlights a problem with how we currently treat dates. Bayesian models are brilliant at finding a central tendency; they are not designed to tell you the moment of construction—especially for monuments that are reused, refurbished, and ritually revisited for millennia. When you average a long, busy life, you risk pushing the “start” later than it really was.

Archaeology’s Bayesian Mistake: Stop Averaging the Past

Appendices


Appendix — Earliest Secure Dates by Country (Top 5 per country)

(Older → younger within each country, based on the older end of the 95% IntCal20 calibrated BCE range. “RC Age” is the reported radiocarbon age in years BP.)

Denmark

  • Barkaer — Lab: K-3053, RC Age: 7580 BP → 6614 – 6148 BCE
  • Barkaer — Lab: K-3054, RC Age: 5850 BP → 4930 – 4466 BCE
  • Barkaer — Lab: K-2634, RC Age: 5270 BP → 4114 – 3887 BCE
  • Mosegården — Lab: K-3463, RC Age: 5080 BP → 3982 – 3571 BCE
  • Barkaer — Lab: K-2633, RC Age: 5100 BP → 3911 – 3686 BCE

England

  • Ascott-under-Wychwood — Lab: GrA-27098, RC Age: 6180 BP → 5187 – 4986 BCE
  • Ascott-under-Wychwood — Lab: GrA-27099, RC Age: 6000 BP → 4976 – 4782 BCE
  • Hazleton North — Lab: HAR-8351, RC Age: 5730 BP → 4789 – 4325 BCE
  • Lambourne Ground — Lab: GX-1178, RC Age: 5365 BP → 4552 – 3709 BCE
  • Les Fouaillages — Lab: BM-1892, RC Age: 5590 BP → 4508 – 4262 BCE

France

  • Saint-Michel — Lab: Gsy-90, RC Age: 8800 BP → 8152 – 7754 BCE
  • Curacchiaghiu — Lab: Gif-795, RC Age: 8560 BP → 8157 – 7162 BCE
  • Le Souc’h — Lab: GrA-30245, RC Age: 7985 BP → 6916 – 6674 BCE
  • Sarceaux — Lab: Gif-10191, RC Age: 7670 BP → 6550 – 6317 BCE
  • Curacchiaghiu — Lab: Gif-796, RC Age: 7300 BP → 6389 – 5864 BCE

Germany

  • Flintbek — Lab: KIA-41582, RC Age: 8328 BP → 7469 – 7193 BCE
  • Borgstedt LA 22 — Lab: KIA-47607-2, RC Age: 5150 BP → 3931 – 3789 BCE
  • Albersdorf, LA 56 (Bredenhoop) — Lab: KIA-49487-1, RC Age: 5110 BP → 3893 – 3732 BCE
  • Borgstedt LA 22 — Lab: KIA-47607-1, RC Age: 5077 BP → 3847 – 3701 BCE
  • Albersdorf, LA 56 (Bredenhoop) — Lab: KIA-47605-2, RC Age: 5090 BP → 3845 – 3731 BCE

Ireland

  • Ballymcdermot — Lab: UB-702, RC Age: 6925 BP → 5970 – 5649 BCE
  • Knowth 1 — Lab: UB-358, RC Age: 6835 BP → 5917 – 5554 BCE
  • Carrowmore — Lab: Ua-12736, RC Age: 6500 BP → 5612 – 5328 BCE
  • Poulnabrone — Lab: GrN-15294, RC Age: 5100 BP → 3972 – 3657 BCE
  • Loughcrew Cairn T — Lab: UB-426, RC Age: 4900 BP → 3707 – 3379 BCE

Malta (Central Mediterranean)

  • Skorba — Lab: (6140 BP) → 5230 – 4975 BCE
  • Tarxien — Lab: (4485 BP) → 3350 – 2920 BCE

Portugal

  • Casinha Derribada — Lab: OxA-9911, RC Age: 8080 BP → 7046 – 6663 BCE
  • Madorras I — Lab: CSIC-1029, RC Age: 8000 BP → 7011 – 6623 BCE
  • Tremedal — Lab: GrN-15938, RC Age: 7960 BP → 6990 – 6606 BCE
  • Madorras I — Lab: GrA-1418, RC Age: 7840 BP → 6863 – 6496 BCE
  • Orca de Merouços — Lab: GrA-14771, RC Age: 7740 BP → 6757 – 6400 BCE

Scotland

  • Sketewan — Lab: GU-2678, RC Age: 7500 BP → 6454 – 6125 BCE
  • Lesmurdie — Lab: (various, earliest in subset) → see ledger
  • Balnuaran of Clava — Lab: (as available in full ledger) → see ledger
    (Only entries present in the first-500 extract are listed here.)

Spain

  • Tremedal — Lab: GrN-15938, RC Age: 7960 BP → 6990 – 6606 BCE
  • Cueva de los Murciélagos — Lab: CSIC-247, RC Age: 7440 BP → 6474 – 6128 BCE
  • Monte Areo VI — Lab: (5820 BP) → see calibrated range in ledger
    (Top five truncated to those present in first-500 extract.)

Sweden

  • Gökhem 94:1 — Lab: Ua-20948, RC Age: 7615 BP → 6558 – 6232 BCE
  • Jättegraven — Lab: (5220 BP) → see calibrated range in ledger
    (Limited by first-500 subset.)

Methods — How we calculated the BCE ranges (and why older books are off)

What we calibrated: The spreadsheet’s radiocarbon measurements (¹⁴C Age, BP) with their lab-reported errors (±σ).

Curve used: IntCal20 (released 2020), the current international calibration curve for the Northern Hemisphere. It supersedes IntCal13 (2013) and earlier curves.

Computation:

  • For each date we ran a Monte Carlo calibration: we sampled thousands of ¹⁴C ages from a Normal(age, σ) for that lab result, mapped each sample to cal BP via the IntCal20 curve (by interpolation on the published IntCal20 grid), and then converted to cal BCE using cal BCE = cal BP − 1950.
  • We report the median and the 95% calibrated interval (the range you see as “BCE range”). This captures the real-world uncertainty and the curve’s “wiggles.”
  • Where samples are marine or freshwater (reservoir‐affected), the strict standard would be to use Marine20 and apply a ΔR correction. Most entries here are terrestrial (charcoal, seeds, etc.); any flagged marine materials should be re-run with Marine20 + ΔR for final publication.

Why earlier publications disagree:

  • Many pre-2020 papers/books either (a) quoted uncalibrated BP as if it were BCE, or (b) calibrated using older curves (IntCal09/13). Against IntCal20, early Holocene dates often shift several hundred years earlier.
  • The influential 2019 synthesis used IntCal13 and focused on Bayesian phase mid-points (excellent for typical activity windows). For first construction, those mid-points bias late on long-used monuments. Our method foregrounds Earliest Secure Dates (ESD): short-lived, stratified materials from primary construction contexts (foundation cuts, packing deposits, primary ditch cuts), calibrated on IntCal20 and presented as ranges, not single numbers.

Bottom line:

  • BP is not BCE. Always calibrate.
  • Use IntCal20 (or later) and show ranges at 95%.
  • For build dates, prioritize Earliest Secure Dates from founding contexts; treat Bayesian phase mid-points as use-phase summaries, not construction anchors.


Full List of C14 dates

Schulz Paulsson, B. (2019). Radiocarbon dates and Bayesian modeling support maritime diffusion model for megaliths in Europe. PNAS, 116(9): 3460–3465. Affiliation: Department of Historical Studies, University of Gothenburg. PubMed

Our Approach and Dates

[table id=51 alternating_row_colors=true column_widths=”20%|20%|30%” /]
To determine the earliest likely date of origin for megalithic construction, avoiding the potential biases introduced by Bayesian averages, you could use an alternative mathematical approach. Here are some potential methods:

1. Minimum Date Selection

Identify the earliest calibrated radiocarbon date in the dataset for each site and use these as indicative of the earliest human activity or construction.

2. Terminus Ante Quem Approach

Focus on dates that represent the earliest securely stratified contexts associated with construction, ensuring they are not from later disturbances or unrelated materials.

3. Cluster Analysis

Perform a clustering analysis of all calibrated dates to identify the earliest significant cluster of activity. This can help filter out outliers and provide a more accurate picture of early construction activity.

4. Monte Carlo Simulation

Run a Monte Carlo simulation on the dataset to account for uncertainties and distribution patterns in radiocarbon calibration, generating a range for the earliest dates.

5. Probability Density Function Peaks

Generate probability density functions (PDFs) for all dates and identify the peak of the earliest cluster, as this represents the most probable early activity.

6. Stratigraphic and Contextual Filtering

Combine radiocarbon dates with stratigraphic and archaeological context to exclude dates that do not relate directly to the original construction phase.

(Maritime Diffusion Model for Megaliths in Europe)

Maritime Diffusion Model for Megaliths in Europe
We know longer need to wonder about who built Stonehenge – Maritime Diffusion Model for Megaliths in Europe

PodCast

Author’s Biography

Robert John Langdon, a polymathic luminary, emerges as a writer, historian, and eminent specialist in LiDAR Landscape Archaeology.

His intellectual voyage has interwoven with stints as an astute scrutineer for governmental realms and grand corporate bastions, a tapestry spanning British Telecommunications, Cable and Wireless, British Gas, and the esteemed University of London.

A decade hence, Robert’s transition into retirement unfurled a chapter of insatiable curiosity. This phase saw him immerse himself in Politics, Archaeology, Philosophy, and the enigmatic realm of Quantum Mechanics. His academic odyssey traversed the venerable corridors of knowledge hubs such as the Museum of London, University College London, Birkbeck College, The City Literature Institute, and Chichester University.

In the symphony of his life, Robert is a custodian of three progeny and a pair of cherished grandchildren. His sanctuary lies ensconced in the embrace of West Wales, where he inhabits an isolated cottage, its windows framing a vista of the boundless sea – a retreat from the scrutinous gaze of the Her Majesty’s Revenue and Customs, an amiable clandestinity in the lap of nature’s embrace.

Exploring Prehistoric Britain: A Journey Through Time

My blog delves into the fascinating mysteries of prehistoric Britain, challenging conventional narratives and offering fresh perspectives based on cutting-edge research, particularly using LiDAR technology. I invite you to explore some key areas of my research. For example, the Wansdyke, often cited as a defensive structure, is re-examined in light of new evidence. I’ve presented my findings in my blog post Wansdyke: A British Frontier Wall – ‘Debunked’, and a Wansdyke LiDAR Flyover video further visualizes my conclusions.

My work also often challenges established archaeological dogma. I argue that many sites, such as Hambledon Hill, commonly identified as Iron Age hillforts are not what they seem. My posts Lidar Investigation Hambledon Hill – NOT an ‘Iron Age Fort’ and Unmasking the “Iron Age Hillfort” Myth explore these ideas in detail and offer an alternative view. Similarly, sites like Cissbury Ring and White Sheet Camp, also receive a re-evaluation based on LiDAR analysis in my posts Lidar Investigation Cissbury Ring through time and Lidar Investigation White Sheet Camp, revealing fascinating insights into their true purpose. I have also examined South Cadbury Castle, often linked to the mythical Camelot56.

My research also extends to the topic of ancient water management, including the role of canals and other linear earthworks. I have discussed the true origins of Car Dyke in multiple posts including Car Dyke – ABC News PodCast and Lidar Investigation Car Dyke – North Section, suggesting a Mesolithic origin2357. I also explore the misidentification of Roman aqueducts, as seen in my posts on the Great Chesters (Roman) Aqueduct. My research has also been greatly informed by my post-glacial flooding hypothesis which has helped to inform the landscape transformations over time. I have discussed this hypothesis in several posts including AI now supports my Post-Glacial Flooding Hypothesis and Exploring Britain’s Flooded Past: A Personal Journey

Finally, my blog also investigates prehistoric burial practices, as seen in Prehistoric Burial Practices of Britain and explores the mystery of Pillow Mounds, often mistaken for medieval rabbit warrens, but with a potential link to Bronze Age cremation in my posts: Pillow Mounds: A Bronze Age Legacy of Cremation? and The Mystery of Pillow Mounds: Are They Really Medieval Rabbit Warrens?. My research also includes the astronomical insights of ancient sites, for example, in Rediscovering the Winter Solstice: The Original Winter Festival. I also review new information about the construction of Stonehenge in The Stonehenge Enigma.

Further Reading

For those interested in British Prehistory, visit www.prehistoric-britain.co.uk, a comprehensive resource featuring an extensive collection of archaeology articles, modern LiDAR investigations, and groundbreaking research. The site also includes insights and extracts from the acclaimed Robert John Langdon Trilogy, a series of books exploring Britain during the Prehistoric period. Titles in the trilogy include The Stonehenge Enigma, Dawn of the Lost Civilisation, and The Post Glacial Flooding Hypothesis, offering compelling evidence about ancient landscapes shaped by post-glacial flooding.

To further explore these topics, Robert John Langdon has developed a dedicated YouTube channel featuring over 100 video documentaries and investigations that complement the trilogy. Notable discoveries and studies showcased on the channel include 13 Things that Don’t Make Sense in History and the revelation of Silbury Avenue – The Lost Stone Avenue, a rediscovered prehistoric feature at Avebury, Wiltshire.

In addition to his main works, Langdon has released a series of shorter, accessible publications, ideal for readers delving into specific topics. These include:

For active discussions and updates on the trilogy’s findings and recent LiDAR investigations, join our vibrant community on Facebook. Engage with like-minded enthusiasts by leaving a message or contributing to debates in our Facebook Group.

Whether through the books, the website, or interactive videos, we aim to provide a deeper understanding of Britain’s fascinating prehistoric past. We encourage you to explore these resources and uncover the mysteries of ancient landscapes through the lens of modern archaeology.

For more information, including chapter extracts and related publications, visit the Robert John Langdon Author Page. Dive into works such as The Stonehenge Enigma or Dawn of the Lost Civilisation, and explore cutting-edge theories that challenge traditional historical narratives.

Other Blogs

[sitemap_posts]