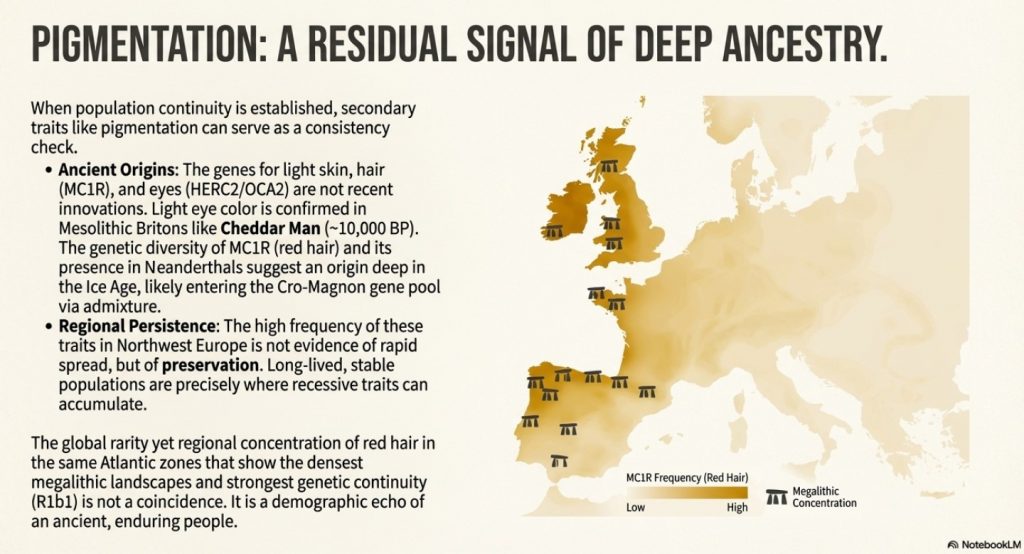
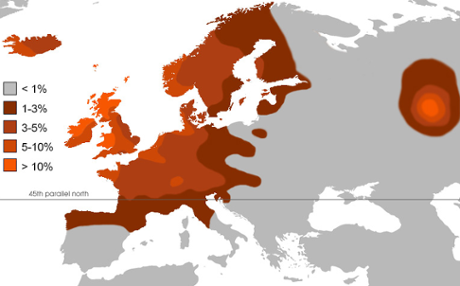
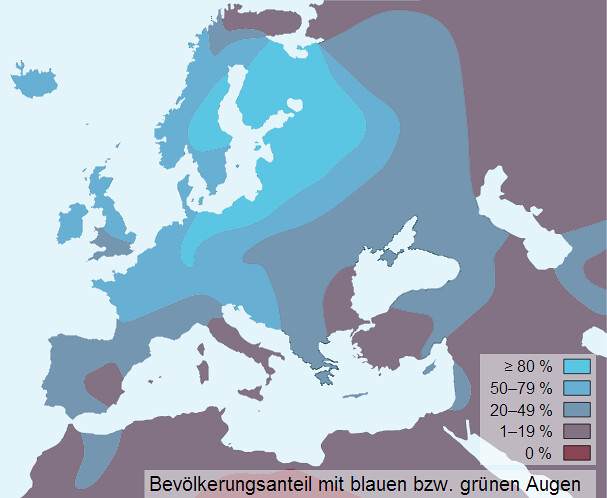
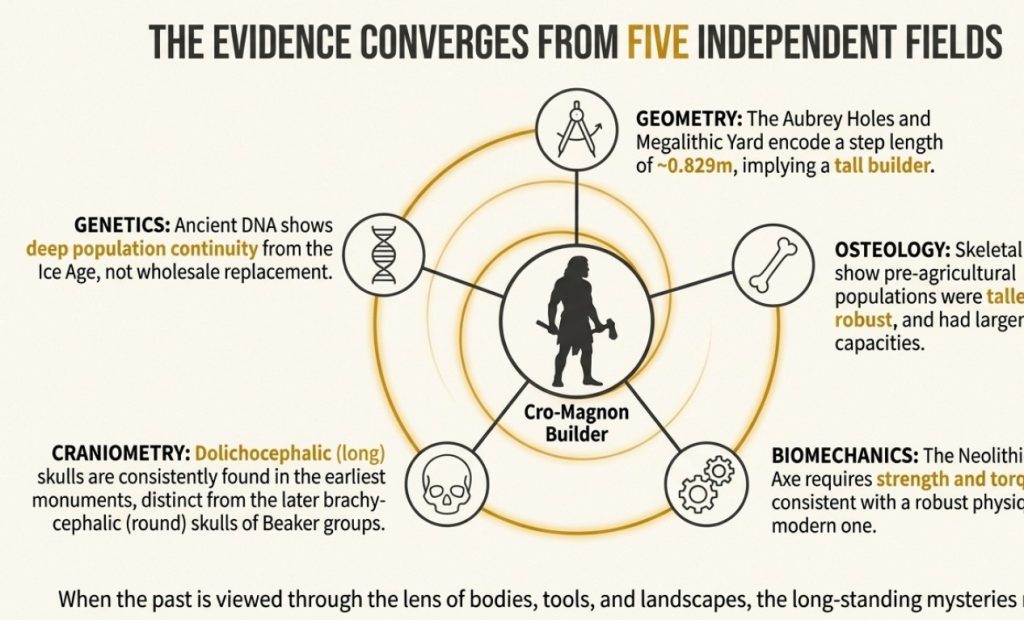
For most of human history, change was painfully slow. Early members of the genus Homo survived through hunting, gathering, and simple tool use, but across hundreds of thousands of years the archaeological record shows remarkable continuity rather than rapid advancement. Species such as Homo erectus and later populations associated with Homo heidelbergensis spread across Africa, Europe, and Asia, adapting to local conditions but leaving behind technologies that altered only gradually through time. (The Ascent of Man — From Survival to Systems)
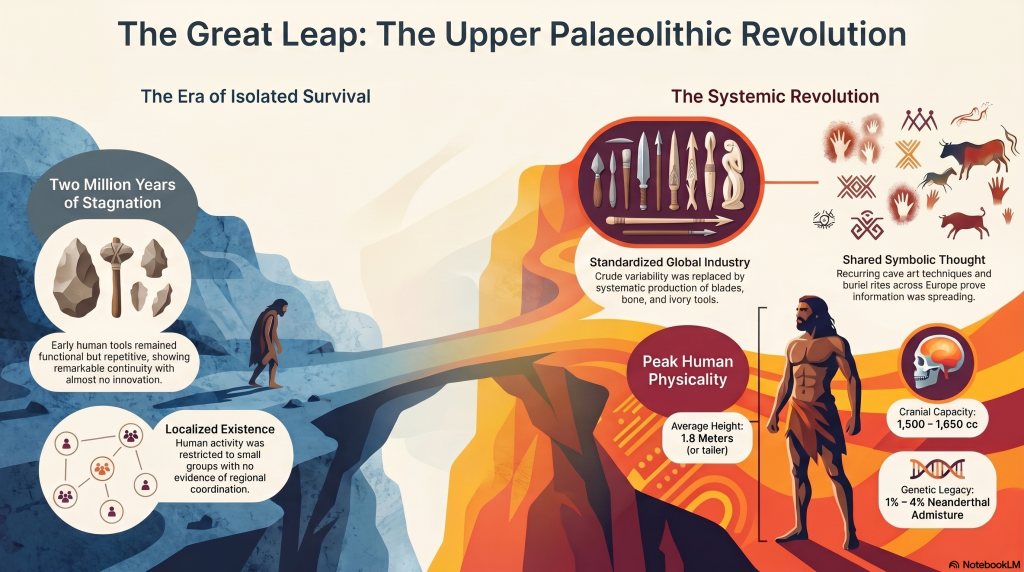
The tools they produced were functional but repetitive. Stone forms persisted for immense periods with little structural innovation, and activity appears largely localised rather than coordinated across large regions. Human groups survived successfully, but there is little evidence of widespread standardisation, long-distance organisation, or shared operational systems. Humanity endured — but it did not yet accelerate.
The Ascent of Man — From Survival to Systems
2. The Ice Age World
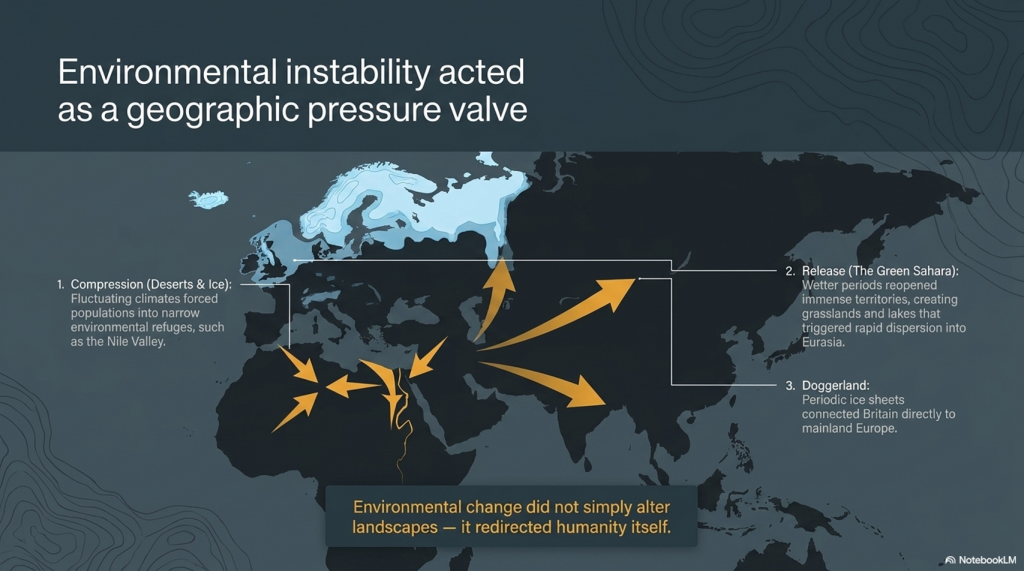
The Late Pleistocene world was shaped by instability. Vast ice sheets covered northern Europe and North America, sea levels were dramatically lower, and habitable regions shifted constantly in response to climatic oscillations. Britain itself was periodically buried beneath ice or connected directly to mainland Europe through the lowland plains of Doggerland.
As climates fluctuated, populations were repeatedly compressed into environmental refuges. In North Africa and the Near East, expanding deserts restricted movement into narrow corridors such as the Nile Valley. During wetter periods, however, enormous territories reopened. Grasslands, rivers, and lakes spread across what is now the Sahara, creating migration routes that allowed human populations to disperse rapidly into Eurasia. Environmental change did not simply alter landscapes — it redirected humanity itself.
The Ascent of Man — From Survival to Systems
3. The Arrival of Modern Humans in Europe
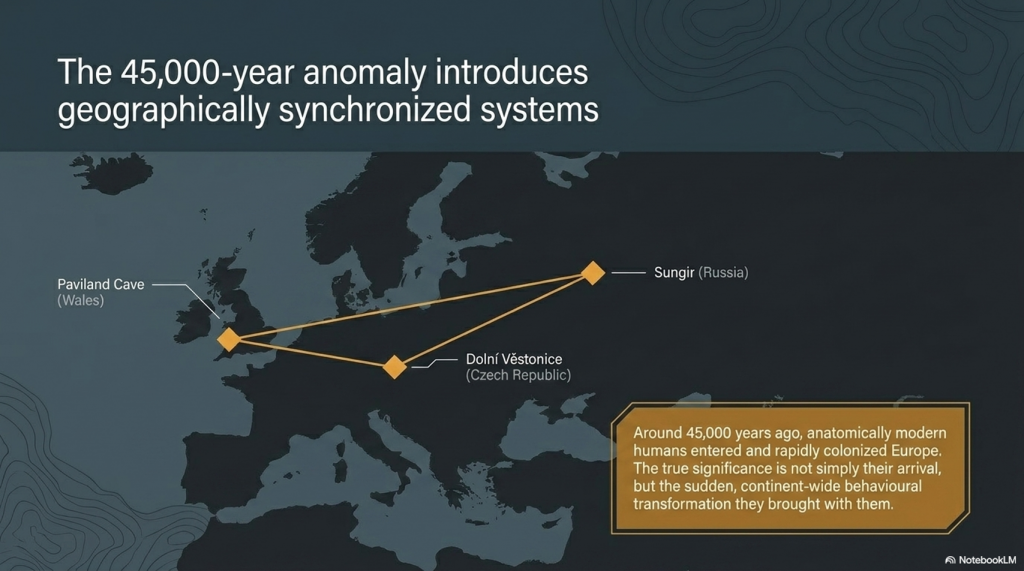
Around 45,000 years ago, anatomically modern humans entered Europe. These populations, later known as “Cro-Magnon,” spread rapidly across the continent, from France and Spain to Russia and Britain. Sites such as Paviland Cave in Wales, Sungir in Russia, and Dolní Věstonice in the Czech Republic reveal the presence of these early Europeans across an enormous geographical range.
What makes these populations important is not simply their anatomy, but the sudden transformation visible in the archaeological record associated with them. The Upper Palaeolithic does not merely continue earlier traditions — it behaves differently. Tool production becomes increasingly standardised, methods are repeated across regions, and material culture begins operating according to recognisable systems rather than isolated local practice.
The Ascent of Man — From Survival to Systems
4. The Upper Palaeolithic Revolution
For over two million years, human technology remained comparatively conservative. Then, within a relatively short archaeological window, a dramatic transition appears. Long, standardised blades replace crude variability. Bone, antler, and ivory are worked systematically into specialised tools. Production methods spread across enormous distances with remarkable consistency.
This is the real significance of the Upper Palaeolithic. Human behaviour becomes structured. Artefacts are no longer random outputs of survival, but components within organised systems of manufacture and use. The archaeological record suddenly begins displaying repetition, correction, standardisation, and coordination. Humanity was no longer simply adapting to the world — it was beginning to engineer solutions within it.
The Ascent of Man — From Survival to Systems
5. Art, Symbolism, and Shared Thought
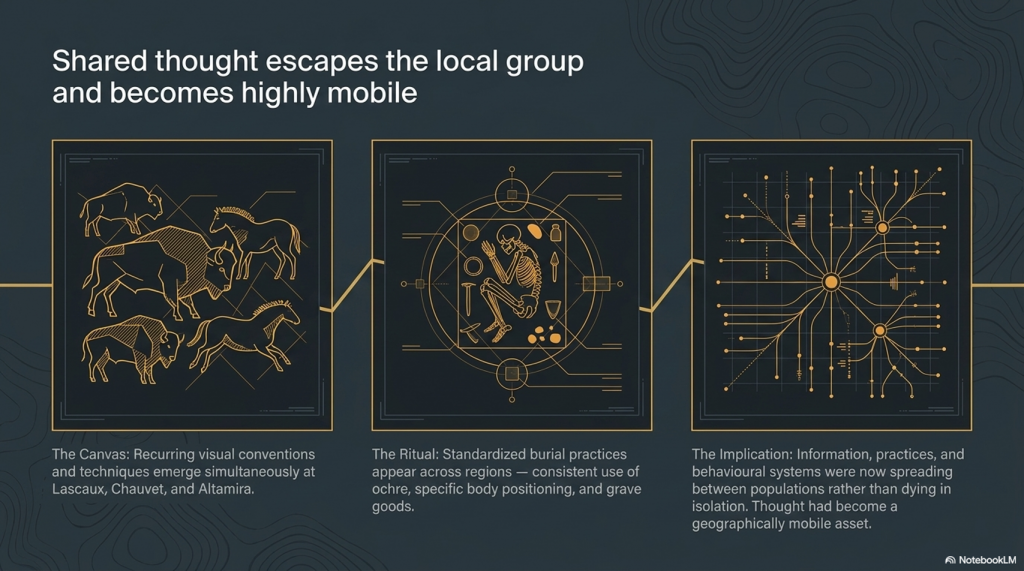
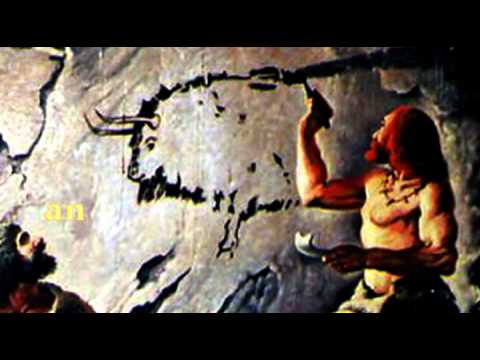
The same pattern appears in symbolic behaviour. Cave art emerges across Europe in locations such as Lascaux, Chauvet Cave, and Altamira Cave. These sites display recurring techniques, recurring animals, and repeated visual conventions separated by vast geographical distances.
Burial practices also become increasingly structured. Ochre use, grave goods, body positioning, and ceremonial treatment repeat across multiple regions. This consistency matters. It demonstrates that information, practices, and behavioural systems were now spreading between populations rather than remaining isolated within local groups. Shared thought had become geographically mobile.
The Ascent of Man — From Survival to Systems
6. Water, Mobility, and the Rise of Networks
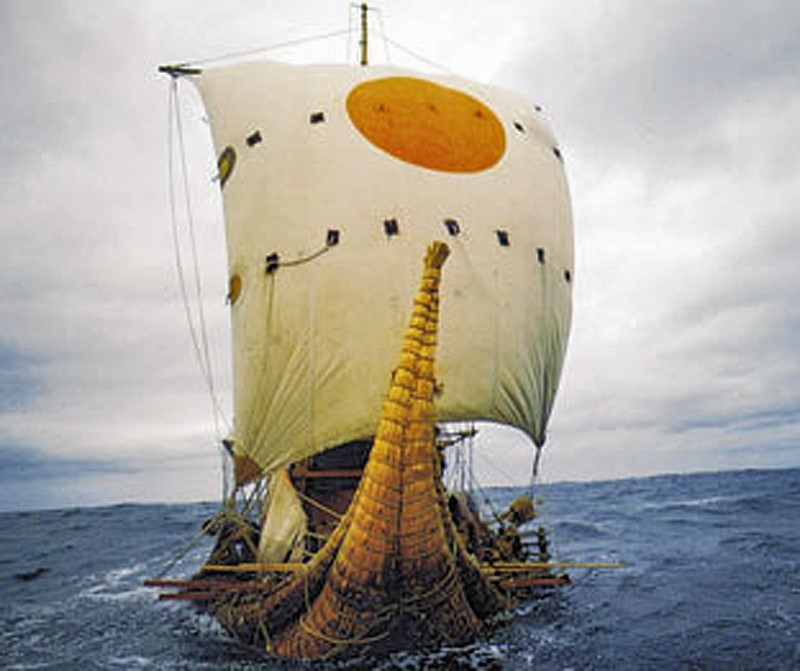
As the Ice Age ended, rivers, wetlands, estuaries, and coastlines dominated much of Eurasia. In this environment, waterborne movement became increasingly important. Waterways were not obstacles — they were transport corridors. The emergence of maritime adaptation transformed the scale at which human populations could operate.
One of the clearest examples comes from Gobustan Rock Art Cultural Landscape near the Caspian Sea, where prehistoric engravings depict long boats carrying organised crews. These images suggest coordinated water transport thousands of years before formal civilisation emerged. Rivers and coastlines now linked populations together, accelerating trade, migration, and cultural exchange across enormous distances.
The Ascent of Man — From Survival to Systems
7. Physical Characteristics of Cro-Magnon Populations
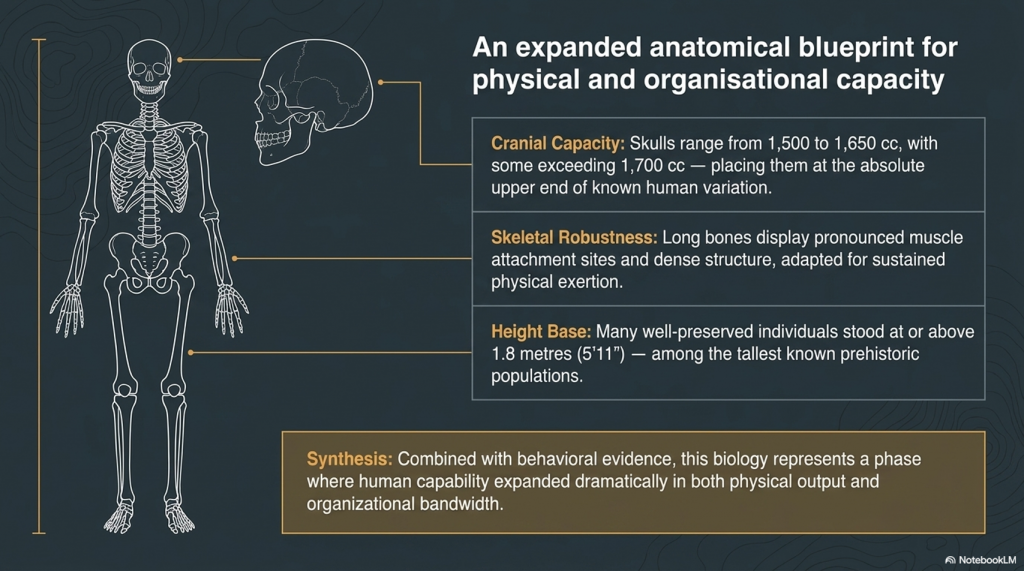
The skeletal evidence associated with Upper Palaeolithic Europeans reveals populations that were physically robust and highly active. Long bones display pronounced muscle attachment sites, dense structure, and adaptations consistent with sustained physical exertion. Many well-preserved individuals stood at or above 1.8 metres tall, placing them among the taller known prehistoric populations.
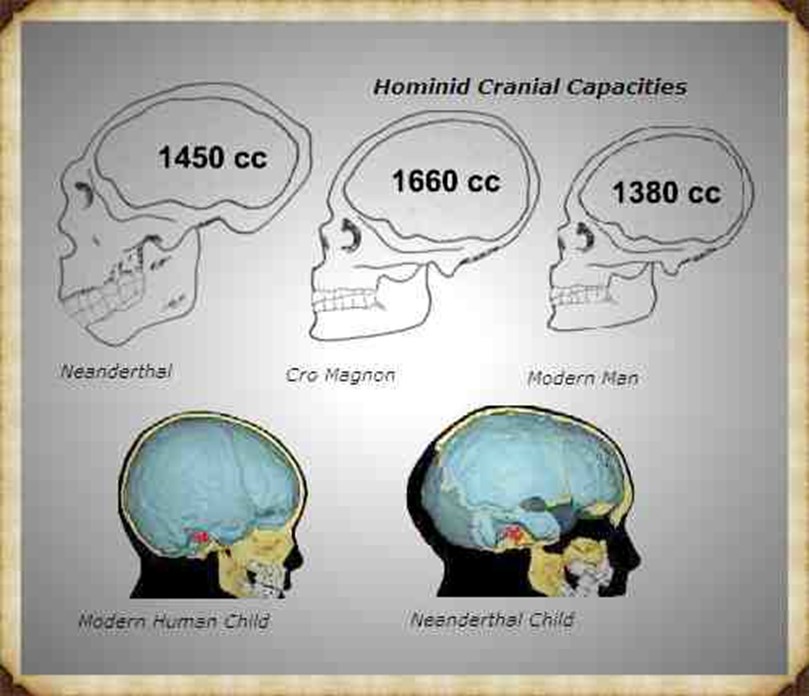
Cranial capacity is equally striking. Upper Palaeolithic skulls typically range from 1,500 to 1,650 cubic centimetres, with some exceeding 1,700 cc — placing them at the upper end of known human variation. While cranial volume alone does not determine intelligence, it remains a measurable anatomical distinction. Combined with the behavioural evidence, these populations represent a phase in which human capability appears to expand dramatically in both physical and organisational terms.
The Ascent of Man — From Survival to Systems
8. Genetics, Mixture, and Human Continuity
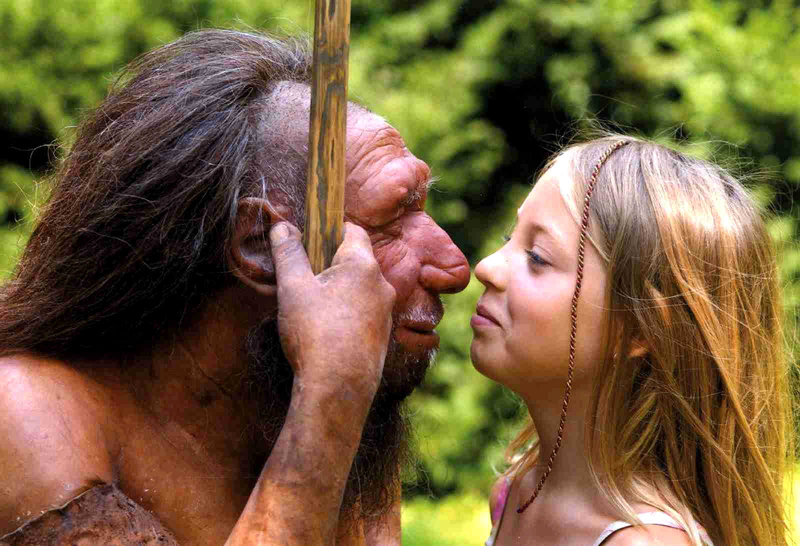
Modern genetic evidence confirms that these populations were not isolated species, but part of the wider Homo sapiens lineage. Ancient DNA studies show continuity between Upper Palaeolithic Europeans and later populations, alongside evidence of admixture with Neanderthals. Modern non-African populations still retain approximately 1–4% Neanderthal DNA.
At the same time, the genetic record reveals that human history was not a simple replacement process. Populations mixed, migrated, adapted, and survived through complex interactions across Eurasia. Studies such as Caramelli et al. (2008) even identified mitochondrial lineages from Upper Palaeolithic Europeans that are still present in modern populations. The evidence increasingly points toward continuity combined with transformation rather than disappearance and replacement.
The Ascent of Man — From Survival to Systems
9. The Disappearance of the Cro-Magnon Label
Despite its historical importance, the term “Cro-Magnon” has largely disappeared from formal anthropology. Modern classification groups these populations into the broader category of Homo sapiens, emphasising shared ancestry rather than distinct regional populations. Scientifically, this creates consistency — but it also reduces resolution.
The archaeological patterns associated with Cro-Magnon populations remain visible regardless of terminology. Standardised industries, structured behaviour, symbolic repetition, maritime adaptation, and large-scale coordination all still exist within the record. What has changed is not the evidence itself, but the framework used to describe it. The question is therefore not whether Cro-Magnon was a separate species, but whether current models fully explain the scale of behavioural change associated with these populations.
The Ascent of Man — From Survival to Systems
10. The Turning Point of Humanity
This is the real problem posed by the Upper Palaeolithic.
For millions of years, humans survived in relatively small groups using localised technologies that changed only slowly. Then, within a comparatively brief period, behaviour transformed. Systems emerged. Production became standardised. Activity spread across entire continents according to shared methods and repeatable structures.
Everything that follows in human history depends on this transition.
The principles first visible in the Upper Palaeolithic — coordination, measurement, repetition, mobility, and structured behaviour — are the same principles that later underpin agriculture, trade, engineering, navigation, mathematics, and eventually civilisation itself. Without this shift, humanity remains a species surviving within nature rather than organising it.
The great question is therefore not whether this transformation occurred, because the archaeological record clearly shows that it did.
The real question is:
How did humanity go from isolated survival… to organised systems capable of reshaping the world? And did these people build the Megalithic structures that have lasted ten thousand years and thrown archaeology into confusion by not recognising an advanced Lost Civilisation at the Dawn of Humanity?
PODCAST
Author’s Biography
Robert John Langdon, a polymathic luminary, emerges as a writer, historian, and eminent specialist in LiDAR Landscape Archaeology.
His intellectual voyage has been interwoven with stints as an astute scrutineer in government and grand corporate bastions, a tapestry spanning British Telecommunications, Cable and Wireless, British Gas, and the esteemed University of London.
A decade hence, Robert’s transition into retirement unfurled a chapter of insatiable curiosity. This phase saw him immerse himself in Politics, Archaeology, Philosophy, and the enigmatic realm of Quantum Mechanics. His academic odyssey traversed the venerable corridors of knowledge hubs such as the Museum of London, University College London, Birkbeck College, The City Literature Institute, and Chichester University.
In the symphony of his life, Robert is a custodian of three progeny and a pair of cherished grandchildren. His sanctuary lies ensconced in the embrace of West Wales, where he inhabits an isolated cottage, its windows framing a vista of the boundless sea – a retreat from the scrutinising gaze of Her Majesty’s Revenue and Customs, an amiable clandestinity in the lap of nature.
Exploring Prehistoric Britain: A Journey Through Time
My blog delves into the fascinating mysteries of prehistoric Britain, challenging conventional narratives and offering fresh perspectives grounded in cutting-edge research, particularly LiDAR technology. I invite you to explore some key areas of my research. For example, the Wansdyke, often cited as a defensive structure, is re-examined in light of new evidence. I’ve presented my findings in my blog post Wansdyke: A British Frontier Wall – ‘Debunked’, and a Wansdyke LiDAR Flyover video further visualises my conclusions.
My work also often challenges established archaeological dogma. I argue that many sites, such as Hambledon Hill, commonly identified as Iron Age hillforts, are not what they seem. My posts Lidar Investigation Hambledon Hill – NOT an ‘Iron Age Fort’ and Unmasking the “Iron Age Hillfort” Myth explore these ideas in detail and offer an alternative view. Similarly, sites like Cissbury Ring and White Sheet Camp receive re-evaluations based on LiDAR analysis in my posts “Lidar Investigation Cissbury Ring through time”and “Lidar Investigation White Sheet Camp,“ revealing fascinating insights into their true purpose. I have also examined South Cadbury Castle, often linked to the mythical Camelot56.
My research also extends to ancient water management, including the role of canals and other linear earthworks. I have discussed the true origins of Car Dyke in multiple posts, including Car Dyke – ABC News Podcast and Lidar Investigation Car Dyke – North Section, which suggest a Mesolithic origin 2357. I also explore the misidentification of Roman aqueducts, as seen in my posts on the Great Chesters (Roman) Aqueduct. My research has also been greatly informed by my post-glacial flooding hypothesis, which has helped explain landscape transformations over time. I have discussed this hypothesis in several posts, including AI now supports my Post-Glacial Flooding Hypothesis and Exploring Britain’s Flooded Past: A Personal Journey
For those interested in British Prehistory, visit www.prehistoric-britain.co.uk, a comprehensive resource featuring an extensive collection of archaeology articles, modern LiDAR investigations, and groundbreaking research. The site also includes insights and excerpts from the acclaimed Robert John Langdon Trilogy, a series of books that explore Britain during the Prehistoric period. Titles in the trilogy include The Stonehenge Enigma, Dawn of the Lost Civilisation, and The Post-Glacial Flooding Hypothesis, which offer compelling evidence of ancient landscapes shaped by post-glacial flooding.
To further explore these topics, Robert John Langdon has developed a dedicated YouTube channel featuring over 100 video documentaries and investigations that complement the trilogy. Notable discoveries and studies showcased on the channel include 13 Things that Don’t Make Sense in History and the revelation of Silbury Avenue – The Lost Stone Avenue, a rediscovered prehistoric feature at Avebury, Wiltshire.
In addition to his main works, Langdon has released a series of shorter, accessible publications, ideal for readers delving into specific topics. These include:
For active discussions and updates on the trilogy’s findings and recent LiDAR investigations, join our vibrant community on Facebook. Engage with like-minded enthusiasts by leaving a message or contributing to debates in our Facebook Group.
Whether through the books, the website, or interactive videos, we aim to provide a deeper understanding of Britain’s fascinating prehistoric past. We encourage you to explore these resources and uncover the mysteries of ancient landscapes through the lens of modern archaeology.
For more information, including chapter extracts and related publications, visit the Robert John Langdon Author Page. Dive into works such as The Stonehenge Enigma or Dawn of the Lost Civilisation, and explore cutting-edge theories that challenge traditional historical narratives.
Wansdyke has always captured the imagination of the general public as it is a substantial prominent structure in the Wiltshire landscape relatively close to another famous ancient site Avebury, which also has massive ditches like Wansdyke and therefore, one might suggest there is a direct relationship between the two.
This apparent connection has not occurred to past or present archaeologists who sought to find a simple meaning for this unique ‘linear structure’ and hence the conclusion that it was built to defend warlike invaders of the past and hence a ‘Saxon’ name was adopted as historians of the past believed that these ‘tribes’ had large armed forces that could cope with such grand engineering undertakings as it was to defend their land.
Over the last few decades, this ‘fact’ (which was also shared by an even more immense ‘Dyke’ also named after a Saxon ‘Offa’) has been revisited and found that this continuous defence ditch is far less continuous than previously believed and a new theory developed for these earthworks as ‘Boarder Markers’ in the landscape – as they have never been a single body found with battle wounds in all 22 miles of Wansdyke or the 177 mile Offa’s Dyke which would support the defence hypothesis.
Sadly, even with this new ‘reassuring’ suggestion for these extensive sites, archaeologists have failed to address the facts that Dykes are incomplete and not continuous (Offa has 40% missing and Wansdyke has 20% missing) and there beginning and end points just ‘appear’ without reason in the landscape ‘like magic’ with no one able to tell you why.
Moreover, if these ‘Boundary Markers’ taking years if not decades to build were demarcation points for land ownership, then why do some Dykes (like Offa) track much larger separation points like major rivers that would have been a far more apparent marker than a 4m ditch and a known and well used territorial boundary marker still used today.
Furthermore, archaeologists have ignored that there are over 1500+ scheduled Dykes in Britain (including Ireland), of which 90% could not be used for this function as some of these ‘boundary markers’ are found on uninhabited islands dotted around the entire circumference of Britain.
Robert John Langdon (2022)
Section 2 – HE:1004719 Wansdyke: Section from S of Furze Hill to Marlborough-Pewsey Road 4.3km (4,300m = 12,900 working days – 20 men taking 649 days (1.78 years).
P.J.Fowler (2001) used 0.1423 metres per hour and claimed 1,000 men built the ENTIRE East Dyke in 30 days working 10-hours a day six days a week??
This ridiculous claim even with modern tools, it would be too demanding, and the logistics of feeding, mending tools and housing 1,000 men were not taken into account.
If we take the East Wansdyke into account – which is a total of 25,408 – we then get a calculation of 84,693 days. That is 11.6 years for the same 200 man tean (20 digging) – which indicates that this Dyke was built in small sections and then joined at a later date?
Twisty Route
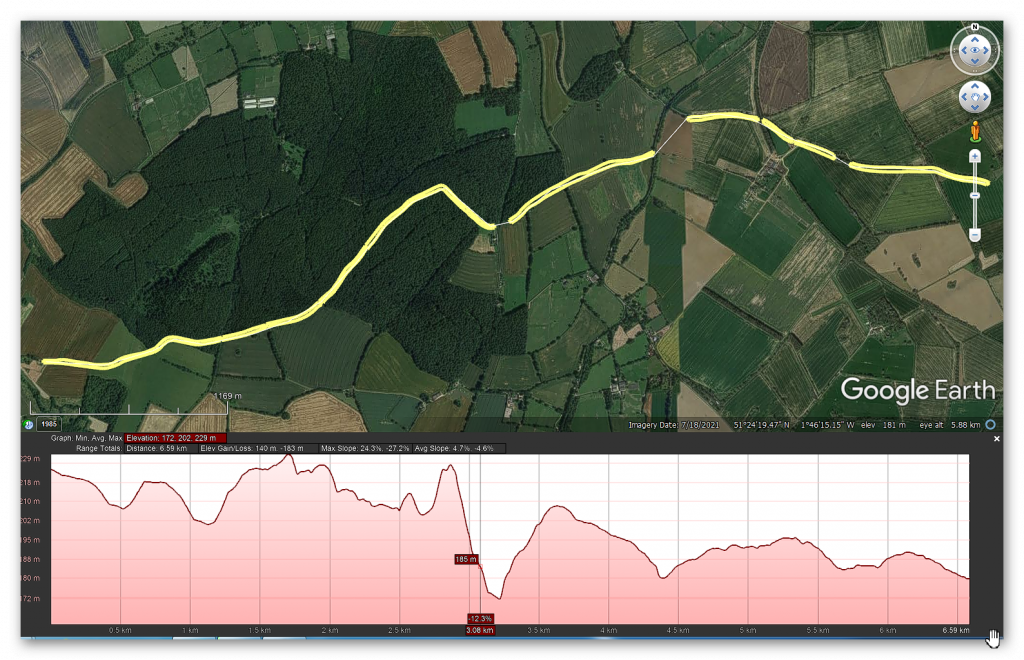
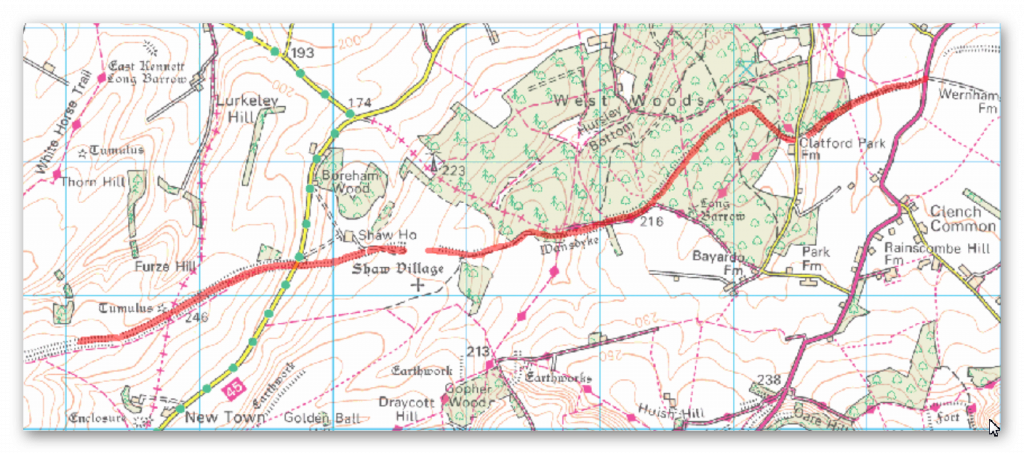
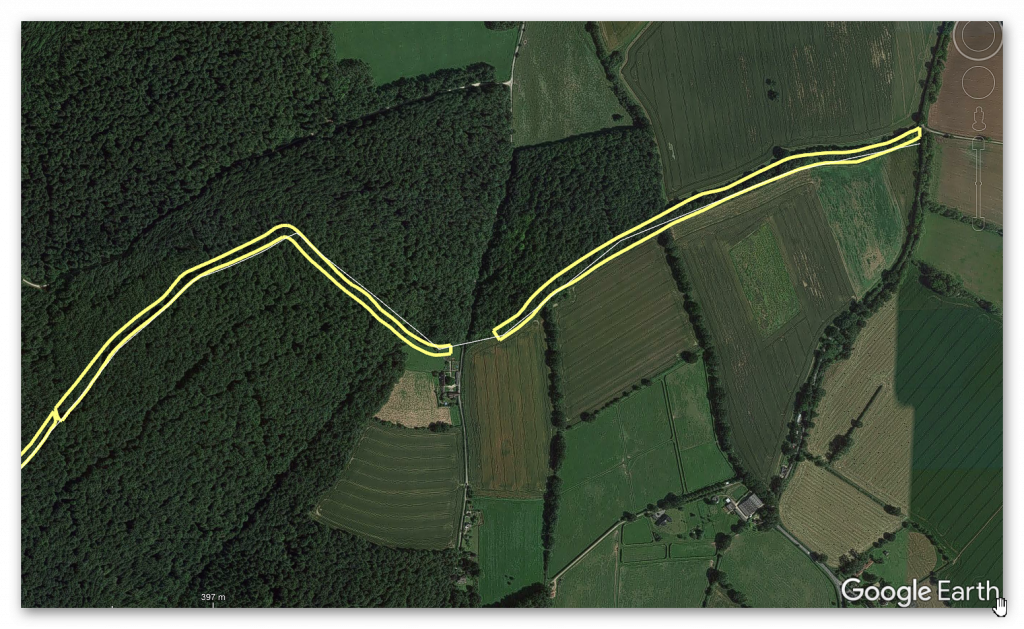
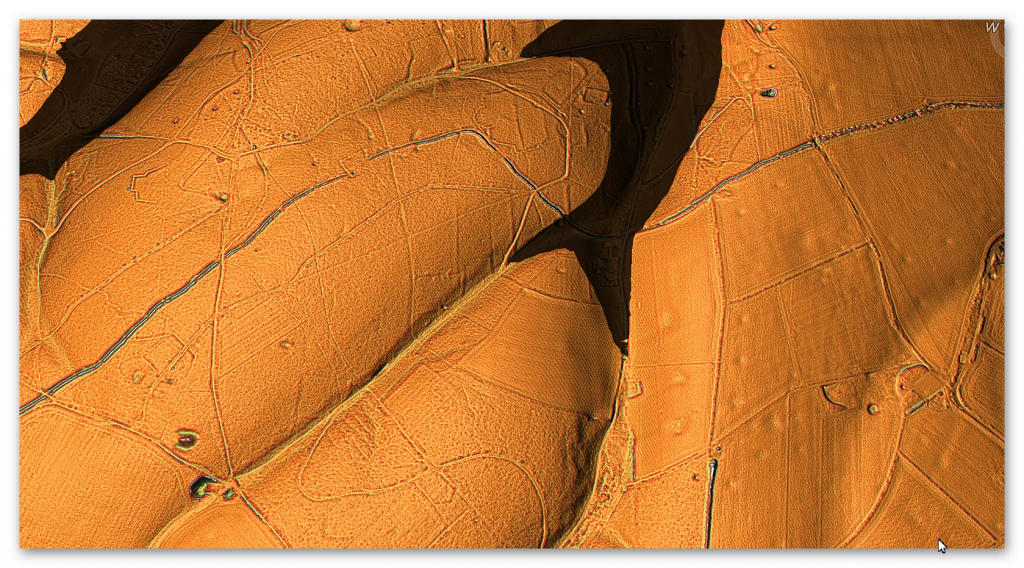
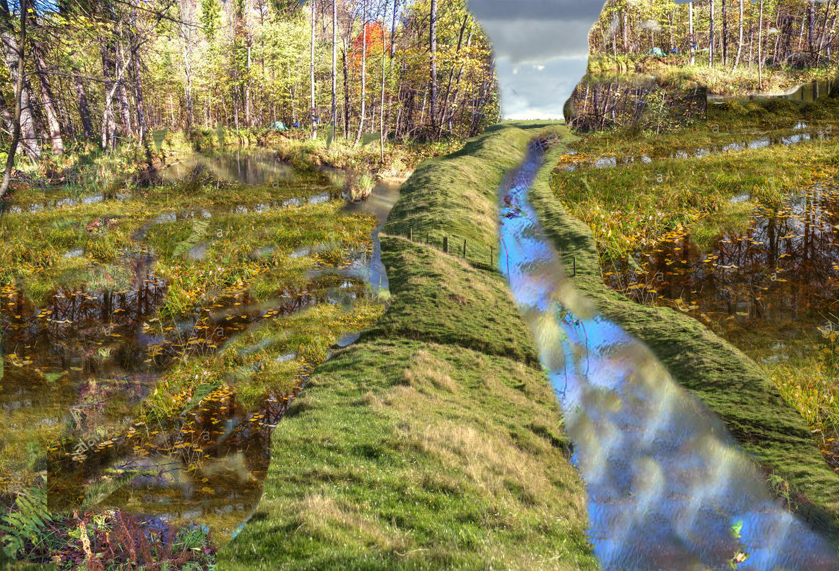
What is clear from the route of this section of Wansdyke is that it is not straight at all; it works against the topology to bend at 90 degrees in some places and dip down unnecessarily into a valley rather than taking the high ground.
The line of Wansdyke is not remotely straight – Wansdyke East – Prehistoric Canals
But these wild undulations into valleys also cause problems for my hypothesis as a canal. For example, how could a canal move up and down significant gradients without locks?
Well, the answer is that they can’t – but the solution to this problem is in detail, for if you look again at this part of Wansdyke going into an old dry river valley, you see something archaeologists miss – it stops!!
We also saw this from the transition from Section 1 to Section 2 of Wansdyke. The second was a gap, which looked like a piece filled in by farming; there were two other gaps; the first was a later road cutting through and then a railway doing the same.
Gap number Two in Wansdyke – Wansdyke East – Prehistoric CanalsMesolithic Water Levels again fills the gap – Wansdyke East – Prehistoric Canals
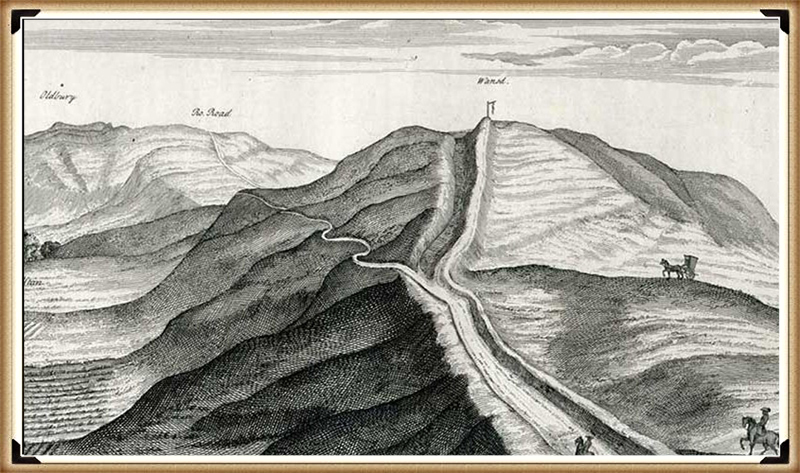
The Dry River Valley aspect of this part of the canal comes with a massive gradient – if it went to the valley’s bottom, it would make moving a boat very difficult. But we see on LiDAR evidence of the Dyke stopping before reaching the bottom. This is because, at some point in the past, this dry river valley in prehistoric times would not be ‘dry’ but full of water, as shown in the illustration (Fig.49)
This would make sense to the termination on the right as it would initially end at the river’s shoreline. If this was the case, the simple answer to the problem is that at that point, you took the boat across the river, so the gradients of the Dyke in the Mesolithic were small.
But why is there a continuation (bank) of the Dyke down the valley?
This can best be answered by understanding what happened to this earthwork once the waters started to fall in the Neolithic Period.
Logically, as the waters fell, the ditch would have been extended to meet the lower water level until the slope was too extreme to continue and was abandoned. Later once the river had completely dried up (and consequently the rest of the Dyke as the water table would have universally fallen), the natural road (the bank of the Dyke) would be used as a road.
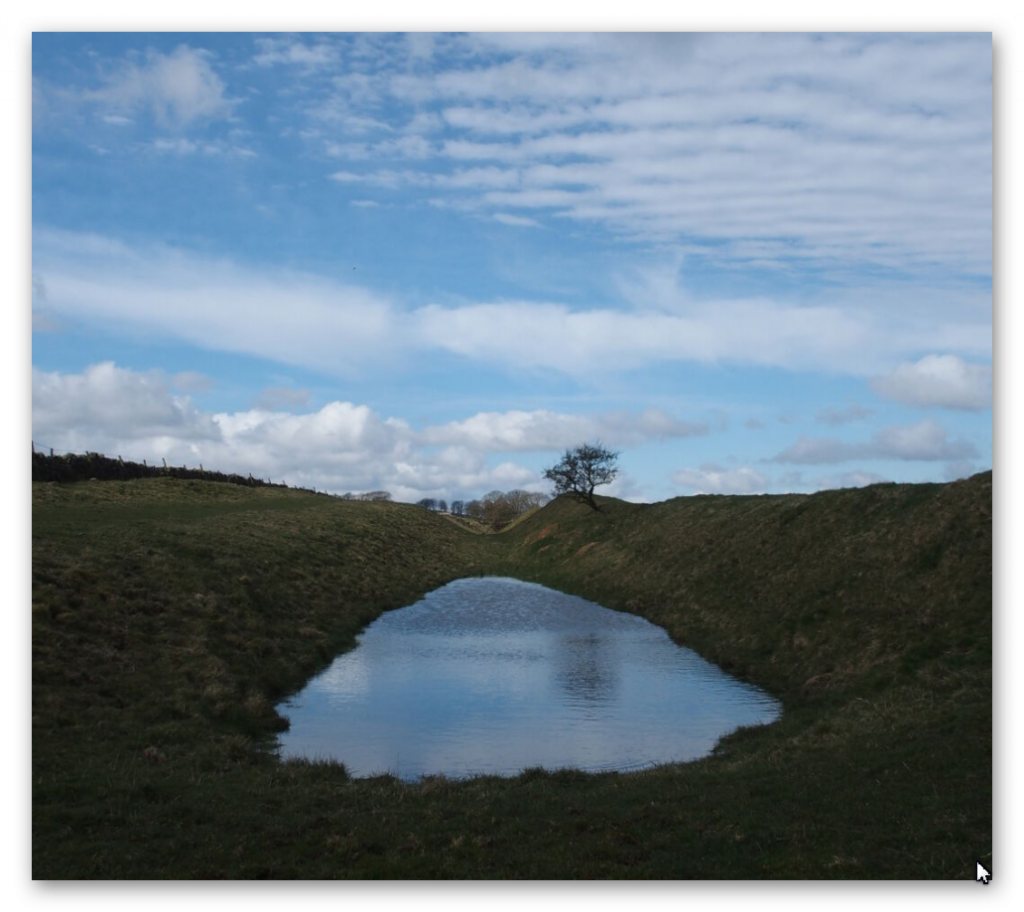
Excavations of similar aspects of Dykes have shown that the bank reduced in height and became flattered like a road and hence more comprehensive. To use this road permanently, the builders adapted the dry river valley element (which would still be boggy for many centuries after the river disappeared) by adding to the bank by removing soil from the ground – but on both sides, making the ditch element smaller and more shallow than the rest of the Dyke and to both sides.
The result of this work looks like a loss of the deep ditch but is more likely a change in its structure – which is seen clearly on parts excavated in other Dykes but impossible to see here without excavation.
Long Barrow
An interesting associated feature can be found just 200m south of Wansdyke Section 2 – A Long Barrow.
“The monument includes a long barrow set above the floor of a dry valley in an area of gently undulating chalk downland. The barrow mound is ovate and orientated east-west. It is 40m long, 27m wide and stands to a maximum height of 3.5m. Flanking the barrow mound to the north and south are ditches from which the material used to form the mound was quarried during the construction of the monument. These survive as earthworks 8m wide and 1m deep” – Historic England
What should be noted is it’s ON THE SHORELINE of the ‘Dry River Valley’ as shown from the suggested water level in our illustration. This is reflected by the ‘track’ (dyke) that connects the shoreline to the main Wansdyke Canal. So are we seeing the Dyke being used at a later date to take the bones of the dead from a reincarnation site to the Long Barrow?
This confirms the river levels at the time of construction and the previously speculated gap in Wansdyke by the river valley top.
Flint Pits
Again, as shown in the previous section (1), another interesting feature near the Dyke is the ‘Old Flint Pits’ as a feature on the 1886 edition of the OS map but not recorded by the Historic Monuments Dept.
90-degree bend
Another strange and bewildering feature in this section is the 90-degree bend on the Dyke.
This ‘kink’ confirms that Wansdyke was never built as either a Defensive wall or Boundary marker. As if it was a defensive feature, it would not have a ‘gently rounded ditch – it would be square like a castle. If it were just a marker, it would cut across the flat landscape – as it is more work to create such a turning for no reason.
The only logical reason for such an engineering feature is that it was added later when the Water Levels dropped in the Neolithic to follow the landscape topology.
Epilogue
Unveiling the True Purpose of Britain’s Largest Linear Earthworks
The recent publication of three Lidar investigations into Offa’s Dyke, Wansdyke, and The Vallum at Hadrian’s Wall has revealed that these structures were built in areas affluent in quarrying and mineral extraction. Archaeologists have overlooked mainly this critical aspect until now.
The likelihood that these earthworks were used to transport materials to rivers for trading is compelling. Moreover, the possibility that they were initially constructed as transport routes for boats during the Mesolithic period, with quarries developing around this infrastructure later, is an intriguing hypothesis that deserves attention.
As we continue to study these ancient linear earthworks with advanced landscape tools like Lidar, we can expect this timeline to become more apparent. What is undeniable is that the old myths of these structures being solely fortifications or boundary markers are complete fiction. While they may have been used as such after their original construction, their primary purpose was much more complex and integral to early trade and transportation networks.
This new understanding challenges long-held beliefs and opens exciting avenues for future research into these remarkable earthworks’ true history and function.
Results from the LiDAR investigations
Wansdyke
With meticulous precision, our investigations have set out to unravel the intricacies enshrouding Wansdyke, delving boldly into the heart of its historical narrative. In so doing, it dares to challenge the archaic views, which have rendered Wansdyke a mere defensive ditch or a boundary marker of the Saxon age. However, a discerning eye reveals that these notions lack the bedrock of objective evidence, for they rely merely on a handful of carbon dates, a commonplace in the annals of sites from that period.
Yet, the gaps within this enigmatic earthwork beckon us to embark on an exploratory journey that hints at the presence of something else entirely – the possibility of water coursing through these river valleys. We dare to propose that these ditches were not mere boundaries but ingeniously designed moated canals, where boats once plied as a means of transport, an ideal mode of travel within a water-rich landscape.
Though our current knowledge may fall short of unearthing all the answers, the profound excavations led by Pitt Rivers present a tantalising glimpse, revealing that water once flowed through these ditches. And the Romans themselves, much later, saw fit to repurpose these canals, affirming their practicality and utility in the annals of history.
The advent of LiDAR has unfurled before us an unprecedented vista, affording a sweeping survey of over 1500 Scheduled Dykes throughout Britain. In the luminous wake of this technology, a compelling story unfolds, hinting at Wansdyke’s Mesolithic origins, challenging established beliefs, and unveiling its construction during a period of abundant river levels, a time far more distant than previously perceived.
With their customary flair for adaptation, the Romans likely reworked sections of Wansdyke, leaving behind a more cohesive structure than its counterparts. The Vallum by Hadrian’s Wall and Offa’s Dyke bear the indelible marks of their prehistoric origins, standing as testaments to the Romans’ quarrying and stone-delivery endeavours.
Yet, we venture further into the mists of history, exploring prehistoric mining, the significance of quarried materials, and their vital role in facilitating trade – not just within Britain’s borders but beyond, crisscrossing the conflation of Europe. This revelation dispels earlier scepticism and shines a light on the sophisticated network of international trade that flowed with the currents of time, enriching Wansdyke’s profound legacy as a conduit of a vibrant and interconnected ancient civilisation.
The veil of uncertainty still shrouds the origins of West Wansdyke in a cloak of ambiguity. While the passage of time has not yet delivered a definitive date, the prevailing narrative, tethered to a carbon dating of 1500 BCE, finds itself juxtaposed against emerging evidence. This evidence, born of meticulous inquiry, casts shadows of doubt upon the established chronology and beckons us to reevaluate our understanding.
In the chronicles of academia, where scepticism is both a guardian of rigour and a hurdle to innovation, the seeds of inquiry were sown some fifteen years ago. The publication that dared to challenge convention and present a different perspective on West Wansdyke stirred a tempest within the academic community. Accusations of ‘pseudoscience’ echoed like distant thunder, casting a shadow over the revelations that dared to dissent.
Yet, the march of progress is often fueled by the fervour of inquiry and the evolution of knowledge. Archaeologists, driven by a relentless pursuit of truth, have not shied away from the fray. In an embrace of scientific discovery, new dating evidence has emerged—a beacon of revelation that punctures the shroud of scepticism that once enshrouded the discourse.
Carbon dating, that time-traveller’s tool that peers into the past through the lens of isotopes, has yielded results that lend credence to the suspicions germinating in the fertile soil of curiosity. LiDAR, with its laser-guided gaze, has unveiled hidden landscapes and confirmed the prehistoric existence of canals—ancient pathways etched into the earth by the hands of civilisations long past.
As we stand at this juncture, it is not merely the story of West Wansdyke that unfolds before us; it is a testament to the evolution of thought and the malleability of understanding. The ‘pseudoscience’ that once raised eyebrows now stands vindicated—a reminder that the boundaries of knowledge are ever-shifting, ever-expanding, yielding to the tenacity of those who dare to question.
In the grand theatre of history, where narratives are woven from threads of evidence and conjecture, the tale of West Wansdyke takes centre stage. It serves as a reminder that even the most firmly established edifices of understanding can be reshaped by the currents of new insight. The academic stir that was ignited by dissenting revelations has matured into a symphony of acceptance—a harmonious acknowledgement that the pursuit of knowledge, however tumultuous, is the essence of scholarly endeavour.
As we navigate the twists and turns of this historical journey, we honour the legacy of those who dared to defy convention, the archaeologists who continued to dig beneath the surface, and the spirit of inquiry that animates the quest for truth. In this narrative, West Wansdyke emerges not just as a physical structure of the past, but as a symbol of the human spirit’s unyielding march toward comprehension—a testament that even in the face of scepticism, the pursuit of understanding remains an unwavering beacon of progress.
Consequently, in the HE publication ‘Prehistoric Linear Boundary Earthworks: Introductions to Heritage Assets. Swindon. Historic England 2018’.
The archaeologists confess that “Some of the earliest (Dykes) seem to date to the later Neolithic period: on Ebberston Common, the latest sequence of at least six pit alignments appears to predate the construction of a round barrow which would typically date to the earlier Bronze Age, around 2000 BC. “(see Page Fig.87. Page 151 for full quotation).
And as a consequence of their endeavours now are happy to plush a timeline of Dyke construction, vindicating my original work and allowing us to date West Wansdyke from my research on water levels in the prehistoric from the middle Mesolithic to the Bronze Age.
Hadrian’s Wall – The Vallum
Our Findings
Before we reflect on our findings Section by Section, It may be beneficial to look at the total statistics for some aspects of Hadrian’s Wall, as such details have not been found in our research on this subject.
Vallum
Total length found: 73,812m (45.86 miles) – 62% of the entire wall length
Total length missing: 40,075m (24.90 miles) – 35% of the Vallum length
The total length of Vellum 113,887m (70.77 miles)
In comparison, Hadrian’s Wall is reported as 80 Roman miles or 73 standard miles in length.
Within the 70.77 miles of the Vallum, we have identified – within 200m of the construction:
46 Springs (as specified by the 1800 OS maps series)
54 Quarries
14 Prehistoric Ancient sites
To judge if the frequency of these objects are standard or an anomaly of the Vallum – we have measured two roughly parallel lines to the Vallum, one 5 miles to the north and the other to the south, so still conforming to a similar environment and then counted the frequency of these objects that are also within 200m of the experimental map lines:
Northern Test line
12 Springs
25 Quarries
1 Ancient site
Southern Test Line
10 Springs
30 Quarries
3 Ancient Sites
Consequently, we can now judge the Vallum path against our map test lines:
10 v 46 Springs – Vallum has 460% more Springs
30 v 54 Quarries – Vallum has 180% more Quarries
14 v 2 Ancient Sites – Vallum has 700% more sites
With these fantastic statistics in mind, we can now take a detailed look at the LiDAR investigations, starting with Section A, where we find that the Vallum ends some distance before the end of the Wall on the Bowness-on-Solway coast.
This terminus seems to be at a point of a Paleochannel/Dyke that turns and heads south overland, which has no connection to the Wall. This Section shows that the Wall was built at an inappropriate distance from the current river to be defensive – as attackers would be free to land and muster.
The LiDAR map shows the likelihood that the river was higher in the Roman period and that the Wall was built on its shoreline, making it a much more secure feature. This raised water level would suggest that the Paleochannel was full of water and was used to link into the Vallum as a canal feature.
Section B, shows that the Vallum was in this area (sections A & B) as short-run (2.6 miles) and not continuous. The terminal point to the east of this run again is in a river valley, which was again higher than today at the time of Roman occupation, allowing boats to enter and exit from the river Esk to supply or deliver Stone to the Wall as there is an absence of the suggested ‘Military Way’ that was supposed to be constructed for this purpose.
We will not see any signs of the Military Way (see case study) for the next 24.2km, indicating that the Vallum was the primary source of supply and communication.
Section C, demonstrates that the Vallum disappears for 2.6 miles on the LiDAR map. No excavation evidence shows it was below the surface; we can only conclude that it did not exist in this Section. This questions the old theory about the Vallum being constructed as a defence structure either before the Wall was built or after to defend the south flank – as attackers could just walk around it?
This Section also offers further support to the higher water table at the time of the Wall’s construction as it seems to bend around the shorelines of these higher river levels, which otherwise make no engineering or defensive sense?
Sections D and E, illustrate the raised water levels of prehistory and, consequently, the path of the Wall and Vallum, which in places (such as in the River Eden) disappears, indicating that the Vallum was probably constructed on an existing ‘Dyke’ and enlarged for their purposes?
Sections F, G and H show the first signs of the Roman Road called Stanegate (see case study). The Vallum again is broken in its course by the river valleys in this area, eradicating any evidence of its existence. It also shows that the Vallum headed towards river valleys rather than avoiding them, which again would suggest these were earlier prehistoric features that were reused.
Vallum – was once a series of prehistoric dykes which were recut and extended to deliver supplies and stone to the Wall.
Stanegate – does not exist as a road but has a river connection to the first five sites.
Military Way – Does not exist as an independent road(way) but is observable in areas not covered by the Vallum.
The Antonine Wall – was once a series of Dykes that was reconnect together and recut.
Offa’s Dyke
The Total length of Offa’s Dyke (including gaps and missing sections) 279,745m (173.8 miles)
Total length Found (by LiDAR): 95,044m (59.2 miles) – 34% of the entire length
Total length Missing (by LiDAR): 185,476m (114.6 miles) – 66% of the entire length
Total number of Gaps in the Offa’s Dyke – 70
Total number of Scheduled Monuments in Listing: 237
Features
Within the 59.2 miles of Offa’s Dyke, we have identified – within 200m of the construction:
118 (33 Natural Springs)/Wells/Ponds (as specified by the 1800 OS maps series – Wells and Ponds included to show high water table)
303 Quarries/Bell Pits (Bell Pits Ancient Quarry Holes) ave of 5 Quarries per mile of Dyke
12 Prehistoric Ancient Sites
4 Barrows
7 Roman Sites
52% of Sections are linked to each other
20% of Sections are connected to existing rivers
28% of Sections join Paleochannels
Summary
Section A – Total 20,201m. 14 Gaps – 6,758m missing (34%)
Section B – Total 110,545m. 10 Gaps – 106,768 missing (97%)
Section C – Total 55,905m. 17 Gaps – 7,990 missing (14%)
Section D – Total 56,369m. 22 Gaps – 29,848 missing (53%)
Section E – Total 36,725m. 7 Gaps – 33,101 missing (90%)
Our findings concluded that these landscape features are much more exciting and complex than the archaeologists currently imagine, as each Section has its interest that finally gives us a solution to the construction and functionality of the Dyke.
Section A – Runs around the hills surrounding Chepstow and the River Wye. This Dyke is no boundary or marker as the river would be a better solution to both causes. But what it does show is the connection to Quarries and Roman Roads that would have probably linked to the canal system it inherited from the ancient Dyke builders. These ‘linear earthworks’ were created to assist in trade during both prehistory and later Roman era until the canals dried up when the roads built upon the banks of these Dykes replaced the method of transport.
Section B – Shows why the Dyke is not interconnected, as 97% of it is missing, and there is not functionality or design that links together the small portions of Dyke that is in this Section.
Section C – Has the least missing sections, yet it still has 14% missing with 17 gaps, indicating that these Dykes are a series of individual trading canals and not a single entity. This trading can be seen in the extensive quarries in this area, which have been mined for their mineral wealth for thousands of years.
Each hill has a different design from the last regarding width and Depth of the Ditch. What we are seeing is a degree of uniformity in access to quarries and water sources, and natural springs along the Dyke.
Section D – This is a 50/50 series of Dyke to gap ratio, again showing that it is connected to Quarries and Mining, particularly Coal Mining, which the Romans widely used. These are some of the largest coal mines in Britain. The Dyke does not just come close – it in some cases the alignment goes through the middle of these quarries, with on average four quarries per Section which makes any suggestion that these Dykes were not used in conjunction with the minerals being extracted (as we see also in The Vallum at Hadrian’s Wall) and were constructed for another purpose as completely absurd.
Section E – Even archaeologists (including Fox) now admit that this is a different series of Dykes (Whitford Dyke) and not part of Offa’s Dyke as it’s too dysfunctional.
So, our conclusion about Offa’s Dyke is that we are looking at a series of working Dykes – initially built in prehistoric times and then utilised (as again we found in The Vallum) by the Romans to service the same Quarries for trading purposes.
In particular, we see this Roman influence in Section D as these are Coal minerals, which we know they used to heat the hypocaust underfloor furnaces of their Bath and home houses, which to date, archaeologists have failed to investigate the sources of this coal and how it was transported.
– Wansdyke East – Prehistoric Canals
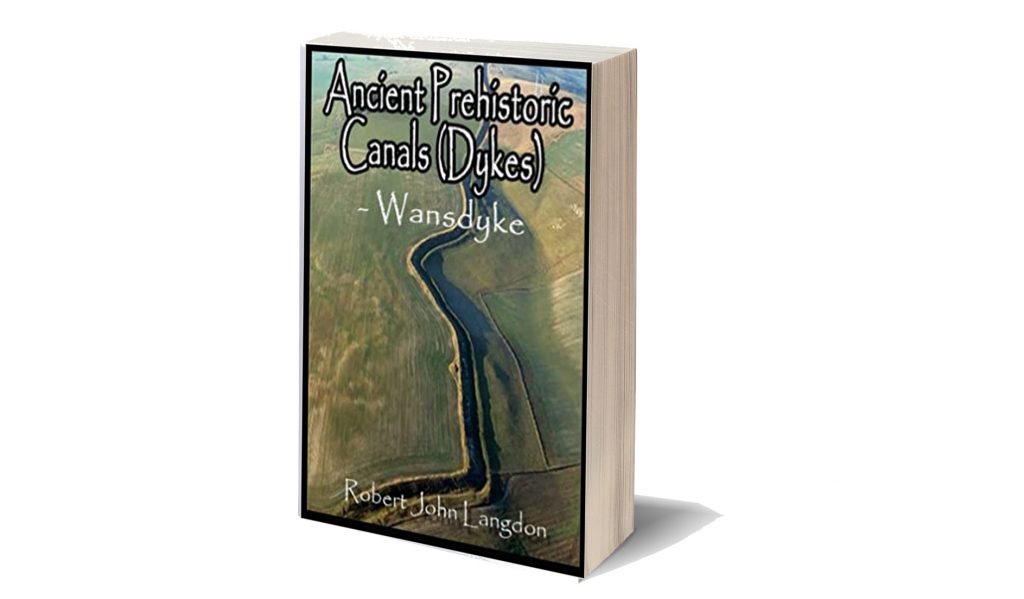
This was an extracts from the NEW Book Ancient Prehistoric Canals (Dykes) – Wansdyke available on Amazon as a FULL COLOUR HARD BACK (£19.95) or a ECONOMY (£4.99) SOFTBACK black and white VERSION – it is also available as a KINDLE (£1.99) book. For further information about our work on Prehistoric Britain visit our WEBSITE or VIDEO CHANNEL.
Book details
ASIN : B0BF31GQKC
Publisher : Independently published (18 Sept. 2022)
Robert John Langdon, a polymathic luminary, emerges as a writer, historian, and eminent specialist in LiDAR Landscape Archaeology.
His intellectual voyage has interwoven with stints as an astute scrutineer for governmental realms and grand corporate bastions, a tapestry spanning British Telecommunications, Cable and Wireless, British Gas, and the esteemed University of London.
A decade hence, Robert’s transition into retirement unfurled a chapter of insatiable curiosity. This phase saw him immerse himself in Politics, Archaeology, Philosophy, and the enigmatic realm of Quantum Mechanics. His academic odyssey traversed the venerable corridors of knowledge hubs such as the Museum of London, University College London, Birkbeck College, The City Literature Institute, and Chichester University.
In the symphony of his life, Robert is a custodian of three progeny and a pair of cherished grandchildren. His sanctuary lies ensconced in the embrace of West Wales, where he inhabits an isolated cottage, its windows framing a vista of the boundless sea – a retreat from the scrutinous gaze of the Her Majesty’s Revenue and Customs, an amiable clandestinity in the lap of nature’s embrace.
Exploring Prehistoric Britain: A Journey Through Time
My blog delves into the fascinating mysteries of prehistoric Britain, challenging conventional narratives and offering fresh perspectives based on cutting-edge research, particularly using LiDAR technology. I invite you to explore some key areas of my research. For example, the Wansdyke, often cited as a defensive structure, is re-examined in light of new evidence. I’ve presented my findings in my blog post Wansdyke: A British Frontier Wall – ‘Debunked’, and aWansdyke LiDAR Flyover video further visualizes my conclusions.
For those interested in British Prehistory, visit www.prehistoric-britain.co.uk, a comprehensive resource featuring an extensive collection of archaeology articles, modern LiDAR investigations, and groundbreaking research. The site also includes insights and extracts from the acclaimed Robert John Langdon Trilogy, a series of books exploring Britain during the Prehistoric period. Titles in the trilogy include The Stonehenge Enigma, Dawn of the Lost Civilisation, and The Post Glacial Flooding Hypothesis, offering compelling evidence about ancient landscapes shaped by post-glacial flooding.
To further explore these topics, Robert John Langdon has developed a dedicated YouTube channel featuring over 100 video documentaries and investigations that complement the trilogy. Notable discoveries and studies showcased on the channel include 13 Things that Don’t Make Sense in History and the revelation of Silbury Avenue – The Lost Stone Avenue, a rediscovered prehistoric feature at Avebury, Wiltshire.
In addition to his main works, Langdon has released a series of shorter, accessible publications, ideal for readers delving into specific topics. These include:
For active discussions and updates on the trilogy’s findings and recent LiDAR investigations, join our vibrant community on Facebook. Engage with like-minded enthusiasts by leaving a message or contributing to debates in our Facebook Group.
Whether through the books, the website, or interactive videos, we aim to provide a deeper understanding of Britain’s fascinating prehistoric past. We encourage you to explore these resources and uncover the mysteries of ancient landscapes through the lens of modern archaeology.
For more information, including chapter extracts and related publications, visit the Robert John Langdon Author Page. Dive into works such as The Stonehenge Enigma or Dawn of the Lost Civilisation, and explore cutting-edge theories that challenge traditional historical narratives.
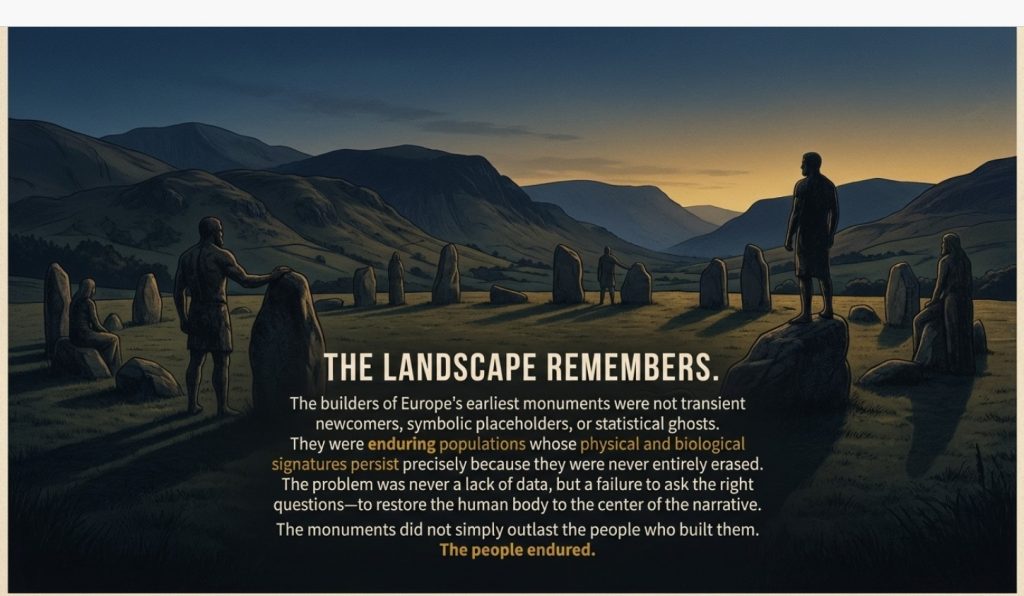
The problem with prehistoric archaeology is not a lack of data. It is a failure to ask the right questions.
For over a century, monuments such as Stonehenge, Avebury, and the great long barrows of Britain have been explained using labels: Neolithic, Beaker, Bronze Age, Western Hunter-Gatherer, Steppe ancestry. These terms sound authoritative, but they often function as placeholders rather than explanations. They tell us when something is assumed to belong — not who built it, how it was built, or whether the proposed builders were physically capable of the task.
This article is not about mythical “giants,” nor is it an exercise in sensationalism. The word itself is misleading and has done more harm than good. The real issue is human scale.
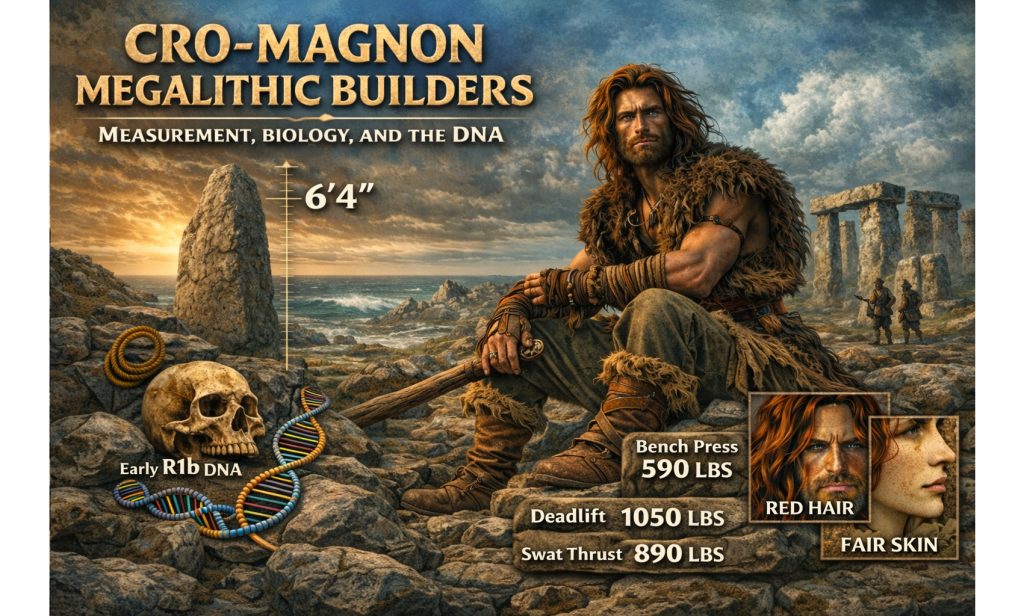
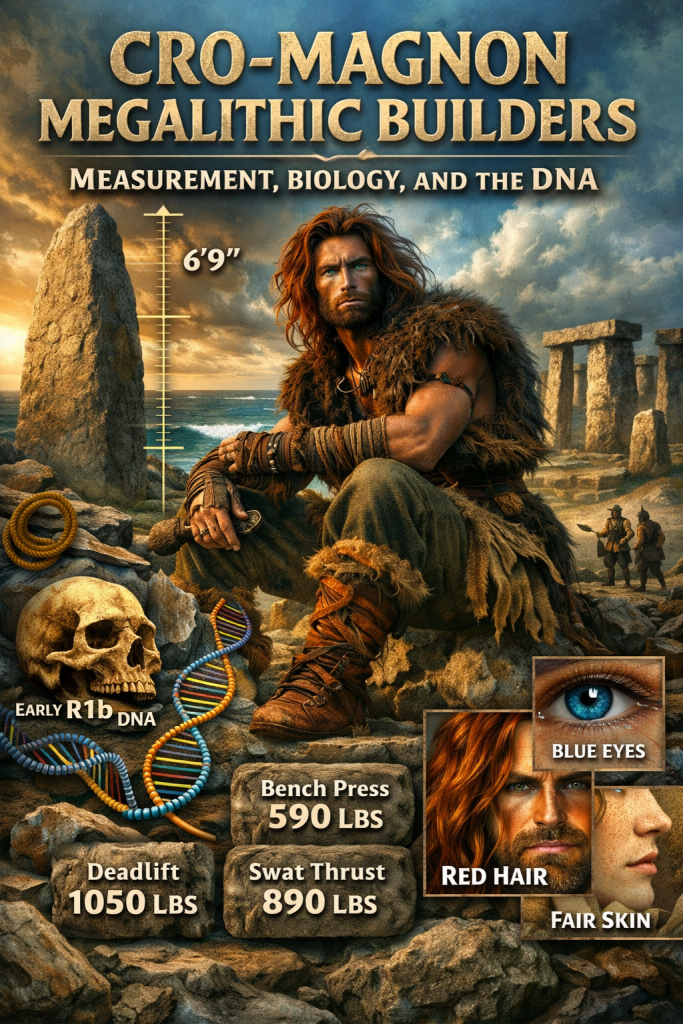
Cro-Magnon Megalithic Builders: Measurement, Biology, and the DNA
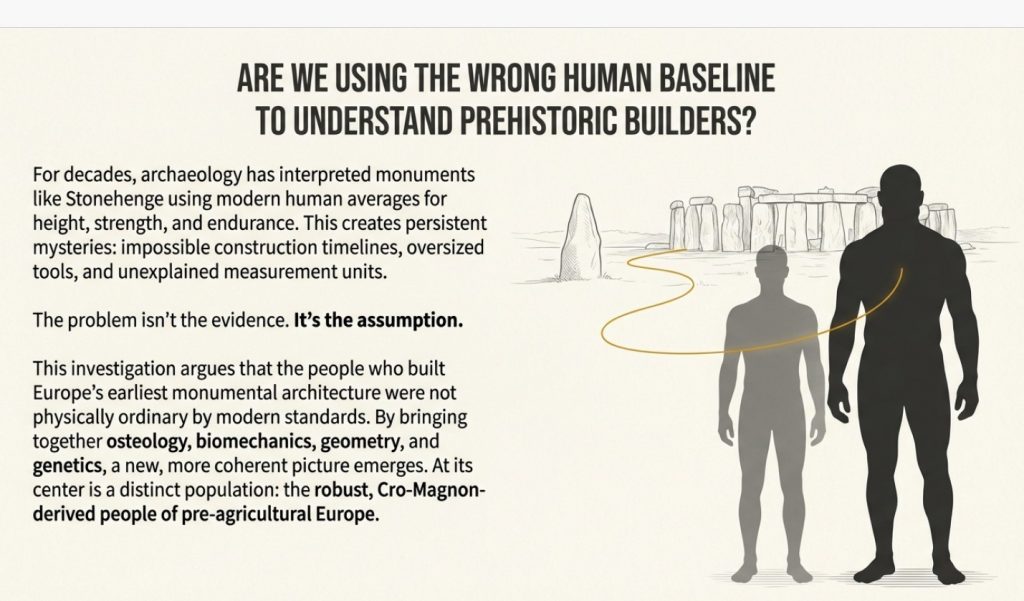
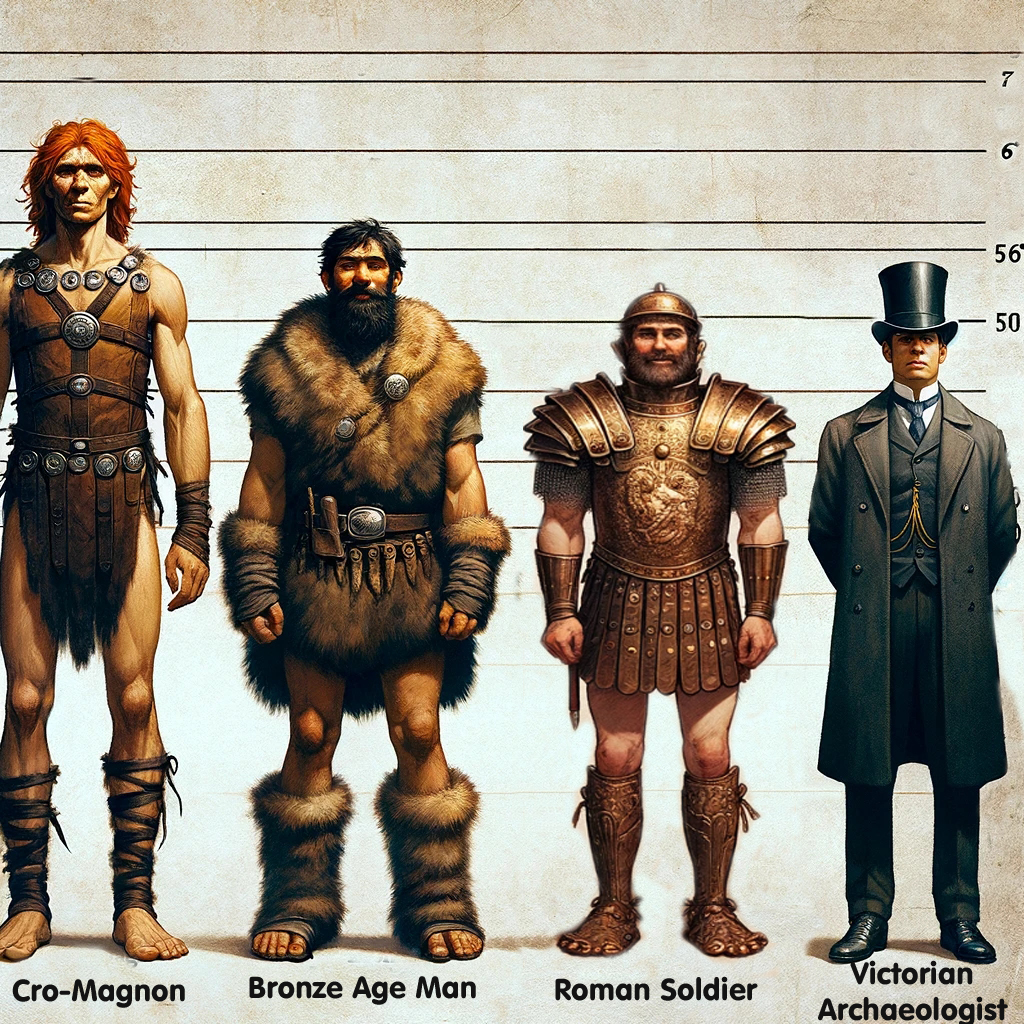
Archaeology routinely interprets prehistoric monuments using modern human averages: modern height, modern strength, modern endurance, modern tools, modern landscapes. Yet the physical evidence increasingly shows that the people who built Europe’s earliest monumental architecture were not physically ordinary by modern standards. They were taller, more robust, stronger, and cognitively adapted to a world very different from our own.
Once that fact is acknowledged, a series of long-standing problems begins to resolve themselves:
why monument construction timelines seem impossibly long
why antler-pick explanations fail repeatedly
why tool sizes appear “oversized”
why step-based measurement systems emerge so cleanly
why long barrows contain long-skulled individuals
why later farming populations reuse, rather than originate, these sites
The question, therefore, is not “Were these people giants?” It is:
Are modern humans the wrong baseline for understanding prehistoric builders?
This blog argues that they are.
By bringing together osteology, cranial morphology, tool ergonomics, biomechanics, embodied measurement, hydrology, and palaeogeography, a coherent picture emerges—one that archaeology has partially documented, occasionally acknowledged, but never fully integrated.
At the centre of that picture are Cro-Magnon–derived populations, rooted in the lost landscapes of northern Europe, whose physical characteristics match the monuments they left behind.
What follows is not speculation. It is a reconstruction based on bodies, tools, geometry, and landscapes — the things that do not recalibrate, relabel, or quietly disappear when theories change.
Cro-Magnon Megalithic Builders: Measurement, Biology, and the DNA
2. Cro-Magnon ≠ Modern Human — Why Physiology Matters
One of the most persistent errors in prehistoric interpretation is the quiet assumption that all humans in the past were physically equivalent to us. This assumption is rarely stated outright, but it underpins almost every reconstruction: tool use, labour estimates, monument building rates, and even cognitive expectations.
The physical evidence does not support it.
Upper Palaeolithic and early Mesolithic populations traditionally grouped under the term Cro-Magnon display a suite of anatomical traits that consistently diverge from later agricultural populations and from modern post-industrial humans.
These differences are not marginal.
They include:
Greater average stature, particularly among males
More robust skeletal frames, with thicker cortical bone
Broader shoulders and longer limb proportions
Higher muscle attachment development, indicating sustained heavy loading
Larger average cranial capacity than modern Homo sapiens sapiens
Taken together, these traits describe a population adapted to high-energy expenditure, long-distance movement, and physically demanding tasks carried out over generations.
This is not surprising. Cro-Magnon populations lived in environments characterised by:
cold or unstable climates
protein-rich diets dominated by hunting, fishing, and aquatic resources
constant mobility across large landscapes
minimal reliance on agriculture or sedentary storage
In evolutionary terms, this favours size, strength, and endurance rather than reduction.
These patterns are well documented in Upper Palaeolithic and early Mesolithic osteological studies (e.g. Ruff 1994; Larsen 1995).
Cro-Magnon Megalithic Builders: Measurement, Biology, and the DNA
Agriculture Changed Bodies — It Did Not Improve Them
A crucial point often glossed over is that the transition to agriculture reduced human size and robustness, rather than enhancing it.
This is well established in bioarchaeology:
average stature declines after the adoption of farming
skeletal stress markers increase
nutritional diversity decreases
cranial capacity trends downward over time
These changes reflect dietary narrowing, increased disease load, and reduced physical demands, not biological advancement.
Later Neolithic and Bronze Age farming populations were not “better” versions of their predecessors — they were adapted to a different, more constrained way of life.
Using their bodies as the baseline for interpreting earlier monuments is, therefore, methodologically unsound.
Why This Matters for Monument Builders
If the builders of megalithic structures were:
taller
stronger
more robust
cognitively adapted to spatial and mechanical tasks
then many features that appear “mysterious” under modern assumptions become entirely reasonable:
oversized tools cease to be anomalous
heavy labour becomes sustainable
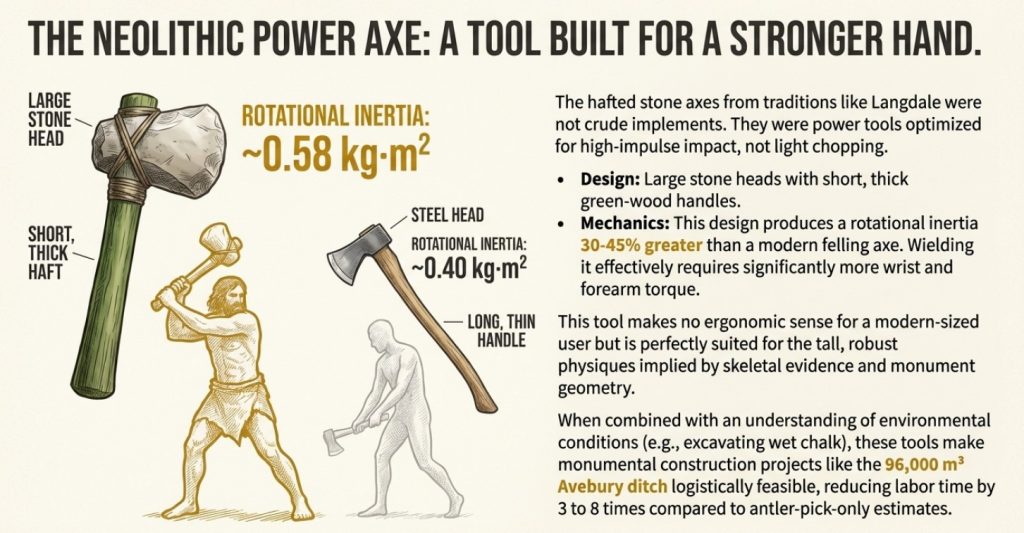
short, thick tool handles make ergonomic sense
step-based measurement systems become precise, not crude
construction timelines shrink dramatically
The monuments do not demand mythical strength. They demand pre-agricultural bodies.
The Error of Compression
Modern archaeology tends to compress tens of thousands of years of biological change into a single category: modern humans.
That compression is administratively convenient, but scientifically inaccurate.
Cro-Magnon populations were human, but they were not physically modern in the way we are. Their bodies reflect a different ecological niche, one that vanished as agriculture, sedentism, and later population influxes reshaped Europe.
Understanding who built the megaliths begins with accepting that their bodies were not our bodies.
Everything that follows — tools, measurement, labour, and landscape use — depends on that fact.
Suitable references
Ruff, C. (1994). Morphological adaptation to climate in modern and fossil hominids. Yearbook of Physical Anthropology
Larsen, C. (1995). Biological changes in human populations with agriculture. Annual Review of Anthropology
Cro-Magnon Megalithic Builders: Measurement, Biology, and the DNA
3. The Fatal Modern Assumption: Abstract Measurement
Once prehistoric builders are quietly assumed to be physically identical to modern humans, a second assumption follows almost automatically: that they measured the world in the same abstract way that we do.
This assumption is rarely examined — yet it is foundational to how monuments are interpreted.
Modern societies measure using externalised units: rulers, tapes, rods, laser surveys, and digital grids. These systems are detached from the body. They exist precisely because bodies differ and standards must be imposed from outside.
Prehistoric societies did not work this way.
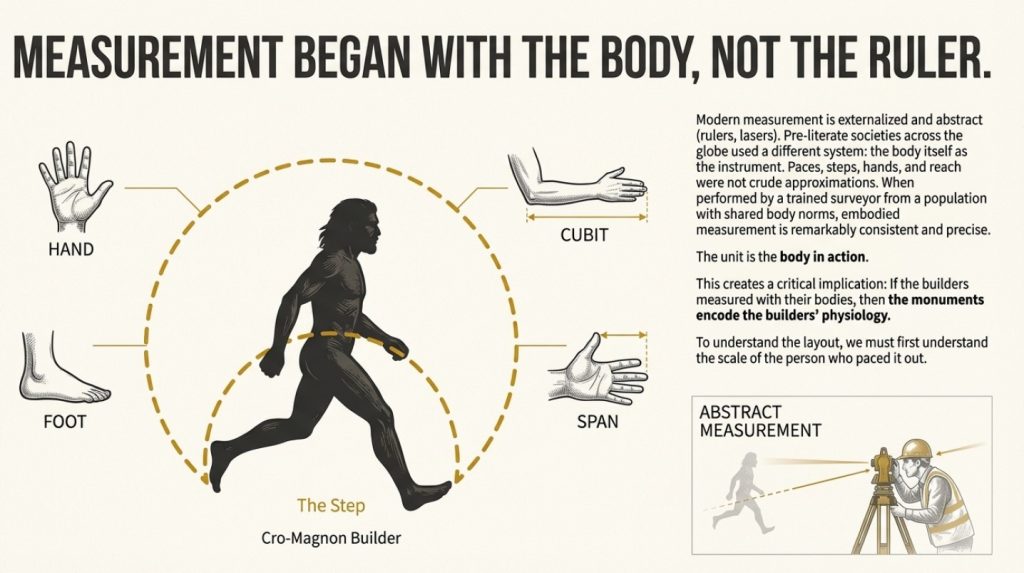
Across ethnography, archaeology, and early historical records, the same pattern appears repeatedly: measurement begins with the body.
Hands. Feet. Elbows. Paces. Steps. Reach.
These are not crude approximations. They are repeatable, trainable, and internally consistent when used by a stable population with shared body norms.
Cro-Magnon Megalithic Builders: Measurement, Biology, and the DNA
Embodied Measurement Is Not Guesswork
The idea that body-based measurement is imprecise is a modern prejudice.
In reality:
a trained surveyor can reproduce step lengths with remarkable consistency
deliberate pacing differs from casual walking
ritualised or task-based gaits are consciously controlled
repetition over short distances cancels cumulative error
This is why body-based units dominate early engineering traditions worldwide, from megalithic Europe to ancient Egypt and beyond.
The unit is not the body at rest—it is the body in action.
Body-based measurement systems are ethnographically universal in pre-literate societies (e.g. Kula 1966; Rottländer 1989).
Why This Matters for Megalithic Monuments
If prehistoric builders measured using their bodies, then the body becomes the measuring instrument.
That has immediate consequences:
monument dimensions encode the builder’s physiology
spacing reflects gait and reach, not abstraction
regularity implies training, not symbolism
precision implies repetition, not advanced mathematics
Crucially, this also means that modern bodies are the wrong tool for reverse-engineering prehistoric layouts.
A shorter, lighter, post-agricultural population will not reproduce the same results — not because the builders were mystical, but because the baseline has changed.
The Archaeological Blind Spot
Archaeology often acknowledges body-based units in passing, only to abandon them in favour of abstract explanations when patterns emerge that do not fit expectations.
When a monument resolves cleanly into a repeating unit, the assumption is often that:
it must be symbolic
or numerological
or coincidental
Rarely is the most direct explanation tested:
What if the monument is laid out in human steps — but not modern ones?
Once this question is allowed, the focus shifts from abstract numbers to human biomechanics.
That shift is essential because it prepares us to understand one of the most critical pieces of evidence in Britain: the Aubrey Holes.
Suitable references
Rottländer, R. (1989). Maß und Zahl in der Vorgeschichte
Kula, W. (1966). Measures and Men
Cro-Magnon Megalithic Builders: Measurement, Biology, and the DNA
4. The Aubrey Holes — Measurement Frozen in Geometry
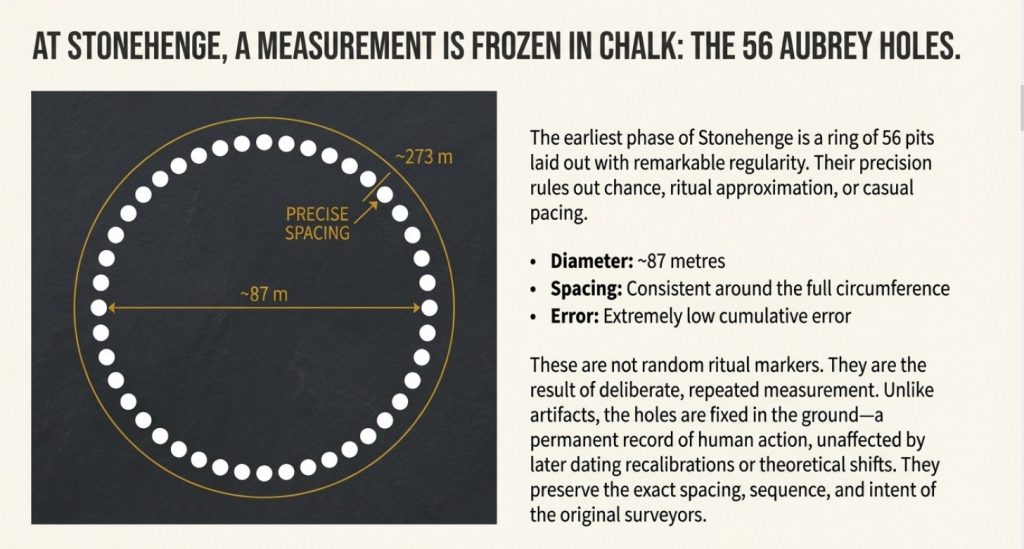
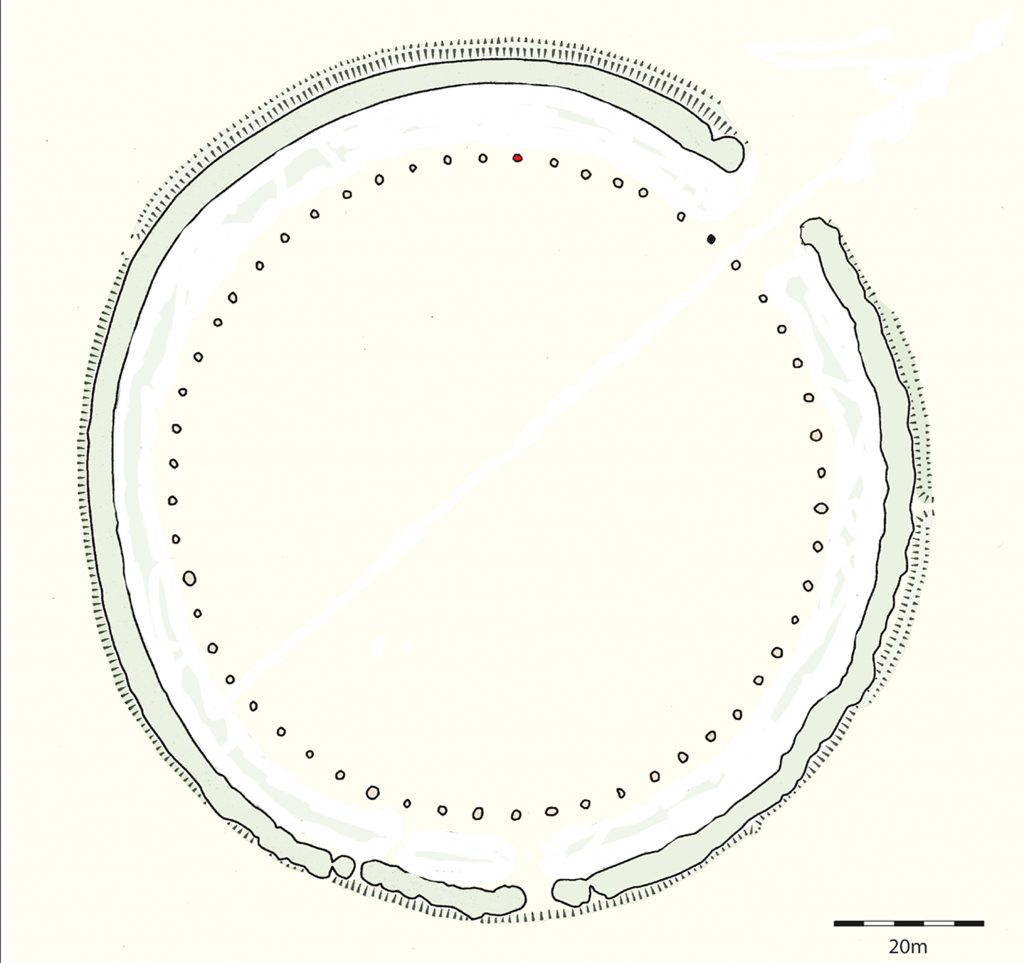
At Stonehenge, the earliest formal architectural phase is defined not by standing stones, but by a ring of 56 pits, traditionally known as the Aubrey Holes.
These features have been discussed for over three centuries, yet they remain poorly understood because they are usually treated as markers rather than as measurements.
That distinction matters.
What the Aubrey Holes Actually Are
The Aubrey Holes form a near-perfect circle approximately 87 metres in diameter, laid out with remarkable regularity given the absence of metal tools, written plans, or abstract surveying equipment.
What is often overlooked is this:
the holes are evenly spaced
the spacing is consistent around the full circumference
cumulative error is extremely low
the layout shows clear correction and control
This is not casual digging. It is deliberate, repeated measurement.
Why Random or Symbolic Explanations Fail
If the Aubrey Holes were placed symbolically, ritually, or “by eye,” we would expect:
variable spacing
drift around the circle
local clustering or correction only at the end
Instead, what we see is the opposite: controlled regularity from start to finish.
This immediately rules out:
chance placement
approximate pacing
informal alignment
Something far more disciplined is at work.
Cro-Magnon Megalithic Builders: Measurement, Biology, and the DNA
The Critical Observation: Step-Based Spacing
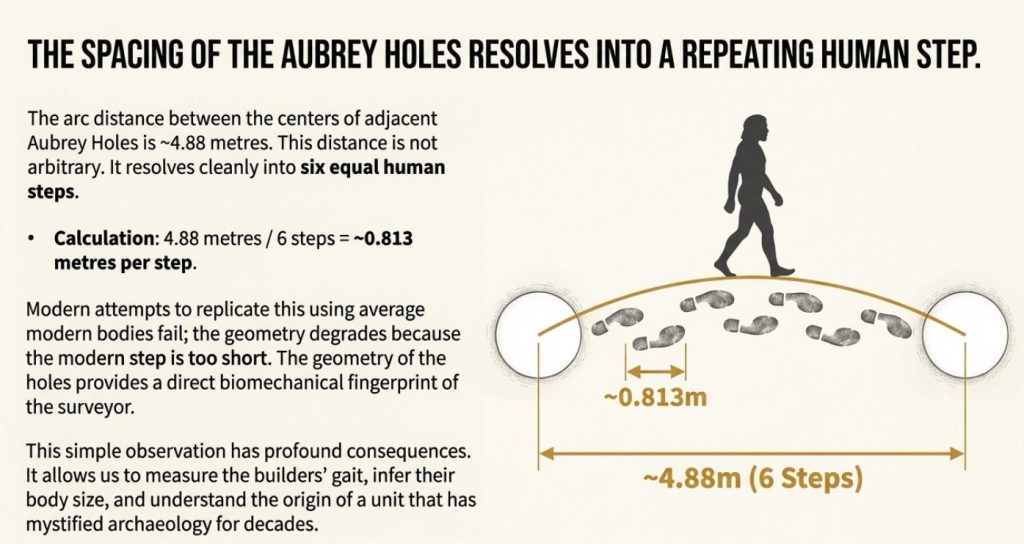
When the arc distance between adjacent Aubrey Holes is examined, it resolves cleanly into a repeating human-scale interval.
Not a rope length. Not a rod. Not an abstract unit.
A step.
More precisely:
a deliberate, trained step
repeated consistently
over dozens of placements
Once recognised, this pattern becomes difficult to ignore.
Why Modern Replication Fails
Attempts to reproduce the Aubrey Hole spacing using modern average body dimensions consistently struggle to maintain accuracy around the full circle.
The reason is simple:
modern average step length is shorter
modern gait is optimised for comfort, not measurement
modern bodies are post-agricultural and post-industrial
When the wrong body is used, the geometry degrades.
This has led many researchers to conclude — incorrectly — that the precision must be symbolic, mathematical, or coincidental.
The alternative explanation is far simpler:
The builders’ bodies were different.
Cro-Magnon Megalithic Builders: Measurement, Biology, and the DNA
The Aubrey Holes as Physical Evidence
Unlike artefacts that can be moved, redeposited, or reused, the Aubrey Holes are fixed in the ground.
They preserve:
spacing
sequence
intent
correction
They are not affected by:
radiocarbon recalibration
DNA model revision
typological fashion
In that sense, they are among the most reliable pieces of evidence at Stonehenge.
They capture human action directly — frozen into chalk.
Measurements follow the surveyed dimensions published by Atkinson (1956) and Cleal et al. (1995).
Why This Matters
If the Aubrey Holes were laid out using deliberate human steps, then:
the step length becomes measurable
the body size of the surveyor can be inferred
the origin of later “units” can be explained
the monument stops being abstract
This takes us directly to the next problem archaeology has struggled with for decades: The origin of the Megalithic Yard.
Suitable references
Atkinson, R. J. C. (1956). Stonehenge
Cleal, R., Walker, K., & Montague, R. (1995). Stonehenge in its Landscape
Cro-Magnon Megalithic Builders: Measurement, Biology, and the DNA
5. The Megalithic Yard Reframed — Not a “Mystery Unit”
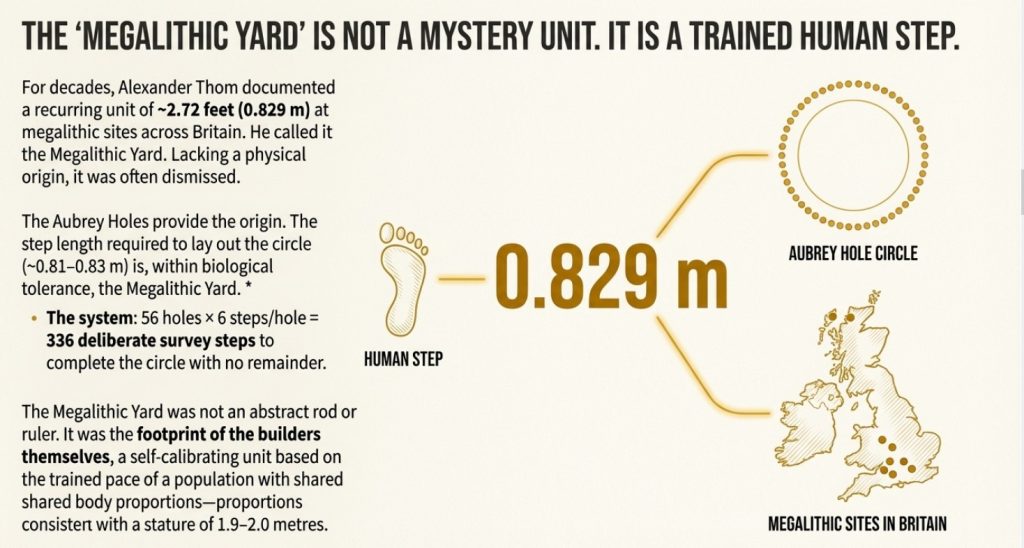
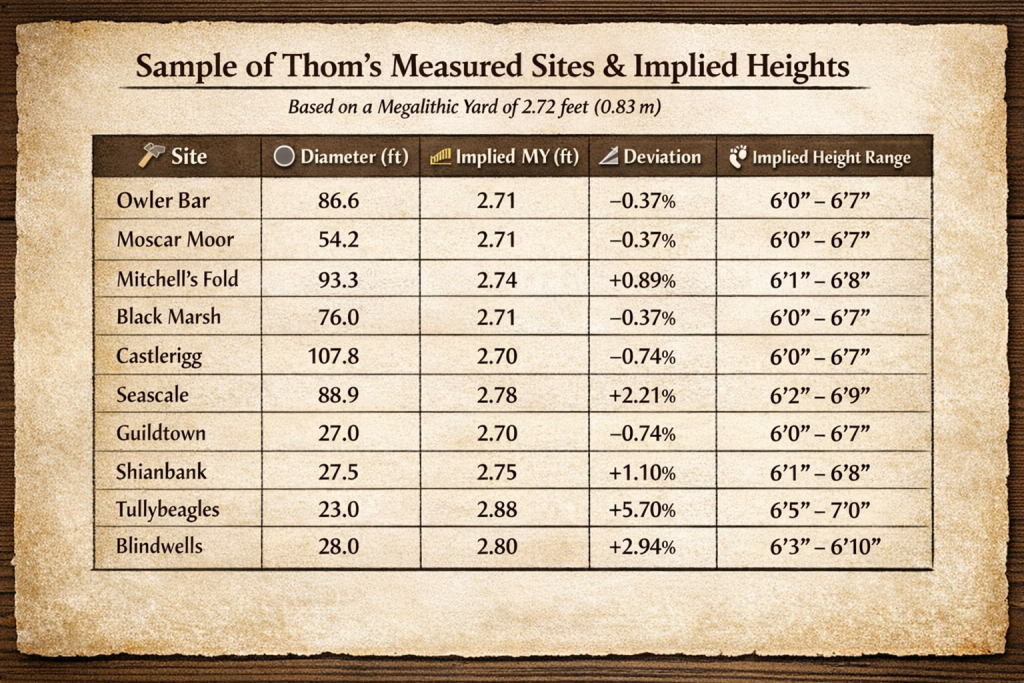
The Megalithic Yard has long been treated as an archaeological curiosity: widely measured, statistically persistent, yet conceptually uncomfortable. Alexander Thom demonstrated that a unit of approximately 2.72 feet (0.829 m) recurs across stone circles, flattened rings, ellipses, and stone rows throughout Britain and Atlantic Europe. That finding has never been seriously overturned. What Thom did not explain was where that unit originated.
The silence around its origin allowed a false assumption to harden: that the Megalithic Yard must have been an abstract standard, something equivalent to a measuring rod or conceptual unit imposed on the landscape. There is, however, no archaeological evidence for such a system. No rods, no standardised artefacts, no calibration objects, and no metrological infrastructure exist for Neolithic or early Mesolithic Britain.
What exists is physical geometry that demands a different explanation.
At Stonehenge Phase 1, the Aubrey Hole circle has a mean diameter of approximately 87.0 metres, giving a circumference of about 273.2 metres. Divided by the 56 Aubrey Holes, this produces a consistent arc spacing of roughly 4.88 metres between adjacent pits. That distance is not arbitrary. It resolves cleanly into six equal human steps, each of approximately 0.81–0.83 metres in length.
This matters because 0.82–0.83 metres is, within biological tolerance, the Megalithic Yard.
Cro-Magnon Megalithic Builders: Measurement, Biology, and the DNA
The correspondence is neither symbolic nor approximate. Six deliberate steps at ~0.82 m produce 4.92 m, six at ~0.813 m produce 4.88 m — exactly the observed spacing. Scaled around the full circle, this gives 56 × 6 = 336 deliberate survey steps, with no remainder and no cumulative drift. That level of closure cannot be produced by casual walking, visual estimation, or symbolic placement. It requires counted, deliberate pacing.
Once this is recognised, the Megalithic Yard stops being an abstract unit and becomes something far simpler: a trained human step.
Alexander Thom’s measurements (Thom 1967; Thom 1978)…
This also explains why Thom’s unit appears so consistently, despite the absence of physical standards. A paced step does not require rods or artefacts. It is self-calibrating within a population that shares similar body proportions and is trained to pace deliberately rather than walk casually. Minor local variation is expected, but large-scale coherence is preserved — exactly what Thom observed.
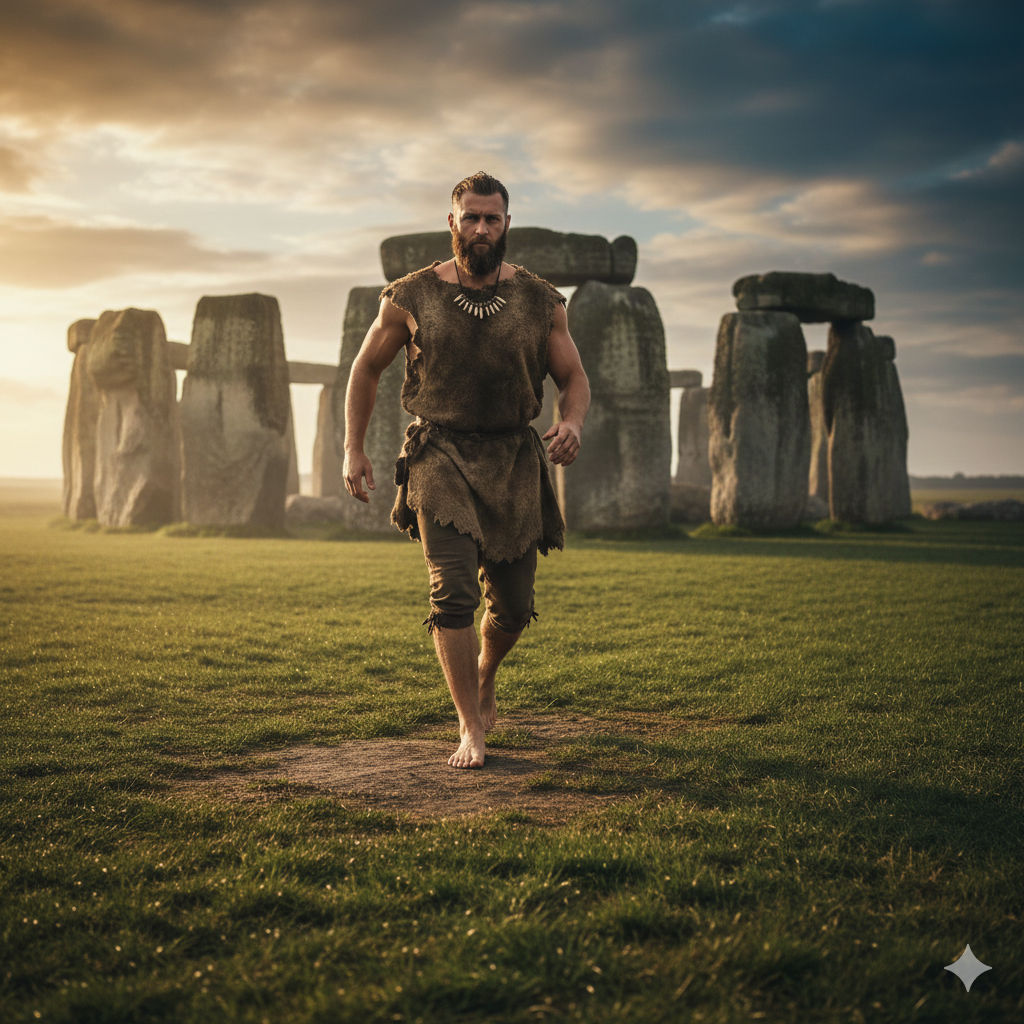
Biomechanics reinforces this interpretation. Deliberate survey steps are longer and more repeatable than everyday walking gait, typically scaling to about 42–45% of stature. The step length implied by the Aubrey Hole geometry therefore points to individuals in the 1.9–2.0 metre range, consistent with the robust, pre-agricultural bodies already documented osteologically. When modern average bodies are used, the geometry fails; spacing errors accumulate, and the circle degrades. The problem is not intelligence or technique — it is the wrong physiology.
Seen in this light, the Megalithic Yard does not represent lost mathematics or mysterious knowledge. It represents embodied measurement: space laid out by people who measured the land by moving through it, counting steps, correcting by eye, and repeating the process until precision was achieved.
Thom was right about the unit. What was missing was the body.
The Megalithic Yard is not a mystery. It is the footprint of the builders themselves, preserved in stone because it was first preserved in human movement.
Suitable references
Thom, A. (1967). Megalithic Sites in Britain
Thom, A. (1978). Megalithic Remains in Britain and Brittany
Cro-Magnon Megalithic Builders: Measurement, Biology, and the DNA
6. The Dating Mirage — Why C14 and DNA Mislead
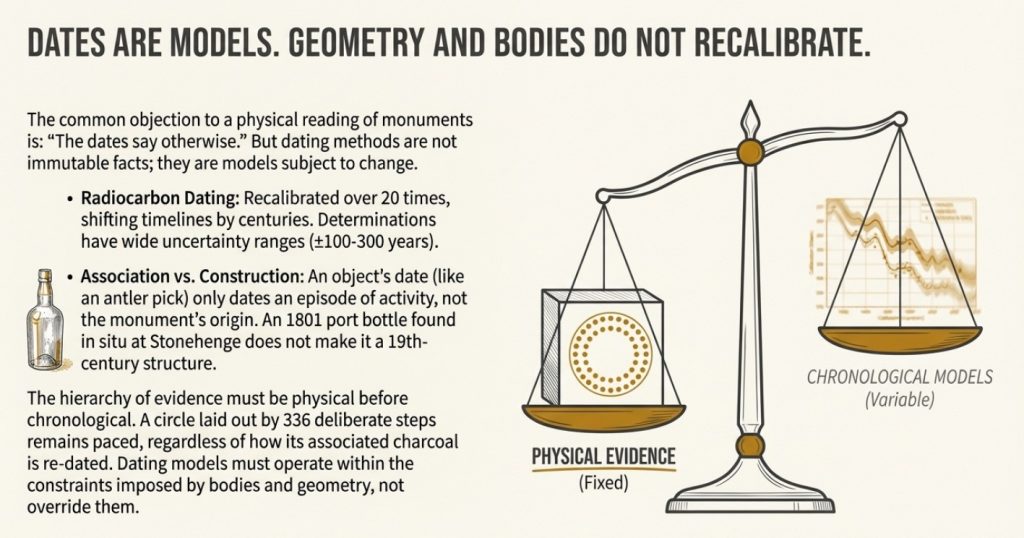
The objection most often raised against any physical or geometric reading of prehistoric monuments is familiar and automatic: “but the dates say otherwise.” Radiocarbon determinations, genetic chronologies, and typological phases are treated as fixed constraints, against which all other evidence must yield. The difficulty is that these dates are not fixed in the way geometry is fixed. They are models, and their instability is measurable.
Radiocarbon dating has been recalibrated more than twenty times since its introduction. Each revision alters the relationship between measured radiocarbon decay and calendar age, sometimes shifting archaeological contexts by centuries without any change to the material itself. Sites confidently assigned to specific periods in the mid-twentieth century now sit elsewhere on the timeline, not because the past has moved, but because the calibration curve has. Even within a single calibration, individual determinations commonly carry uncertainty ranges of ±100–300 years at 95 % confidence, and well-known plateaus compress long spans of time into overlapping date ranges. Precision is often implied where it does not exist.
That statistical instability would be manageable if the context were secure. Frequently, it is not.
Cro-Magnon Megalithic Builders: Measurement, Biology, and the DNA
At Stonehenge, William Hawley’s excavations in the 1920s documented an 1801 port bottle found in situ within the monument. Taken at face value and using the same logic often applied to prehistoric artefacts, this would require Stonehenge to be a nineteenth-century monument. Archaeologists correctly rejected that conclusion because they understood the principle involved: association does not equal construction. Objects can intrude into earlier deposits, be redeposited, or relate to later activity rather than the original layout. In situ does not mean foundational.
The same logical error is nevertheless repeated when antler picks, charcoal fragments, or isolated artefacts are used to anchor monument construction thousands of years earlier. Such finds can date an episode of activity, but they do not, by themselves, date the origin of the structure. Context is often assumed rather than demonstrated, and the dates derived inherit that assumption.
DNA chronologies compound the problem. Despite confident narratives of population replacement and cultural succession, fewer than 0.1 % of prehistoric genetic samples derive from skeletons that are both securely dated and securely associated with the monuments they are invoked to explain. The majority of genetic timelines are statistical reconstructions built from sparse, uneven datasets distributed across large geographic areas and long spans of time. These projections can suggest ancestry and relatedness, but they do not encode stature, step length, grip strength, gait, or the physical capacity required to execute the actions preserved in monument geometry.
This is where dating models collide with physical evidence.
Radiocarbon curves recalibrate. Genetic mutation rates are revised. Typological sequences are reorganised. But a circle laid out by repeated deliberate steps remains paced, regardless of how its associated artefacts are re-dated. A tool that demands exceptional grip strength remains demanding, irrespective of the cultural label attached to it. Bodies do not retroactively change scale, and geometry does not migrate over time.
The hierarchy of evidence is therefore physical before chronological. Dating models must operate within the limits imposed by bodies, tools, and landscapes, not override them. When dates conflict with what the physical evidence allows, the appropriate response is to reassess the model, not to dismiss the measurement.
Radiocarbon and DNA are useful analytical tools. They are not immutable facts. Dates are models. Geometry and bodies do not recalibrate.
Cro-Magnon Megalithic Builders: Measurement, Biology, and the DNA
7. Cranial Evidence — Long Heads and Long Barrows
Long before genetics, calibration curves, or cultural labels entered archaeological discourse, prehistoric populations were classified by something far simpler and far harder to dispute: their bones. In particular, cranial morphology provided one of the earliest and most consistent signals that Britain’s earliest monument builders were physically distinct from later populations.
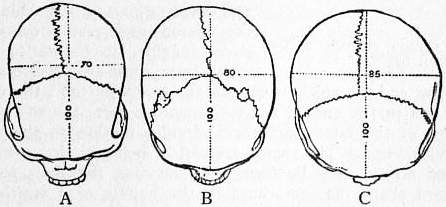
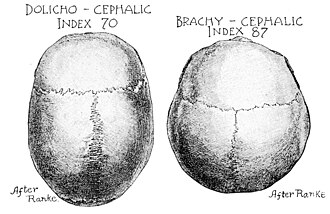
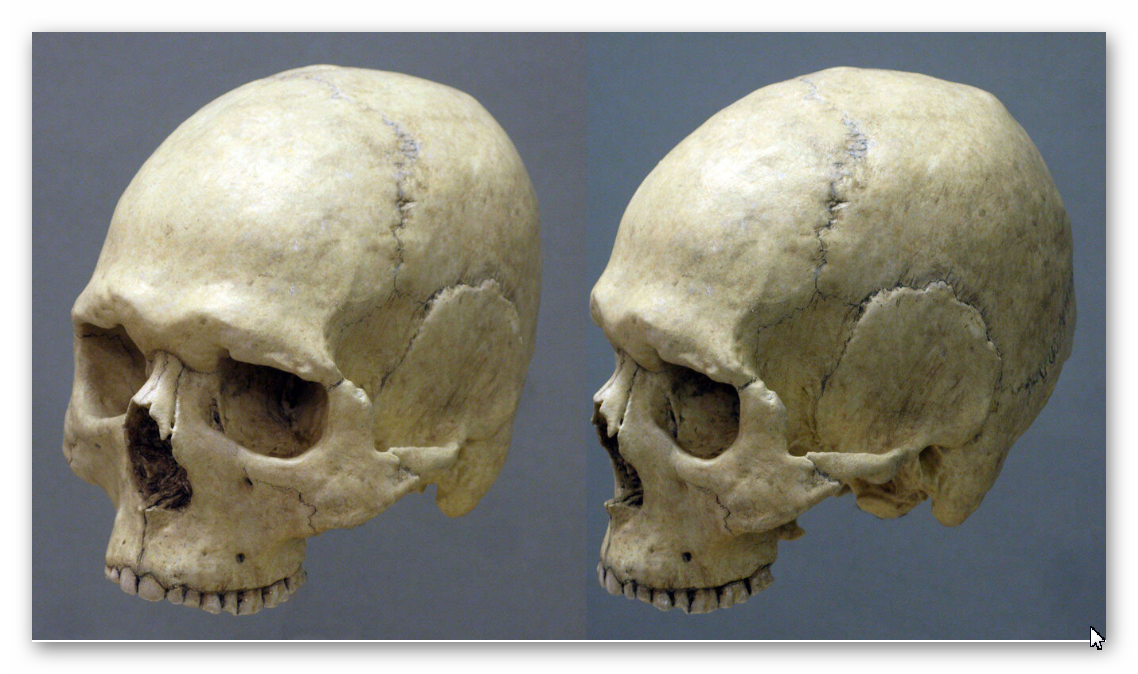
The distinction is not subtle. Human skulls vary measurably in shape, and one of the most robust metrics is the cranial index, the ratio of maximum skull breadth to maximum skull length. Values below roughly 75 define dolichocephalic (long-headed) forms; values above 80 define brachycephalic (round-headed) forms. These are not cultural categories. They are measurements.
Across Britain, a persistent pattern emerges in early excavation reports: dolichocephalic skulls dominate Neolithic chambered tombs and long barrows, while later round barrows and Beaker-associated burials increasingly contain brachycephalic or mesocephalic forms. This association was so consistently observed in the nineteenth and early twentieth centuries that it entered archaeological shorthand: long heads for long barrows; round heads for round barrows.
One of the clearest examples comes from Belas Knap Long Barrow, excavated and published in detail by O. G. S. Crawford and others in the early twentieth century. The skulls recovered from Belas Knap, when viewed from above, show pronounced elongation, narrow breadth, and cranial indices firmly within the dolichocephalic range. These are not borderline cases. They are anatomically distinct from the rounder skull forms characteristic of later Bronze Age contexts.
Cro-Magnon Megalithic Builders: Measurement, Biology, and the DNA
What matters here is not taxonomy, but continuity of observation. These cranial distinctions were repeatedly recorded across multiple sites by different investigators, long before modern political or theoretical pressures entered the field. They were not invented to support a narrative; they were noticed because they were there.
The disappearance of this evidence from mainstream teaching did not occur because it was disproved. It happened because it became inconvenient. As archaeology moved toward models of continuity and cultural replacement without physical differentiation, cranial morphology posed a problem. Bones do not cooperate with tidy narratives. They either differ or they do not.
Crucially, the cranial evidence aligns with everything already established in the previous sections. Dolichocephalic skulls are associated with larger cranial capacities, which in turn correlate with the robust bodies, long limbs, and high-energy lifestyles documented for pre-agricultural populations. They sit comfortably alongside the step lengths implied by the Aubrey Hole geometry, the tool ergonomics requiring high grip strength, and the embodied measurement systems that precede abstraction.
By contrast, later Beaker-associated populations show a shift toward rounder skull forms, reduced robustness, and different burial architectures. This transition does not require invasion myths or replacement fantasies to explain it. It simply reflects population change over time, compounded by agriculture, diet narrowing, and later admixture.
The critical point is this: the people buried in long barrows were not physically identical to the people who later reused or repurposed these landscapes. The barrows preserve not just ritual practice, but the bodies of their builders. Those bodies are long-headed, robust, and consistent with the Cro-Magnon–derived populations already identified through physiology, biomechanics, and monument geometry.
Cranial morphology, therefore, provides an independent line of evidence that converges with the rest of the dataset. It does not stand alone, and it does not need to. It confirms what the measurements already imply: that Britain’s earliest monumental tradition belongs to a population physically distinct from later Bronze Age groups.
Cranial index thresholds follow standard physical anthropology definitions (e.g. Brothwell 1981; Bass 1995).
Bones do not recalibrate. They do not migrate on typological timelines. They remain exactly the shape they were when they were buried.
Suitable references
Brothwell, D. (1981). Digging Up Bones
Bass, W. (1995). Human Osteology
Cro-Magnon Megalithic Builders: Measurement, Biology, and the DNA
8. Cambridge Confirmation — Megalithic Builders ≠ Beaker People
The cranial distinction outlined in the previous section is not a relic of nineteenth-century typology, nor an artefact of early excavation bias. It has been independently confirmed in modern, peer-reviewed research, including work published through University of Cambridge and Cambridge University Press journals. What has shifted over time is not the skeletal evidence itself, but the interpretive framework applied to it.
Cambridge-linked analyses of Neolithic and Early Bronze Age human remains demonstrate a biological discontinuity between populations interred in chambered tombs and long barrows, and those associated with the Beaker complex (Sheridan 2010; Sheridan & Curtis 2004). The distinction is explicitly physical rather than cultural. Dolichocephalic (long-headed) skull forms dominate Neolithic chambered-tomb contexts, while brachycephalic (round-headed) forms are characteristic of Beaker-period burials, a pattern already recognised in early physical anthropology and now reaffirmed in modern synthesis.
This correspondence is not incidental. The association between long barrows and long-headed individuals was documented repeatedly across Britain and Atlantic Europe in the late nineteenth and early twentieth centuries, including classic case studies such as Belas Knap (Crawford 1925; Proceedings of the Society of Antiquaries 1864–1867). What modern Cambridge-published work demonstrates is that these early observations were not mistaken. They were simply unfashionable.
The implication is straightforward. If Beaker-associated populations were responsible for the construction of Britain’s major megalithic monuments, their skeletal signatures would be expected within the primary burial horizons of those monuments. They are not. Instead, Beaker-period remains appear as later insertions, consistent with reuse, adaptation, or occupation of landscapes already monumentalised by earlier populations (Sheridan & Curtis 2004).
Cro-Magnon Megalithic Builders: Measurement, Biology, and the DNA
This conclusion is reinforced when cranial morphology is considered alongside broader European datasets. Quantitative analyses of cranial form across the Neolithic–Bronze Age transition demonstrate measurable morphological shifts over time, rather than continuity, with long-headed forms dominant in earlier Neolithic contexts and rounder forms increasing later (Brace et al. 1993). These shifts align with changes in diet, subsistence, and population structure, not with the initial appearance of monumentality.
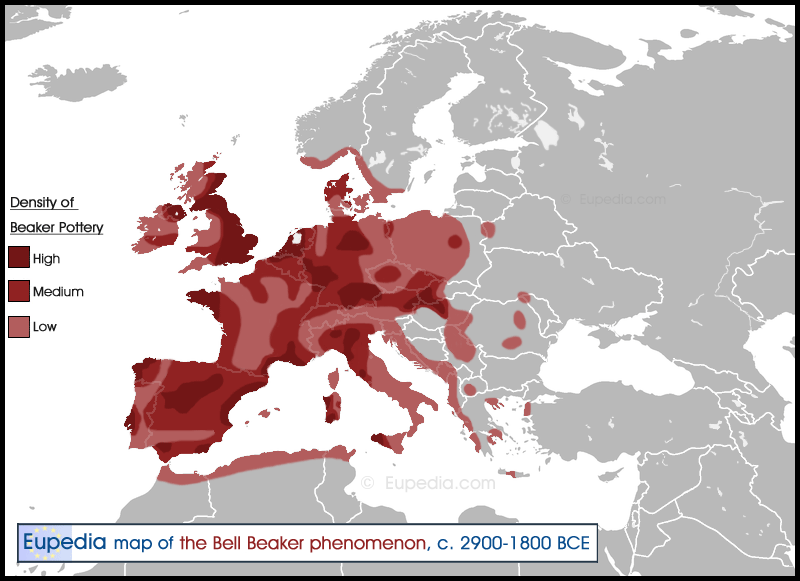
Cambridge research also highlights a second, frequently overlooked factor. The spatial distribution of Beaker artefacts across Europe does not match patterns expected from large-scale population replacement. Instead, Beaker material clusters strongly along river systems, estuaries, and coastal corridors, a behaviour consistent with exchange and contact networks rather than demographic swamping (Sheridan 2010). This mirrors the movement of other prestige goods, such as Alpine jade axes, which no serious archaeologist interprets as evidence for mass migration.
In this context, Beaker pottery functions as trade material rather than as a population marker. Objects move rapidly and widely; populations do not. Conflating artefact spread with monument authorship, therefore, introduces a category error.
When this evidence is set alongside monument geometry, step-based measurement, tool ergonomics, foot-scale biomechanics, and cranial form, the conclusion stabilises. Britain’s primary megalithic tradition belongs to a pre-Beaker population, physically distinct from later Bronze Age groups. That population closely corresponds to what has historically been described as Cro-Magnon-derived, without requiring claims of a separate species or speculative ancestry.
The role of Beaker groups is real but secondary. They enter landscapes already shaped, measured, and monumentalised by others. They leave material traces, but they do not originate the monumental system.
This is not a rejection of modern archaeology. It is a correction within it. The Cambridge evidence does not overturn early physical anthropology; it confirms it using modern analytical frameworks. The bones have not changed. Only the narrative has.
References cited in this section
Sheridan, A. (2010). The Neolithisation of Britain and Ireland: the “Big Picture”. Cambridge Archaeological Journal, 20(1), 89–105.
Sheridan, A., & Curtis, N. (2004). The Neolithic–Early Bronze Age transition in Britain. Cambridge Archaeological Journal, 14(1), 1–26.
Brace, C. L., et al. (1993). Clines and clusters versus “race”. Journal of Human Evolution, 24, 1–43.
Crawford, O. G. S. (1925). The Long Barrows of the Cotswolds.
Proceedings of the Society of Antiquaries, 2nd Series, Vol. 3 (1864–1867).
Cro-Magnon Megalithic Builders: Measurement, Biology, and the DNA
9. Trade, Not Invasion — The Beaker Distribution Problem
If the Beaker phenomenon represented a large-scale population replacement responsible for Britain’s megalithic monuments, its archaeological footprint would be broad and continuous. We would expect dense inland penetration, demographic saturation, and physical continuity between builders and Beaker burials. That is not what the evidence shows.
Instead, Beaker artefacts display a highly uneven spatial pattern. Across Britain and continental Europe, Beaker material clusters disproportionately along river systems, estuaries, and coastal corridors, with extensive inland regions showing sparse, episodic, or absent Beaker presence. This pattern has been documented repeatedly in large-scale syntheses of Beaker distribution (e.g. Needham 2005; Vander Linden 2007; Sheridan 2010). It is the spatial signature of exchange networks, not mass migration.
This distinction matters because population movement and object movement leave different archaeological fingerprints. Large-scale migration produces diffuse distributions across all habitable zones. Trade produces linear, network-driven patterns, focused along transport corridors where goods move efficiently. The Beaker record conforms closely to the latter.
A direct comparator is the distribution of Alpine jade axes. These objects originate from a handful of quarry zones in the western Alps yet appear across Atlantic Europe, including Britain and Ireland. Their movement is universally interpreted as trade and exchange rather than population displacement (Pétrequin et al. 2012). Beaker pottery exhibits an almost identical spatial logic: rapid spread, high visibility, and selective concentration along communication routes.
Chronology reinforces this interpretation. Beaker artefacts frequently appear after the construction of major monuments, inserted into landscapes already structured by long barrows, stone circles, and causewayed enclosures (Needham 2005; Sheridan & Curtis 2004). Where Beaker burials occur near earlier monuments, they are typically secondary, intrusive, or peripheral rather than foundational. The monuments are already there.
This undermines the common assumption that Beaker material culture equates to Beaker monument builders. Cultural packages can move far faster than people, particularly when prestige objects are involved. Treating the appearance of Beaker artefacts as evidence of authorship is therefore a category error — it confuses circulation with construction.
When this distributional evidence is set alongside earlier sections, the convergence is difficult to ignore. The bodies implied by monument geometry, step-based measurement, foot scale, tool ergonomics, and cranial morphology do not match later Beaker-associated populations. The monuments pre-exist widespread Beaker material. The artefacts arrive into an already monumentalised landscape.
None of this denies Beaker’s presence or influence. It places it correctly. Beaker groups interacted with existing populations, participated in exchange networks, and left a strong material signal — but they did not originate the megalithic tradition they encountered.
The Beaker distribution problem resolves cleanly once invasion assumptions are removed. What remains is a trade-driven network phenomenon layered onto an older demographic and monumental substrate.
Objects move easily. People move slowly. Monuments remember who was already there.
References cited in this section
Needham, S. (2005). Transforming Beaker culture in north-west Europe: processes of fusion and fission.Proceedings of the Prehistoric Society, 71, 171–217.
Vander Linden, M. (2007). What linked the Bell Beakers in third millennium BC Europe?Antiquity, 81, 343–352.
Sheridan, A. (2010). The Neolithisation of Britain and Ireland: the “Big Picture”.Cambridge Archaeological Journal, 20(1), 89–105.
Sheridan, A., & Curtis, N. (2004). The Neolithic–Early Bronze Age transition in Britain.Cambridge Archaeological Journal, 14(1), 1–26.
Pétrequin, P. et al. (2012). Jade: Objets-signes et interprétations sociales des jades alpins. Besanç
Cro-Magnon Megalithic Builders: Measurement, Biology, and the DNA
10. Brain Size and the “Efficiency” Excuse — When Biology Is Explained Away
As the physical evidence for robust, tall, long-headed early populations has accumulated, a new explanatory reflex has emerged: the claim that larger brains do not matter, because smaller brains are supposedly “more efficient.” This idea now appears routinely in popular summaries and institutional science communication, often presented as settled understanding rather than speculation.
It is not settled. It is a post hoc narrative.
Upper Palaeolithic and early Mesolithic populations, including those traditionally described as Cro-Magnon, consistently show larger average cranial capacities than later agricultural populations. Values in the range of 1,550–1,650 cm³ are common in Upper Palaeolithic samples, compared with Holocene farming populations that average closer to 1,350–1,450 cm³ (Ruff et al. 1997; Henneberg 1988). This is not a marginal difference. It represents a reduction on the order of 10–15% in absolute brain volume.
That reduction correlates temporally with the adoption of agriculture, dietary narrowing, reduced mobility, and skeletal gracilisation. These correlations have been documented repeatedly in osteological studies and are not controversial (Larsen 1995; Ruff 2002). What is controversial is the attempt to reframe this reduction as adaptive “efficiency” without independent evidence.
No direct measure of cognitive efficiency exists in the archaeological record. Claims that smaller brains are “more efficient” are therefore unfalsifiable assertions, not empirical conclusions. They explain an observed reduction after the fact, rather than predicting it. By contrast, the relationship between brain size, body size, and energetic demand is well established. Larger, more active bodies require greater neural capacity for sensorimotor control, spatial navigation, and coordination. As activity levels and dietary diversity decline, neural demands do too.
Cro-Magnon Megalithic Builders: Measurement, Biology, and the DNA
This pattern is not unique to humans. In domesticated animals, including canids, brain size reduction is a consistent correlate of reduced behavioural demands. Wolves possess larger brains relative to body size than domestic dogs, not because wolves are less “efficient,” but because their ecological and behavioural requirements are greater (Kruska 1988; Kruska & Schott 1977). The direction of causation is clear: reduced demand leads to reduced neural investment.
The same logic applies to human populations transitioning from highly mobile, broad-spectrum subsistence to sedentary agriculture. Reduced ranging, simplified toolkits, and narrower diets lessen selective pressure on spatial cognition and sensorimotor integration. Brain size reduction follows. There is no independent evidence that this reduction reflects superior efficiency rather than lower functional demand.
This matters because attempts to downplay brain size differences are often used to neutralise the physical evidence discussed in earlier sections. Larger bodies, longer steps, heavier tools, and higher cranial capacities all point to populations operating at a different physical scale. Rather than addressing that scale directly, the “efficiency” argument seeks to dissolve it conceptually.
But the monuments do not cooperate with that manoeuvre.
The geometry preserved at Stonehenge Phase 1, the labour implied by large-scale ditching, the ergonomics of heavy stone tools, and the cranial forms found in long barrows all point toward populations with high physical and cognitive demand, not reduced ones. These demands are consistent with larger bodies and larger brains, not smaller, supposedly optimised ones.
The crucial point is that nothing in the archaeological record requires us to believe that smaller brains are better. The only thing required is that we accept the empirical sequence: as subsistence, mobility, and physical demands declined, so did average brain size. That is explanation enough.
Invoking “efficiency” does not add evidence. It removes discomfort.
When the physical record shows that earlier populations were larger, stronger, and more robust — cranially as well as skeletally — the responsible response is not to explain the difference away, but to account for it honestly.
Brains, like bodies, scale to demand. When demand falls, so does size. No narrative recalibration changes that.
Cro-Magnon Megalithic Builders: Measurement, Biology, and the DNA
References cited in this section
Ruff, C. B., Trinkaus, E., & Holliday, T. W. (1997). Body mass and encephalisation in Pleistocene Homo.Nature, 387, 173–176.
Henneberg, M. (1988). Decrease of human skull size in the Holocene.Human Biology, 60, 395–405.
Larsen, C. S. (1995). Biological changes in human populations with agriculture.Annual Review of Anthropology, 24, 185–213.
Ruff, C. B. (2002). Variation in human body size and shape.Annual Review of Anthropology, 31, 211–232.
Kruska, D. (1988). Mammalian domestication and its effect on brain structure.Zeitschrift für Zoologie.
Kruska, D., & Schott, A. (1977). Comparative quantitative investigations on brains of wild and domestic animals.Journal of Hirnforschung.
11. The Neolithic Power Axe — Scale, Strength, and Feasibility
One of the most persistent errors in interpretations of early monument construction is the assumption that Neolithic stone axes were crude, inefficient tools. That assumption does not survive contact with fully hafted examples, experimental archaeology, or basic mechanics.
Hafted stone axes from the Langdale Group VI tradition, including complete or near-complete examples from Cumbria and adjacent regions, combine large stone heads, green-wood hafts, and short, thick handles (Bradley & Edmonds 1993; Edmonds 1995). These are not accidental proportions. They produce a tool optimised for power delivery, not light repetitive chopping.
The mechanical consequences are measurable. Control of an axe swing is governed by its rotational inertia, approximated by I ≈ m r², Where m is the total mass of the tool, and r is the distance from the grip to the centre of mass. Modern steel felling axes typically weigh 2.0–2.3 kg, with balance points near 0.43 m, producing inertia values of 0.40 kg·m² (Coles 1979). By contrast, reconstructed Langdale-type hafted axes plausibly weigh 3.2–4.0 kg, with balance points around 0.38–0.40 m, yielding inertia values between 0.51 and 0.58 kg·m²—an increase of roughly 30–45 % in required wrist and forearm torque at the same swing cadence.
Cro-Magnon Megalithic Builders: Measurement, Biology, and the DNA
This is not theoretical. Experimental work on replicated stone axes consistently shows that these tools demand significantly greater grip strength, forearm mass, and wrist stability than modern axes, but deliver correspondingly higher impact energy per strike (Coles 1979; Whittle 1997). The short, thick handle geometry visible on surviving hafts concentrates control into the hand, favouring high-impulse blows rather than long-lever efficiency. That configuration only makes sense in the hands of large, robust users.
This directly intersects with labour feasibility. Earthworks such as the Avebury ditch involve excavation volumes on the order of ~96,000 m³. Traditional estimates based on dry antler-pick excavation alone typically exceed 15 labour-hours per cubic metre, producing implausible construction timelines (Whittle 1997). These estimates are known to be flawed because they exclude both realistic toolkits and environmental conditions.
Southern Britain’s chalk landscapes have high seasonal water tables. Experimental and geoarchaeological studies show that saturated chalk cuts and lifts more easily than dry chalk, and that spoil transport efficiency increases substantially under wet conditions (Allen & Gardiner 2002). When hafted stone axes and wooden spades are combined with seasonal waterlogging, conservative excavation rates drop to ~5 h/m³ even without deliberate hydraulic management. Where water is actively exploited—as ditch morphology and siting suggest—effective rates nearer ~2 h/m³ are entirely realistic.
That represents a three- to eight-fold reduction in labour time compared to antler-only assumptions. Under those conditions, monument construction becomes not exceptional but logistically routine for large, coordinated groups using heavy tools designed for power.
The significance of the power axe is therefore structural. It links body scale, tool design, and construction feasibility in a single physical system. Its mass and geometry cannot be reconciled with post-agricultural body norms, but they fit precisely with the tall, robust physiques implied by monument pacing, foot scale, and cranial morphology discussed earlier.
This is why the axe matters more than typology or dating labels. Its demands are immediate and mechanical. Either the builders had the strength and mass to wield such tools efficiently, or the tools—and the monuments built with them—do not make sense.
The axe removes that ambiguity.
Cro-Magnon Megalithic Builders: Measurement, Biology, and the DNA
References cited in this section
Bradley, R., & Edmonds, M. (1993). Interpreting the Axe Trade. Cambridge University Press.
Edmonds, M. (1995). Stone Tools and Society. Batsford.
Coles, J. (1979). Experimental Archaeology. Academic Press.
Whittle, A. (1997). Sacred Mound, Holy Rings. Oxbow.
Allen, M. J., & Gardiner, J. (2002). A sense of place: Monuments and landscape in the Neolithic of southern Britain.Antiquity, 76, 161–172.
12. The Northern Genetic Continuum — R1b1 and Population Persistence
By this point, the argument has been established solely on physical grounds. Monument geometry implies large bodies and long steps. Tool ergonomics require exceptional grip strength. Cranial morphology identifies long-headed populations associated with early monuments. None of this depends on genetics. The role of DNA here is, therefore, limited and specific: to test population continuity, not to define builders.
When used in that restricted way, the genetic signal aligns with the physical evidence.
Across western and north-western Europe, Y-chromosome haplogroup R1b1 (and its downstream clades) shows deep temporal persistence. While modern distributions are complicated by later admixture, ancient DNA studies indicate that western Europe retained strong local male-line continuity from the late Upper Palaeolithic through the Mesolithic and into the Neolithic, with later inputs layered onto, rather than replacing, that substrate (Haak et al. 2015; Olalde et al. 2018).
Crucially, this continuity can now be anchored directly in the Ice Age. Villabruna 1 (I9030), an Epigravettian hunter-gatherer dated to approximately 14,000 BP, has been securely assigned to Y-chromosome haplogroup R1b1a (R-L754), making him the oldest confirmed R1b individual currently known (Fu et al. 2016; Posth et al. 2016). This establishes the presence of R1b lineages in Europe long before the Beaker or Bronze Age movements and removes the need to invoke a late wholesale replacement to explain its later dominance.
Cro-Magnon Megalithic Builders: Measurement, Biology, and the DNA
This is not a claim that “Cro-Magnons carried R1b1” in a simplistic or exclusive sense. Genetic lineages do not map neatly onto archaeological labels. What matters is that north-western Europe does not show evidence of wholesale male-line replacement at the point when monumental traditions emerge. Instead, the signal is one of persistence followed by admixture.
That distinction matters because it places limits on what later populations—such as Beaker-associated groups—can reasonably be said to have done. Where male-line continuity is strong, incoming cultural packages cannot automatically be equated with incoming builders. Pots can spread without people; people can mix without disappearing.
Crucially, the genetic evidence does not contradict the physical one. Tall stature, skeletal robustness, and long-headed cranial forms are all consistent with long-term hunter-gatherer or broad-spectrum forager populations maintaining continuity into the early Neolithic. The decline in robustness and cranial capacity occurs later, in line with dietary narrowing and agricultural dependence, not at the moment monuments first appear (Larsen 1995; Ruff 2002).
This sequence is visible genetically as well as physically. Early farmer ancestry enters Britain and Atlantic Europe gradually and unevenly, mixing with existing populations rather than replacing them outright (Olalde et al. 2018). The genetic transition mirrors the biological one: attenuation, not extinction.
It is, therefore, a mistake to treat DNA as an override mechanism that nullifies physical anthropology. Genetics does not tell us how tall people were, how far they walked in a day, or whether they could handle heavy stone tools. What it can tell us is whether the same populations remained present long enough for physical traditions to persist. In north-western Europe, the answer is clearly yes.
Seen in this light, R1b1 functions not as an identity marker, but as a continuity tracer. It indicates that the populations responsible for Britain’s earliest monumental traditions were not ephemeral or rapidly replaced. They endured, adapted, and absorbed later influences while retaining a detectable genetic footprint.
This prepares the ground for the next section. If population continuity exists, then secondary traits—such as pigmentation—can legitimately be examined as residual signals rather than as determinative markers. Without this genetic context, pigmentation would indeed feel arbitrary. With it, the sequence holds.
DNA does not explain the monuments. But it confirms that the people who could build them did not vanish when the landscape changed.
Cro-Magnon Megalithic Builders: Measurement, Biology, and the DNA
References cited in this section
Haak, W., et al. (2015). Massive migration from the steppe was a source for Indo-European languages in Europe.Nature, 522, 207–211.
Olalde, I., et al. (2018). The Beaker phenomenon and the genomic transformation of north-west Europe.Nature, 555, 190–196.
Fu, Q., et al. (2016).The genetic history of Ice Age Europe.Nature, 534, 200–205.
Posth, C., et al. (2016).Palaeogenomics of Upper Palaeolithic Europe.Nature Communications, 7, 12727.
Larsen, C. S. (1995). Biological changes in human populations with agriculture.Annual Review of Anthropology, 24, 185–213.
Ruff, C. B. (2002). Variation in human body size and shape.Annual Review of Anthropology, 31, 211–232.
13. Pigmentation as an Inherited Ice-Age Signal
If population continuity can be demonstrated physically and genetically, then pigmentation can be examined not as a causal factor but as a residual biological signal. Hair and skin colour do not explain monument building, but they can reflect the deep history of populations in which monument builders were embedded. When used cautiously, pigmentation serves as a consistency check rather than an independent claim.
Red hair is associated with variants of the MC1R gene on chromosome 16 (Rees 2003; Harding et al. 2000). These variants are autosomal, not Y-linked, and are therefore not caused by any Y-chromosome haplogroup. However, the common presentation of red hair as a late, isolated mutation spreading rapidly through north-west Europe is biologically implausible. MC1R is unusually polymorphic in humans, and European MC1R diversity is far too high to be explained by a single recent origin event (Harding et al. 2000; Rees 2003). The problem, therefore, is not how such traits suddenly arose, but why they survived and intensified in specific regions.
This is where the book’s “practical solution” matters: admixture provides a mechanism that does not require miracles. Neanderthals carried functional variants at MC1R consistent with lighter pigmentation, demonstrating that reduced pigmentation existed in western Eurasia prior to later Holocene population histories (Lalueza-Fox et al. 2007). Cro-Magnon populations interbred with Neanderthals repeatedly during the Upper Palaeolithic, and modern Europeans retain measurable Neanderthal introgression. In that context, pigmentation-related variants could have entered Cro-Magnon-derived populations early and persisted as part of a deeper Ice-Age inheritance rather than appearing late as a sudden innovation (Lalueza-Fox et al. 2007; Rees 2003).
Cro-Magnon Megalithic Builders: Measurement, Biology, and the DNA
Once present, the fate of these variants depended less on “rapid spread” and more on population structure. In much of Europe, later demographic turnover diluted early signals. In contrast, north-west Atlantic Europe shows strong evidence for long-term local persistence with later admixture rather than immediate replacement, which is precisely the demographic environment in which recessive traits can accumulate to unusually high local frequencies (Jobling & Tyler-Smith 2017; Olalde et al. 2018). Under those conditions, red hair and very light skin do not need to be newly created; they need only be preserved and amplified within enduring populations.
The modern distribution reflects this history. Red hair remains globally rare yet regionally concentrated, with its highest frequencies in Ireland, western Britain, and adjacent Atlantic regions. These are the same regions that show the strongest persistence of Y-chromosome haplogroup R1b1 and the densest early megalithic landscapes. The relationship is not causal but demographic: long-lived populations preserve ancient traits, and Y-line continuity functions as a tracer of that persistence (Jobling & Tyler-Smith 2017; Olalde et al. 2018).
Not all red-haired individuals belong to R-lineage populations. A minority occur in regions where R haplogroups are rare, reflecting later diffusion through admixture rather than independent origin. This is entirely expected under the same model. Later prehistoric and early historic movements redistributed pigmentation traits across northern Europe, but redistribution is not the same as origin; secondary spread cannot explain the primary Atlantic centre of gravity.
Pigmentation, taken alone, proves nothing. But when read alongside skeletal morphology, tool ergonomics, monument geography, and genetic continuity, it reinforces the same conclusion reached repeatedly from independent lines of evidence. The people capable of constructing Europe’s earliest monuments did not vanish with the Ice Age. They persisted, adapted, and carried elements of their Ice Age biology into the present.
Cro-Magnon Megalithic Builders: Measurement, Biology, and the DNA
References cited in this section
Harding, R. M. et al. (2000). Evidence for variable selective pressures at MC1R.American Journal of Human Genetics, 66, 1351–1361.
Rees, J. L. (2003). The genetics of sun sensitivity in humans.American Journal of Human Genetics, 75, 739–751.
Lalueza-Fox, C. et al. (2007). A melanocortin 1 receptor allele suggests varying pigmentation among Neanderthals.Science, 318, 1453–1455.
Olalde, I. et al. (2018). The Beaker phenomenon and the genomic transformation of north-west Europe.Nature, 555, 190–196.
Jobling, M. A. & Tyler-Smith, C. (2017). Human Y-chromosome variation and population history.Nature Reviews Genetics, 18, 485–497.
14. Eye Colour and Deep Ancestry in North-West Europe
Eye colour provides an apparent test of the continuity model developed in the preceding sections. Unlike hair pigmentation, which involves multiple interacting variants, light eye colour in Europe is primarily controlled by variation at the HERC2–OCA2 locus on chromosome 15 (Eiberg et al. 2008). This genetic architecture is comparatively narrow, making eye colour less sensitive to environmental plasticity and less prone to repeated independent origin. For that reason, its geographic pattern is especially informative.
As with hair colour, eye colour is inherited in an autosomal manner from both parents. It is not linked to the Y-chromosome and is not caused by any haplogroup. Its value lies instead in persistence: where populations endure, rare traits can survive and intensify; where replacement occurs, they are diluted or lost.
The critical issue is chronology. Claims that blue or green eyes emerged only in the Neolithic or Bronze Age are contradicted by ancient DNA. Mesolithic individuals from north-west Europe already carried the derived HERC2/OCA2 allele associated with light eye colour, demonstrating that the trait predates agriculture and later demographic shifts (Olalde et al. 2014). The most widely cited example is Cheddar Man, dated to approximately 10,000 years BP, whose genome indicates blue or green eyes despite his clear pre-agricultural hunter-gatherer context (Brace et al. 2019).
This evidence places light eye colour firmly within Ice-Age-derived populations of Britain. It was not introduced by early farmers, Beaker-associated groups, or Bronze-Age movements. As with MC1R variants discussed in Section 13, the question is not when eye colour first appeared, but where populations remained stable enough for it to persist.
The modern distribution reflects that same demographic logic. Blue and green eyes reach their highest frequencies in north-west Europe, particularly around the North Sea and Atlantic façade, and decline sharply outside this zone. This pattern mirrors regions of strong population persistence rather than routes of late prehistoric expansion. Later movements redistributed the trait more widely across Europe, but they did not erase its original centre of gravity (Walsh et al. 2017; Jobling & Tyler-Smith 2017).
Importantly, this signal operates independently of Y-DNA lineages. Cheddar Man’s paternal haplogroup differs from those dominant in later Atlantic populations, yet the eye-colour trait persists across that transition. This reinforces the central point developed throughout the book: pigmentation traits predate later haplogroup dominance and are best understood as inherited features preserved by continuity, not markers introduced by population replacement.
Read together with Section 13, eye colour strengthens the same conclusion rather than introducing a new one. Hair, skin, and eye pigmentation all point to an ancient origin combined with regional survival. These traits did not arise suddenly, nor were they imposed by later populations. They endured where populations endured.
Pigmentation, therefore, functions as a residual map of deep ancestry. It does not identify monument builders individually, but it confirms that the populations capable of building monuments were rooted in the same landscapes long before and long after those monuments were raised.
Cro-Magnon Megalithic Builders: Measurement, Biology, and the DNA
References cited in this section
Eiberg, H. et al. (2008). Blue eye color in humans may be caused by a perfectly associated founder mutation in a regulatory element located within the HERC2 gene inhibiting OCA2 expression.Human Genetics, 123, 177–187.
Olalde, I. et al. (2014). Derived immune and ancestral pigmentation alleles in a 7,000-year-old Mesolithic European.Nature, 507, 225–228.
Brace, S. et al. (2019). Ancient genomes indicate population replacement in Early Neolithic Britain.Nature Ecology & Evolution, 3, 765–771.
Walsh, S. et al. (2017). The HIrisPlex system for simultaneous prediction of hair and eye colour from DNA.Forensic Science International: Genetics, 16, 261–268.
Jobling, M. A. & Tyler-Smith, C. (2017). Human Y-chromosome variation and population history.Nature Reviews Genetics, 18, 485–497.
Synthesis: Bodies, Continuity, and the Shape of the Past
Taken together, the evidence assembled here resolves a problem that has long been obscured by disciplinary boundaries rather than a lack of data. Europe’s earliest monumental landscapes did not emerge from abstract cultural phases or statistical populations. They emerged from people—real bodies operating within physical limits, using tools whose scale and mechanics still survive, laying out spaces whose geometry remains fixed in the ground.
The argument begins with constraint. Monument geometry implies deliberate pacing and consistent embodied measurement. Tool ergonomics require grip strength and leverage incompatible with gracile physiques. Ditch volumes demand sustained labour capacity at a scale that cannot be reconciled with populations already showing biological attenuation. These are not interpretations; they are physical facts.
Those constraints narrow the field sharply. Neanderthals are excluded by chronology and stature. Later agricultural populations are excluded by declining robustness, reduced cranial capacity, and biomechanical mismatch. The only populations that fit the required physical envelope are Cro-Magnon–derived Upper Palaeolithic Europeans—tall, long-limbed, mechanically robust humans adapted to demanding environments long before agriculture reshaped biology.
Cro-Magnon Megalithic Builders: Measurement, Biology, and the DNA
Genetics does not overturn this conclusion. When used correctly, it reinforces it. Ancient DNA demonstrates continuity rather than wholesale replacement across north-western Europe from the Late Upper Palaeolithic into the Neolithic, with later admixture layered onto an enduring substrate. The presence of R1b lineages in Ice-Age Europe confirms persistence, not origin, and removes the need to invoke late demographic miracles to explain either monument builders or modern population structure.
Pigmentation then falls into place, not as an explanatory driver, but as a residual signal of that continuity. Hair colour, skin tone, and eye colour do not appear suddenly, nor do they spread implausibly fast. They reflect ancient variation preserved where populations endured and diluted where they did not. Neanderthal admixture provides a biologically natural mechanism for early pigmentation diversity; long-term regional stability explains its modern concentration. Cheddar Man confirms antiquity. Atlantic Europe confirms persistence.
At no point does any single line of evidence carry the argument alone. The strength lies in convergence. Geometry, biomechanics, osteology, genetics, and pigmentation all point in the same direction independently. None requires special pleading. None depends on speculative leaps. Each simply removes implausible alternatives until only one population history remains consistent with the ground beneath our feet.
What emerges is not a radical reimagining of prehistory, but a correction of emphasis. The past has been made strange not by evidence, but by abstraction. When bodies are restored to the centre of the narrative, many long-standing problems dissolve. The builders of Europe’s earliest monuments were not transient newcomers, symbolic placeholders, or statistical ghosts. They were enduring populations whose physical and biological signatures persist precisely because they were never entirely erased.
The monuments did not outlast the people who built them. The people endured—and the landscape still remembers them.
Cro-Magnon Megalithic Builders: Measurement, Biology, and the DNA
Podcast
Author’s Biography
Robert John Langdon, a polymathic luminary, emerges as a writer, historian, and eminent specialist in LiDAR Landscape Archaeology.
His intellectual voyage has interwoven with stints as an astute scrutineer for governmental realms and grand corporate bastions, a tapestry spanning British Telecommunications, Cable and Wireless, British Gas, and the esteemed University of London.
A decade hence, Robert’s transition into retirement unfurled a chapter of insatiable curiosity. This phase saw him immerse himself in Politics, Archaeology, Philosophy, and the enigmatic realm of Quantum Mechanics. His academic odyssey traversed the venerable corridors of knowledge hubs such as the Museum of London, University College London, Birkbeck College, The City Literature Institute, and Chichester University.
In the symphony of his life, Robert is a custodian of three progeny and a pair of cherished grandchildren. His sanctuary lies ensconced in the embrace of West Wales, where he inhabits an isolated cottage, its windows framing a vista of the boundless sea – a retreat from the scrutinous gaze of the Her Majesty’s Revenue and Customs, an amiable clandestinity in the lap of nature’s embrace.
Exploring Prehistoric Britain: A Journey Through Time
My blog delves into the fascinating mysteries of prehistoric Britain, challenging conventional narratives and offering fresh perspectives based on cutting-edge research, particularly using LiDAR technology. I invite you to explore some key areas of my research. For example, the Wansdyke, often cited as a defensive structure, is re-examined in light of new evidence. I’ve presented my findings in my blog post Wansdyke: A British Frontier Wall – ‘Debunked’, and aWansdyke LiDAR Flyover video further visualizes my conclusions.
For those interested in British Prehistory, visit www.prehistoric-britain.co.uk, a comprehensive resource featuring an extensive collection of archaeology articles, modern LiDAR investigations, and groundbreaking research. The site also includes insights and extracts from the acclaimed Robert John Langdon Trilogy, a series of books exploring Britain during the Prehistoric period. Titles in the trilogy include The Stonehenge Enigma, Dawn of the Lost Civilisation, and The Post Glacial Flooding Hypothesis, offering compelling evidence about ancient landscapes shaped by post-glacial flooding.
To further explore these topics, Robert John Langdon has developed a dedicated YouTube channel featuring over 100 video documentaries and investigations that complement the trilogy. Notable discoveries and studies showcased on the channel include 13 Things that Don’t Make Sense in History and the revelation of Silbury Avenue – The Lost Stone Avenue, a rediscovered prehistoric feature at Avebury, Wiltshire.
In addition to his main works, Langdon has released a series of shorter, accessible publications, ideal for readers delving into specific topics. These include:
For active discussions and updates on the trilogy’s findings and recent LiDAR investigations, join our vibrant community on Facebook. Engage with like-minded enthusiasts by leaving a message or contributing to debates in our Facebook Group.
Whether through the books, the website, or interactive videos, we aim to provide a deeper understanding of Britain’s fascinating prehistoric past. We encourage you to explore these resources and uncover the mysteries of ancient landscapes through the lens of modern archaeology.
For more information, including chapter extracts and related publications, visit the Robert John Langdon Author Page. Dive into works such as The Stonehenge Enigma or Dawn of the Lost Civilisation, and explore cutting-edge theories that challenge traditional historical narratives.