Introduction – A Revolution Built on Probabilities
Over the past decade, ancient DNA has revolutionised archaeology. For the first time, scientists can recover fragments of genetic material from people who lived thousands of years ago, offering remarkable new insights into ancestry, population relationships and prehistoric life. It is one of the greatest scientific advances ever applied to our understanding of the past, and its contribution cannot be overstated. (The Great Ancient DNA Illusion: How Statistical Models Became Archaeological “Facts”)
Yet alongside this revolution has emerged a growing problem.
Ancient DNA is often presented to the public as if it provides direct and unquestionable evidence of prehistoric events. Newspaper headlines confidently announce the arrival of new populations, sweeping migrations and the replacement of entire peoples, creating the impression that these conclusions are simply “read” from the DNA itself.
The reality is considerably more complex.
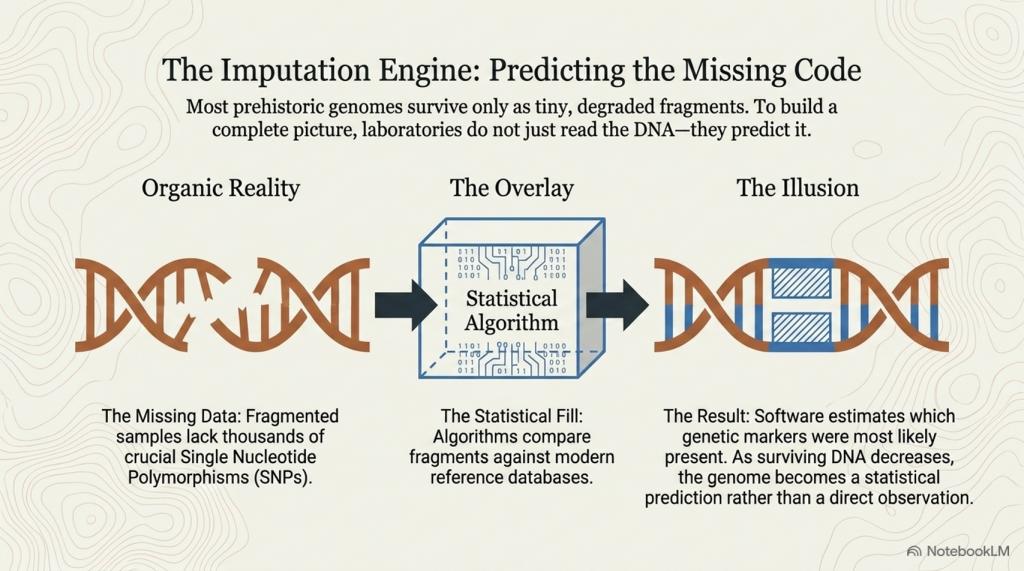
Ancient DNA does not arrive as a complete genetic blueprint. Most prehistoric DNA survives only as tiny, degraded fragments that must be reconstructed using sophisticated statistical techniques. Radiocarbon dates are refined using Bayesian probability models. Individuals are assigned to ancestral populations through comparative statistical analysis. Finally, these results are interpreted within existing archaeological frameworks to produce historical narratives.
Each of these stages is scientifically valid and often essential. However, each also introduces assumptions, probabilities and modelling. By the time the public reads that a migration has been “proved”, the conclusion has passed through several layers of statistical interpretation before becoming an archaeological fact.
This distinction matters.

Science advances by continually questioning its own models, especially when new discoveries challenge long-held assumptions. Over the past week, we have examined a series of remarkable discoveries that do exactly that. The identification of Mesolithic R1b lineages in Britain, together with an increasing number of pre-Beaker R1b individuals across Europe, raises an important question that deserves careful consideration.
Have our statistical models begun to shape the stories we tell about prehistory, rather than simply helping us to interpret the evidence?
This article is not an attack on ancient DNA research. On the contrary, it is a defence of good science. Ancient DNA remains one of archaeology’s most powerful tools, but it should never be confused with certainty. As we shall see, there is a crucial difference between genetic evidence and the statistical models used to interpret it—and recognising that difference may fundamentally change how we understand Europe’s prehistoric past.
1. Ancient DNA Is Not a Photograph of the Past
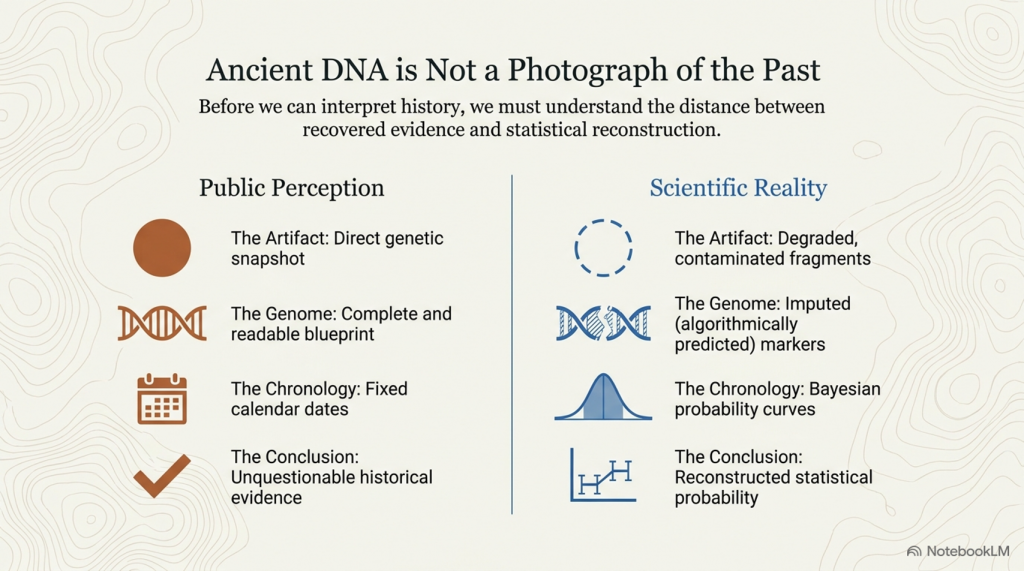
One of the greatest misconceptions surrounding ancient DNA is the belief that it provides a complete genetic snapshot of an individual who lived thousands of years ago. In reality, ancient DNA is nothing like reading a modern human genome. Time, burial conditions and natural chemical processes progressively destroy DNA after death, leaving researchers with only tiny surviving fragments from which they must reconstruct the original genetic sequence.
Unlike modern DNA samples, where virtually the entire genome can be sequenced, ancient specimens are often highly fragmented and contaminated by bacteria, fungi and even modern human DNA introduced during excavation or handling. Laboratories therefore begin by extracting only the authentic ancient fragments before using specialised computer software to align these short pieces against the modern human reference genome. The result is not a complete genome but a partial reconstruction based on the evidence that survives.
The quality of that reconstruction varies enormously from one individual to another. Some exceptional specimens preserve millions of readable DNA positions, while others may contain only a few thousand. These positions are known as Single Nucleotide Polymorphisms (SNPs), the individual genetic markers used to identify ancestry, relationships and inherited traits. The fewer SNPs that survive, the greater the uncertainty in the final interpretation. Two individuals may therefore appear equally represented in a published database, yet one may be based on a near-complete genome while the other relies on only a small fraction of the available genetic information.

To overcome these limitations, researchers compare ancient DNA against large databases of modern and ancient reference populations. Sophisticated statistical algorithms estimate which missing genetic markers are most likely to have been present, a process known as imputation. This is a powerful and entirely legitimate technique, but it remains a statistical prediction rather than a direct observation. As the amount of surviving DNA decreases, the reconstruction becomes increasingly dependent upon probability rather than recovered evidence.
The same principle applies when assigning an individual to an ancestral population or identifying a Y-chromosome haplogroup. These classifications are not usually determined by a single defining mutation but by assessing how closely an incomplete genetic profile matches previously identified populations. Every assignment therefore carries an associated confidence level. In many cases, these confidence values are extremely high, but they are rarely absolute. The public, however, almost never sees these probabilities. Instead, tentative statistical conclusions are frequently presented as definitive historical facts.
None of this diminishes the extraordinary value of ancient DNA research. Without these statistical methods, much of prehistoric genetics would remain inaccessible. However, it is essential to recognise the distinction between recovered evidence and reconstructed evidence. Every ancient genome represents a combination of preserved DNA, statistical modelling and informed scientific interpretation. Before archaeologists begin discussing migrations, population replacements or cultural change, the genetic evidence has already passed through several stages of reconstruction, each introducing a degree of uncertainty.
Understanding this distinction is fundamental to interpreting ancient DNA responsibly. The science is exceptionally powerful, but it is not a direct photograph of the past. It is a carefully reconstructed image whose clarity depends upon the quantity and quality of the surviving evidence, the statistical methods employed, and the assumptions built into those models. Appreciating that uncertainty is the first step towards separating what the DNA actually tells us from the historical narratives later constructed around it.
2. The Bayesian Revolution
One of the least understood aspects of modern archaeology is the role played by Bayesian statistics. While ancient DNA often dominates the headlines, Bayesian modelling has quietly become one of the most influential tools for constructing archaeological chronologies. It is an exceptionally powerful statistical method that has transformed the interpretation of radiocarbon dating, but it is also frequently misunderstood.
Contrary to popular belief, radiocarbon dating does not usually produce a single calendar year. Instead, every radiocarbon result is expressed as a probability distribution covering a range of possible dates. Depending upon the quality of the sample and the calibration curve, this range may extend over several decades or even centuries. In other words, the radiocarbon result itself is not a precise date but a statistical estimate with varying levels of probability.
This is where Bayesian analysis enters the picture.
Bayesian statistics allows archaeologists to combine radiocarbon dates with other sources of information. For example, if it is already known that one archaeological layer lies beneath another, or that a sequence of burials occurred over time, these relationships can be incorporated into a statistical model. The Bayesian algorithm then recalculates the most likely date ranges that satisfy both the radiocarbon evidence and the archaeological sequence. The result is often a considerably narrower chronological window than the original radiocarbon dates alone.
This represents a remarkable scientific advance. Rather than treating every radiocarbon date in isolation, Bayesian modelling uses all available evidence to produce the most probable chronology. Used correctly, it can significantly improve our understanding of archaeological sites and has become an indispensable tool in modern research.
However, Bayesian modelling also introduces an important distinction that is often overlooked.
Every Bayesian model begins with a set of prior assumptions. These assumptions may include the order of archaeological layers, the duration of cultural phases, the relationship between samples, or the accepted chronology of a particular archaeological culture. The statistical model then calculates a new set of probabilities—the posterior probabilities—that best fit both the radiocarbon evidence and those prior assumptions.
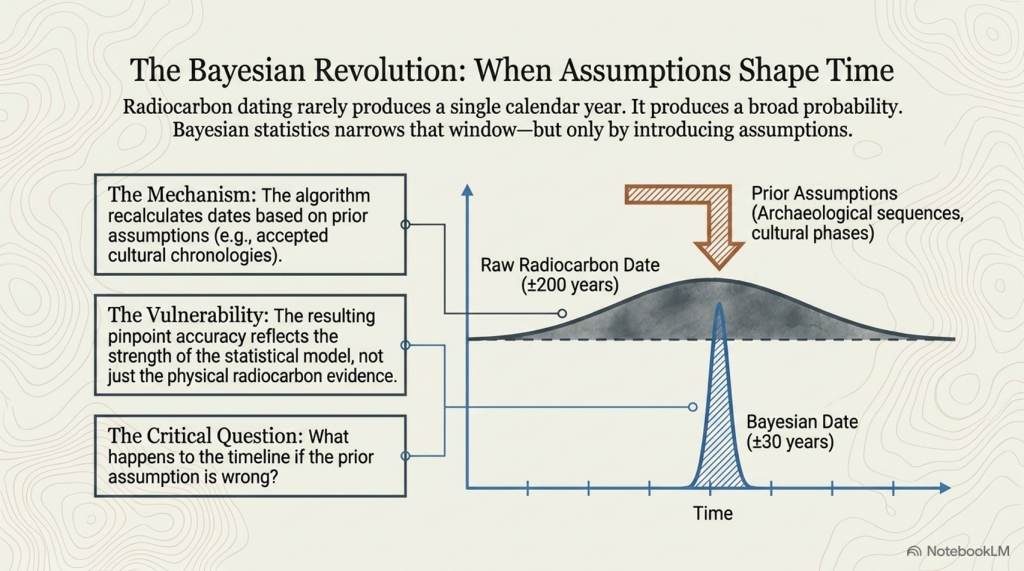
This does not mean the conclusions are wrong. In many cases they are entirely justified and scientifically robust. What it does mean is that the final chronology is no longer based solely upon direct radiocarbon measurements. It is a statistical reconstruction that combines measured evidence with informed archaeological assumptions.
This distinction is crucial because Bayesian outputs are often presented to the public as if they were direct observations. A published date range may appear highly precise, yet that precision frequently reflects the strength of the statistical model as much as the underlying radiocarbon evidence itself. Few readers realise that changing the assumptions within the model can alter the resulting chronology.
The same principle now extends far beyond radiocarbon dating. Bayesian methods are increasingly used throughout archaeology, from estimating population movements and cultural transitions to integrating genetic, environmental and archaeological datasets. As these models become more sophisticated, archaeology has gradually shifted away from relying solely on direct observations towards interpreting the past through increasingly complex statistical frameworks.
None of this diminishes the value of Bayesian analysis. It remains one of the most important advances in archaeological science. But it is essential to recognise what it actually produces. Bayesian modelling provides the most probable interpretation of the available evidence—not direct evidence itself. Understanding that distinction is fundamental if we are to separate measured data from the statistical models used to explain it.
3. When Models Begin Reinforcing Models
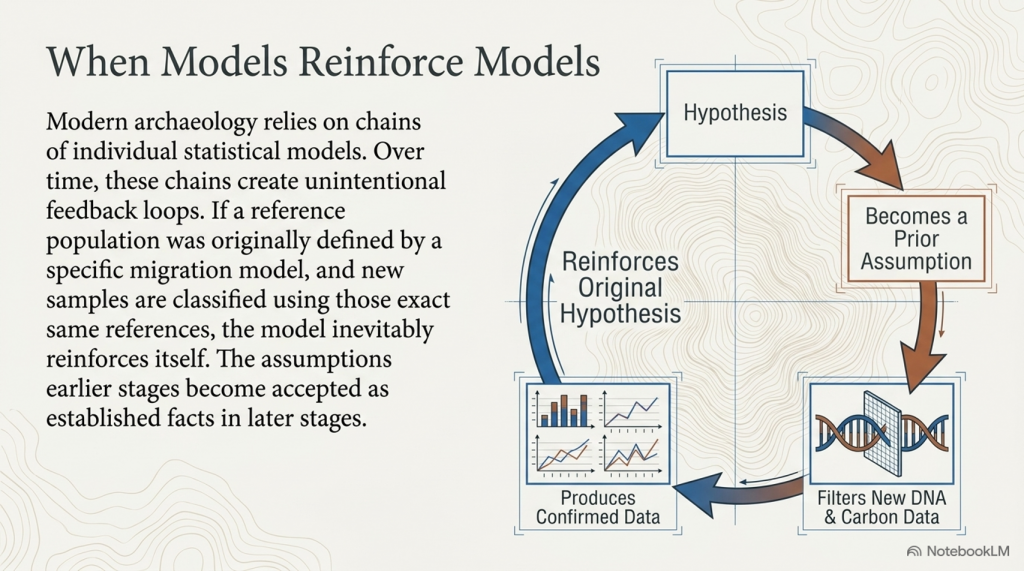
Modern archaeology has become increasingly dependent upon sophisticated statistical techniques. Individually, these methods are scientifically sound and have transformed our understanding of the past. The problem arises when the output from one statistical model becomes the starting assumption for the next. Over time, a chain of individually reasonable analyses can unintentionally create a feedback loop in which the original hypothesis appears to gather ever-increasing support.
Consider how a typical prehistoric individual is interpreted today.
The process begins with a degraded ancient DNA sample recovered from an archaeological site. Because much of the genome has been lost over thousands of years, statistical reconstruction is used to estimate the missing genetic information. The resulting genome is then compared against previously identified reference populations to determine the individual’s closest genetic affinities.
At the same time, the skeleton is dated using radiocarbon analysis. Rather than relying solely on the measured radiocarbon range, Bayesian modelling is frequently used to combine those dates with archaeological assumptions about site sequences, cultural phases or burial relationships. This produces a more precise—but still statistical—chronology.
Finally, the reconstructed genome and the refined chronology are interpreted within existing archaeological models. If the individual’s ancestry resembles a recognised population associated with a particular migration, the result is often presented as further evidence supporting that migration. Future ancient DNA discoveries are then compared against this growing body of interpreted data, using the same reference populations and the same chronological frameworks.
The process can be summarised as follows:
Ancient DNA
        ↓
Statistical reconstruction
        ↓
Bayesian dating
        ↓
Reference populations
        ↓
Migration hypothesis
        ↓
Future DNA interpreted using the same model
        ↓
Model appears confirmed
None of these individual steps is inherently flawed. Statistical reconstruction is essential when dealing with incomplete genomes. Bayesian analysis is one of archaeology’s most powerful chronological tools. Reference populations are indispensable for interpreting genetic relationships. Each method has been developed for good scientific reasons.
The difficulty arises when the assumptions embedded within earlier stages gradually become accepted as established facts within later stages. If the reference populations themselves were originally defined using a particular migration model, and future samples are classified by comparison with those same populations, the model inevitably begins to reinforce itself. New discoveries are no longer assessed entirely independently—they are interpreted within the framework created by previous statistical analyses.
This is not scientific misconduct, nor does it imply that archaeologists deliberately manipulate evidence. It is a recognised challenge in many scientific disciplines where models are repeatedly refined using earlier model outputs. Unless alternative hypotheses are actively tested, there is always a risk that one interpretation becomes increasingly self-supporting simply because new evidence is examined through the same analytical lens.
The history of science contains many examples of this phenomenon. Established models often appear increasingly secure until new evidence emerges that was never anticipated by the original framework. The recent discovery of Mesolithic R1b individuals illustrates exactly why this matters. These discoveries were unexpected because they lay outside the assumptions of the prevailing migration narrative. Rather than fitting neatly into the existing model, they force archaeologists to reconsider some of the assumptions upon which that model was originally built.
Good science depends on continually testing its own foundations. Statistical models are invaluable tools for interpreting incomplete evidence, but they must never become immune to challenge. Their purpose is to explain the evidence—not to determine in advance what the evidence is expected to show.
4. Britain’s Oldest R1b Changes the Starting Point
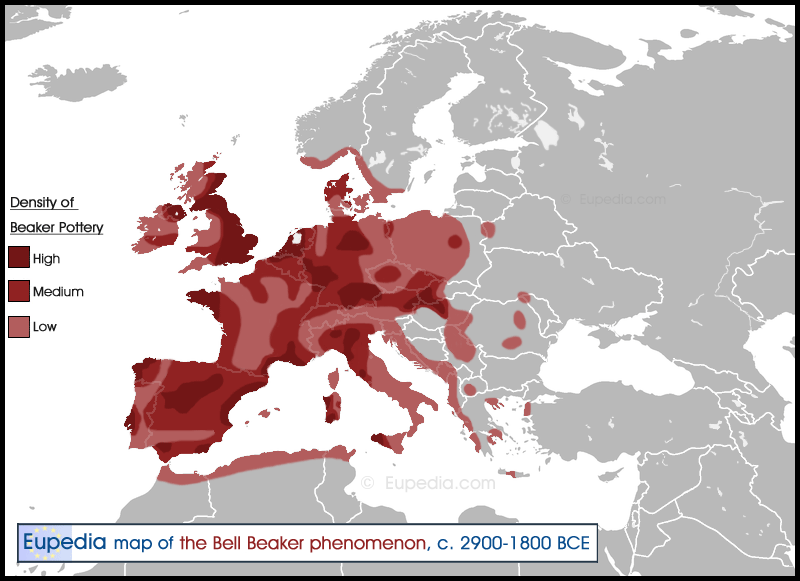
For more than two decades, the dominant interpretation of Britain’s prehistoric genetic history has been relatively straightforward. The R1b Y-chromosome lineage, now the most common paternal lineage in Britain and much of Western Europe, was widely regarded as having arrived with populations associated with the Bell Beaker phenomenon around 2500 BC. Within this framework, the appearance of R1b was seen as one of the principal pieces of evidence supporting a substantial migration into Britain during the Early Bronze Age.
That interpretation rested upon the evidence available at the time.
Recent discoveries, however, have fundamentally altered the starting point of the discussion.
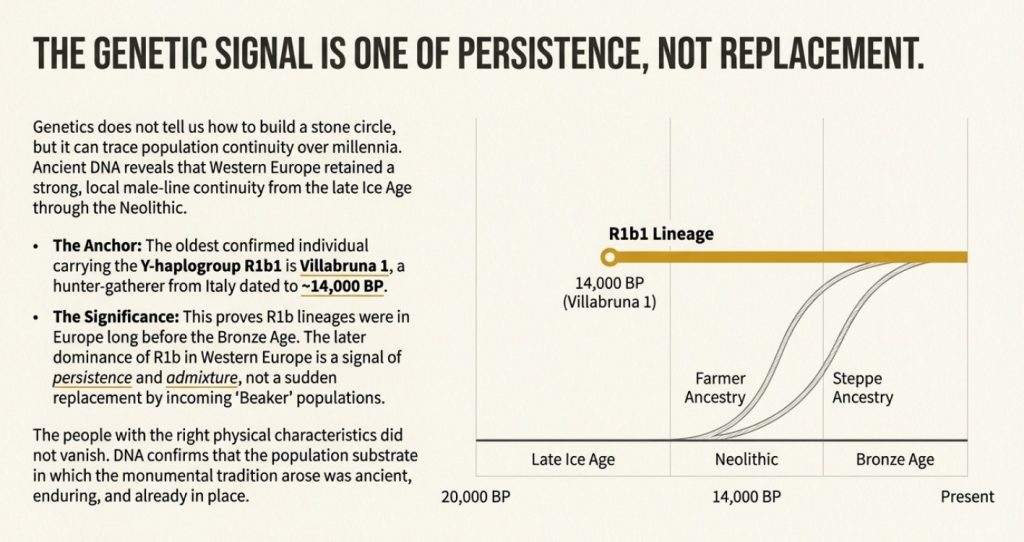
The identification of an R1b lineage from Aveline’s Hole in Somerset, dating to the Mesolithic, demonstrates that R1b was already present in Britain thousands of years before the emergence of Bell Beaker culture. Instead of appearing around 2500 BC, R1b is now documented in Britain several millennia earlier, forcing archaeologists to reconsider one of the key assumptions underpinning the traditional migration narrative.
This discovery should not be overstated. A single Mesolithic R1b individual does not demonstrate uninterrupted genetic continuity from the Mesolithic to the present day. Nor does it prove that later migrations did not occur. Human populations have always moved, mixed and evolved, and no serious interpretation should suggest otherwise.
What the discovery does demonstrate is something equally important.
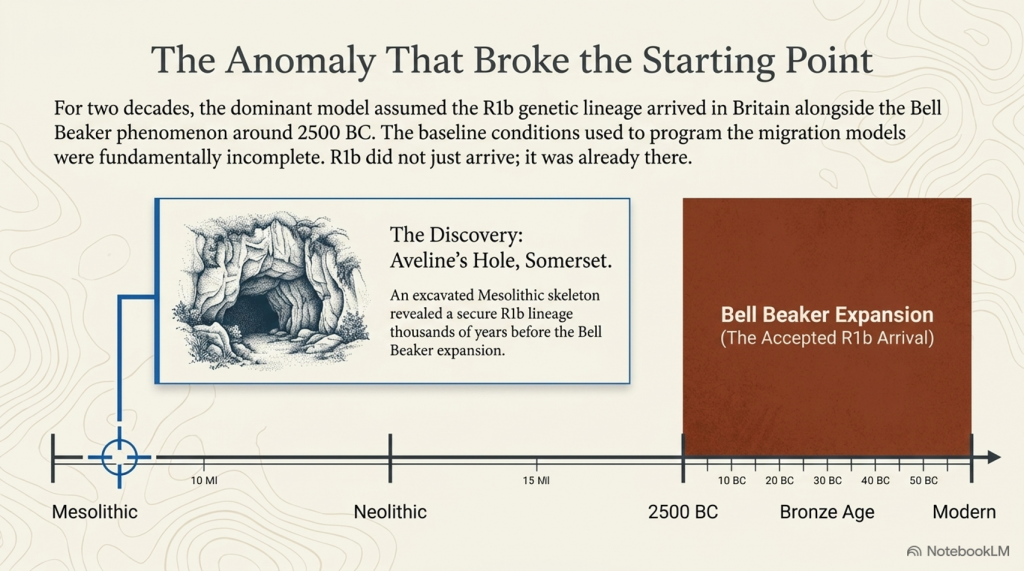
It shows that the previous assumption—that R1b first appeared in Britain with the Bell Beaker phenomenon—was incomplete. The starting conditions upon which many migration models were constructed have now changed. If R1b already existed within Britain before the Beaker period, then its later frequency can no longer be interpreted simply as evidence for its initial arrival. Instead, archaeologists must distinguish between an existing indigenous component and any later additions introduced through migration.
The implications extend well beyond a single archaeological site. Statistical models are only as reliable as the assumptions upon which they are built. If one of those assumptions changes, then every interpretation derived from it deserves to be re-examined. Models that once began with the premise that Britain contained no R1b before 2500 BC must now incorporate evidence showing that this is no longer the case.
This is how science is meant to progress. New discoveries refine existing theories rather than undermine the scientific process itself. The discovery at Aveline’s Hole does not invalidate ancient DNA research or the study of prehistoric migrations. Instead, it demonstrates the importance of continually testing established models against new evidence.
Most importantly, it changes the question archaeologists should now be asking. The debate is no longer whether R1b was present in Britain before the Bell Beaker period—that question has been answered by the evidence. The more important question is how widespread that earlier R1b population was, how it related to later populations, and what proportion of Britain’s paternal ancestry genuinely reflects continuity rather than later admixture.
Changing the starting point does not determine the final answer, but it changes every calculation that follows. That is why the discovery of Britain’s oldest R1b represents far more than a single genetic result—it requires the foundations of the existing migration model to be reconsidered.
One aspect of ancient DNA that deserves further explanation is the treatment of quality-control assessments within published genetic databases.
Ancient human remains vary enormously in the quality of DNA they preserve. Burial environment, groundwater chemistry, microbial activity, repeated handling, excavation history and the age of the specimen all influence how much authentic ancient DNA survives. As a result, some genomes are reconstructed from exceptionally well-preserved material, while others inevitably contain greater uncertainty.
For this reason, databases such as the Allen Ancient DNA Resource (AADR) assign quality assessments to individual samples. These include categories such as Pass, Questionable and Critical, together with a range of technical measurements relating to contamination, sequencing quality and confidence in the reconstructed genome.
These assessments are an essential part of good scientific practice.
However, it is important to distinguish between a quality-control warning and the rejection of a sample.
A quality flag indicates that additional caution is required when interpreting that individual. It does not automatically remove the sample from the published archaeological record, nor does it necessarily invalidate every conclusion derived from that genome. Instead, it provides researchers with the information required to judge the reliability of each result alongside its archaeological context and other independent lines of evidence.
This issue is particularly relevant for some of the earliest British prehistoric remains. Britain’s cave environments have often proved less favourable for long-term DNA preservation than many continental burial contexts, resulting in a number of early British genomes carrying higher quality-control warnings than better-preserved material recovered elsewhere in Europe. Such preservation differences are an expected consequence of taphonomy rather than evidence that British prehistoric individuals should automatically be excluded from analysis.
Accordingly, this investigation has not attempted to conceal or ignore quality assessments. Where such warnings exist, they should form part of the interpretation. Equally, they should not be confused with formal rejection of a published sample. Scientific interpretation requires weighing the genetic evidence together with archaeological context, radiocarbon chronology, preservation quality and the wider geographical distribution of comparable discoveries.
Most importantly, the conclusions presented in this investigation do not depend upon any single individual.
Whether one particular sample is ultimately confirmed, revised or reclassified as analytical techniques continue to improve, the wider pattern remains unchanged. Pre-Bell Beaker R1b lineages are now recorded across multiple regions of Europe by numerous independent excavation teams and laboratories. It is this cumulative archaeological and genetic pattern—not the interpretation of any one specimen—that forms the basis of the discussion presented throughout this article.
As ancient DNA technology continues to advance, individual samples will undoubtedly be refined, reassigned or, in some cases, rejected. That is a normal and healthy part of scientific progress. The purpose of this investigation is therefore not to argue that every published assignment is beyond question, but to demonstrate that the growing body of evidence now warrants a broader re-examination of the demographic models used to explain Europe’s prehistoric genetic history.
5. Then More Early R1b Appeared Across Europe
Had the discovery of Britain’s Mesolithic R1b at Aveline’s Hole remained an isolated case, archaeologists might reasonably have regarded it as an exceptional anomaly requiring further investigation. Science often encounters unusual discoveries that ultimately prove to have little wider significance. However, that is no longer the situation.
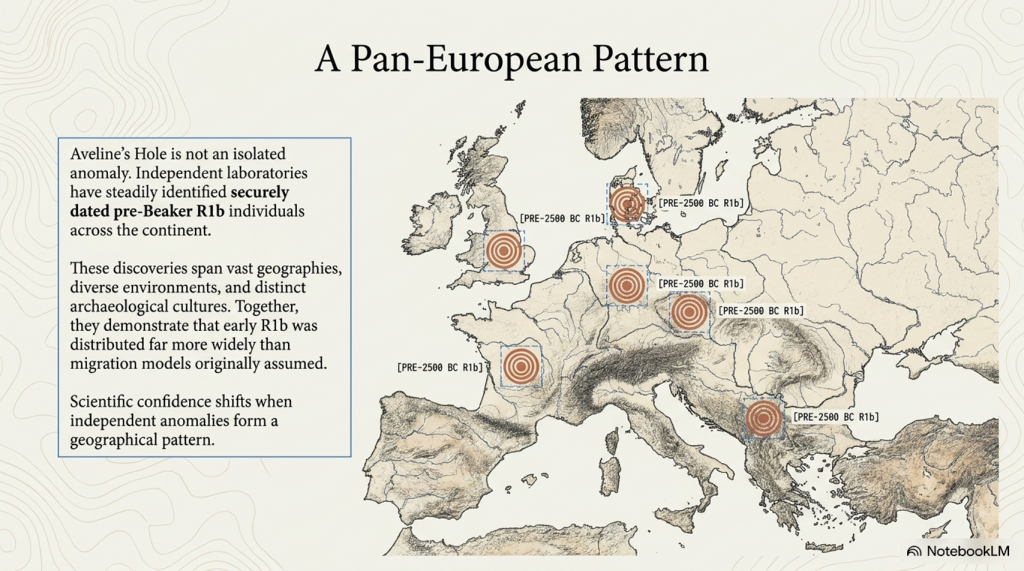
Over the past few years, the number of securely identified pre-Beaker R1b individuals has steadily increased across Europe. Instead of a single unexpected discovery, researchers are now faced with multiple individuals recovered from widely separated regions, all dating to periods long before the Bell Beaker expansion traditionally associated with the arrival of R1b in north-western Europe.
The evidence now extends far beyond Britain.
Pre-Beaker R1b lineages have been identified in Britain, France, Germany, Denmark, the Czech Republic and across parts of the Balkans. These discoveries span different archaeological cultures, different environments and thousands of kilometres of geography. While each individual must be interpreted within its own archaeological context, together they demonstrate that early R1b was distributed far more widely than many migration models originally assumed.
This growing body of evidence is important because scientific confidence increases when independent discoveries begin pointing in the same direction. A single sample can always be questioned. Two or three may still be regarded as unusual. However, as discoveries accumulate across multiple countries, different excavation teams and independent laboratories, the likelihood that they all represent isolated anomalies steadily diminishes.
The geographical distribution is equally revealing. Rather than clustering around a single point of origin or a single archaeological culture, these early R1b individuals are scattered across much of Europe. Such a distribution is more consistent with a lineage that was already present across parts of the continent before the emergence of the Bell Beaker phenomenon than with one suddenly appearing everywhere after 2500 BC.
This does not mean that later migrations did not occur, nor does it suggest that Bell Beaker populations played no role in spreading particular R1b subclades. Human populations have always migrated, mixed and expanded. The archaeological and genetic evidence clearly demonstrates repeated episodes of movement throughout prehistory. What these discoveries challenge is the simpler assumption that R1b itself was entirely absent from north-western Europe until the arrival of Bell Beaker communities.
Perhaps the most significant consequence is methodological rather than historical. As each newly discovered pre-Beaker R1b individual is added to the ancient DNA record, the statistical foundations of existing migration models become increasingly difficult to maintain in their original form. The baseline assumptions are changing because the evidence is changing.
In science, patterns matter far more than isolated discoveries. Today, the appearance of early R1b across Britain, France, Germany, Denmark, the Czech Republic and the Balkans can no longer be dismissed as a collection of unrelated anomalies. Together they form an emerging geographical pattern that deserves serious investigation.
The question facing archaeology is therefore no longer whether pre-Beaker R1b existed—it demonstrably did. The challenge now is to determine how widespread these populations were, how they were connected across Europe, and how much they contributed to the genetic landscape that later archaeological models attributed almost entirely to Bronze Age migration.
6. The Statistical Illusion
For years, the Bell Beaker migration hypothesis has been presented as though the ancient DNA record were a complete picture of prehistoric Europe. It is not. Like every archaeological dataset, it represents only the individuals who survived, were excavated and were selected for genetic analysis. The question is therefore not whether the database is useful—it undoubtedly is—but whether it can be treated as a statistical census of prehistoric Europe.
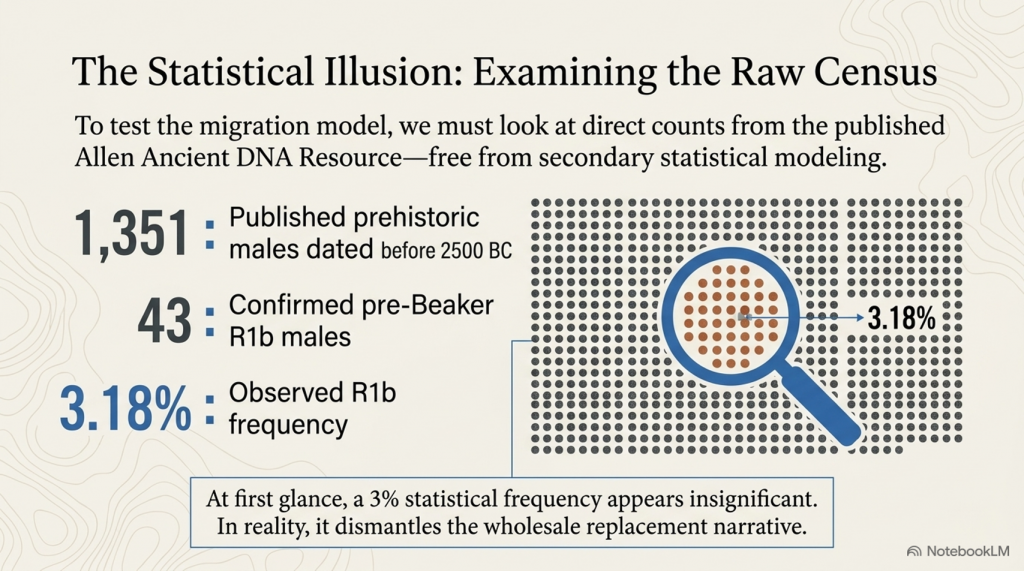
To answer that question, we examined every published prehistoric male dated before 2500 BC contained within the Allen Ancient DNA Resource.
The results are surprisingly straightforward.
| Pre-2500 BC males | 1,351 |
|---|---|
| Confirmed pre-Beaker R1b | 43 |
| Observed R1b frequency | 3.18% |
Unlike many previous discussions, these figures are not derived from statistical modelling or selected case studies. They are direct counts from the published ancient DNA database.
At first glance, 3.18% appears small. In reality, it has profound implications.
Previous chapters estimated the Mesolithic population of Europe at between 250,000 and 500,000 people. If the observed frequency of 3.18% is applied conservatively to those population estimates, it represents an illustrative minimum of approximately 8,000 to 16,000 R1b individuals living across Europe before 2500 BC.
This is no longer a discussion about a handful of exceptional skeletons. It is a population measured in many thousands.
Communities of this size would have been capable of maintaining regional populations, exchanging technology, establishing long-distance trade networks and contributing genetically to neighbouring populations over many generations. They represent a substantial indigenous component of prehistoric Europe rather than isolated anomalies.
Equally important is what this means for the traditional migration narrative. If thousands of R1b individuals were already distributed across Europe before the Bell Beaker horizon, then the later dominance of R1b no longer requires a single overwhelming migration to explain its presence. Indigenous populations already existed upon which later demographic expansion, cultural diffusion and regional admixture could act.

The argument becomes stronger still when sampling bias is considered.
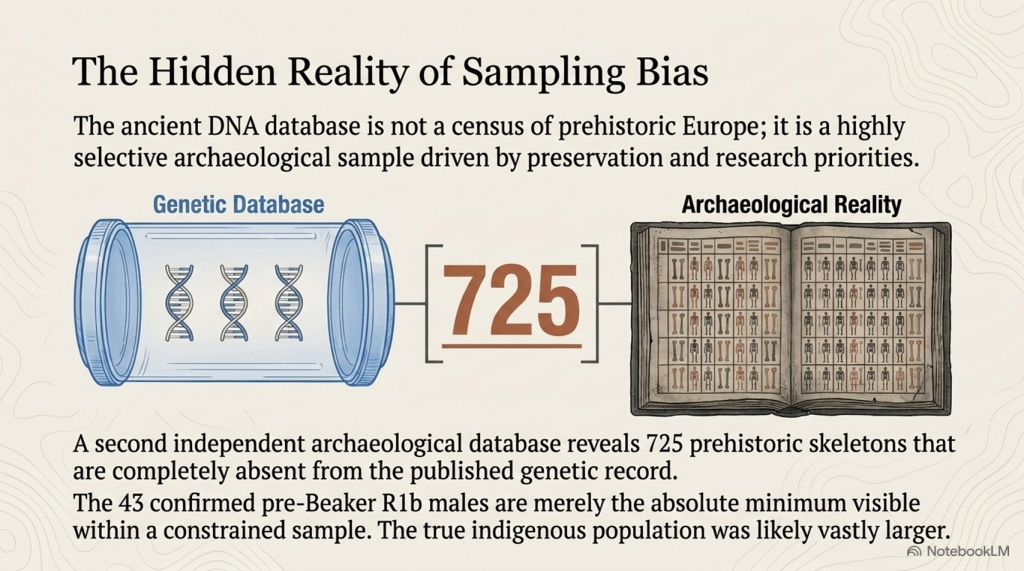
A second independent archaeological database containing 725 prehistoric skeletons demonstrates that hundreds of excavated individuals are absent from the published genetic record. Ancient DNA is therefore not a census of prehistoric Europe but a selective archaeological sample. Preservation conditions, excavation priorities and research objectives all influence which individuals eventually appear in genetic databases.
The consequence is unavoidable. The 43 confirmed pre-Beaker R1b males should not be interpreted as the total prehistoric R1b population. They represent the minimum number currently visible within a highly selective sample. When even this conservative dataset identifies an observed frequency of 3.18%, the mathematical implication is that prehistoric Europe already contained many thousands of R1b individuals long before the Bell Beaker period.
This changes the debate fundamentally. The question is no longer whether pre-Beaker R1b existed—it demonstrably did. The question is whether a continent already containing thousands of indigenous R1b individuals requires a later population replacement to explain the genetic evidence, or whether existing populations, interacting through long-established exchange networks and gradual demographic expansion, provide a more parsimonious explanation.
7. If Not Replacement, Then What?
By this stage, several important conclusions have emerged from the evidence presented throughout this blog.
The ancient DNA database is not a census of prehistoric Europe. Bayesian chronological modelling depends on prior assumptions. Confirmed pre-Bell Beaker R1b individuals are now distributed across much of Europe thousands of years before the traditionally accepted migration horizon. Statistical analysis demonstrates that these individuals were unlikely to represent isolated anomalies, while independent archaeological evidence shows that the published genetic database contains only a fraction of the excavated prehistoric population.
Taken together, these findings raise an important question.
If the traditional model of wholesale population replacement is no longer the only explanation consistent with the available evidence, what alternatives should now be considered?
The first possibility remains the conventional interpretation: large-scale migration accompanied by substantial population replacement. Human migration is a well-documented feature of history, and there is no reason to reject the possibility that movements of people contributed to the changing genetic landscape of prehistoric Europe. However, once measurable indigenous R1b populations are demonstrated before 2500 BC, migration alone can no longer be assumed to explain the entire pattern.
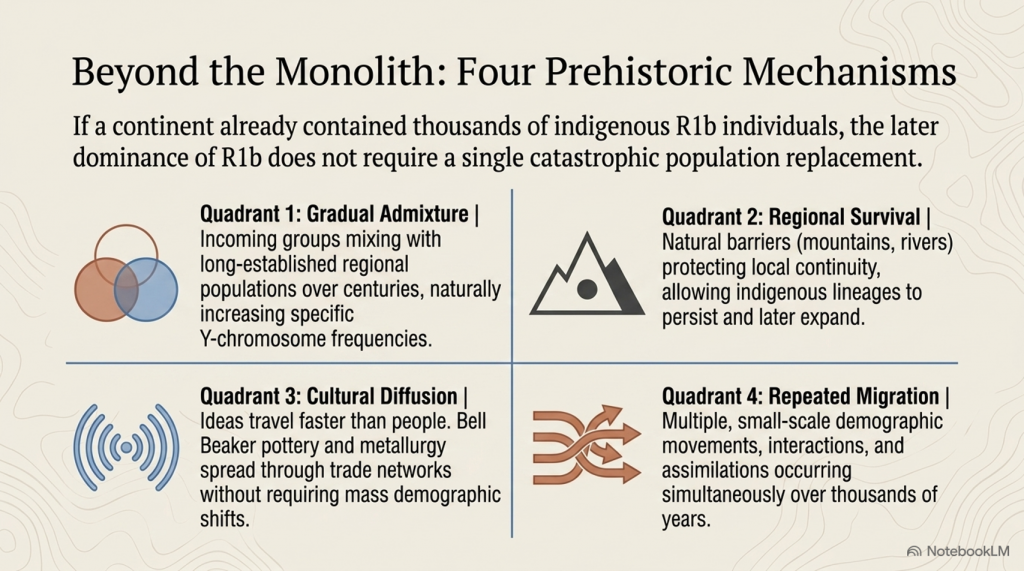
A second possibility is gradual admixture.
Rather than one population replacing another, incoming groups may have mixed with long-established regional populations over many generations. Such a process would naturally produce increasing frequencies of particular Y-chromosome lineages without requiring the near-complete disappearance of those already living across Europe. Genetic expansion through assimilation is a well-recognised demographic process and is consistent with populations interacting over centuries rather than decades.
A third possibility is regional survival.
Europe has always been geographically diverse. Mountain ranges, coastlines, forests and river systems created natural barriers that encouraged local continuity alongside occasional contact. Some regions may have experienced substantial migration, while others retained much of their earlier population. Such a model would explain why genetic continuity appears stronger in some areas than others and why archaeological traditions often persist despite changing material culture.
A fourth possibility is cultural diffusion.
Ideas frequently travel faster than people. Pottery styles, metallurgy, farming techniques and religious beliefs can spread through trade, exchange and social interaction without requiring large-scale migration. The Bell Beaker phenomenon itself displays many of the characteristics of a cultural network, appearing across an enormous geographical area while exhibiting considerable regional variation. If existing communities adopted new technologies and social practices through exchange, cultural change need not imply wholesale demographic replacement.
Finally, Europe may simply have experienced multiple episodes of migration, interaction and assimilation over thousands of years.
Human history is rarely explained by a single event. Climate change, flooding, expanding trade networks, technological innovation and changing social structures would all have encouraged repeated movements of people across the continent. Under such circumstances, the genetic landscape observed today would be the cumulative result of many demographic processes acting together rather than the consequence of one catastrophic migration.
The evidence presented throughout this investigation does not require the rejection of migration as a historical reality. People have always moved, traded, intermarried and established new communities. What it challenges is the assumption that a single migration event provides the only satisfactory explanation for the genetic and archaeological evidence.
Once indigenous R1b populations, sampling bias, demographic modelling and the statistical evidence presented in the previous chapters are taken into account, prehistoric Europe begins to look considerably more complex than a simple story of invasion and replacement.
Perhaps the greatest lesson from ancient DNA is not that one theory has finally solved European prehistory, but that the past was almost certainly more complicated than any single model can adequately describe.
I agree. In fact, I think the book has naturally built towards a final conclusion.
The structure now looks like this:
- Ancient DNA Is Not a Photograph of the Past
- The Bayesian Revolution
- When Models Reinforce Models
- Britain’s Oldest R1b Changes the Starting Point
- Pre-Beaker R1b Across Europe
- The Statistical Illusion
- If Not Replacement, Then What?
- Conclusion – Time to Rethink European Prehistory
I wouldn’t make Chapter 8 long. Around 1,200–1,500 words would be enough. It shouldn’t introduce new evidence. It should simply pull together everything the reader has already seen.
Something like this:

8. Time to Rethink European Prehistory
Every scientific theory begins as a hypothesis.
Some hypotheses survive repeated testing and become stronger with each new discovery. Others require modification as new evidence accumulates. The history of science is not the history of certainty, but of continual refinement as better data become available.
The Bell Beaker migration hypothesis transformed prehistoric archaeology by incorporating ancient DNA into the study of Europe’s past. It provided an elegant explanation for the widespread distribution of R1b lineages after 2500 BC and rapidly became the dominant model for understanding the later Neolithic and Early Bronze Age.
Yet this investigation demonstrates that the foundations of that model are no longer as secure as they once appeared.
The first problem is statistical.
Ancient DNA databases do not represent complete prehistoric populations. They represent only those individuals whose remains survived, were excavated and were selected for genetic analysis. Every conclusion derived from those databases must therefore recognise the limitations imposed by preservation, excavation and research priorities.
The second problem concerns chronology.
Bayesian modelling has undoubtedly improved archaeological dating, but every Bayesian model depends upon the assumptions that define it. When previous interpretations become the priors for new analyses, there is always a risk that established ideas reinforce themselves rather than being independently tested.
The third problem is genetic.
Forty-three confirmed pre-Bell Beaker R1b individuals are now known from across Europe. These individuals pre-date the traditionally accepted migration horizon by centuries and, in many cases, millennia. They are geographically widespread and cannot reasonably be dismissed as isolated anomalies.
When placed within estimated Mesolithic population figures, even the conservative observed frequency recorded in the published DNA database corresponds to many thousands of R1b individuals living across prehistoric Europe. Such populations require explanation in their own right.
Finally, archaeology itself presents a more complex picture than a single migration narrative suggests.
Material culture changes at different rates from genetics. Trade networks expand and contract. Technologies spread between communities. Populations mix, divide and reconnect over generations. Human history is rarely explained by one event, one migration or one cultural horizon.
None of this proves that migration did not occur.
Human migration is one of the constants of prehistory. Europe has always been shaped by movement, exchange and interaction.
What the evidence presented in this book demonstrates is something more modest but, perhaps, more important.
The current evidence no longer requires a single replacement model to explain the emergence of R1b across Europe.
Instead, the available data are equally consistent with a far more dynamic prehistoric landscape in which indigenous populations, regional continuity, repeated migrations, long-distance trade and cultural diffusion all contributed to the genetic and archaeological record we observe today.
Perhaps the greatest lesson from this investigation is methodological.
Science advances not by defending established ideas but by continually testing them against new evidence. Ancient DNA has revolutionised archaeology, yet it remains only one line of evidence. Genetics, archaeology, anthropology, geology, palaeoclimatology and statistics must all be considered together if we are to reconstruct Europe’s past as accurately as possible.
The purpose of this blog has not been to replace one certainty with another.
It has been to demonstrate that important questions remain unresolved, that assumptions deserve re-examination, and that the archaeological record is considerably more complex than the simplified narratives often presented to the public.
The prehistoric peoples of Europe were not merely passive recipients of change arriving from elsewhere. They were active participants in a continent that had already been interconnected for thousands of years through trade, migration, adaptation and cultural exchange.
As new discoveries continue to emerge, the story of prehistoric Europe will undoubtedly evolve again.
The evidence presented here suggests that evolution has already begun.
Appendix A – Confirmed Pre-Bell Beaker R1b Individuals Included in the Present Analysis
The following table lists all 43 confirmed pre-Bell Beaker R1b individuals identified in the Allen Ancient DNA Resource (AADR v66.1, 1240K) and included in the statistical analysis presented in this investigation.
| Individual ID | Site | Country | Date | Y-DNA |
|---|---|---|---|---|
| I6912 | Brunn-Wolfholz | Austria | 5500–4750 BCE | R1b1a1b |
| I14169 | Makotřasy | Czechia | 4300–3500 BCE | R1b |
| I14173 | Makotřasy | Czechia | 4300–3500 BCE | R1b |
| I14176 | Makotřasy | Czechia | 3700–3500 BCE | R1b |
| I15826 | Praha-Jinonice | Czechia | 3634–3382 cal BCE | R1b |
| I15650 | Hostivice-Palouky | Czechia | 3800–3400 BCE | R1b |
| I15648 | Mužský-Hrad | Czechia | 3598–3371 cal BCE | R1b |
| PNL001 | Plotiště nad Labem | Czechia | 2919–2875 cal BCE | R1b1a1b1a1a2a5a~ |
| OBR003 | Obříství | Czechia | 2913–2786 cal BCE | R1b1a1b1a1a2a |
| VLI015 | Vliněves | Czechia | 2900–2650 BCE | R1b1a1b |
| STD002 | Stadice | Czechia | 2885–2639 cal BCE | R1b1a1b1a1a2a |
| VLI092 | Vliněves | Czechia | 2885–2636 cal BCE | R1b1a1b1a1a2a |
| VLI011 | Vliněves | Czechia | 2884–2636 cal BCE | R1b1a1b1a1a2b1 |
| KON003 | Konobrže | Czechia | 2900–2600 BCE | R1b1a1b1a1a |
| NEO866 | Lundby-Falster | Denmark | 3633–3380 cal BCE | R1b |
| BOU38 | Aven de la Boucle | France | 3626–3369 cal BCE | R1b |
| I8055 | Xanton-Chassenon | France | 3081–2901 cal BCE | R1b |
| I0559 | Quedlinburg-9 | Germany | 3646–3528 cal BCE | R1b |
| I1590 | Blätterhöhle Cave | Germany | 3644–3528 cal BCE | R1b |
| I1594 | Blätterhöhle Cave | Germany | 3338–3024 cal BCE | R1b |
| I2762 | Barcehalom | Hungary | 2916–2881 cal BCE | R1b1a1b1b |
| I18101 | Kunhegyes-Nagyállás-halom | Hungary | 2950–2600 BCE | R1b1a1b1b |
| JK2804 | Cannas di Sotto | Italy | 3371–3103 cal BCE | R1b1b |
| I6699 | Teleor-3 | Romania | 5292–5000 cal BCE | R1b1a1b |
| PIE004 | Pietrele Măgura Gorgana | Romania | 4701–4544 cal BCE | R1b1b |
| PIE017 | Pietrele Măgura Gorgana | Romania | 4708–4537 cal BCE | R1b1b |
| PIE023 | Pietrele Măgura Gorgana | Romania | 4603–4447 cal BCE | R1b1b |
| PIE019 | Pietrele Măgura Gorgana | Romania | 5000–4000 BCE | R1b1b |
| PIE064 | Pietrele Măgura Gorgana | Romania | 4589–4409 cal BCE | R1b1a1b |
| PIE026 | Pietrele Măgura Gorgana | Romania | 4546–4370 cal BCE | R1b1b |
| PIE042 | Pietrele Măgura Gorgana | Romania | 4539–4370 cal BCE | R1b |
| PIE013 | Pietrele Măgura Gorgana | Romania | 4536–4362 cal BCE | R1b |
| I23123 | Urziceni | Romania | 4400–3500 BCE | R1b |
| I12823 | Smeeni | Romania | 3300–2500 BCE | R1b1a1b |
| I10499 | Rahman | Romania | 2896–2677 cal BCE | R1b1a1b1b |
| I10500 | Rast-Măgura-Barburlui | Romania | 2893–2674 cal BCE | R1b1a1 |
| ATP3 | El Portalón Cave | Spain | 3516–3365 cal BCE | R1b1a1b |
| ART038 | Arslantepe | Turkey | 3365–3102 cal BCE | R1b1a2a |
| I3035 | Fox Holes Cave | United Kingdom | 4000–3500 BCE | R1b1a1b1a1a1c1a2b |
| I2611 | Summerhill | United Kingdom | 3092–2905 cal BCE | R1b1a1b1a1a2c1a1f1a1 |
| M96 | Schela Cladovei | Romania | 7250–6500 BCE | R1b |
| M95 | Schela Cladovei | Romania | 7125–6603 cal BCE | R1b |
| OC | Ostrovul Corbului | Romania | 7022–6485 cal BCE | R1b |
Data source: Allen Ancient DNA Resource (AADR), Version 66.1 (1240K). Table compiled from the filtered dataset used in the present analysis, including all confirmed pre-Bell Beaker R1b individuals dated before the Bell Beaker horizon.
PODCAST

Author’s Biography

Robert John Langdon, a polymathic luminary, emerges as a writer, historian, and eminent specialist in LiDAR Landscape Archaeology.
His intellectual voyage has been interwoven with stints as an astute scrutineer in government and grand corporate bastions, a tapestry spanning British Telecommunications, Cable and Wireless, British Gas, and the esteemed University of London.
A decade hence, Robert’s transition into retirement unfurled a chapter of insatiable curiosity. This phase saw him immerse himself in Politics, Archaeology, Philosophy, and the enigmatic realm of Quantum Mechanics. His academic odyssey traversed the venerable corridors of knowledge hubs such as the Museum of London, University College London, Birkbeck College, The City Literature Institute, and Chichester University.
In the symphony of his life, Robert is a custodian of three progeny and a pair of cherished grandchildren. His sanctuary lies ensconced in the embrace of West Wales, where he inhabits an isolated cottage, its windows framing a vista of the boundless sea – a retreat from the scrutinising gaze of Her Majesty’s Revenue and Customs, an amiable clandestinity in the lap of nature.
Exploring Prehistoric Britain: A Journey Through Time
My blog delves into the fascinating mysteries of prehistoric Britain, challenging conventional narratives and offering fresh perspectives grounded in cutting-edge research, particularly LiDAR technology. I invite you to explore some key areas of my research. For example, the Wansdyke, often cited as a defensive structure, is re-examined in light of new evidence. I’ve presented my findings in my blog post Wansdyke: A British Frontier Wall – ‘Debunked’, and a Wansdyke LiDAR Flyover video further visualises my conclusions.
My work also often challenges established archaeological dogma. I argue that many sites, such as Hambledon Hill, commonly identified as Iron Age hillforts, are not what they seem. My posts Lidar Investigation Hambledon Hill – NOT an ‘Iron Age Fort’ and Unmasking the “Iron Age Hillfort” Myth explore these ideas in detail and offer an alternative view. Similarly, sites like Cissbury Ring and White Sheet Camp receive re-evaluations based on LiDAR analysis in my posts “Lidar Investigation Cissbury Ring through time” and “Lidar Investigation White Sheet Camp,“ revealing fascinating insights into their true purpose. I have also examined South Cadbury Castle, often linked to the mythical Camelot56.
My research also extends to ancient water management, including the role of canals and other linear earthworks. I have discussed the true origins of Car Dyke in multiple posts, including Car Dyke – ABC News Podcast and Lidar Investigation Car Dyke – North Section, which suggest a Mesolithic origin 2357. I also explore the misidentification of Roman aqueducts, as seen in my posts on the Great Chesters (Roman) Aqueduct. My research has also been greatly informed by my post-glacial flooding hypothesis, which has helped explain landscape transformations over time. I have discussed this hypothesis in several posts, including AI now supports my Post-Glacial Flooding Hypothesis and Exploring Britain’s Flooded Past: A Personal Journey
Finally, my blog also investigates prehistoric burial practices, as seen in Prehistoric Burial Practices of Britain and explores the mystery of Pillow Mounds, often mistaken for medieval rabbit warrens, but with a potential link to Bronze Age cremation in my posts: Pillow Mounds: A Bronze Age Legacy of Cremation? and The Mystery of Pillow Mounds: Are They Really Medieval Rabbit Warrens?. My research also includes astronomical insights into ancient sites, for example, in Rediscovering the Winter Solstice: The Original Winter Festival. I also review new information about the construction of Stonehenge in The Stonehenge Enigma.
Further Reading
For those interested in British Prehistory, visit www.prehistoric-britain.co.uk, a comprehensive resource featuring an extensive collection of archaeology articles, modern LiDAR investigations, and groundbreaking research. The site also includes insights and excerpts from the acclaimed Robert John Langdon Trilogy, a series of books that explore Britain during the Prehistoric period. Titles in the trilogy include The Stonehenge Enigma, Dawn of the Lost Civilisation, and The Post-Glacial Flooding Hypothesis, which offer compelling evidence of ancient landscapes shaped by post-glacial flooding.
To further explore these topics, Robert John Langdon has developed a dedicated YouTube channel featuring over 100 video documentaries and investigations that complement the trilogy. Notable discoveries and studies showcased on the channel include 13 Things that Don’t Make Sense in History and the revelation of Silbury Avenue – The Lost Stone Avenue, a rediscovered prehistoric feature at Avebury, Wiltshire.
In addition to his main works, Langdon has released a series of shorter, accessible publications, ideal for readers delving into specific topics. These include:
- The Ancient Mariners
- Stonehenge Built 8300 BCE
- Old Sarum
- Prehistoric Rivers
- Dykes, Ditches, and Earthworks
- Echoes of Atlantis
- Homo Superior
- 13 Things that Don’t Make Sense in History
- Silbury Avenue – The Lost Stone Avenue
- Offa’s Dyke
- The Stonehenge Enigma
- The Post-Glacial Flooding Hypothesis
- The Stonehenge Hoax
- Dawn of the Lost Civilisation
- Darwin’s Children
- Great Chester’s Roman Aqueduct
- Wansdyke
For active discussions and updates on the trilogy’s findings and recent LiDAR investigations, join our vibrant community on Facebook. Engage with like-minded enthusiasts by leaving a message or contributing to debates in our Facebook Group.
Whether through the books, the website, or interactive videos, we aim to provide a deeper understanding of Britain’s fascinating prehistoric past. We encourage you to explore these resources and uncover the mysteries of ancient landscapes through the lens of modern archaeology.
For more information, including chapter extracts and related publications, visit the Robert John Langdon Author Page. Dive into works such as The Stonehenge Enigma or Dawn of the Lost Civilisation, and explore cutting-edge theories that challenge traditional historical narratives.
Other Blogs
1
a
- AI now Supports – Homo Superior
- AI now supports my Post-Glacial Flooding Hypothesis
- Alexander the Great sailed into India – where no rivers exist today
- Ancient Secrets of Althorp – debunked
- Antler Picks built Ancient Monuments – yet there is no real evidence
- Antonine Wall – Prehistoric Canals (Dykes)
- Archaeological ‘pulp fiction’ – has archaeology turned from science?
- Archaeological Pseudoscience
- Archaeology in the Post-Truth Era
- Archaeology: A Bad Science?
- Archaeology: A Harbour for Fantasists?
- Archaeology: Fact or Fiction?
- Archaeology: The Flaws of Peer Review
- Archaeology’s Bayesian Mistake: Stop Averaging the Past
- Are Raised Beaches Archaeological Pseudoscience?
- Atlantis Found: The Mathematical Proof That Plato’s Lost City Was Doggerland
- ATLANTIS: Discovery with Dan Snow Debunked
- Avebury Ditch – Avebury Phase 2
- Avebury through time
- Avebury’s great mystery revealed
- Avebury’s Lost Stone Avenue – FREE Flipbook
b
- Battlesbury Hill – Wiltshire
- Beyond Stone and Bone: Rethinking the Megalithic Architects of Northern Europe
- BGS Prehistoric River Map
- Blackhenge: Debunking the Media misinterpretation of the Stonehenge Builders
- Brain capacity (Cro-Magnon Man)
- Britain’s First Road – Stonehenge Avenue
- Britain’s Giant Prehistoric Waterways
- British Roman Ports miles away from the coast
c
- Caerfai Promontory Fort – Archaeological Nonsense
- Car Dyke – ABC News PodCast
- Car Dyke – North Section
- Car Dyke Atlas – Prehistoric Canals – FREE Flipbook
- CASE STUDY – An Inconvenient TRUTH (Craig Rhos Y Felin)
- Case Study – River Avon
- Case Study – Woodhenge Reconstruction
- Chapter 2 – Craig Rhos-Y-Felin Debunked
- Chapter 2 – Stonehenge Phase I
- Chapter 2 – Variation of the Species
- Chapter 3 – Post Glacial Sea Levels
- Chapter 3 – Stonehenge Phase II
- Chapter 7 – Britain’s Post-Glacial Flooding
- Cissbury Ring through time
- Clement Reid, Doggerland, and the Archaeological Establishment
- Cro-Magnon Brain Capacity
- Cro-Magnon Megalithic Builders: Measurement, Biology, and the DNA
- Cro-Magnons – An Explainer
d
- Darwin’s Children – Flipbook
- Darwin’s Children – The Cro-Magnons
- Dawn of the Lost Civilisation – FREE Flipbook
- Dawn of the Lost Civilisation – Introduction
- Digging for Britain – Cerne Abbas
- Digging for Britain Debunked – Cerne Abbas 2
- Digging Up Britain’s Past – Debunked
- DLC Chapter 1 – The Ascent of Man
- Durrington Walls – Woodhenge through time
- Durrington Walls Revisited: Platforms, Fish Traps, and a Managed Mesolithic Landscape
- Dyke Construction – Hydrology 101
- Dykes Ditches and Earthworks
- DYKES of Britain
e
f
g
h
- Hadrian’s Wall – Military Way Hoax
- Hadrian’s Wall – the Stanegate Hoax
- Hadrian’s Wall LiDAR investigation
- Hambledon Hill – NOT an ‘Iron Age Fort’
- Hayling Island Lidar Maps
- Hidden Sources of Ancient Dykes: Tracing Underground Groundwater Fractals
- Historic River Avon
- Hollingsbury Camp Brighton – A Hillfort… or a Forgotten Harbour?
- Hollows, Sunken Lanes and Palaeochannels
- Homo Superior – Flipbook
- Homo Superior – History’s Giants
- How Lidar will change Archaeology
- Hydrology 101 Simplified: Why Britain’s Dykes Worked Without Rivers
i
l
m
- Maiden Castle through time
- Mathematics Meets Archaeology: Discovering the Mesolithic Origins of Car Dyke
- Mesolithic River Avon
- Mesolithic Stonehenge
- Minerals found in Prehistoric and Roman Quarries
- Mining in the Prehistoric to Roman Period
- Mount Caburn through time
- Mysteries of the Oldest Boatyard Uncovered
- Mythological Dragons – a non-existent animal that is shared by the World.
o
- Offa’s Dyke – FREE Flipbook
- Old Sarum Lidar Map
- Old Sarum Through Time…………….
- On Sunken Lands of the North Sea – Lived the World’s Greatest Civilisation.
- OSL Chronicles: Questioning Time in the Geological Tale of the Avon Valley
- Oswestry LiDAR Survey
- Oswestry through time
- Oysters in Archaeology: Nature’s Ancient Water Filters?
p
- Pillow Mounds: A Bronze Age Legacy of Cremation?
- Pinkery Canal
- Plato Was Right: The Archaeological Evidence the Academics Never Expected
- Post Glacial Flooding – Flipbook
- Prehistoric Burial Practices of Britain
- Prehistoric Canals – Wansdyke
- Prehistoric Canals – Wansdyke
- Prehistoric Canals (Dykes) – Great Chesters Aqueduct (The Vallum Pt. 4)
- Prehistoric Canals (Dykes) – Hadrian’s Wall Vallum (pt 1)
- Prehistoric Canals (Dykes) – Offa’s Dyke (Chepstow)
- Prehistoric Canals (Dykes) – Offa’s Dyke (LiDAR Survey)
- Prehistoric Canals (Dykes) – Offa’s Dyke Survey (End of Section A)
- Prehistoric Canals (Dykes) – Wansdyke (4)
- Prehistoric Canals Wansdyke 2
- Professor Bonkers and the mad, mad World of Archaeology
r
- Real-World Confirmation of Post-Glacial Flooding
- Rebirth in Stone: Decrypting the Winter Solstice Legacy of Stonehenge
- Rediscovering the Winter Solstice: The Original Winter Festival
- Rethinking Ancient Boundaries: The Vallum and Offa’s Dyke”
- Rethinking Ogham: Could Ireland’s Oldest Script Have Begun as a Tally System?
- Rethinking The Past: Mathematical Proof of Langdon’s Post-Glacial Flooding Hypothesis
- Rising Evidence, Falling Rivers: The Real Story of Europe’s First Farmers
- Rivers of the Past Were Higher: A Fresh Perspective on Prehistoric Hydrology
s
- Sea Level Changes
- Section A – NY26SW
- Section B – NY25NE & NY26SE
- Section C – NY35NW
- Section D – NY35NE
- Section E – NY46SW & NY45NW
- Section F – NY46SE & NY45NE
- Section G – NY56SW
- Section H – NY56NE & NY56SE
- Section I – NY66NW
- Section J – NY66NE
- Section K – NY76NW
- Section L – NY76NE
- Section M – NY87SW & NY86NW
- Section N – NY87SE
- Section O – NY97SW & NY96NW
- Section P – NY96NE
- Section Q – NZ06NW
- Section R – NZ06NE
- Section S – NZ16NW
- Section T – NZ16NE
- Section U – NZ26NW & NZ26SW
- Section V – NZ26NE & NZ26SE
- Silbury Avenue – Avebury’s First Stone Avenue
- Silbury Hill
- Silbury Hill / Sanctuary – Avebury Phase 3
- Sky Maps of Prehistoric Britain
- Somerset Plain – Signs of Post-Glacial Flooding
- South Cadbury Castle – Camelot
- Statonbury Camp near Bath – an example of West Wansdyke
- Stone me – the druids are looking the wrong way on Solstice day
- Stone Transportation and Dumb Censorship
- Stonehenge – Monument to the Dead
- Stonehenge Hoax – Dating the Monument
- Stonehenge Hoax – Round Monument?
- Stonehenge Hoax – Summer Solstice
- Stonehenge LiDAR tour
- Stonehenge Phase 1 – 8300 BCE Documentary
- Stonehenge Phase 1 — Britain’s First Monument
- Stonehenge Phase I (The Stonehenge Landscape)
- Stonehenge Solved – Pythagorean maths put to use 4,000 years before he was born
- Stonehenge Through Time
- Stonehenge, Doggerland and Atlantis connection
- Stonehenge: Borehole Evidence of Post-Glacial Flooding
- Stonehenge: Discovery with Dan Snow Debunked
- Stonehenge: The World’s First Computer – FREE Flipbook
- Stonehenge: The Worlds First Computer
- Stonehenge’s The Lost Circle Revealed – DEBUNKED
t
- Ten Reasons Why Car Dyke Blows Britain’s Earthwork Myths Out of the Water
- Ten Things You Didn’t Know About Britain’s Prehistoric Flooded Past
- Ten thousand year old boats found on Northern Europe’s Hillsides
- Ten thousand-year-old boats found on Northern Europe’s Hillsides
- Testing Plato’s Atlantis Against Reality
- The “Hunter-Gatherer” Myth: Why It’s Time to Bury This Outdated Term
- The Ancient Mariners – Flipbook
- The Ancient Mariners – Prehistoric seafarers of the Mesolithic
- The Ascent of Man — From Survival to Systems
- The Beringian Migration Myth: Why the Peopling of the Americas by Foot is Mathematically and Logistically Impossible
- The Bluestone Enigma
- The Bulford Hoax: The “Simpler, Older Stonehenge” That Wasn’t
- The Cheddar Man Hoax
- The Cro-Magnon Cover-Up: How DNA and PR Labels Erased Our Real Ancestry
- The Dolmen and Long Barrow Connection
- The Durrington Mega-Monument Hoax: What Lies Beneath? – Debunked
- The Durrington Walls Hoax – it’s not a henge?
- The Dyke Myth Collapses: Excavation and Dating Prove Britain’s Great Dykes Are Prehistoric Canals
- The First European Smelted Bronzes
- The Fury of the Past: Natural Disasters in Historical and Prehistoric Britain
- The Giant’s Graves of Cumbria
- The Giants of Prehistory: Cro-Magnon and the Ancient Monuments
- The Great Ancient DNA Illusion: How Statistical Models Became Archaeological “Facts”
- The Great Antler Pick Hoax
- The Great Bell Beaker Migration Myth
- The Great Chichester Hoax – A Bridge too far?
- The Great Dorchester Aqueduct Hoax
- The Great Farming Hoax – (Einkorn Wheat)
- The Great Farming Migration Hoax
- The Great Hadrian’s Wall Hoax
- The Great Iron Age Hill Fort Hoax
- The Great Offa’s Dyke Hoax
- The Great Prehistoric Migration Hoax
- The Great Stone Transportation Hoax
- The Great Stonehenge Hoax
- The Great Wansdyke Hoax
- The Henge and River Relationship
- The Logistical Impossibility of Defending Maiden Castle
- The Long Barrow and Dolmen Enigma
- The Long Barrow Mystery
- The Long Barrow Mystery: Unravelling Ancient Connections
- The Lost Island of Avalon – revealed
- The Maiden Way Hoax – A Closer Look at an Ancient Road’s Hidden History
- The Maths – LGM total ice volume
- The Mystery of Pillow Mounds: Are They Really Medieval Rabbit Warrens?
- THE ODYSSEY PROBLEM: WHY DID A WEEK-LONG VOYAGE BECOME A TEN-YEAR EPIC?
- The Old Sarum Hoax
- The Oldest Boat Yard in the World found in Wales
- The Perils of Paradigm Shifts: Why Unconventional Hypotheses Get Branded as Pseudoscience
- The Post-Glacial Flooding Hypothesis – 1/11
- The Post-Glacial Flooding Hypothesis – FREE Flipbook
- The Post-Glacial Flooding Theory
- The Problem with Hadrian’s Vallum
- The Rise of the Cro-Magnon (Homo Superior)
- The Roman Military Way Hoax
- The Silbury Hill Lighthouse?
- The Stone Money – Credit System
- The Stonehenge Avenue
- The Stonehenge Avenue
- The Stonehenge Code: Unveiling its 10,000-Year-Old Secret
- The Stonehenge Crescent: A Monument to a Lost World
- The Stonehenge Enigma – FREE Flipbook
- The Stonehenge Enigma: Part 1/6
- The Stonehenge Hoax – Bluestone Quarry Site
- The Stonehenge Hoax – FREE Flipbook
- The Stonehenge Hoax – FREE Flipbook
- The Stonehenge Hoax – Moving the Bluestones
- The Stonehenge Hoax – Periglacial Stripes
- The Stonehenge Hoax – Station Stones
- The Stonehenge Hoax – Stonehenge’s Location
- The Stonehenge Hoax – The Ditch
- The Stonehenge Hoax – The Slaughter Stone
- The Stonehenge Hoax – The Stonehenge Layer
- The Stonehenge Hoax – Totem Poles
- The Stonehenge Hoax – Woodhenge
- The Stonehenge Hospital
- The Stonehenge Transportation Mystery
- The Subtropical Britain Hoax
- The Troy, Hyperborea and Atlantis Connection
- The Vallum @ Hadrian’s Wall – it’s Prehistoric!
- The Vallum at Hadrian’s Wall Atlas – FREE Flipbook
- The Woodhenge Hoax
- Three Dykes – Kidland Forest
- Thurnam’s 137 Skulls: The Forgotten People Behind Britain’s Megaliths.
- Top Ten Misidentified Fire Beacons in British History
- Troy Debunked – Troy did not exist in Asia Minor, but in fact, the North Sea island of Doggerland
- TSE – DVD Barrows
- TSE DVD – An Inconvenient Truth
- TSE DVD – Antler Picks
- TSE DVD – Avebury
- TSE DVD – Durrington Walls & Woodhenge
- TSE DVD – Dykes
- TSE DVD – Epilogue
- TSE DVD – Stonehenge Phase I
- TSE DVD – Stonehenge Phase II
- TSE DVD – The Post-Glacial Hypothesis
- TSE DVD Introduction
- TSE DVD Old Sarum
- Twigs, Charcoal, and the Death of the Saxon Dyke Myth
w
- Wansdyke – Short Film
- Wansdyke Atlas – FREE Flipbook
- Wansdyke East – Prehistoric Canals
- Wansdyke LiDAR Flyover
- Wansdyke: A British Frontier Wall – ‘Debunked’
- Was Columbus the first European to reach America?
- What Archaeology Missed Beneath Stonehenge
- White Sheet Camp
- Why a Simple Fence Beats a Massive Dyke (and What That Means for History)
- Windmill Hill – Avebury Phase 1
- Winter Solstice – Science, Propaganda and Indoctrination
- Woodhenge – the World’s First Lighthouse?