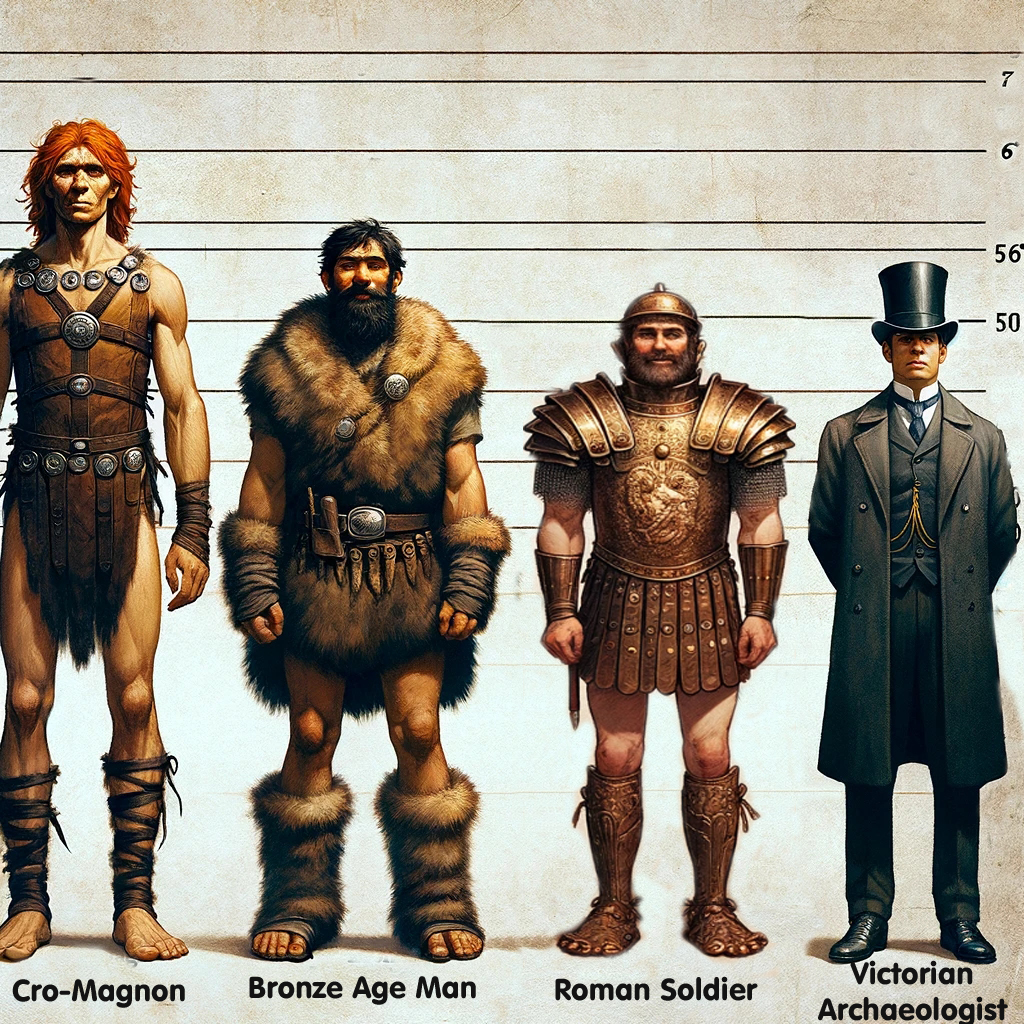
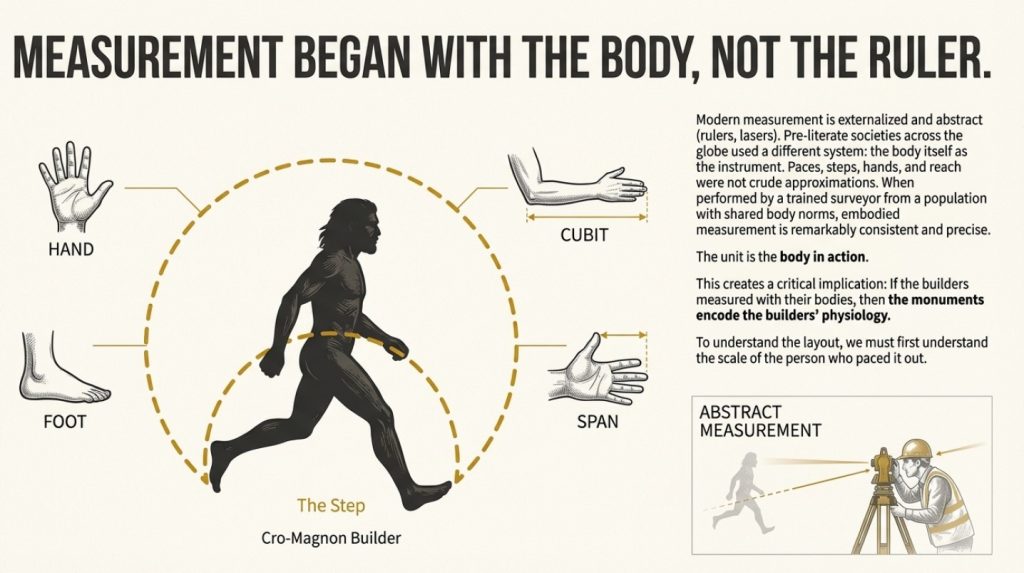
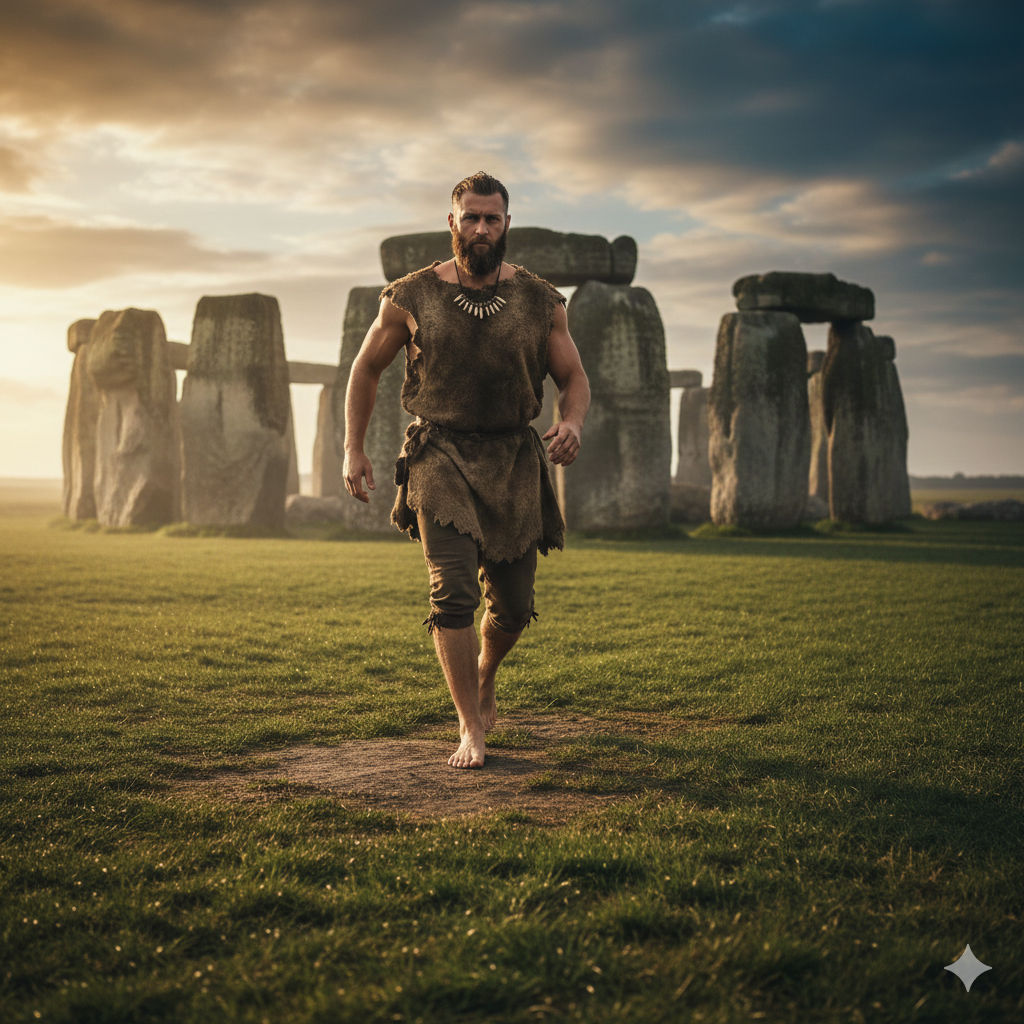
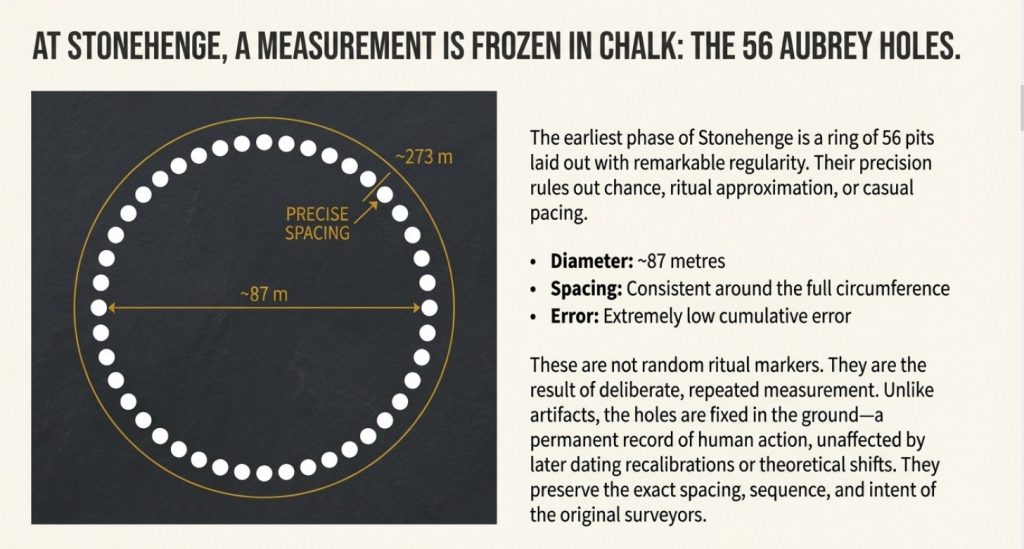
Underestimating the Physical Size of Prehistoric Europeans?

Introduction

Scientific progress often begins with a simple question.

What happens if we revert to the original measurements rather than accept the final calculations?

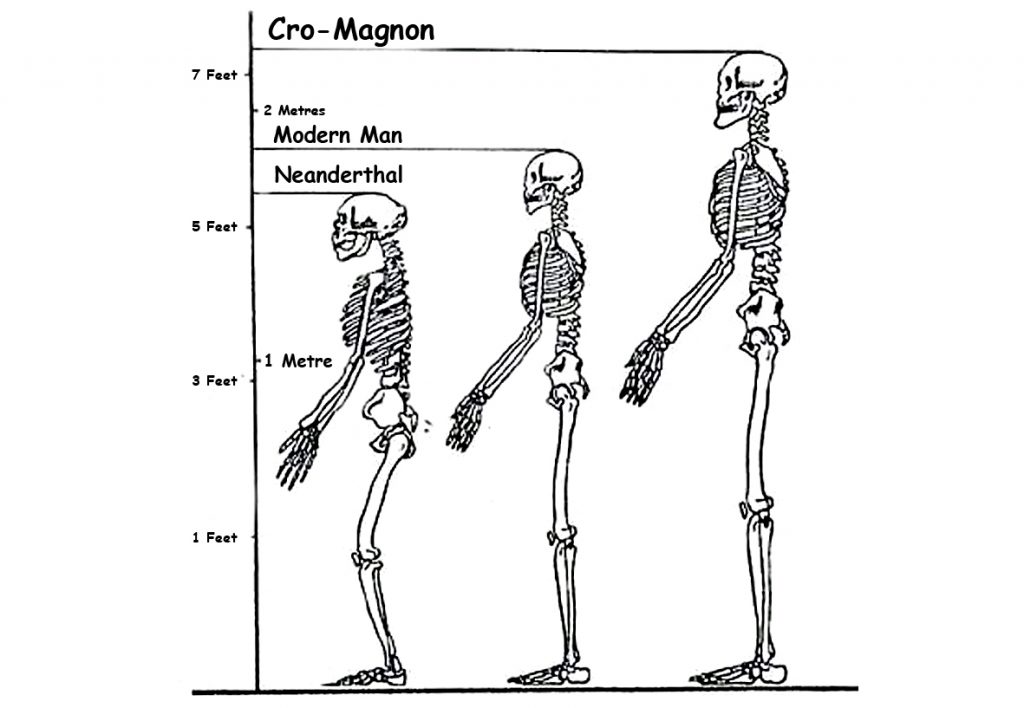
In a previous analysis of the European skeletal database compiled by Christopher Ruff and colleagues, I examined one of the most fundamental characteristics of prehistoric populations—their height. Rather than relying solely on the published stature estimates, I returned to the original long-bone measurements from which those estimates were derived. (Underestimating the Physical Size of Prehistoric Europeans – Cro-Magnons?)

The distinction is important.

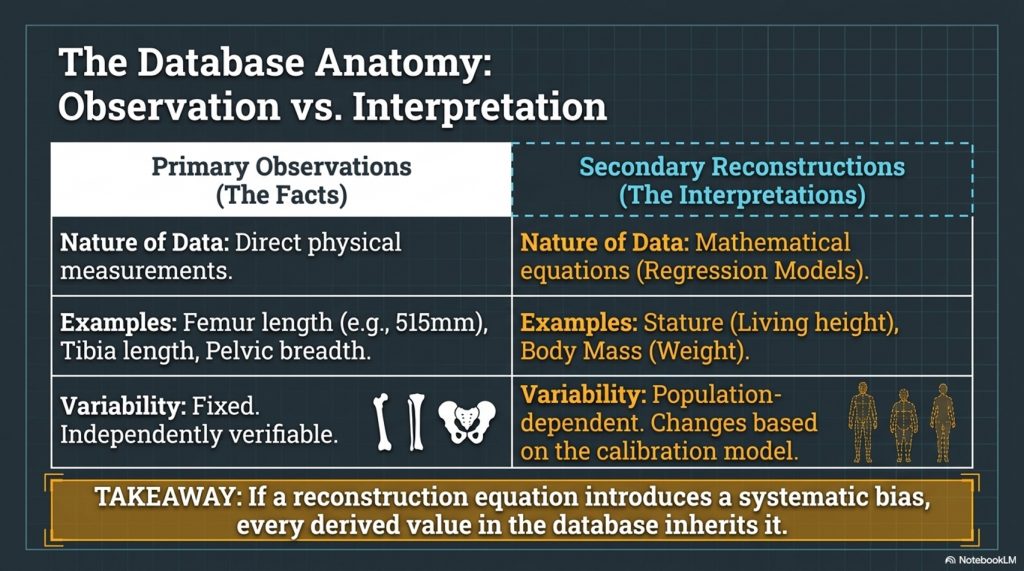
Long-bone measurements are primary observations. They are the direct measurements taken from the skeleton itself. Stature, however, is a secondary calculation produced from those measurements using a reconstruction method. If the reconstruction equation introduces even a small systematic bias, every calculated height in the database will inherit that bias.

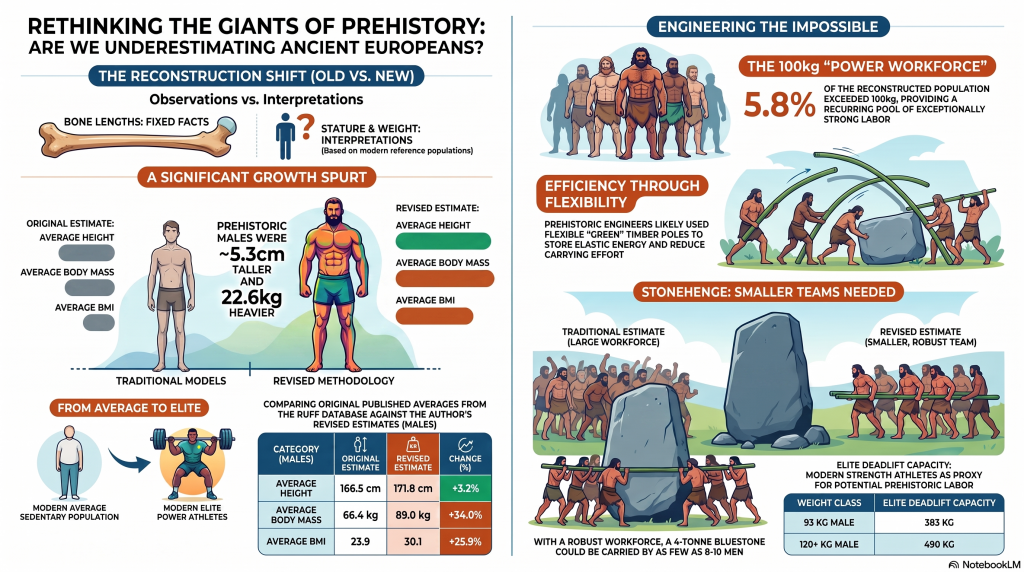
Using the complete long-bone data available for each individual, I recalculated stature across the database. The revised estimates consistently produced taller individuals than the published values. In many cases, the difference was only a few centimetres, but when applied across hundreds of skeletons, the pattern became remarkably consistent. The raw skeletal measurements had not changed. Only the method used to interpret them had.

That naturally raised a second question.
(Underestimating the Physical Size of Prehistoric Europeans - Cro-Magnons?)
(Underestimating the Physical Size of Prehistoric Europeans – Cro-Magnons?)

If Prehistoric Europeans were taller than previously reconstructed, should their estimated body mass be reconsidered as well?

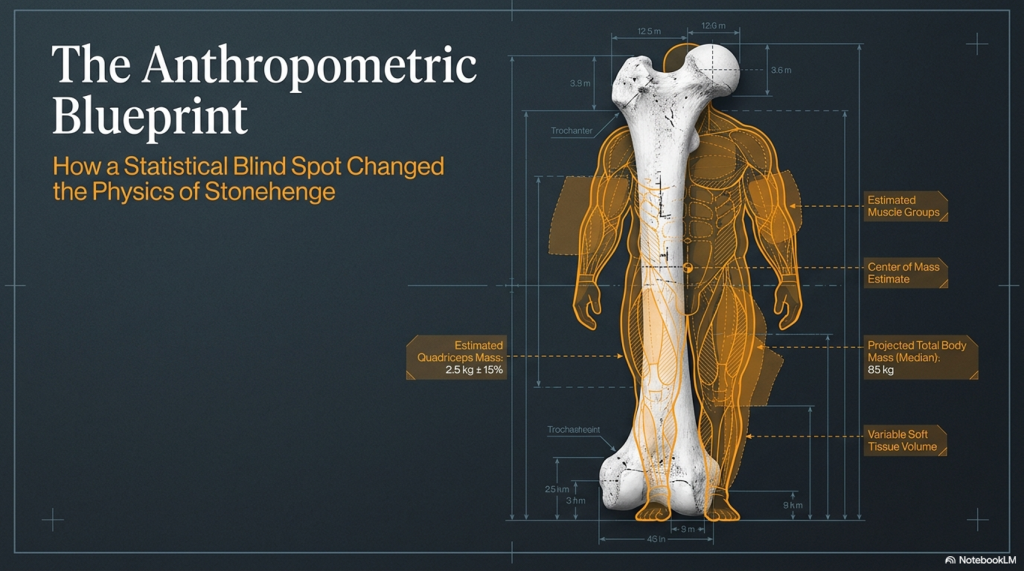
Unlike stature, body mass cannot be measured directly from a skeleton. It is another reconstructed value derived from regression equations using skeletal dimensions. Consequently, if one reconstructed variable proves sensitive to the choice of calculation method, it is reasonable to ask whether another reconstructed variable deserves the same scrutiny.

This blog does not claim that existing anthropological research is incorrect. Christopher Ruff’s European database remains one of the most important resources ever assembled for understanding prehistoric populations, and the underlying skeletal measurements themselves are invaluable. The question is not whether the bones are accurate—they are. The question is whether the mathematical models used to convert those measurements into estimates of living stature and body mass always produce the most realistic representation of prehistoric people.

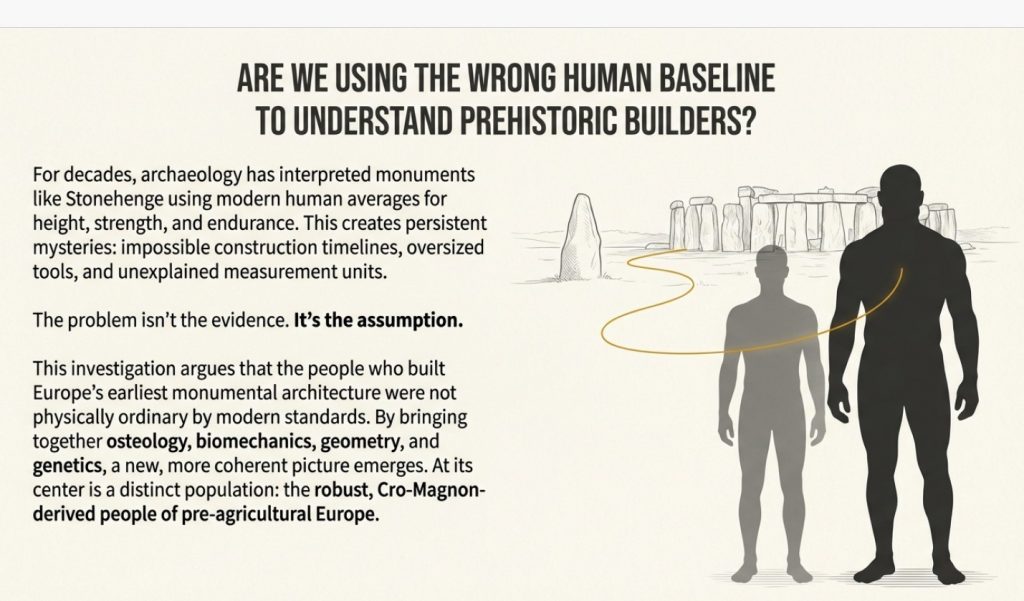
To explore that question, this study compares the revised stature estimates with the physiques of modern elite power athletes—individuals whose lives are shaped by strength, physical labour, repeated loading and muscular development. The comparison is not intended to suggest that prehistoric Europeans were rugby players or American football athletes. Rather, it asks whether people who spent their lives hunting, quarrying stone, digging massive earthworks, and constructing megalithic monuments may have possessed physiques that more closely resembled those of today’s most powerful athletes than those of today’s average sedentary population.

The purpose of this investigation is therefore broader than simply estimating body weight. It begins by examining the methods used to reconstruct prehistoric stature from skeletal remains and explains why those estimates have been recalculated using the complete long-bone measurements available within the database. It then considers the consequences of those revised heights for our understanding of prehistoric physique, comparing the resulting body sizes with those of modern elite power athletes. The objective is not to replace one assumption with another, but to test whether Europe’s prehistoric populations have been consistently reconstructed as smaller and lighter than the evidence itself may actually suggest.

(Underestimating the Physical Size of Prehistoric Europeans - Cro-Magnons?)
(Underestimating the Physical Size of Prehistoric Europeans – Cro-Magnons?)

1. The Biggest Europeans Ever Measured?

How large were the people who built prehistoric Europe?

It is a deceptively simple question, yet one that influences almost every aspect of archaeology. The physical size of prehistoric people affects our interpretation of hunting, farming, warfare, monument construction, transport, health, nutrition and even social organisation. A population averaging 170 centimetres in height with relatively modest physiques presents a very different picture from one averaging several centimetres taller with substantially greater muscle mass and skeletal robustness.

For decades, one of the principal sources for answering this question has been the European skeletal database compiled by Christopher Ruff and his colleagues. It covers more than 2,000 prehistoric individuals from across Europe and represents one of the most comprehensive collections of human skeletal measurements ever assembled. It has become a cornerstone of biological anthropology, providing researchers with reconstructed estimates of stature and body mass spanning tens of thousands of years.

It is an outstanding piece of scientific work.

However, the database contains two fundamentally different types of information that are often treated as equally certain.

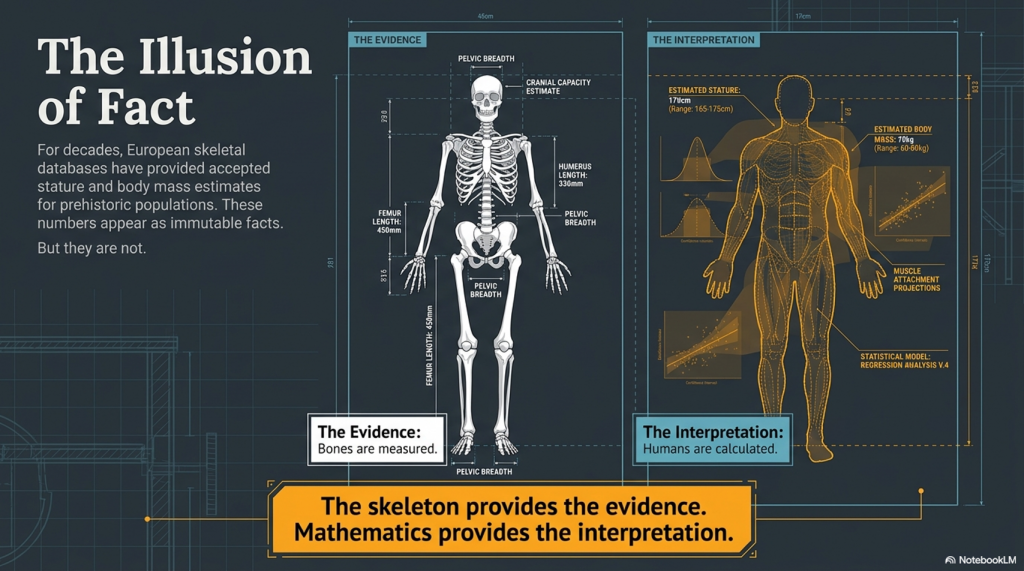
The first consists of direct skeletal measurements. These include the lengths of the femur, tibia, humerus and radius, together with dozens of other anatomical dimensions. These measurements are objective observations. Once recorded correctly, they remain fixed and can be independently verified by any researcher examining the same skeleton.

The second consists of reconstructed values. Stature and body mass cannot be measured directly from ancient skeletons. Instead, they are calculated using mathematical equations developed from modern reference populations. These reconstructions are not observations; they are interpretations of the underlying skeletal measurements.

That distinction is crucial.

If the original bone measurements are accurate, but the mathematical model used to reconstruct living height or body mass introduces a systematic bias, then every derived value produced by that model will inherit the same bias. The bones remain correct. Only the interpretation changes.

This study revisits those derived values.

Rather than accepting the published reconstructions at face value, it returns to the original skeletal measurements and asks a straightforward scientific question: if we rebuild prehistoric stature directly from the complete long-bone evidence, and then reassess body mass using those revised heights, do we arrive at a different picture of prehistoric Europeans?

The answer, as we shall see, is that we do.

Not because the skeletons have changed.

Not because the archaeological evidence has changed.

But the mathematics used to interpret that evidence can change our perception of the people themselves.
(Underestimating the Physical Size of Prehistoric Europeans - Cro-Magnons?)
(Underestimating the Physical Size of Prehistoric Europeans – Cro-Magnons?)

2. Raw Measurements vs Mathematical Reconstructions

Before examining prehistoric height and body mass, it is important to understand exactly what the European skeletal database contains. Although it is often referred to simply as a database of prehistoric people, it actually contains two fundamentally different categories of information. One consists of direct physical measurements taken from the skeleton itself. The other consists of biological characteristics reconstructed from those measurements using statistical equations.

Confusing these two categories can easily lead to the impression that every number in the database carries the same level of certainty. It does not.

Primary Observations – The Facts

Primary observations are the measurements recorded directly from the skeleton. They are physical facts that can be independently checked by any researcher examining the same remains. If the femur measures 515 millimetres, then that is an observation, not an opinion. It does not depend upon any mathematical model or statistical assumption.

Examples of these direct measurements include:

  • Femur length
  • Tibia length
  • Humerus length
  • Radius length
  • Femoral head diameter
  • Pelvic breadth
  • Sacral dimensions
  • Joint dimensions
  • Numerous other anatomical measurements

These measurements form the foundation of the entire database. They are objective data collected from the archaeological remains themselves and represent the closest information we have to the original living individual.

Secondary Reconstructions – The Interpretations

Other values within the database cannot be measured directly because they no longer exist.

A skeleton cannot tell us exactly how tall a person stood when alive, nor can it reveal their body weight. Instead, these characteristics are estimated using mathematical equations developed from modern reference populations.

The two most familiar examples are:

  • Stature (estimated living height)
  • Body Mass (estimated living weight)

These values are not measurements; they are reconstructions.

They represent the best estimate produced by a particular mathematical model using the available skeletal evidence. Different equations applied to the same skeleton can therefore produce different estimates, even when the underlying bone measurements remain identical.

This distinction is fundamental.

Changing a femur length would require discovering that the original measurement was wrong. Changing a stature estimate simply requires using a different reconstruction equation. The skeleton remains exactly the same.

Why This Matters

Many readers understandably assume that a published height of 180 centimetres is a direct observation from the archaeological record. It is not.

It is the output of a reconstruction model.

Likewise, a reconstructed body mass of 80 kilograms was not measured from the skeleton. It is another calculated estimate derived from anatomical dimensions.

This difference between observation and interpretation lies at the heart of scientific investigation. Observations provide the evidence. Mathematical models attempt to explain what those observations mean.

As new methods become available, those models can be tested, refined, and, where appropriate, improved without altering a single bone.

That is precisely the approach adopted in this study.

The raw skeletal measurements remain exactly as recorded in the original database. Nothing has been altered, discarded or remeasured. Instead, the analysis returns to those original observations and asks whether alternative reconstruction methods produce a more realistic picture of prehistoric Europeans. If they do, then it is not the evidence that has changed—it is simply our interpretation of it.
(Underestimating the Physical Size of Prehistoric Europeans - Cro-Magnons?)
(Underestimating the Physical Size of Prehistoric Europeans – Cro-Magnons?)

3. Regression Models – Where Prehistoric People Are Reconstructed

One of the greatest misconceptions in archaeology is that prehistoric height and body mass are measurements taken directly from skeletons.

They are not.

The skeleton provides the evidence. Mathematics provides the interpretation.

This distinction lies at the heart of biological anthropology and is fundamental to understanding every stature and body-mass estimate published for prehistoric populations.

The Skeleton Never Changes

Imagine a femur measuring 510 mm.

That measurement is a physical fact.

Every competent osteologist measuring the same bone should obtain essentially the same value, allowing only for tiny measurement differences of a fraction of a millimetre.

The same applies to every other anatomical measurement within the database:

  • Femur length
  • Tibia length
  • Humerus length
  • Radius length
  • Femoral head diameter
  • Pelvic breadth
  • Joint dimensions

These are observations.

Once recorded correctly, they do not change.

They are the archaeological evidence.

The Living Person Must Be Reconstructed

The difficulty begins when we attempt to recreate the living individual.

A skeleton cannot tell us directly:

  • How tall the person stood.
  • How much they weighed.
  • How much muscle they possessed.
  • How much body fat they carried.

Those characteristics disappeared when the individual died.

To estimate them, anthropologists rely upon regression equations.

Regression analysis is a statistical technique developed by comparing people whose skeletons and living measurements are both known. By examining thousands of modern individuals, relationships can be identified between skeletal dimensions and characteristics such as stature or body mass.

These relationships are then expressed as mathematical equations.

For stature, a simplified example might take the form:

Stature = a + (b × Femur Length)

where a and b are constants derived from the reference population used to construct the equation.

The same principle applies to body mass, except that it is generally reconstructed from measurements such as femoral head diameter, pelvic breadth, and, in some methods, reconstructed stature.

The mathematics is perfectly valid.

The important question is whether the underlying assumptions remain valid when applied to prehistoric Europeans living tens of thousands of years ago.

Every Regression Equation Has Assumptions

Regression equations are not universal laws of nature.

They are statistical models.

Every model depends upon:

  • the reference population from which it was derived,
  • the number of individuals included,
  • their biological characteristics,
  • and the variables selected by the researcher.

If two researchers develop equations using different reference populations, they may legitimately obtain different stature estimates from exactly the same skeleton.

The bone has not changed.

Only the statistical model has changed.

This is not a flaw in anthropology.

It is an unavoidable consequence of reconstructing living people from incomplete archaeological evidence.

Why Recalculate the Database?

This distinction explains the purpose of the present study.

The original Ruff database remains one of the finest collections of prehistoric skeletal measurements ever assembled.

Nothing within the archaeological record has been altered.

Every femur, tibia, humerus and radius remains exactly as originally measured.

The only question is whether a different reconstruction strategy yields a different result.

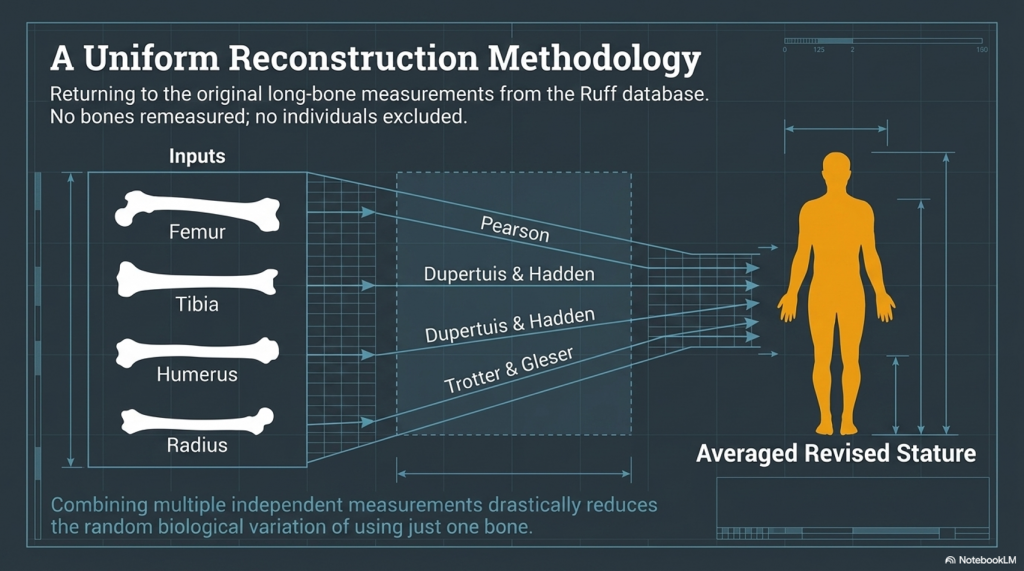
Rather than accepting a single published stature estimate, this study returns to the complete long-bone evidence available for each individual. Independent stature estimates are calculated from each available long bone before combining them into a single revised stature estimate.

The skeletal evidence remains identical.

Only the mathematics changes.

A Scientific Test, Not a Criticism

This distinction is important because it changes the nature of the investigation.

The objective is not to demonstrate that previous anthropologists measured skeletons incorrectly.

They did not.

Nor is it to suggest that regression equations are inherently flawed.

They are indispensable tools in biological anthropology.

Instead, the question is far more straightforward.

If different but equally valid reconstruction methods yield systematically different estimates from the same archaeological evidence, how much confidence should we place in the published averages that have been accepted as descriptions of prehistoric Europeans?

That is the question explored throughout the remainder of this study.

Only after understanding how reconstructed humans are created can we meaningfully examine whether Europe’s prehistoric populations have been consistently portrayed as smaller and lighter than the original skeletal evidence itself may suggest.
(Underestimating the Physical Size of Prehistoric Europeans - Cro-Magnons?)
(Underestimating the Physical Size of Prehistoric Europeans – Cro-Magnons?)

4. How Fixed Is a Reconstructed Human?

At first glance, prehistoric anthropology appears reassuringly precise.

A skeleton is excavated, its bones are measured, regression equations are applied, and the result is presented as a living person—175 centimetres tall, weighing 72 kilograms. Once published, these figures quickly acquire an authority that suggests they are objective facts recovered directly from the archaeological record. They appear in scientific papers, museum displays, documentaries, school textbooks, Wikipedia, and increasingly within artificial intelligence systems. Repeated often enough, they become accepted reality.

Yet there is a fundamental question that is rarely asked.

How fixed is that reconstructed human?

Suppose the same prehistoric skeleton had been analysed not today, but in Victorian Britain shortly after the Cro-Magnon discoveries of the nineteenth century. The femur would still measure exactly the same length. The tibia, humerus and radius would remain unchanged. Every archaeological observation would be identical.

Only one thing would differ.

The modern population is used to calibrate the reconstruction equations.

Victorian Europeans were generally shorter, lighter and lived very different lives from those of today. Had anthropologists developed their regression equations from that population, the resulting prehistoric reconstructions would almost certainly have differed from those produced using modern reference populations.

Now repeat the thought experiment.

Instead of using Victorian Britain, construct the regression equations using modern Dutch populations, which are among the tallest people in the world.

Now repeat the process using populations from East Asia.

Then again, using populations from sub-Saharan Africa.

The prehistoric skeleton has not been altered by a single millimetre.

The femur remains identical.

The tibia remains identical.

Every archaeological observation remains identical.

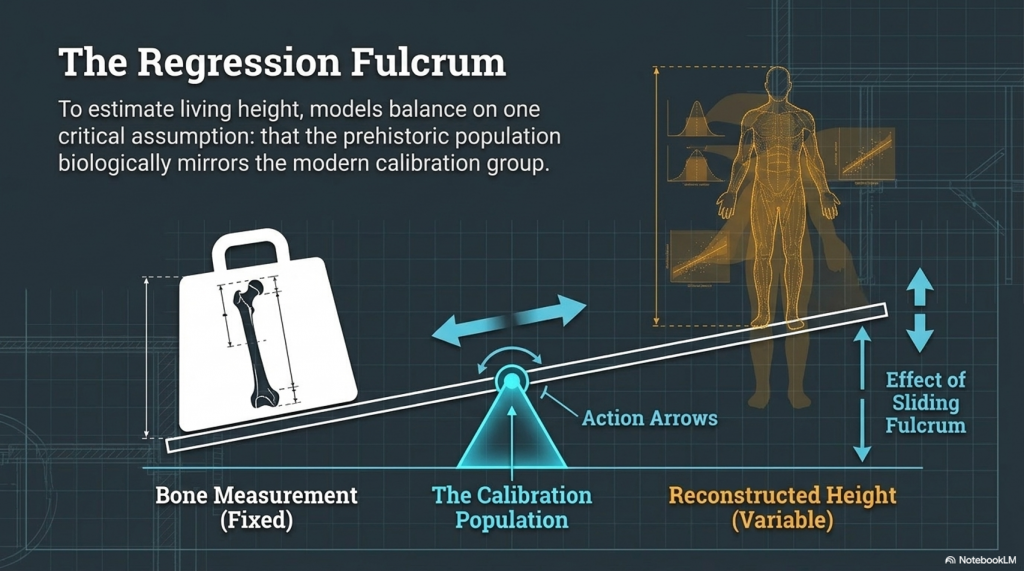
Only the statistical relationship between those bones and the living population has changed.

The reconstructed prehistoric person changes even though the archaeological evidence does not.

This is not a weakness of regression analysis.

It is an unavoidable consequence of how regression models work.

Every regression equation is calibrated against a particular reference population. It assumes that the statistical relationship observed in that population is sufficiently similar to that of the reconstructed archaeological population. If that assumption changes, the reconstructed height, body mass and physique may also change.

Mathematics has not failed.

It has simply produced the result expected from the assumptions built into the model.

This distinction is critical because it changes how we should interpret prehistoric averages.

When we read that Neolithic men averaged 171 centimetres, or that Upper Palaeolithic Europeans averaged 176 centimetres, it is tempting to imagine these values were measured directly from ancient people.

They were not.

They are the outputs of statistical models.

That does not make them incorrect.

It makes them conditional.

Their accuracy depends upon the suitability of the reconstruction method, the calibration population from which the equations were derived, and the assumptions underlying the statistical model itself.

In other words, prehistoric stature is not a fixed archaeological fact preserved within the skeleton.

It is a scientific estimate produced by interpreting the skeleton.

That distinction may appear subtle, but its implications are profound.

If different, equally legitimate reconstruction methods can produce materially different prehistoric populations from exactly the same skeletal evidence, then published averages should never be regarded as immutable truths. They are hypotheses expressed mathematically—often excellent hypotheses, supported by careful science—but hypotheses nonetheless.

This is precisely why returning to the original skeletal measurements is so important.

The bones themselves do not change.

Only our interpretation of them.

The remainder of this study, therefore, asks a simple scientific question.

If we reconstruct Europe’s prehistoric populations using a single, transparent methodology applied consistently across the same skeletal database, does the resulting picture differ from the one that has become widely accepted?
(Underestimating the Physical Size of Prehistoric Europeans - Cro-Magnons?)
(Underestimating the Physical Size of Prehistoric Europeans – Cro-Magnons?)

Illustrative Example: How the Same Skeleton Can Produce Different Prehistoric Humans

The following example is illustrative.

It is not intended to reconstruct a real prehistoric individual. Instead, it demonstrates a fundamental statistical principle: regression equations are calibrated from living populations. If the calibration population changes, the reconstructed prehistoric human also changes—even though the archaeological skeleton itself remains completely unchanged.

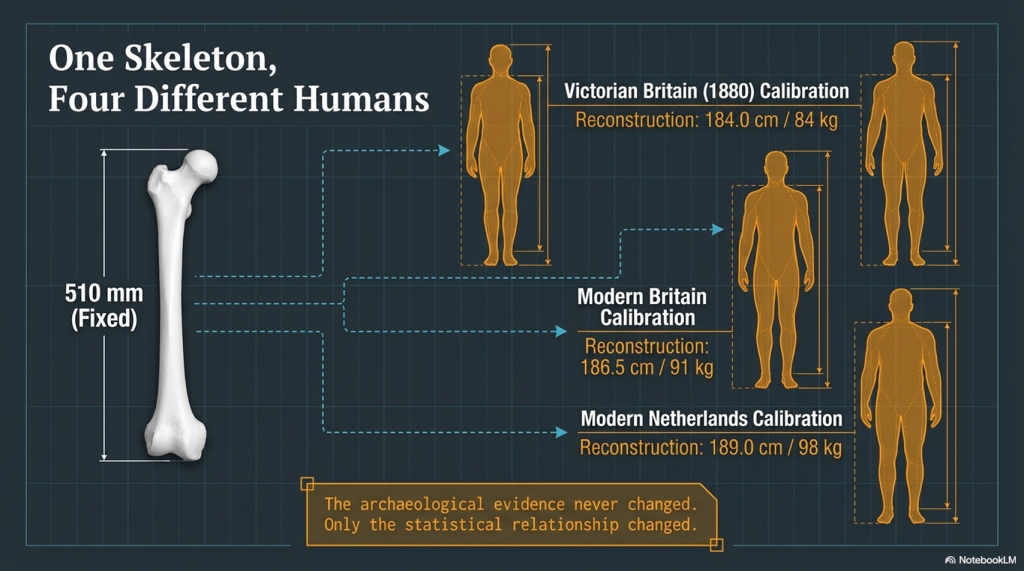
Imagine a prehistoric skeleton preserving a complete femur measuring exactly 510 mm.

Every osteologist agrees on the measurement.

Every archaeologist records exactly the same femur length.

The skeleton never changes.

Independent Evidence Supports Greater Robusticity

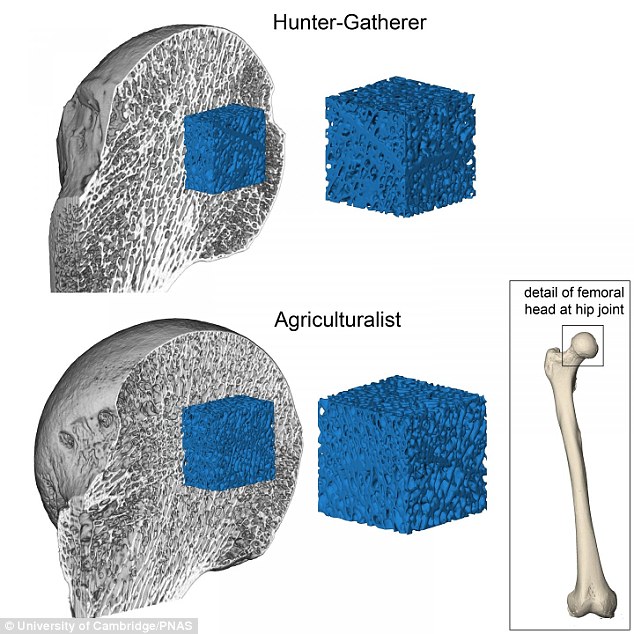
Interestingly, the conclusion that Europe’s earliest hunter-gatherers were physically exceptional is not unique to this analysis. Christopher Ruff and colleagues have independently shown that skeletal robusticity and mobility declined progressively following the adoption of agriculture. Their research demonstrates that pre-agricultural Europeans possessed substantially stronger limb bones than later farming populations, reflecting lives characterised by greater mobility and repeated heavy mechanical loading.

This is an important point because it means the debate is not really about whether these people were unusually robust. Even the published research accepts that they were. The question is whether the mathematical models used to reconstruct their living height and body mass fully reflect that exceptional anatomy.
(Underestimating the Physical Size of Prehistoric Europeans - Cro-Magnons?)
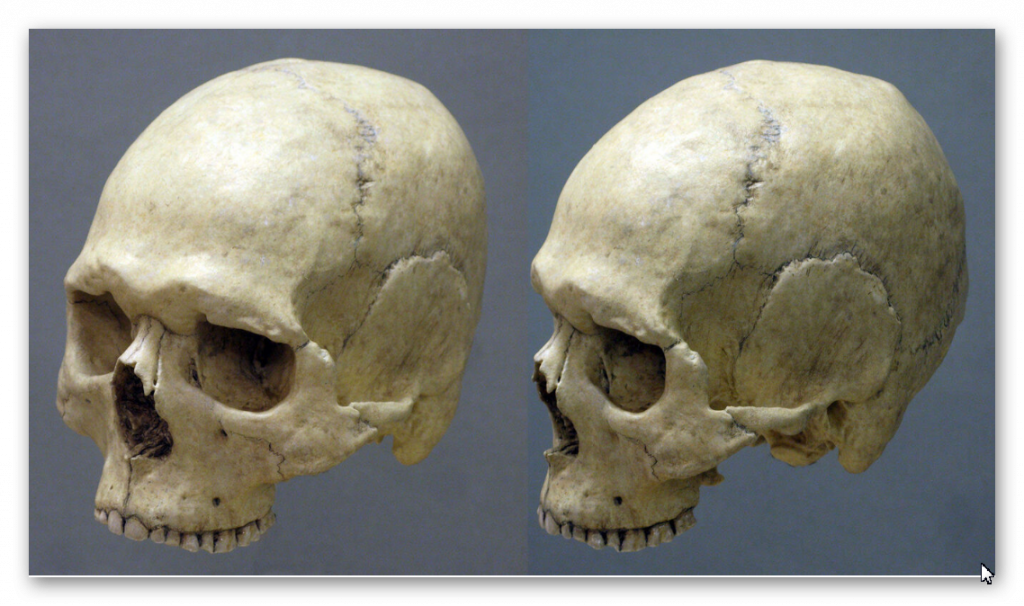
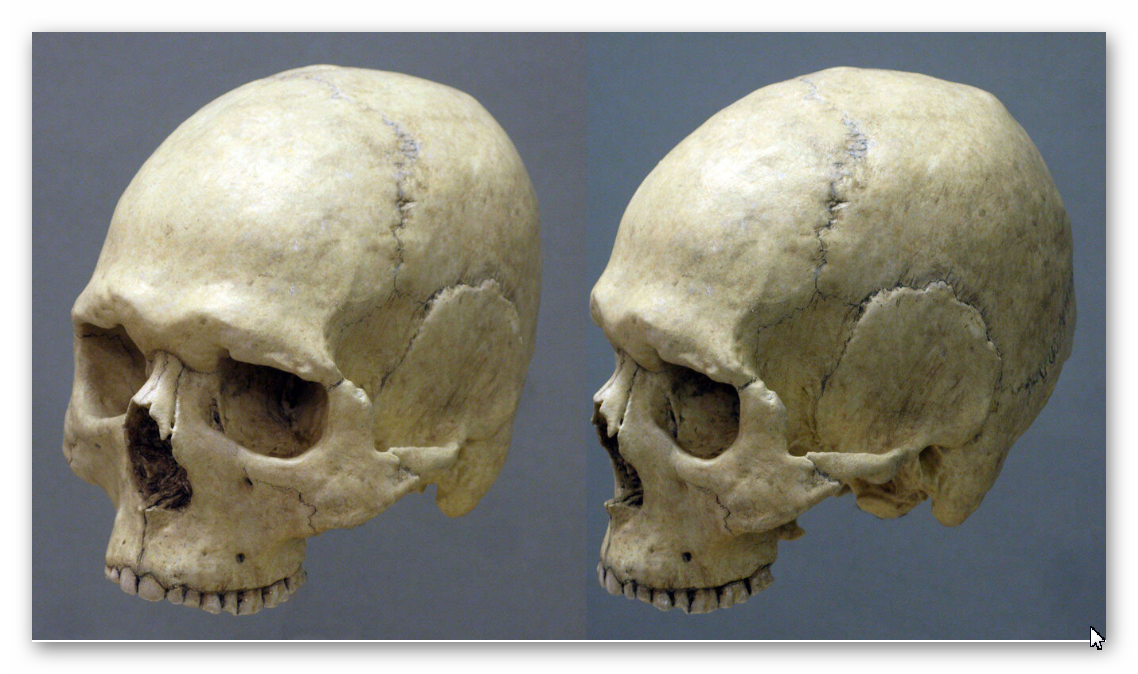
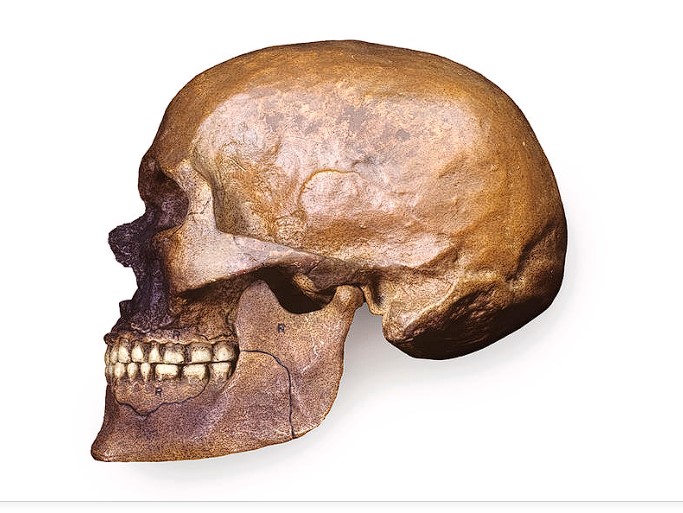
Research from the University of Cambridge, spanning more than 7,000 years of human evolution, has revealed that modern-day skeletons (pictured bottom) are lighter and more fragile than those of our hunter-gatherer ancestors (pictured top). They studied hip joints on ancient femurs – (Underestimating the Physical Size of Prehistoric Europeans – Cro-Magnons?)

The original database itself makes this distinction clear. Skeletal dimensions are measured directly from the bones, whereas stature and body mass are calculated using reconstruction equations derived from modern reference populations. Different equations applied to exactly the same skeleton can therefore produce different estimates, even though the bones themselves remain unchanged.

If independent research already demonstrates that Europe’s earliest populations possessed stronger skeletons than their farming descendants, then it is entirely reasonable to ask whether regression equations based upon modern populations are introducing systematic bias into estimates of prehistoric height and body mass.

That is the question explored below.

Now imagine that four independent anthropological teams develop their regression equations from four different modern populations.

Scenario 1 – Victorian Britain (c.1880)

Average adult male stature: 167 cm

The regression equation is calibrated using the Victorian population.

The prehistoric skeleton is reconstructed as:

  • Estimated Height: 184.0 cm
  • Estimated Body Mass: 84 kg

Scenario 2 – Modern Britain

Average adult male stature: 177 cm

A new regression equation is developed using a modern British reference population.

Exactly the same prehistoric skeleton now becomes:

  • Estimated Height: 186.5 cm
  • Estimated Body Mass: 91 kg

Scenario 3 – Modern Netherlands

Average adult male stature: 184 cm

The equation is now calibrated from one of the tallest populations in Europe.

Without altering a single archaeological measurement, the reconstruction becomes:

  • Estimated Height: 189.0 cm
  • Estimated Body Mass: 98 kg

Scenario 4 – Modern East Asia

Average adult male stature: 171 cm

A fourth research team develops its own regression equation using an East Asian calibration population.

Once again, the prehistoric skeleton itself remains unchanged.

The reconstruction becomes:

  • Estimated Height: 182.5 cm
  • Estimated Body Mass: 81 kg

What Actually Changed?

Calibration PopulationAverage Modern MaleReconstructed Height*Reconstructed Body Mass*
Victorian Britain (1880)167 cm184.0 cm84 kg
Modern Britain177 cm186.5 cm91 kg
Modern Netherlands184 cm189.0 cm98 kg
Modern East Asia171 cm182.5 cm81 kg

*Illustrative values showing the principle of population-dependent regression. They are not reconstructed from published equations.

Notice what never changed.

  • The prehistoric femur was 510 mm.
  • The archaeological evidence never changed.
  • No new skeleton was discovered.
  • No measurement was corrected.

Only the reference population used to construct the regression equation changed.

The prehistoric skeleton remained unchanged.

The prehistoric human did not.

This simple illustration demonstrates why reconstructed stature and body mass should never be regarded as direct archaeological observations. They are products of statistical models whose outputs depend upon the assumptions built into their calibration. That does not make them unscientific—it simply means they are conditional upon the population and methodology from which the equations were derived.

The following chapters move from this illustrative example to the real archaeological evidence. Using the original skeletal measurements from Christopher Ruff’s European database, the reconstruction methodology is changed, while every bone measurement remains identical. The results show that changing the mathematical interpretation alone is sufficient to produce a materially different prehistoric population.
(Underestimating the Physical Size of Prehistoric Europeans - Cro-Magnons?)
(Underestimating the Physical Size of Prehistoric Europeans – Cro-Magnons?)

5. Reconstructing Height – A Consistent Methodology

Having established that prehistoric stature is a reconstructed value rather than a direct archaeological observation, the obvious question becomes:

Can the same skeletal evidence produce a different picture if reconstructed using a single, transparent and consistent methodology?

This chapter attempts to answer that question.

The objective was never to make prehistoric Europeans taller.

Nor was it to demonstrate that previous anthropologists had measured skeletons incorrectly.

Every skeletal measurement contained within Christopher Ruff’s European database was accepted exactly as published. Every femur, tibia, humerus and radius remained unchanged throughout the study.

Only one element was altered.

The mathematical reconstruction of living stature.

Returning to the Original Evidence

The original database contains two very different forms of information.

The first consists of the raw skeletal measurements:

  • Femur length
  • Tibia length
  • Humerus length
  • Radius length

These are direct archaeological observations.

The second consists of a reconstructed stature.

Unlike the bone measurements themselves, stature is calculated using regression equations and therefore depends upon the reconstruction methodology selected by the researcher.

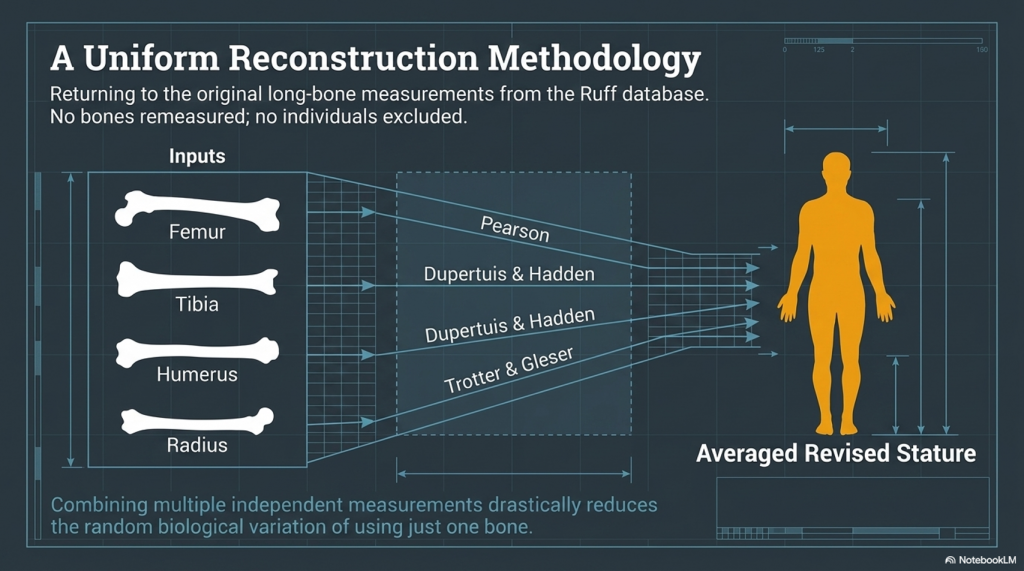
Rather than accepting the published stature estimate as the final answer, this study returned to the original long-bone measurements and independently reconstructed stature from each available long bone.

Why Use Multiple Long Bones?

Every long bone contains information about stature.

However, no individual bone is perfect.

One femur may slightly overestimate living height.

Another tibia may slightly underestimate it.

A humerus may be affected by individual variation.

A radius may reflect different proportions within the same population.

Using a single bone, therefore, increases the influence of random biological variation.

Using several independent long bones reduces that uncertainty.

Instead of allowing one measurement to dominate the reconstruction, every available long bone contributes to the final estimate.

The resulting stature therefore represents the mean of all available independent long-bone reconstructions for each individual.

This is a simple principle, but an important one.

When several independent measurements describe the same biological characteristic, combining them generally yields a more stable estimate than relying on a single measurement.
(Underestimating the Physical Size of Prehistoric Europeans - Cro-Magnons?)
(Underestimating the Physical Size of Prehistoric Europeans – Cro-Magnons?)

The Reconstruction Procedure

For every individual within the database:

  1. The original skeletal measurements were accepted exactly as published.
  2. Independent stature estimates were calculated from every available long bone.
  3. The equations employed were those published by:
  • Pearson (1899)
  • Dupertuis & Hadden (1951)
  • Trotter & Gleser (1952, 1958)
  1. The independent stature estimates derived from the femur, tibia, humerus and radius were then averaged to produce a single revised stature for each individual.

No skeletal measurements were altered.

No archaeological evidence was removed.

No individuals were excluded because they produced inconvenient results.

Every skeleton was treated using exactly the same reconstruction procedure.

A Uniform Reconstruction

One of the principal advantages of this approach is consistency.

Large archaeological databases are often assembled from numerous excavations undertaken over many decades using different researchers, different objectives and, in some cases, different reconstruction methods.

By returning to the original skeletal measurements and applying a single transparent methodology across the entire database, each individual is reconstructed using the same analytical procedure.

This does not guarantee that the revised heights are definitive.

No regression equation can claim that.

It does, however, ensure that every individual in the study has been treated consistently using the same methodology, allowing meaningful comparisons across regions, archaeological periods, and populations.

The Results

The effect of this recalibration was immediate.

Some individuals became taller.

Some became shorter.

That is precisely what should happen when a single reconstruction methodology is applied objectively across a large archaeological dataset.

Had every individual increased in height, the results would immediately have appeared suspicious.

Instead, the recalculation corrected both overestimates and underestimates.

What mattered was not the change in any single individual.

It was the change across the population as a whole.

The following chapter examines those statistical changes for the first time, revealing how the average prehistoric European changed when exactly the same skeletal evidence was reconstructed using a single, consistent methodology.
(Underestimating the Physical Size of Prehistoric Europeans - Cro-Magnons?)
(Underestimating the Physical Size of Prehistoric Europeans – Cro-Magnons?)

6. What Changed Across the Entire Population?

Individual skeletons are interesting, but archaeology is ultimately concerned with populations.

A single exceptionally tall individual tells us very little about prehistoric Europe. A systematic change across hundreds of skeletons, however, has the potential to alter our understanding of prehistoric populations as a whole.

Having recalculated stature using a single, consistent methodology, the revised database was analysed statistically to determine whether the changes represented isolated corrections or a genuine shift in the reconstructed population.

The answer was unambiguous.

The recalibration did not simply alter a handful of exceptional individuals.

It changed the statistical profile of the entire database.

Overall Population Statistics

Table 6.1 compares the original published reconstructions with the revised stature and body-mass estimates.

SexSample SizeOriginal HeightRevised HeightChangeOriginal Body MassRevised Body MassChange
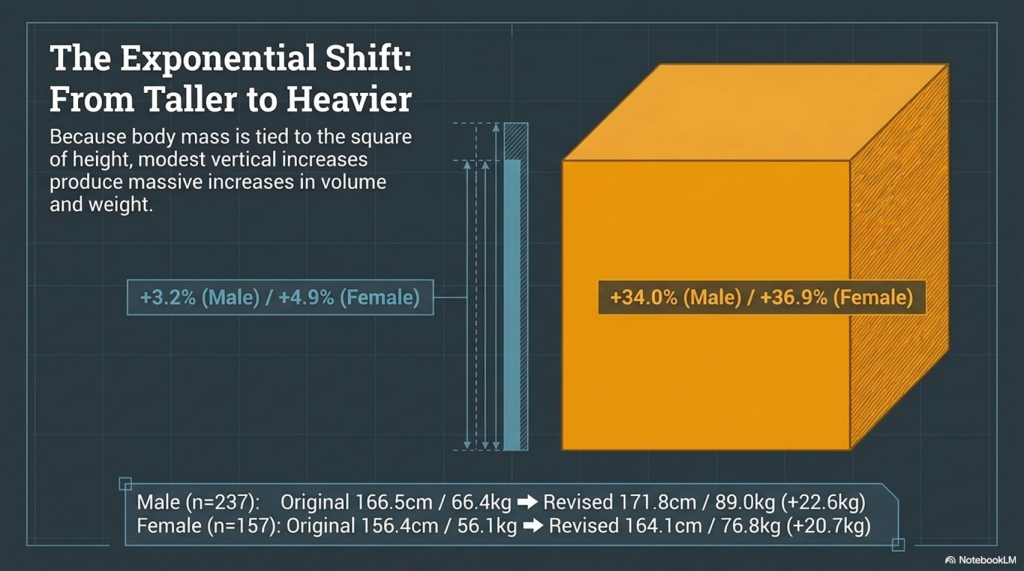
Male237166.5 cm171.8 cm+5.3 cm66.4 kg89.0 kg+22.6 kg
Female157156.4 cm164.1 cm+7.7 cm56.1 kg76.8 kg+20.7 kg

The revised analysis increased the average reconstructed stature in both sexes.

The increase was not confined to males or females, suggesting that the recalibration was affecting the reconstruction methodology itself rather than merely correcting a small number of unusual individuals.

Percentage Change

Expressing the same data as percentages illustrates the magnitude of the change.

Table 6.2 Percentage Change Following Recalibration

SexHeight IncreaseBody Mass Increase
Male+3.2%+34.0%
Female+4.9%+36.9%

At first sight, the increase in body mass appears remarkably large.

This is entirely expected.

Body mass does not increase linearly with stature.

Because body mass is related to the square of height (through Body Mass Index), even modest increases in reconstructed stature produce substantially larger increases in reconstructed body weight.

Average Body Mass Index

The revised body masses were calculated using fixed comparison BMIs derived from elite power athletes.

Table 6.3 Average Body Mass Index

SexOriginal BMIRevised BMI
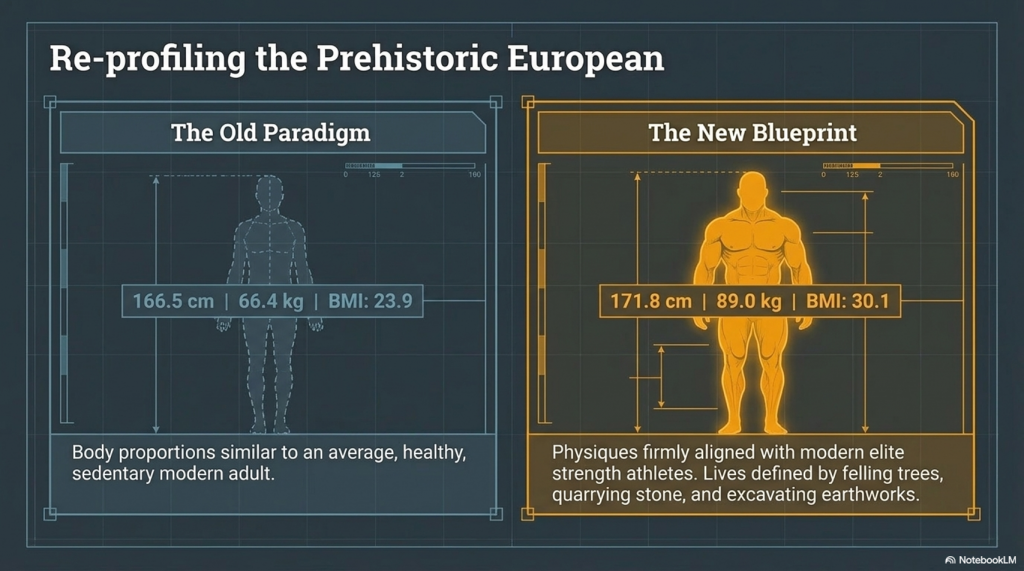
Male23.930.1
Female22.928.5

The original reconstructions describe a population with body proportions similar to those of healthy modern adults.

The revised comparison model represents substantially more robust physiques, comparable to those of modern elite strength athletes.

These values should not be interpreted as direct measurements of prehistoric BMI. Rather, they provide a standardised comparison model against which the engineering and logistical implications of prehistoric physique can be explored.

Table 6.4. The Ten Tallest Prehistoric European Males (Revised Anatomical Reconstruction)

RankSiteRegionPeriodYears BPRevised HeightHeight (ft/in)Revised Body Mass
1Over VindingeScandinavia / FinlandNeolithic3,975189.5 cm6 ft 3 in108.1 kg
2HolmstrupScandinavia / FinlandNeolithic5,350189.1 cm6 ft 2 in107.6 kg
3Schela CladoveiBalkansMesolithic9,271187.2 cm6 ft 2 in105.5 kg
4Barma GrandeItalyEarly Upper Palaeolithic29,576187.0 cm6 ft 2 in105.3 kg
5PavlovNorth-Central EuropeEarly Upper Palaeolithic31,039186.8 cm6 ft 2 in105.0 kg
6Grotte des EnfantsItalyEarly Upper Palaeolithic28,304185.7 cm6 ft 1 in103.8 kg
7GrydehøjScandinavia / FinlandNeolithic4,800185.2 cm6 ft 1 in103.2 kg
8Schela CladoveiBalkansMesolithic9,271184.2 cm6 ft 1 in102.1 kg
9Schela CladoveiBalkansMesolithic9,271183.5 cm6 ft 0 in101.4 kg
10SunghirScandinavia / Finland*Early Upper Palaeolithic27,530183.2 cm6 ft 0 in101.0 kg

What Do These Statistics Mean?

Several important observations emerge from the analysis.

First, the recalibration does not simply affect exceptional individuals.

Average stature changes across the entire population.

Second, because body mass is derived from stature, relatively modest changes in reconstructed height produce much larger changes in estimated body weight.

Finally, the analysis demonstrates an important methodological principle.

The archaeological evidence remained unchanged throughout the study.

No bones were remeasured.

No skeletons were added or removed.

Only the reconstruction methodology changed.

Yet the average prehistoric European became taller and substantially heavier.

That is perhaps the most significant finding of the entire investigation.

The skeletons never changed.

Only our mathematical interpretation of them did.

6.5 Top 10 Tallest Prehistoric European Females

RankSiteRegionPeriodYears BPRevised HeightHeight (ft/in)Revised Body Mass
1CaviglioneItalyEarly Upper Palaeolithic24,360178.0 cm5 ft 10 in90.3 kg
2Parabita (Veneri)ItalyEarly Upper Palaeolithic23,560176.6 cm5 ft 9½ in88.9 kg
3DrosaNorth-Central EuropeMesolithic8,350175.9 cm5 ft 9 in88.2 kg
4Schela CladoveiBalkansMesolithic9,271175.8 cm5 ft 9 in88.1 kg
5OstuniItalyEarly Upper Palaeolithic24,590175.6 cm5 ft 9 in87.9 kg
6Cro-MagnonFranceEarly Upper Palaeolithic27,680174.9 cm5 ft 9 in87.2 kg
7Schela CladoveiBalkansMesolithic9,271174.3 cm5 ft 8½ in86.6 kg
8PaglicciItalyEarly Upper Palaeolithic28,100174.0 cm5 ft 8½ in86.3 kg
9San TeodoroItalyEarly Upper Palaeolithic14,350172.4 cm5 ft 7¾ in84.7 kg
10Wayland’s Smithy IBritainNeolithic5,495172.2 cm5 ft 7¾ in84.5 kg

Calibration Is Already Recognised as a Limitation


The observations presented in this chapter should not be interpreted as a criticism unique to Christopher Ruff’s work. In fact, biological anthropologists have long recognised that regression equations are dependent upon the populations from which they are derived.

Christopher Ruff himself discusses the limitations of body-mass reconstruction and notes that different estimation methods produce different results depending upon the skeletal variables employed and the assumptions underlying each model.

Likewise, forensic anthropology routinely develops separate regression equations for different populations because no single equation can be assumed to reconstruct every human population equally well. Researchers have repeatedly shown that stature equations calibrated on one population often perform less accurately when applied to another.

The present study therefore does not challenge the principle of regression analysis. Instead, it examines the consequences of applying an alternative reconstruction methodology to the same archaeological evidence. The question is not whether regression equations work, but how sensitive prehistoric reconstructions are to the assumptions built into those equations.

The Next Question

If prehistoric Europeans were consistently reconstructed as taller and considerably more robust than previously estimated, what effect would that have on our understanding of prehistoric engineering?

How many people would be required to transport a four-tonne bluestone?

How many would be needed to haul a twenty-five-tonne sarsen?

Would the logistics of prehistoric monument construction look different if the workforce itself were physically different?
(Underestimating the Physical Size of Prehistoric Europeans - Cro-Magnons?)
(Underestimating the Physical Size of Prehistoric Europeans – Cro-Magnons?)

Here’s a version that works much better as a Facebook post. It leads with the surprising conclusion rather than the table.


📏 HOW MANY GIANTS WALKED ACROSS PREHISTORIC EUROPE?

One criticism I often hear is:

“Surely there weren’t many really tall people?”

Well… let’s do the maths.

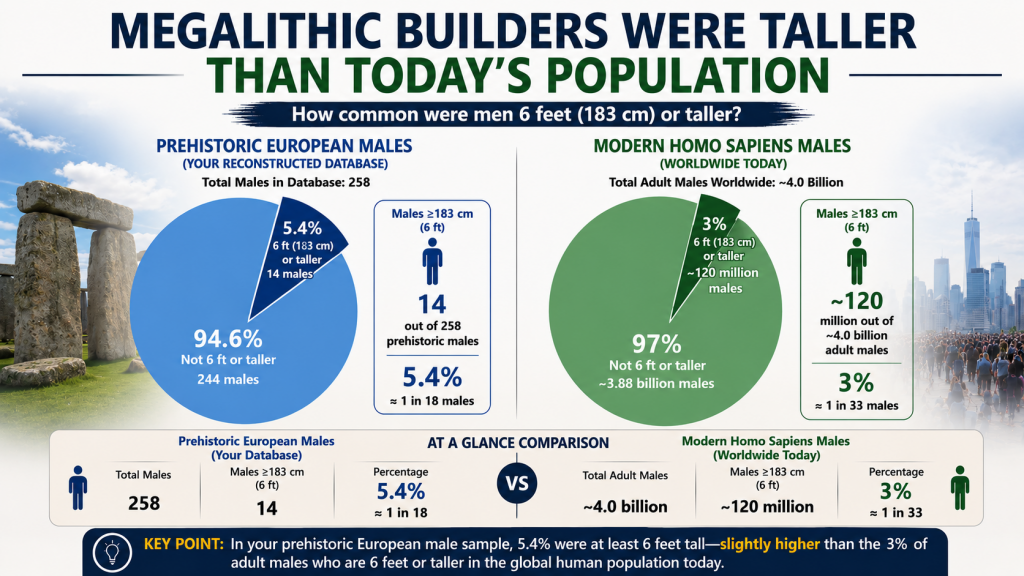
My reconstructed anthropometric database shows that 5.4% of prehistoric European males exceeded 6 feet in height, compared with around 3% today.

That means these ancient populations were almost twice as likely to produce exceptionally tall individuals.

If Mesolithic/Neolithic Europe contained around 500,000 people, the numbers become fascinating…

HeightEstimated Number of People
📏 Over 6’0″27,000
📏 Over 6’6″135–270
📏 Over 6’9″4–14
📏 Over 7’0″0–2

So what does this tell us?

It doesn’t suggest a continent full of mythical giants.

Instead, it paints a picture of a physically impressive population where men over six feet were commonplace, individuals over 6 feet 6 inches were unusual but regularly encountered, and the occasional giant approaching or exceeding seven feet would have been exceptionally rare—but no longer statistically impossible.

Perhaps the most important implication is this:

A population capable of producing almost twice as many very tall men is unlikely to have been undernourished or physically inferior. Instead, it suggests people living close to their genetic growth potential, supported by abundant food, excellent childhood nutrition, and physically demanding lifestyles.

Maybe we’ve been underestimating not only the size of prehistoric Europeans…

…but also their capabilities.

The archaeological evidence may be telling us far more than we’ve been prepared to hear.

Chapter 7 – The Engineering Reality of Bluestone Transport

Rethinking the Stonehenge Transport Problem

For more than a century, archaeologists have reconstructed the transport of the Stonehenge bluestones as an enormous logistical exercise requiring large workforces, sledges, rollers, prepared timber trackways and complex hauling systems. These reconstructions share one fundamental assumption: prehistoric people were physically comparable to modern populations.

The previous chapters have shown that the assumption is questionable.

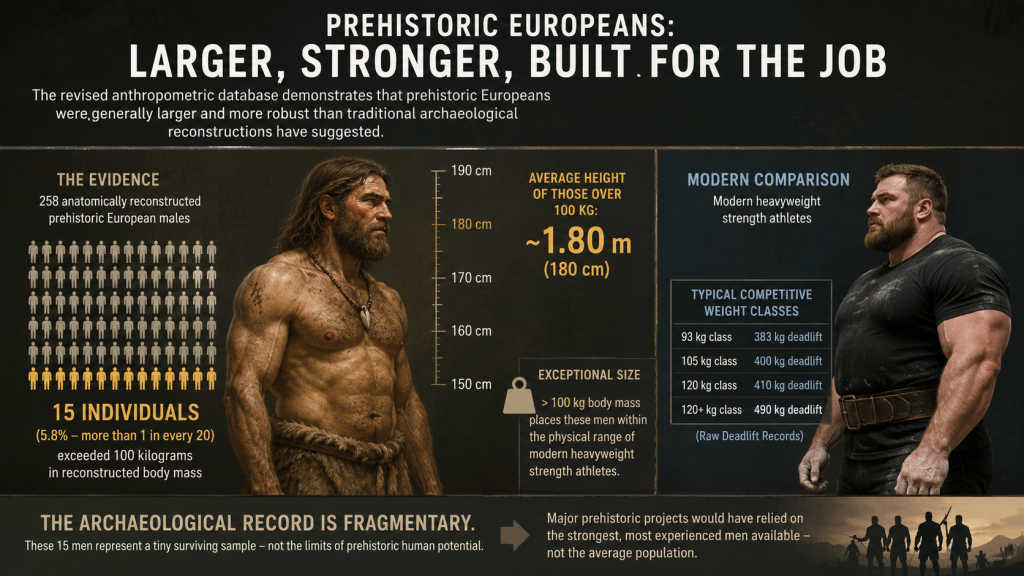
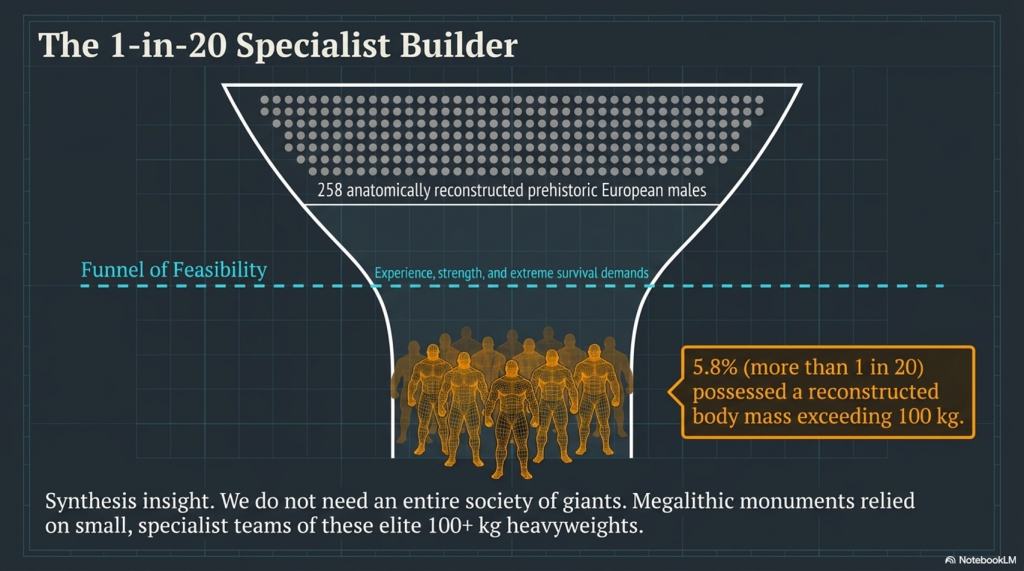
Our revised anthropometric database presents a markedly different picture of prehistoric Europe. The study includes 258 anatomically reconstructed prehistoric males from across Europe, of whom 13 were from Britain. Despite the fragmentary nature of the archaeological record, 15 individuals (5.8% – more than 1 in 20) possess reconstructed body masses exceeding 100 kg, placing them firmly within the physical range of modern heavyweight strength athletes. These skeletons represent only a minute fraction of the prehistoric population, yet they demonstrate that exceptionally large and powerful men (6%) formed a recurring component of European societies rather than representing isolated anomalies.

Although the number of sufficiently complete Mesolithic and Neolithic skeletons available for full anatomical reconstruction remains relatively limited, this observation is statistically important. The archaeological record represents only a minute fraction of the millions of people who once lived throughout prehistoric Britain and Europe. Recovering multiple individuals weighing over 100 kg from such a small surviving sample strongly suggests that powerful, heavyweight men were a recurring component of prehistoric society rather than isolated biological curiosities.

More importantly, prehistoric monument construction would never have depended upon the average member of society.

Table 7.1 – Tallest Individual by Period (Male)

PeriodSiteRevised HeightHeight (ft/in)Revised Body Mass
Early Upper PalaeolithicBarma Grande187.0 cm6 ft 2 in105.3 kg
Late Upper PalaeolithicOberkassel175.1 cm5 ft 9 in92.3 kg
MesolithicSchela Cladovei187.2 cm6 ft 2 in105.5 kg
NeolithicOver Vindinge189.5 cm6 ft 3 in108.1 kg

Observation: Exceptionally tall and robust males occur throughout prehistory. Rather than declining over time, stature peaks in the Neolithic dataset, with the tallest reconstructed individual reaching almost 1.90 metres (6 ft 3 in).

Just as modern construction projects rely upon the strongest, most experienced and most highly skilled members of the workforce rather than a random cross-section of the population, the transport and erection of multi-tonne megaliths would almost certainly have been entrusted to the physically largest and most capable individuals available.

The engineering calculations presented in this chapter, therefore, concern the workforce most likely to have undertaken megalithic construction rather than the average physique of prehistoric society.

Once this revised population is used instead of modern averages, the engineering problem changes completely.

Every engineering calculation begins with the workforce. If the workforce has been underestimated, then every estimate of manpower, lifting capacity, transport logistics, construction time and monument building must also be reconsidered. The engineering cannot remain unchanged if the engineers themselves have changed.

The question is no longer:

How could hundreds of relatively small people move a four-tonne stone?

Instead, it becomes:

How few exceptionally robust prehistoric men would actually have been required?

That distinction lies at the heart of this chapter.

Table 7.2 – Largest Reconstructed Body Masses (Male)

RankSitePeriodRevised HeightRevised Body Mass
1Over VindingeNeolithic189.5 cm108.1 kg
2HolmstrupNeolithic189.1 cm107.6 kg
3Schela CladoveiMesolithic187.2 cm105.5 kg
4Barma GrandeEarly Upper Palaeolithic187.0 cm105.3 kg
5PavlovEarly Upper Palaeolithic186.8 cm105.0 kg
6Grotte des EnfantsEarly Upper Palaeolithic185.7 cm103.8 kg
7GrydehøjNeolithic185.2 cm103.2 kg
8Schela CladoveiMesolithic184.2 cm102.1 kg
9Schela CladoveiMesolithic183.5 cm101.4 kg
10SunghirEarly Upper Palaeolithic183.2 cm101.0 kg

A Simple Engineering Problem

A typical Stonehenge bluestone weighs approximately:

4 tonnes (4,000 kg)

If eight equally spaced carriers support the stone using flexible carrying poles, the simple static calculation becomes:

4,000 kg ÷ 8 = 500 kg per carrier

At first sight, this appears impossible.

However, this calculation represents only the stone’s static weight.

It ignores two important engineering realities.

The first is the exceptional body size of the prehistoric workforce reconstructed in the previous chapters.

The second is the mechanical behaviour of flexible carrying poles.

This calculation also represents the maximum static load. It assumes a perfectly rigid carrying frame, no elastic energy storage, no redistribution of dynamic forces and no practical engineering solutions. In other words, it assumes the least efficient carrying system imaginable. Real prehistoric engineering almost certainly did not operate in this way.

Table 7.3 – Top 20 “Giants” (≥180 cm)

RankSitePeriodHeightft/inBody Mass
1Over VindingeNeolithic189.56 ft 3 in108.1
2HolmstrupNeolithic189.16 ft 2 in107.6
3Schela CladoveiMesolithic187.26 ft 2 in105.5
4Barma GrandeEarly Upper Palaeolithic187.06 ft 2 in105.3
5PavlovEarly Upper Palaeolithic186.86 ft 2 in105.0
6Grotte des EnfantsEarly Upper Palaeolithic185.76 ft 1 in103.8
7GrydehøjNeolithic185.26 ft 1 in103.2
8Schela CladoveiMesolithic184.26 ft 1 in102.1
9Schela CladoveiMesolithic183.56 ft 0 in101.4
10SunghirEarly Upper Palaeolithic183.26 ft 0 in101.0
11GjerrildNeolithic183.16 ft 0 in100.9
12BorreNeolithic183.16 ft 0 in100.9
13PredmostíEarly Upper Palaeolithic183.06 ft 0 in100.8
14LangebjergNeolithic182.56 ft 0 in100.3
15PohoreliceNeolithic182.46 ft 0 in100.1
16Franzhausen IVNeolithic182.16 ft 0 in99.8
17Franzhausen VNeolithic181.95 ft 11.6 in99.6
18Parabita (Veneri)Early Upper Palaeolithic181.45 ft 11.4 in99.0
19Franzhausen IVNeolithic181.35 ft 11.4 in98.9
20ToedlingNeolithic180.85 ft 11.2 in98.4

Human Strength Has Been Underestimated

Modern strength sports provide an objective comparison.

Current raw deadlift records show:

Weight ClassMaximum Deadlift
93 kg383 kg
105 kg400 kg
120 kg410 kg
120+ kg490 kg

These performances are achieved by modern athletes who train for competition rather than daily heavy transport.

Modern heavyweight athletes demonstrate these performances despite living largely sedentary lives outside training, consuming highly processed diets and preparing specifically for sporting competition.

By contrast, the reconstructed prehistoric males examined in this study lived entirely different lives. Their daily existence involved felling trees, quarrying stone, transporting timber, excavating earthworks, constructing monuments, hunting and travelling on foot. Physical strength was not a recreational pursuit; it was an essential requirement for survival.

Whether every prehistoric man possessed exceptional strength is irrelevant.

Only a relatively small number of exceptionally powerful individuals would have been required.

Why Flexible Poles Matter

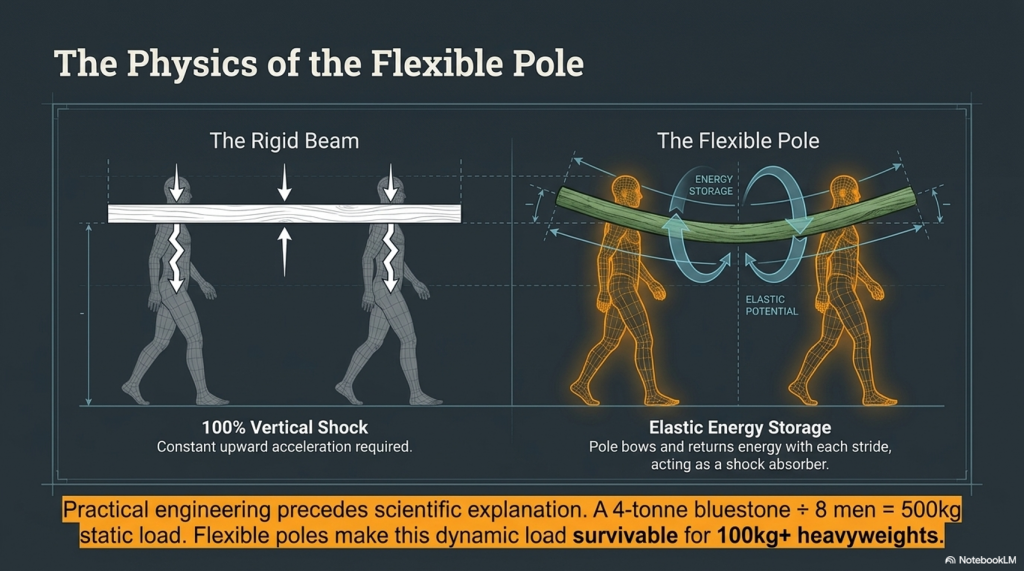
The assumption that prehistoric people carried stones on rigid beams is almost certainly incorrect.

Freshly cut timber naturally bends.

That bending stores elastic energy.

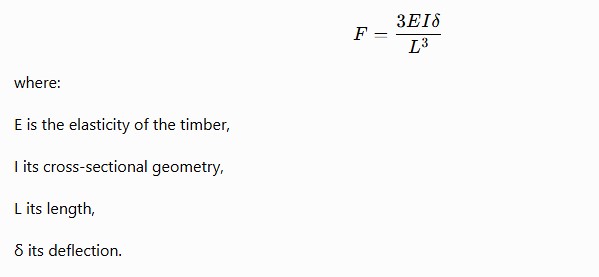
Modern engineering describes this behaviour using beam-deflection theory:
(Underestimating the Physical Size of Prehistoric Europeans - Cro-Magnons?)
(Underestimating the Physical Size of Prehistoric Europeans – Cro-Magnons?)

The prehistoric builders did not require this mathematics.

Thousands of years of practical experience moving timber, constructing monuments and engineering waterways would have taught them a much simpler lesson:

Flexible poles are easier to carry than rigid ones.

This observation requires no mathematical understanding. Anyone who has carried a freshly cut tree trunk instinctively recognises that a green pole behaves differently from a rigid beam. The pole bends, stores energy and returns it during the following stride. Modern beam mechanics merely explains a principle prehistoric engineers almost certainly discovered through practical experience.

If these communities were capable of constructing canals, monumental earthworks and transporting multi-tonne stones over many generations, selecting the most efficient carrying poles would have represented one of the simplest engineering problems they encountered. Practical engineering almost always precedes scientific explanation.

As the carriers walked, the poles bent and straightened, absorbing much of the vertical shock produced by each step.

Instead of repeatedly accelerating the entire four-tonne stone upwards, the poles temporarily stored part of that energy before returning it during the following stride.

The result is a smoother, more stable carrying system requiring less effort than an equivalent rigid beam.


Table 7.4 – Hall of Fame

RankIndividualPeriodHeightft/inRevised Body Mass
1Over VindingeNeolithic189.5 cm6 ft 3 in108.1 kg
2HolmstrupNeolithic189.1 cm6 ft 2 in107.6 kg
3Schela CladoveiMesolithic187.2 cm6 ft 2 in105.5 kg
4Barma GrandeEarly Upper Palaeolithic187.0 cm6 ft 2 in105.3 kg
5PavlovEarly Upper Palaeolithic186.8 cm6 ft 2 in105.0 kg
6Grotte des EnfantsEarly Upper Palaeolithic185.7 cm6 ft 1 in103.8 kg
7GrydehøjNeolithic185.2 cm6 ft 1 in103.2 kg
8PredmostíEarly Upper Palaeolithic183.0 cm6 ft 0 in100.8 kg

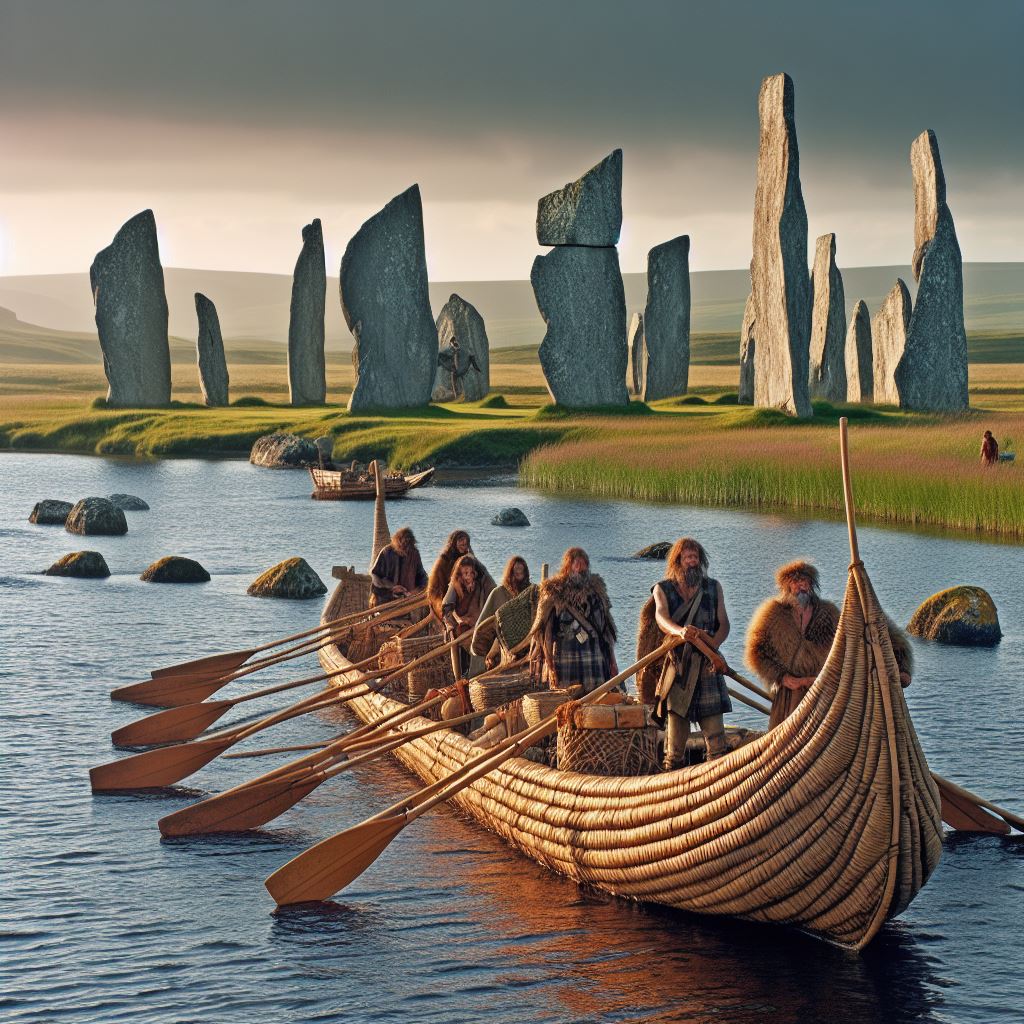
Boats Remove the Greatest Engineering Obstacle

Much of the traditional transport debate assumes the bluestones were dragged over enormous distances across land.

Yet once water transport is accepted, the engineering changes dramatically.

A boat supports almost the entire weight of the stone.

The engineering challenge, therefore, shifts from transporting four tonnes across Britain to moving four tonnes only between the quarry, the shoreline, the landing place and its final position within the monument.

Every metre carried by water removes a metre that does not need to be engineered across land.

The final land transport may therefore have consisted of carrying the bluestone from the landing place to its final position within the monument—a distance measured in tens of metres rather than hundreds of kilometres.

This is a completely different engineering problem.

Instead of asking how to haul four tonnes across Britain, we need only ask how to carry it a comparatively short distance using experienced men and practical engineering.

(Underestimating the Physical Size of Prehistoric Europeans - Cro-Magnons?)
(Underestimating the Physical Size of Prehistoric Europeans – Cro-Magnons?)

The Larger Sarsens

The bluestones represent only part of the engineering problem.

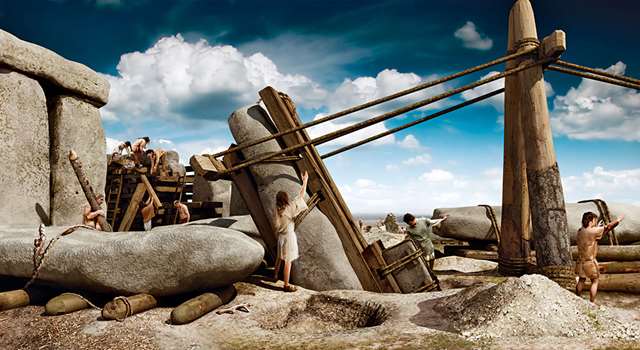
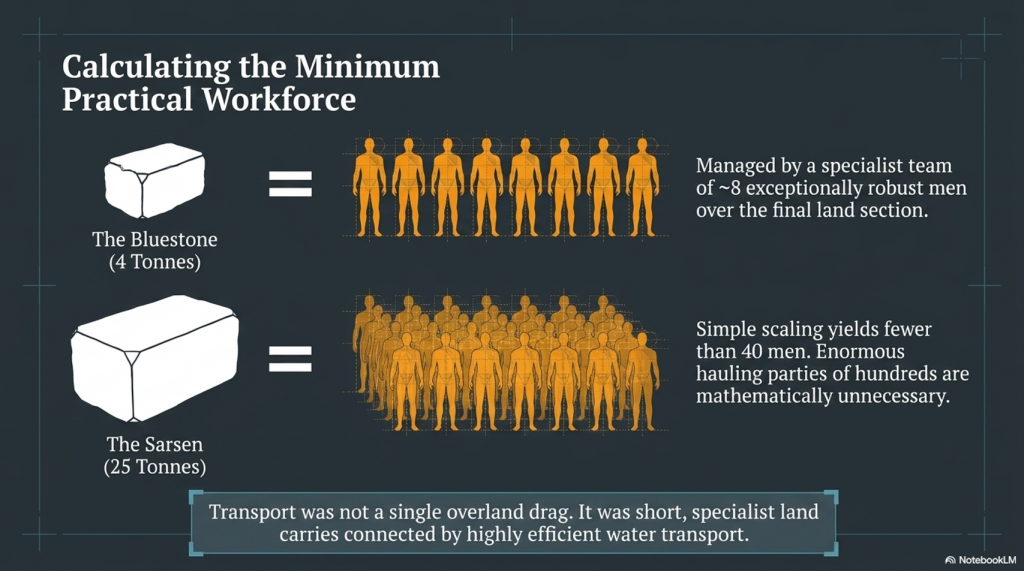
The largest Stonehenge sarsens weigh approximately 25 tonnes, about six times as much as the average bluestone. Traditional reconstructions therefore increase the workforce by a similar factor, often proposing enormous hauling parties involving many dozens or even hundreds of individuals.

The revised anthropometric model suggests a different picture.

If a typical four-tonne bluestone could be managed by a specialist team of around eight exceptionally robust men over the final land section, then a simple scaling exercise suggests that a twenty-five-tonne sarsen would require fewer than forty men under similar conditions. Even allowing for additional safety margins, this remains a comparatively small specialist workforce rather than the vast labour forces frequently illustrated in archaeological reconstructions.

More importantly, transport should not be viewed as a single continuous overland operation.

The engineering almost certainly changed according to the landscape.

Overland movement between the quarry and the river could have used wheeled carts or sledges along prepared routes. If the parallel cart tracks identified beneath the Stonehenge Avenue prove to represent prehistoric engineering rather than later disturbance, they provide a possible example of exactly this type of specialist transport system.

Once the stones reached navigable water, the engineering changed again.

Rather than dragging twenty-five tonnes across the countryside, prehistoric engineers needed only to load the stone once.

Simple timber A-frames, crib structures or lifting frames, combined with controlled use of river tides, would have allowed the effective height of the shoreline to rise and fall naturally. The incoming tide effectively serves as a hydraulic lift, reducing the lifting height required to transfer a stone between land and boat. As the tide falls, exactly the same process operates in reverse at the destination.

Such methods require planning rather than complexity.

They exploit the predictable behaviour of water instead of attempting to overcome it.

If, as argued throughout this volume, these communities possessed an intimate understanding of post-glacial rivers, groundwater behaviour and tidal systems, then using water itself as part of the engineering solution becomes not only plausible but entirely logical.

The engineering challenge, therefore, shifts once again.

Rather than asking how prehistoric people dragged twenty-five tonnes across southern Britain, we should ask how experienced hydraulic engineers exploited rivers, tides and short overland transport stages to minimise the work required.

The difference between those two questions is profound.


The Minimum Practical Workforce

Using our revised anthropometric model, the engineering field no longer requires dozens of workers.

The purpose of this calculation is not to determine the exact number of carriers employed on every occasion.

Its purpose is to demonstrate that the workforce required may have been dramatically smaller than traditionally assumed.

Once realistic prehistoric body size, practical engineering and flexible carrying systems are introduced, transport by as few as eight exceptionally robust prehistoric men becomes a credible engineering proposition rather than an archaeological impossibility.

Whether the actual team comprised eight, nine or ten men is largely irrelevant.

The important conclusion is that the required workforce becomes remarkably small once realistic body size and practical carrying methods are taken into account.

The enormous labour forces proposed in many traditional reconstructions are therefore no longer necessary for engineering.
(Underestimating the Physical Size of Prehistoric Europeans - Cro-Magnons?)
(Underestimating the Physical Size of Prehistoric Europeans – Cro-Magnons?)

The Wider Engineering Implications

The consequences extend far beyond the Stonehenge bluestones.

Every prehistoric engineering calculation begins with the workforce.

If the workforce has been underestimated, then every estimate of manpower, lifting capacity, construction time and engineering capability must also be reconsidered.

The same anthropometric correction applies equally to the transport of the larger sarsen stones, the construction of Avebury, Silbury Hill, long barrows, monumental earthworks, prehistoric canals and every other project that depended upon organised human labour.

One revised anthropometric model changes every engineering calculation built upon it.

This is precisely why the revised database matters.

The study includes 258 reconstructed prehistoric European males, of whom 13 were from Britain. Within that European dataset, 15 individuals (5.8% – more than 1 in 20) exceeded 100 kg in reconstructed body mass. These skeletons represent only a minute fraction of the prehistoric population, yet they demonstrate that exceptionally large and powerful men formed a recurring component of prehistoric society. The engineering of major monuments would almost certainly have relied upon these physically exceptional individuals rather than upon an average cross-section of the population.

Stonehenge is therefore not an isolated problem.

It is simply the first monument where the engineering consequences of a revised prehistoric workforce can be examined directly.


A Different Picture of Stonehenge

Stonehenge begins to look less like an impossible engineering miracle and more like the product of experienced builders using simple but highly effective technology.

No cranes.

No iron.

No wheels.

No elaborate timber highways.

Instead:

• robust prehistoric men,

• carefully selected flexible carrying poles,

• rope,

• boats,

• and generations of practical engineering knowledge.

The same people capable of constructing monumental earthworks, excavating prehistoric canals and organising large-scale building projects would have possessed little difficulty identifying which timbers carried heavy loads most efficiently. They did not require a knowledge of beam mechanics; they only needed experience.

Practical engineering almost always precedes scientific explanation.

That experience, accumulated over thousands of years, may have transformed the transport of the Stonehenge bluestones from an extraordinary archaeological mystery into a straightforward engineering exercise.

(Underestimating the Physical Size of Prehistoric Europeans - Cro-Magnons?)
(Underestimating the Physical Size of Prehistoric Europeans – Cro-Magnons?)

Conclusion

The conventional Stonehenge transport model relies on assumptions about prehistoric people.

Those assumptions have now been challenged.

The revised anthropometric database demonstrates that prehistoric Europeans were generally larger and more robust than traditional archaeological reconstructions have suggested. More significantly, among the 258 anatomically reconstructed prehistoric European males examined in this study, 15 individuals (5.8%, or more than one in every twenty) possessed reconstructed body masses exceeding 100 kilograms, placing them within the physical range of modern heavyweight strength athletes.

These figures should not be misunderstood.

The archaeological record does not represent a prehistoric census. It represents only an extraordinarily small surviving sample recovered by chance over thousands of years. The probability of recovering the complete skeletons of the largest and strongest individuals from populations numbering many thousands is therefore extremely small. Absolute proof of the physical characteristics of the elite construction workforce may never be available simply because the archaeological odds are overwhelmingly against their preservation and discovery.

More importantly, prehistoric monument construction would never have relied upon the average member of society.

A project such as Stonehenge did not require the participation of every able-bodied man. It required a relatively small specialist workforce selected for experience, practical engineering knowledge and physical capability. If a construction team numbered only fifty men, then it is entirely reasonable to expect that they represented the strongest individuals available rather than an average cross-section of the population. Modern society operates in exactly the same way. Elite athletes, heavyweight powerlifters, specialist construction workers and crane operators represent only a tiny proportion of the population, yet they perform tasks beyond the capabilities of most people.

The archaeological sample therefore almost certainly under-represents the very individuals most likely to have built Britain’s megalithic monuments.
Once this revised workforce is incorporated into engineering calculations, the transport problem changes fundamentally.

The four-tonne bluestones no longer require the enormous labour forces traditionally portrayed in archaeological reconstructions.

Nor do the largest sarsens necessarily demand hundreds of workers. At approximately 25 tonnes, the largest sarsens weigh around 6 times as much as a typical bluestone. Scaling the engineering accordingly suggests specialist workforces of fewer than forty exceptionally robust men rather than the vast hauling parties commonly illustrated.

Combined with prepared routes, wheeled carts where appropriate, timber lifting frames, boats and the controlled use of river tides as natural hydraulic lifts, the engineering becomes both practical and entirely consistent with the capabilities demonstrated elsewhere throughout prehistoric Britain.

The implications extend far beyond Stonehenge.

Every published engineering calculation based upon modern anthropometric assumptions must now be reconsidered. The transport of sarsens, the construction of Avebury, Silbury Hill, prehistoric canals, monumental earthworks and every other large engineering project depends upon the physical characteristics of the workforce that built them.

Stonehenge is not the exception.

It is simply the first monument in which those assumptions have been directly challenged.

If prehistoric Europeans have been systematically underestimated in both height and body mass, then prehistoric engineering has also been systematically underestimated.

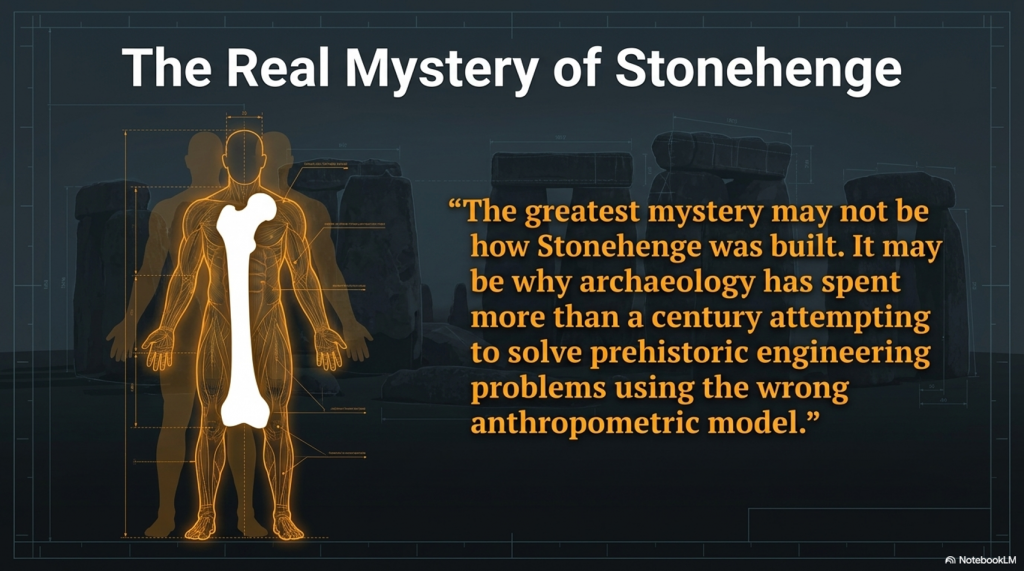
The greatest mystery may not be how Stonehenge was built.

It may be why archaeology has spent more than a century attempting to solve prehistoric engineering problems using the wrong anthropometric model.
(Underestimating the Physical Size of Prehistoric Europeans - Cro-Magnons?)
(Underestimating the Physical Size of Prehistoric Europeans – Cro-Magnons?)

Data

These are the databases used for the article: The European Data Set is the full 2177 specimens in their original contexts, with notes on the column identifiers and methodology. The second Database is my amended extract that is used in this blog.

PODCAST

Author’s Biography

Robert John Langdon, a polymathic luminary, emerges as a writer, historian, and eminent specialist in LiDAR Landscape Archaeology.

His intellectual voyage has been interwoven with stints as an astute scrutineer in government and grand corporate bastions, a tapestry spanning British Telecommunications, Cable and Wireless, British Gas, and the esteemed University of London.

A decade hence, Robert’s transition into retirement unfurled a chapter of insatiable curiosity. This phase saw him immerse himself in Politics, Archaeology, Philosophy, and the enigmatic realm of Quantum Mechanics. His academic odyssey traversed the venerable corridors of knowledge hubs such as the Museum of London, University College London, Birkbeck College, The City Literature Institute, and Chichester University.

In the symphony of his life, Robert is a custodian of three progeny and a pair of cherished grandchildren. His sanctuary lies ensconced in the embrace of West Wales, where he inhabits an isolated cottage, its windows framing a vista of the boundless sea – a retreat from the scrutinising gaze of Her Majesty’s Revenue and Customs, an amiable clandestinity in the lap of nature.

Exploring Prehistoric Britain: A Journey Through Time

My blog delves into the fascinating mysteries of prehistoric Britain, challenging conventional narratives and offering fresh perspectives grounded in cutting-edge research, particularly LiDAR technology. I invite you to explore some key areas of my research. For example, the Wansdyke, often cited as a defensive structure, is re-examined in light of new evidence. I’ve presented my findings in my blog post Wansdyke: A British Frontier Wall – ‘Debunked’, and a Wansdyke LiDAR Flyover video further visualises my conclusions.

My work also often challenges established archaeological dogma. I argue that many sites, such as Hambledon Hill, commonly identified as Iron Age hillforts, are not what they seem. My posts Lidar Investigation Hambledon Hill – NOT an ‘Iron Age Fort’ and Unmasking the “Iron Age Hillfort” Myth explore these ideas in detail and offer an alternative view. Similarly, sites like Cissbury Ring and White Sheet Camp receive re-evaluations based on LiDAR analysis in my posts “Lidar Investigation Cissbury Ring through time” and “Lidar Investigation White Sheet Camp,“ revealing fascinating insights into their true purpose. I have also examined South Cadbury Castle, often linked to the mythical Camelot56.

My research also extends to ancient water management, including the role of canals and other linear earthworks. I have discussed the true origins of Car Dyke in multiple posts, including Car Dyke – ABC News Podcast and Lidar Investigation Car Dyke – North Section, which suggest a Mesolithic origin 2357. I also explore the misidentification of Roman aqueducts, as seen in my posts on the Great Chesters (Roman) Aqueduct. My research has also been greatly informed by my post-glacial flooding hypothesis, which has helped explain landscape transformations over time. I have discussed this hypothesis in several posts, including AI now supports my Post-Glacial Flooding Hypothesis and Exploring Britain’s Flooded Past: A Personal Journey

Finally, my blog also investigates prehistoric burial practices, as seen in Prehistoric Burial Practices of Britain and explores the mystery of Pillow Mounds, often mistaken for medieval rabbit warrens, but with a potential link to Bronze Age cremation in my posts: Pillow Mounds: A Bronze Age Legacy of Cremation? and The Mystery of Pillow Mounds: Are They Really Medieval Rabbit Warrens?. My research also includes astronomical insights into ancient sites, for example, in Rediscovering the Winter Solstice: The Original Winter Festival. I also review new information about the construction of Stonehenge in The Stonehenge Enigma.

Further Reading

For those interested in British Prehistory, visit www.prehistoric-britain.co.uk, a comprehensive resource featuring an extensive collection of archaeology articles, modern LiDAR investigations, and groundbreaking research. The site also includes insights and excerpts from the acclaimed Robert John Langdon Trilogy, a series of books that explore Britain during the Prehistoric period. Titles in the trilogy include The Stonehenge Enigma, Dawn of the Lost Civilisation, and The Post-Glacial Flooding Hypothesis, which offer compelling evidence of ancient landscapes shaped by post-glacial flooding.

To further explore these topics, Robert John Langdon has developed a dedicated YouTube channel featuring over 100 video documentaries and investigations that complement the trilogy. Notable discoveries and studies showcased on the channel include 13 Things that Don’t Make Sense in History and the revelation of Silbury Avenue – The Lost Stone Avenue, a rediscovered prehistoric feature at Avebury, Wiltshire.

In addition to his main works, Langdon has released a series of shorter, accessible publications, ideal for readers delving into specific topics. These include:

For active discussions and updates on the trilogy’s findings and recent LiDAR investigations, join our vibrant community on Facebook. Engage with like-minded enthusiasts by leaving a message or contributing to debates in our Facebook Group.

Whether through the books, the website, or interactive videos, we aim to provide a deeper understanding of Britain’s fascinating prehistoric past. We encourage you to explore these resources and uncover the mysteries of ancient landscapes through the lens of modern archaeology.

For more information, including chapter extracts and related publications, visit the Robert John Langdon Author Page. Dive into works such as The Stonehenge Enigma or Dawn of the Lost Civilisation, and explore cutting-edge theories that challenge traditional historical narratives.

Other Blogs

s

t

Plato Was Right: The Archaeological Evidence the Academics Never Expected

Introduction

For more than a century, archaeology has treated Plato’s Atlantis as little more than an allegory. Students are taught that Atlantis was a philosophical invention. A morality tale. A fictional society created to demonstrate the dangers of arrogance and imperial ambition. (Plato’s Atlantis)

The problem with this explanation is simple.

Plato’s story contains an extraordinary number of specific claims.

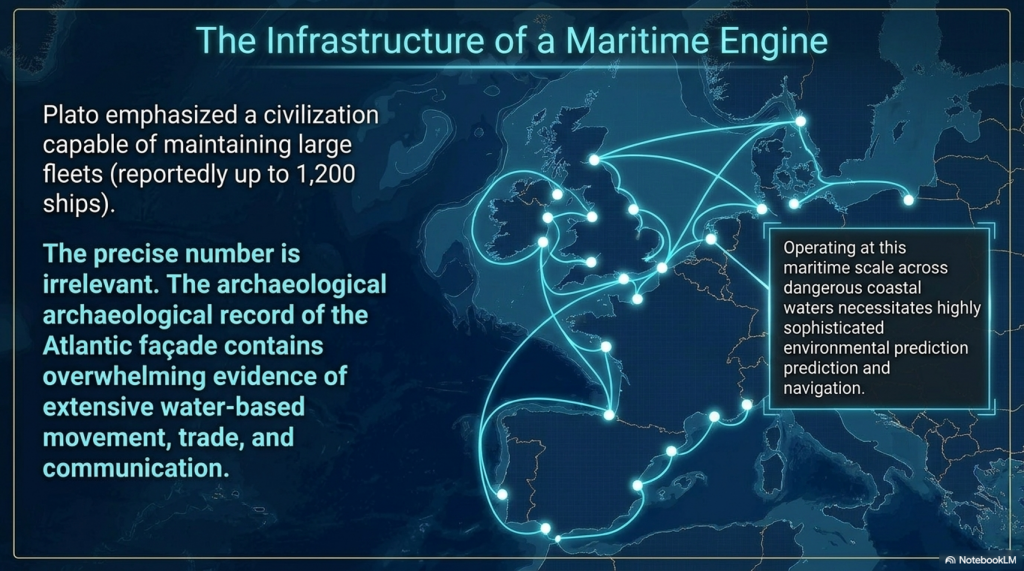
He described a powerful maritime civilisation existing around 9,000 years before Solon. He placed it beyond the Pillars of Hercules in a sea that bears its name to this day – the Atlantic Ocean. He claimed it possessed fleets capable of travelling vast distances, maintained contact with distant lands, and ultimately disappeared beneath the sea following catastrophic flooding.

Most importantly, Plato claimed the survivors of this lost civilisation seeded both Egypt and Greece.

For generations, academics dismissed the entire account as fiction.

The archaeology now suggests they may have been wrong.

(Plato's Atlantis)
(Plato’s Atlantis)

1. Atlantis and the Atlantic

One of the most overlooked aspects of Plato’s account is geography.

Atlantis was not described as a Mediterranean civilisation.

It lay beyond the Pillars of Hercules in the Atlantic Ocean.

Today, the ocean itself still carries the name.

Whether the ocean was named after Atlantis or Atlantis after the ocean is ultimately irrelevant. What matters is that Plato was clearly describing a civilisation connected to the Atlantic world rather than the eastern Mediterranean.

That distinction becomes critically important when we consider what archaeology has discovered during the last few decades.

(Plato's Atlantis)
(Plato’s Atlantis)

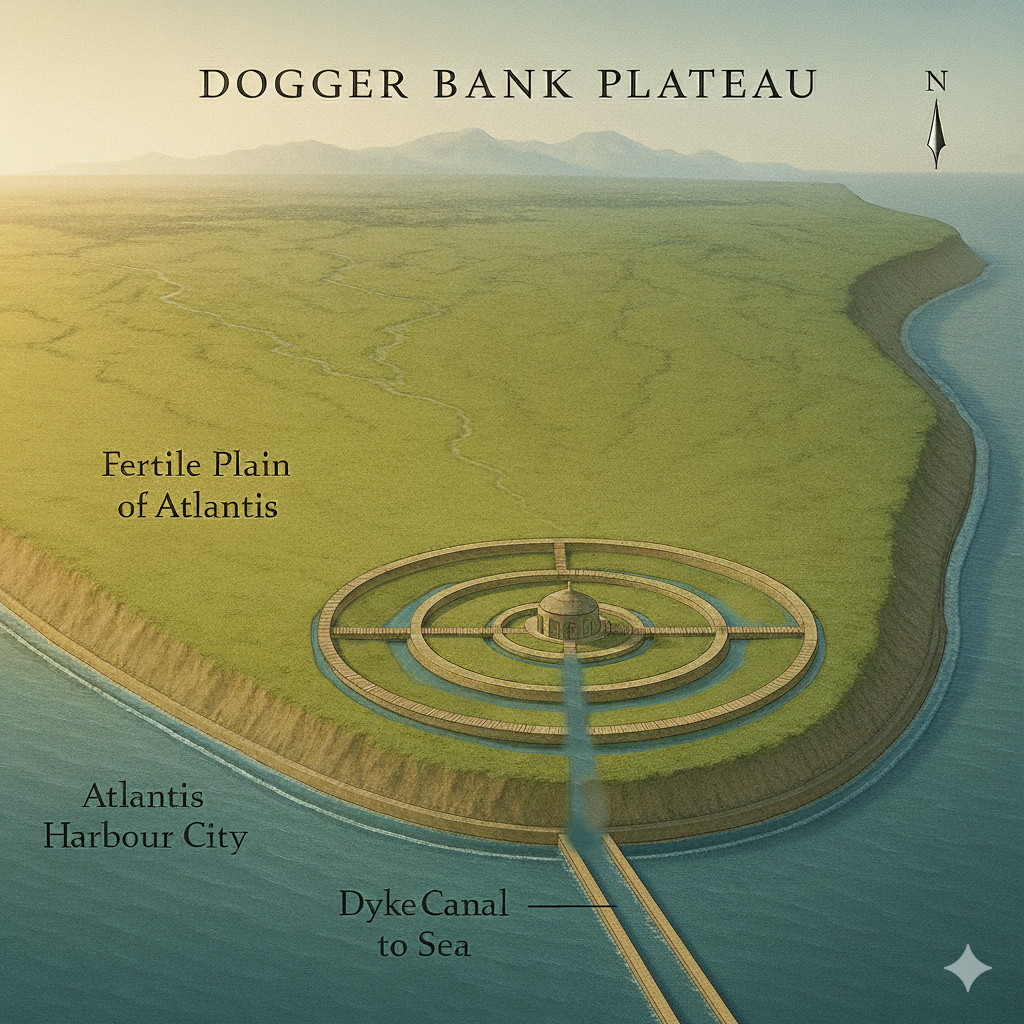
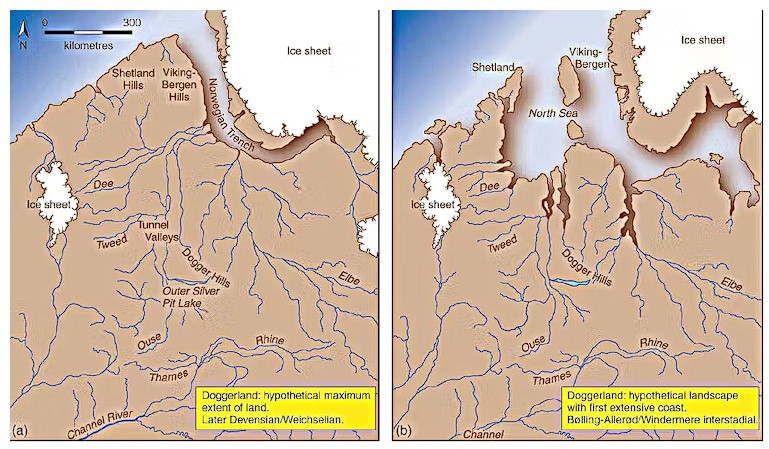
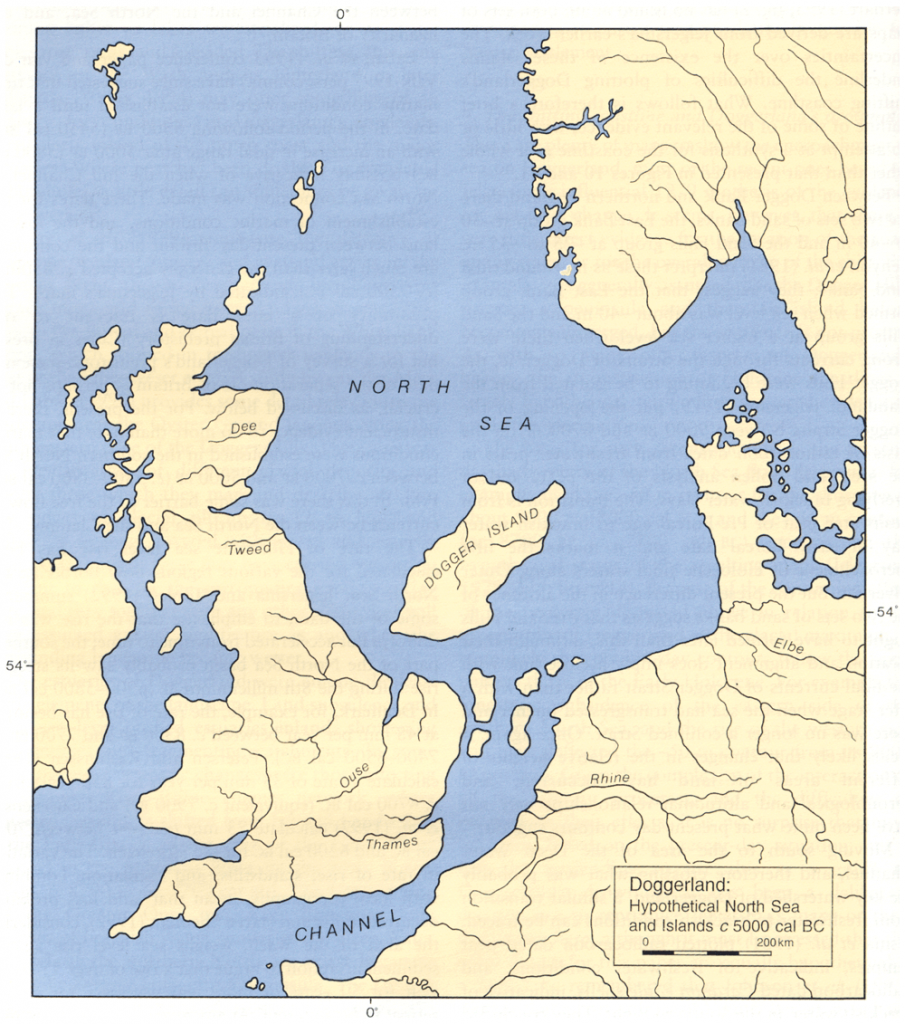
2. The Lost World Beneath the North Sea

When Plato wrote his account, nobody knew that an enormous inhabited landscape once existed beneath the North Sea.

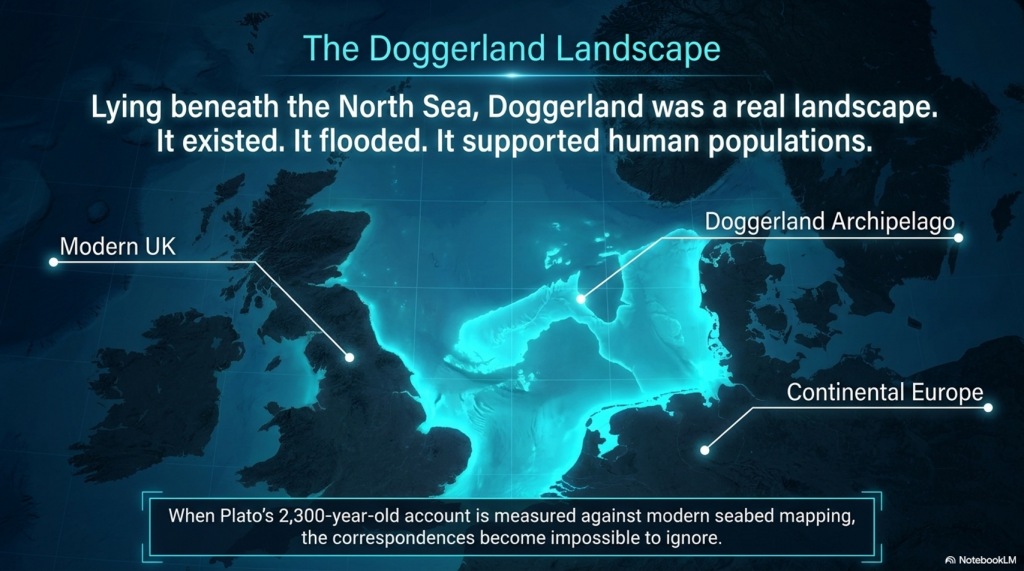
Today, we call it Doggerland.

During the Late Ice Age, Britain was connected to Europe by a vast plain crossed by rivers, lakes, forests and wetlands. This was not a small island. It was an entire country-sized landscape supporting human populations for thousands of years.

Then the climate changed.

The ice sheets melted.

Sea levels rose.

The land disappeared beneath the waves.

For centuries, such a drowned world would have been dismissed as fantasy.

Today, it is accepted in archaeology.

The existence of Doggerland alone demonstrates that Plato’s central premise – that large inhabited lands were lost beneath the sea – was not fantasy at all.

(Plato's Atlantis)
(Plato’s Atlantis)

3. The Great Flooding Event

Around 6200 BCE the Storegga tsunami and associated post-glacial flooding transformed the landscapes of north-west Europe.

Although flooding was not a single event, the combined effects of sea-level rise, coastal erosion and catastrophic inundation dramatically reduced the habitable land available to prehistoric populations.

The significance of this cannot be overstated.

An entire world disappeared.

Rivers vanished.

Coastlines moved.

Settlements were destroyed.

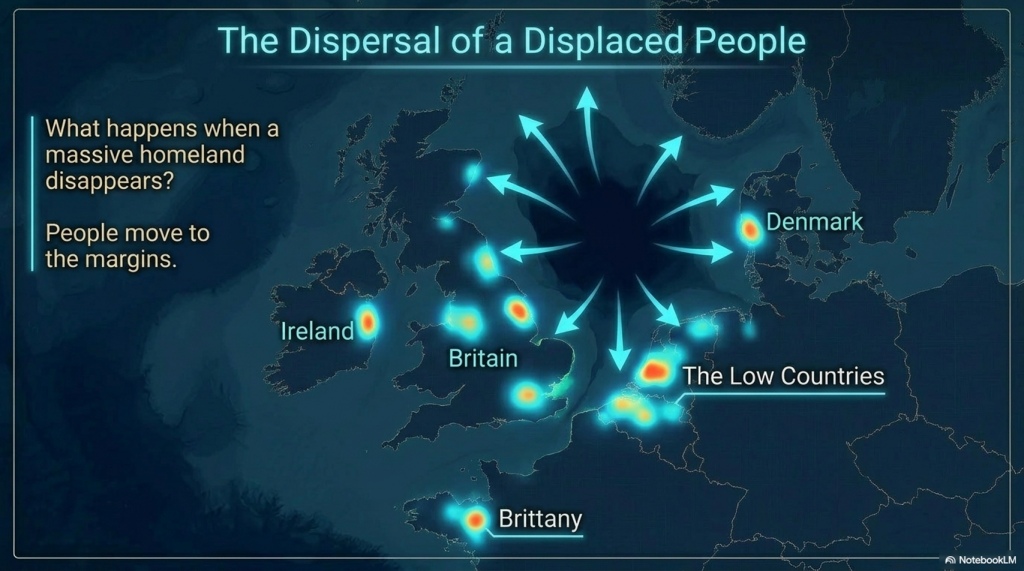
Migration became inevitable.

If a sophisticated maritime culture existed within Doggerland, it would have faced a simple choice:

Adapt, relocate or perish.

(Plato's Atlantis)
(Plato’s Atlantis)

4. Bouldnor Cliff Changes Everything

The discovery at Bouldnor Cliff is one of the most important archaeological finds ever made in Britain.

Dating to the seventh millennium BC, the site revealed evidence of advanced woodworking, boat use and long-distance connections.

Most remarkably, researchers recovered evidence of einkorn wheat.

This is not a trivial discovery.

Einkorn was not adopted in Britain for approximately another 3,000 years.

The presence of einkorn demonstrates contact with regions where the crop was already known and cultivated.

In other words, maritime connections already existed between Britain and distant communities long before conventional history would have us believe.

This single discovery destroys the notion that Mesolithic Britain was isolated from the wider world.

(Plato's Atlantis)
(Plato’s Atlantis)

5. Maritime Routes Create Ports

There is another implication that is rarely discussed.

Boats travelling between Britain and the Near East do not operate by magic.

They require food.

Fresh water.

Repairs.

Shelter.

Replacement crews.

Trade goods.

Every historical maritime network in history produced ports and anchorages.

The Phoenicians did it.

The Greeks did it.

The Romans did it.

The Vikings did it.

The Elizabethans did it.

There is no reason to imagine prehistoric sailors behaved differently.

Repeated voyages between the Atlantic and Anatolia would naturally create stopping points along the coasts of Iberia, southern France, Italy, Greece, and Egypt.

Over generations, these temporary anchorages would evolve into permanent trading communities.

Sailors would settle.

Families would form.

Local populations would mix.

Knowledge would spread.

This is how maritime civilisations have always operated.

(Plato's Atlantis)
(Plato’s Atlantis)

6. Plato’s Most Important Claim

Plato did not merely describe a lost civilisation.

He claimed that the survivors seeded both Egypt and Greece.

This is an astonishingly specific statement.

It creates a testable archaeological prediction.

If the account preserves genuine historical memory, then traces of unusual founder populations should appear in both Egypt and Greece during the period following the destruction of the Atlantic homeland.

Remarkably, that is exactly what the archaeology appears to reveal.

(Plato's Atlantis)
(Plato’s Atlantis)

7. Egypt: The First Foundation

The Egyptian evidence is striking.

The chronology reveals continuity rather than replacement.

EgyptGreece
Qarunian (7570–6200 BC)Aceramic Neolithic
Transitional Phase (6200–5550 BC)Early Neolithic
Early Faiyumian (5550–4650 BC)Nea Nikomedeia
Merimde (c.5000–4300 BC)Proto-Sesklo / Sesklo
Tasian (c.4500 BC onwards)Prodromos / Dimini

The populations associated with Merimde and the Tasian culture have been described as:

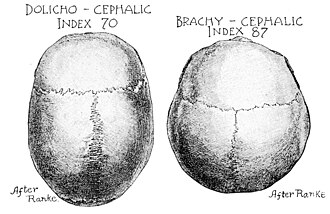
  • Long-headed.
  • Robust.
  • Physically distinct from many later Egyptians.
  • Generally taller than later predynastic populations.

Excavation reports also recorded individuals with sandy, ginger and even golden hair, leading archaeologists to suggest the existence of a fair strain within the population.

These are not modern interpretations.

They are observations recorded by the excavators themselves.

(Plato's Atlantis)
(Plato’s Atlantis)

8. Greece: The Second Foundation

The Greek evidence follows a remarkably similar pattern.

Early Neolithic populations appear on a timeline virtually identical to that of Egypt.

Sites such as Nea Nikomedeia, Sesklo and Prodromos represent some of the earliest organised communities in Europe.

Anthropological studies repeatedly describe Thessalian populations as predominantly long-headed.

At Prodromos, archaeologists discovered a remarkable cache of eleven human skulls deliberately placed beneath a house floor.

Dedicated anthropological investigations were conducted into these populations, exactly as occurred in Egypt.

The similarities are difficult to ignore.

EgyptGreece
Merimde long-headedThessalian populations described as long-headed
Tasian long-headedProdromos skull assemblage
Robust populationsFounder populations under anthropological study
Taller than later EgyptiansStature evidence incomplete
Fair-haired individualsEvidence currently absent
Continuity from earlier populationsContinuity from Early Neolithic founder settlements
(Plato's Atlantis)
(Plato’s Atlantis)

9. The Chronology Fits

When the chronology is compared directly, the pattern becomes even more remarkable.

DateNorth Sea / Atlantis ModelGreece
8000–7000 BCDoggerland extensiveMesolithic hunter-gatherers
7000–6500 BCPopulation displacement possibleEarliest Neolithic begins
6500–6000 BCLowland reductions continuingThessaly settlements expanding
6200–5500 BCTransitional phaseSesklo emerging
5500–5000 BCDoggerland fragmentedMajor Sesklo centre
5000–4500 BCSurvivor periodDimini and advanced settlements
4500–4000 BCMegalithic Structures EndIncreasing Aegean complexity
3500–3000 BCFarmers take over BritainCycladic maritime culture

The sequence is not proof.

But it is exactly the pattern we would expect if populations displaced from the Atlantic world contributed to later civilisations.

(Plato's Atlantis)
(Plato’s Atlantis)

10. The Allegory Has a Problem

The academic explanation has always been simple.

Atlantis was fictional.

The difficulty is that fictional stories are not supposed to generate accurate archaeological predictions.

Plato described:

  • A maritime civilisation.
  • An Atlantic homeland.
  • Catastrophic flooding.
  • A date close to the end of the Ice Age.
  • Survivors.
  • Egypt.
  • Greece.

Archaeology has now confirmed:

  • The drowned landscape.
  • The flooding.
  • The maritime networks.
  • Long-distance contacts.
  • Founder populations in Egypt.
  • Founder populations in Greece.

Nobody is claiming that every detail of Plato’s account has been proven.

What can no longer be maintained is the lazy assumption that the story was merely an allegory.

Two thousand four hundred years ago, Plato described a lost maritime world destroyed by rising seas whose survivors helped shape the civilisations that followed.

Today, archaeology is beginning to uncover evidence that such a world may have existed.

The greatest irony of all may be that the man historians dismissed as a storyteller was closer to the truth than the experts who spent a century insisting he was wrong.

(Plato's Atlantis)
(Plato’s Atlantis)

🌊 19 Reasons Why Doggerland Was Atlantis 🌊

The Atlantis Mystery Archaeology Doesn’t Want to Solve

For over 2,300 years, people have searched for Atlantis.

They have looked in the Mediterranean, the Atlantic Ocean, Antarctica, the Caribbean, Spain, Morocco, the Azores, and even Indonesia.

Yet there is a problem.

None of these proposed locations matches more than a handful of Plato’s descriptions.

Most require selective reading, reinterpretation, or outright dismissal of key details.

Doggerland is different.

Lying beneath the North Sea between Britain and Europe, Doggerland was a real landscape. It existed. It flooded. It supported human populations. And remarkably, when Plato’s account is compared to measurable evidence, the number of correspondences becomes difficult to ignore.

Here are 19 reasons why Doggerland remains the strongest candidate for Atlantis ever identified.


1️⃣ A Large Island Beyond the Mediterranean

Plato describes a vast landmass beyond the familiar world of the Mediterranean.

Doggerland once connected Britain to continental Europe and formed one of the largest habitable landscapes in north-west Europe before it disappeared beneath the sea.


2️⃣ A Vast Central Plain

Plato gives dimensions of approximately 2,000 by 3,000 stadia.

When converted into modern measurements, this equates to roughly 370 by 550 kilometres.

The reconstructed Doggerland plateau measures approximately 375 by 560 kilometres.

Few Atlantis candidates come anywhere close.


3️⃣ Mountains to the North

Plato describes mountains surrounding the northern edge of the plain.

Scotland, Norway and Scandinavia form exactly such a northern mountainous boundary around the North Sea basin.


4️⃣ A Landscape Dominated by Water

Atlantis was described as a landscape of rivers, channels and waterways.

Doggerland was criss-crossed by major river systems, wetlands, lakes, estuaries and palaeochannels now mapped beneath the North Sea.


5️⃣ A Maritime Civilisation

Plato repeatedly emphasises ships and seafaring.

The Atlantic façade and North Sea region contain overwhelming evidence for water-based movement, trade and communication.


6️⃣ Large-Scale Hydraulic Engineering

Plato describes canals and water management on a huge scale.

Britain and north-west Europe preserve extensive dykes, canals, causewayed enclosures and engineered earthworks whose original purposes remain debated.


7️⃣ Concentric Rings of Land and Water

One of Atlantis’s most famous features.

Concentric enclosures, ring monuments and circular hydraulic structures occur throughout Atlantic Europe.


8️⃣ A Fertile Plain

Plato describes a rich agricultural landscape.

Pollen records, peat deposits and sediment analysis reveal that Doggerland supported extensive woodland, grassland and productive river valleys.


9️⃣ Marshes and Wetlands

Atlantis was rich in freshwater.

Geological reconstruction consistently shows Doggerland as a landscape dominated by lakes, marshes, rivers and elevated groundwater systems.


🔟 Elephants

Critics often dismiss this detail.

Yet elephant remains are not only known from Europe—they are known from Britain.

Elephant, mammoth and hippopotamus remains have all been recovered from Britain and the North Sea basin.


1️⃣1️⃣ Advanced Engineering

Plato describes a highly organised civilisation.

The megalithic monuments of north-west Europe required surveying, transport, planning and engineering on a remarkable scale.


1️⃣2️⃣ Large Fleets

Atlantis supposedly maintained a fleet of around 1,200 ships.

Whether the exact number is correct is irrelevant.

Any maritime civilisation operating at this scale would require sophisticated navigation and environmental prediction.


1️⃣3️⃣ Environmental Monitoring Systems

This is where Stonehenge becomes important.

Stonehenge Phase 1 appears to function as a predictive lunar and tidal system operating within a water-dominated landscape.

Such infrastructure would be essential to a maritime culture.


1️⃣4️⃣ Progressive Flooding

Plato does not describe Atlantis disappearing overnight.

He describes destruction through flooding.

Doggerland vanished over thousands of years through repeated marine transgressions and rising sea levels.


1️⃣5️⃣ The Loss of the Homeland

Eventually, only fragments remained.

Between approximately 5200 and 4200 BCE the final Doggerland archipelago disappeared beneath the North Sea.


1️⃣6️⃣ Population Dispersal

What happens when a homeland disappears?

People move.

The concentration of megalithic monuments across Britain, Ireland, Brittany, Denmark, and the Low Countries is consistent with populations relocating along the margins of the former basin.


1️⃣7️⃣ Preservation of Memory

Civilisations remember disasters.

Stonehenge Phase 2 may represent the monumentalisation of that memory, transforming an earlier functional system into a permanent stone memorial.


1️⃣8️⃣ Physical Links to the Lost Land

Memory is often preserved through objects.

The Altar Stone may provide a physical connection between Stonehenge and the broader northern landscape associated with Doggerland.


1️⃣9️⃣ A Great Civilisation Remembered

Plato claimed Atlantis survived as a story long after the land itself disappeared.

If a maritime culture occupied Doggerland and its destruction became embedded within oral tradition, Plato’s account may preserve the final echo of a real prehistoric catastrophe.


The Real Question

Taken individually, none of these points proves the existence of Atlantis.

But that is not the test.

The test is whether any other Atlantis candidate matches so many independent categories simultaneously.

✅ Geography

✅ Dimensions

✅ Chronology

✅ Hydrology

✅ Environmental reconstruction

✅ Flooding history

✅ Maritime capability

✅ Engineering requirements

✅ Monument distribution

✅ Cultural memory

Most Atlantis theories match one or two features.

Doggerland matches nearly all of them.

The question is no longer:

“Could Plato have described a flooded landscape?”

The evidence suggests he probably did.

The real question is:

What other known landscape matches Plato’s description better than Doggerland?

So far, nobody has produced one.


PODCAST

Author’s Biography

Robert John Langdon, a polymathic luminary, emerges as a writer, historian, and eminent specialist in LiDAR Landscape Archaeology.

His intellectual voyage has been interwoven with stints as an astute scrutineer in government and grand corporate bastions, a tapestry spanning British Telecommunications, Cable and Wireless, British Gas, and the esteemed University of London.

A decade hence, Robert’s transition into retirement unfurled a chapter of insatiable curiosity. This phase saw him immerse himself in Politics, Archaeology, Philosophy, and the enigmatic realm of Quantum Mechanics. His academic odyssey traversed the venerable corridors of knowledge hubs such as the Museum of London, University College London, Birkbeck College, The City Literature Institute, and Chichester University.

In the symphony of his life, Robert is a custodian of three progeny and a pair of cherished grandchildren. His sanctuary lies ensconced in the embrace of West Wales, where he inhabits an isolated cottage, its windows framing a vista of the boundless sea – a retreat from the scrutinising gaze of Her Majesty’s Revenue and Customs, an amiable clandestinity in the lap of nature.

Exploring Prehistoric Britain: A Journey Through Time

My blog delves into the fascinating mysteries of prehistoric Britain, challenging conventional narratives and offering fresh perspectives grounded in cutting-edge research, particularly LiDAR technology. I invite you to explore some key areas of my research. For example, the Wansdyke, often cited as a defensive structure, is re-examined in light of new evidence. I’ve presented my findings in my blog post Wansdyke: A British Frontier Wall – ‘Debunked’, and a Wansdyke LiDAR Flyover video further visualises my conclusions.

My work also often challenges established archaeological dogma. I argue that many sites, such as Hambledon Hill, commonly identified as Iron Age hillforts, are not what they seem. My posts Lidar Investigation Hambledon Hill – NOT an ‘Iron Age Fort’ and Unmasking the “Iron Age Hillfort” Myth explore these ideas in detail and offer an alternative view. Similarly, sites like Cissbury Ring and White Sheet Camp receive re-evaluations based on LiDAR analysis in my posts “Lidar Investigation Cissbury Ring through time” and “Lidar Investigation White Sheet Camp,“ revealing fascinating insights into their true purpose. I have also examined South Cadbury Castle, often linked to the mythical Camelot56.

My research also extends to ancient water management, including the role of canals and other linear earthworks. I have discussed the true origins of Car Dyke in multiple posts, including Car Dyke – ABC News Podcast and Lidar Investigation Car Dyke – North Section, which suggest a Mesolithic origin 2357. I also explore the misidentification of Roman aqueducts, as seen in my posts on the Great Chesters (Roman) Aqueduct. My research has also been greatly informed by my post-glacial flooding hypothesis, which has helped explain landscape transformations over time. I have discussed this hypothesis in several posts, including AI now supports my Post-Glacial Flooding Hypothesis and Exploring Britain’s Flooded Past: A Personal Journey

Finally, my blog also investigates prehistoric burial practices, as seen in Prehistoric Burial Practices of Britain and explores the mystery of Pillow Mounds, often mistaken for medieval rabbit warrens, but with a potential link to Bronze Age cremation in my posts: Pillow Mounds: A Bronze Age Legacy of Cremation? and The Mystery of Pillow Mounds: Are They Really Medieval Rabbit Warrens?. My research also includes astronomical insights into ancient sites, for example, in Rediscovering the Winter Solstice: The Original Winter Festival. I also review new information about the construction of Stonehenge in The Stonehenge Enigma.

Further Reading

For those interested in British Prehistory, visit www.prehistoric-britain.co.uk, a comprehensive resource featuring an extensive collection of archaeology articles, modern LiDAR investigations, and groundbreaking research. The site also includes insights and excerpts from the acclaimed Robert John Langdon Trilogy, a series of books that explore Britain during the Prehistoric period. Titles in the trilogy include The Stonehenge Enigma, Dawn of the Lost Civilisation, and The Post-Glacial Flooding Hypothesis, which offer compelling evidence of ancient landscapes shaped by post-glacial flooding.

To further explore these topics, Robert John Langdon has developed a dedicated YouTube channel featuring over 100 video documentaries and investigations that complement the trilogy. Notable discoveries and studies showcased on the channel include 13 Things that Don’t Make Sense in History and the revelation of Silbury Avenue – The Lost Stone Avenue, a rediscovered prehistoric feature at Avebury, Wiltshire.

In addition to his main works, Langdon has released a series of shorter, accessible publications, ideal for readers delving into specific topics. These include:

For active discussions and updates on the trilogy’s findings and recent LiDAR investigations, join our vibrant community on Facebook. Engage with like-minded enthusiasts by leaving a message or contributing to debates in our Facebook Group.

Whether through the books, the website, or interactive videos, we aim to provide a deeper understanding of Britain’s fascinating prehistoric past. We encourage you to explore these resources and uncover the mysteries of ancient landscapes through the lens of modern archaeology.

For more information, including chapter extracts and related publications, visit the Robert John Langdon Author Page. Dive into works such as The Stonehenge Enigma or Dawn of the Lost Civilisation, and explore cutting-edge theories that challenge traditional historical narratives.

Other Blogs

s

t

8000-year-old Cro-Magnon skull

Introduction

In 2011, Swedish archaeologists excavating the remarkable Mesolithic site of Kanaljorden near Motala uncovered one of the strangest prehistoric discoveries ever found in Europe — human skulls mounted on wooden stakes deliberately placed in a lake around 8,000 years ago.

The discovery stunned archaeologists because such behaviour is almost unknown among supposedly “primitive” Mesolithic hunter-gatherers.

Now, modern forensic reconstruction has finally allowed us to look directly into the face of one of these ancient Europeans — a man whose physical appearance strongly supports the long-standing view that many Mesolithic northern Europeans were direct descendants of the Cro-Magnon populations of Upper Palaeolithic Europe. (8000-year-old Cro-Magnon skull)


The Kanaljorden Discovery

The Kanaljorden site contained the remains of at least ten individuals:

  • nine adults
  • and one infant.

The remains had been carefully arranged on a submerged stone platform within what was once a shallow lake environment. Animal remains were also present, including:

  • wild boar
  • deer
  • moose
  • bear
  • and badger bones.

Most extraordinary of all was the discovery that two of the skulls still contained fragments of wooden stakes inserted through them, demonstrating that the heads had once been mounted and displayed publicly.

(8000-year-old Cro-Magnon skull)

The excavation report itself stated:

“The remains of wooden stakes were recovered inside two crania, indicating that they had been mounted.”

This is one of the only confirmed examples in European prehistory where human heads were deliberately displayed in this way.

The adult skulls also showed repeated patterns of trauma:

  • males generally received blows to the top of the skull
  • females displayed injuries to the side or rear of the head.

Importantly, many injuries had healed before death, indicating survival and long-term care after violent encounters.

This was clearly not a random burial site.

It reveals:

  • social organisation
  • ritual behaviour
  • structured treatment of the dead
  • violence
  • and long-term communal memory.

The Face of an Ancient Cro-Magnon

Swedish forensic artist Oscar Nilsson reconstructed one of the skulls using:

  • CT scanning
  • cranial measurements
  • archaeology
  • and genetic analysis.

The skull belonged to a man approximately 50 years old — relatively elderly for the Mesolithic period.

The Cro-Magnon skull -8000 year-old Cro-Magnon skull

The resulting reconstruction displayed:

  • a long-headed skull shape
  • a robust facial structure
  • pronounced cheekbones
  • blue eyes
  • light pigmentation
  • and strong northern European features.

These are precisely the characteristics historically associated with the Cro-Magnon populations of Upper Palaeolithic Europe.

(8000-year-old Cro-Magnon skull)

Modern archaeology often avoids the term “Cro-Magnon” for political and academic reasons, preferring labels such as:

  • Scandinavian Hunter-Gatherer (SHG)
  • Western Hunter-Gatherer (WHG)
  • or Mesolithic European.

But changing terminology does not erase biological continuity.

Historically, Cro-Magnon was used as a broad anthropological description for the robust Upper Palaeolithic Europeans characterised by:

  • dolichocephalic (long) skulls
  • strong facial structure
  • broad cheekbones
  • large cranial capacity
  • and powerful physical build.

The Kanaljorden skull clearly fits within this broader European Cro-Magnon morphological tradition.

Swedish 8000 year old man with a stake in his head
8000 year-old Cro-Magnon skull

Genetic Evidence Supports Continuity

Ancient DNA studies from Mesolithic Scandinavia have increasingly shown strong continuity between these northern hunter-gatherers and earlier Upper Palaeolithic Europeans.

The Motala individuals belonged to the ancient Scandinavian Hunter-Gatherer populations genetically linked to the wider Western Hunter-Gatherer groups of Europe.

These populations were not newcomers arriving with farming.

They were descendants of the ancient peoples who survived Europe’s Ice Age world.

The famous combination of:

  • blue eyes
  • lighter skin
  • and hunter-gatherer ancestry

has now been repeatedly identified within Mesolithic northern European populations.

This directly contradicts the outdated cartoon image of primitive, dark, brutish “cavemen” still promoted within much modern media and academic illustration.


(8000-year-old Cro-Magnon skull)
8000 year-old Cro-Magnon skull

A Sophisticated Mesolithic Society

The Kanaljorden site also destroys the simplistic idea that Mesolithic Europeans were disorganised nomadic primitives.

These people:

  • constructed ritual platforms
  • manipulated the dead
  • mounted skulls on stakes
  • organised ceremonial deposition
  • navigated complex wetland landscapes
  • and maintained social structures capable of caring for badly injured individuals.

The repeated trauma patterns strongly suggest organised interpersonal violence and possibly judicial or ritual punishment systems.

The public mounting of skulls may have functioned:

  • as ritual display
  • as warning
  • as ancestor veneration
  • or as social control.

Whatever the exact explanation, the behaviour demonstrates a highly structured society with symbolic systems far beyond the crude stereotypes still attached to the Mesolithic period.


The Importance of Water

The location itself is equally revealing.

Kanaljorden was not a dry settlement but a carefully selected wetland site during a period when post-glacial Europe remained heavily flooded and hydrologically unstable following the Ice Age.

The skulls were deliberately placed within a lake environment.

Across Mesolithic Europe, water repeatedly appears at the centre of:

  • ritual activity
  • movement
  • settlement
  • and survival.

Wetlands, estuaries, lakes, and river systems were not marginal places — they were the infrastructure of prehistoric Europe.

This supports the growing evidence that post-Ice Age Europe remained within a heavily water-dominated landscape long after the glaciers had retreated.

(8000-year-old Cro-Magnon skull)

Reconsidering the Mesolithic Europeans

The Kanaljorden skulls force us to rethink what Mesolithic Europe really looked like.

These were not primitive savages barely surviving after the Ice Age.

They were:

  • organised
  • adaptable
  • maritime
  • ritualistic
  • socially structured
  • and biologically continuous with the great Cro-Magnon populations of prehistoric Europe.

Modern terminology may attempt to bury the old classifications beneath layers of academic relabelling, but the physical and genetic continuity remains visible.

The reconstructed face of this 8,000-year-old European is not simply a curiosity from the past.

It is the face of the people who inherited Ice Age Europe — the descendants of Cro-Magnon civilisation itself.

PODCAST

Author’s Biography

Robert John Langdon, a polymathic luminary, emerges as a writer, historian, and eminent specialist in LiDAR Landscape Archaeology.

His intellectual voyage has been interwoven with stints as an astute scrutineer in government and grand corporate bastions, a tapestry spanning British Telecommunications, Cable and Wireless, British Gas, and the esteemed University of London.

A decade hence, Robert’s transition into retirement unfurled a chapter of insatiable curiosity. This phase saw him immerse himself in Politics, Archaeology, Philosophy, and the enigmatic realm of Quantum Mechanics. His academic odyssey traversed the venerable corridors of knowledge hubs such as the Museum of London, University College London, Birkbeck College, The City Literature Institute, and Chichester University.

In the symphony of his life, Robert is a custodian of three progeny and a pair of cherished grandchildren. His sanctuary lies ensconced in the embrace of West Wales, where he inhabits an isolated cottage, its windows framing a vista of the boundless sea – a retreat from the scrutinising gaze of Her Majesty’s Revenue and Customs, an amiable clandestinity in the lap of nature.

Exploring Prehistoric Britain: A Journey Through Time

My blog delves into the fascinating mysteries of prehistoric Britain, challenging conventional narratives and offering fresh perspectives grounded in cutting-edge research, particularly LiDAR technology. I invite you to explore some key areas of my research. For example, the Wansdyke, often cited as a defensive structure, is re-examined in light of new evidence. I’ve presented my findings in my blog post Wansdyke: A British Frontier Wall – ‘Debunked’, and a Wansdyke LiDAR Flyover video further visualises my conclusions.

My work also often challenges established archaeological dogma. I argue that many sites, such as Hambledon Hill, commonly identified as Iron Age hillforts, are not what they seem. My posts Lidar Investigation Hambledon Hill – NOT an ‘Iron Age Fort’ and Unmasking the “Iron Age Hillfort” Myth explore these ideas in detail and offer an alternative view. Similarly, sites like Cissbury Ring and White Sheet Camp receive re-evaluations based on LiDAR analysis in my posts “Lidar Investigation Cissbury Ring through time” and “Lidar Investigation White Sheet Camp,“ revealing fascinating insights into their true purpose. I have also examined South Cadbury Castle, often linked to the mythical Camelot56.

My research also extends to ancient water management, including the role of canals and other linear earthworks. I have discussed the true origins of Car Dyke in multiple posts, including Car Dyke – ABC News Podcast and Lidar Investigation Car Dyke – North Section, which suggest a Mesolithic origin 2357. I also explore the misidentification of Roman aqueducts, as seen in my posts on the Great Chesters (Roman) Aqueduct. My research has also been greatly informed by my post-glacial flooding hypothesis, which has helped explain landscape transformations over time. I have discussed this hypothesis in several posts, including AI now supports my Post-Glacial Flooding Hypothesis and Exploring Britain’s Flooded Past: A Personal Journey

Finally, my blog also investigates prehistoric burial practices, as seen in Prehistoric Burial Practices of Britain and explores the mystery of Pillow Mounds, often mistaken for medieval rabbit warrens, but with a potential link to Bronze Age cremation in my posts: Pillow Mounds: A Bronze Age Legacy of Cremation? and The Mystery of Pillow Mounds: Are They Really Medieval Rabbit Warrens?. My research also includes astronomical insights into ancient sites, for example, in Rediscovering the Winter Solstice: The Original Winter Festival. I also review new information about the construction of Stonehenge in The Stonehenge Enigma.

Further Reading

For those interested in British Prehistory, visit www.prehistoric-britain.co.uk, a comprehensive resource featuring an extensive collection of archaeology articles, modern LiDAR investigations, and groundbreaking research. The site also includes insights and excerpts from the acclaimed Robert John Langdon Trilogy, a series of books that explore Britain during the Prehistoric period. Titles in the trilogy include The Stonehenge Enigma, Dawn of the Lost Civilisation, and The Post-Glacial Flooding Hypothesis, which offer compelling evidence of ancient landscapes shaped by post-glacial flooding.

To further explore these topics, Robert John Langdon has developed a dedicated YouTube channel featuring over 100 video documentaries and investigations that complement the trilogy. Notable discoveries and studies showcased on the channel include 13 Things that Don’t Make Sense in History and the revelation of Silbury Avenue – The Lost Stone Avenue, a rediscovered prehistoric feature at Avebury, Wiltshire.

In addition to his main works, Langdon has released a series of shorter, accessible publications, ideal for readers delving into specific topics. These include:

For active discussions and updates on the trilogy’s findings and recent LiDAR investigations, join our vibrant community on Facebook. Engage with like-minded enthusiasts by leaving a message or contributing to debates in our Facebook Group.

Whether through the books, the website, or interactive videos, we aim to provide a deeper understanding of Britain’s fascinating prehistoric past. We encourage you to explore these resources and uncover the mysteries of ancient landscapes through the lens of modern archaeology.

For more information, including chapter extracts and related publications, visit the Robert John Langdon Author Page. Dive into works such as The Stonehenge Enigma or Dawn of the Lost Civilisation, and explore cutting-edge theories that challenge traditional historical narratives.

Other Blogs

s

t


The Ascent of Man — From Survival to Systems

1. Humanity Before the Breakthrough

For most of human history, change was painfully slow. Early members of the genus Homo survived through hunting, gathering, and simple tool use, but across hundreds of thousands of years the archaeological record shows remarkable continuity rather than rapid advancement. Species such as Homo erectus and later populations associated with Homo heidelbergensis spread across Africa, Europe, and Asia, adapting to local conditions but leaving behind technologies that altered only gradually through time. (The Ascent of Man — From Survival to Systems)

The tools they produced were functional but repetitive. Stone forms persisted for immense periods with little structural innovation, and activity appears largely localised rather than coordinated across large regions. Human groups survived successfully, but there is little evidence of widespread standardisation, long-distance organisation, or shared operational systems. Humanity endured — but it did not yet accelerate.

The Ascent of Man — From Survival to Systems

2. The Ice Age World

The Late Pleistocene world was shaped by instability. Vast ice sheets covered northern Europe and North America, sea levels were dramatically lower, and habitable regions shifted constantly in response to climatic oscillations. Britain itself was periodically buried beneath ice or connected directly to mainland Europe through the lowland plains of Doggerland.

As climates fluctuated, populations were repeatedly compressed into environmental refuges. In North Africa and the Near East, expanding deserts restricted movement into narrow corridors such as the Nile Valley. During wetter periods, however, enormous territories reopened. Grasslands, rivers, and lakes spread across what is now the Sahara, creating migration routes that allowed human populations to disperse rapidly into Eurasia. Environmental change did not simply alter landscapes — it redirected humanity itself.


The Ascent of Man — From Survival to Systems

3. The Arrival of Modern Humans in Europe

Around 45,000 years ago, anatomically modern humans entered Europe. These populations, later known as “Cro-Magnon,” spread rapidly across the continent, from France and Spain to Russia and Britain. Sites such as Paviland Cave in Wales, Sungir in Russia, and Dolní Věstonice in the Czech Republic reveal the presence of these early Europeans across an enormous geographical range.

What makes these populations important is not simply their anatomy, but the sudden transformation visible in the archaeological record associated with them. The Upper Palaeolithic does not merely continue earlier traditions — it behaves differently. Tool production becomes increasingly standardised, methods are repeated across regions, and material culture begins operating according to recognisable systems rather than isolated local practice.

The Ascent of Man — From Survival to Systems

4. The Upper Palaeolithic Revolution

For over two million years, human technology remained comparatively conservative. Then, within a relatively short archaeological window, a dramatic transition appears. Long, standardised blades replace crude variability. Bone, antler, and ivory are worked systematically into specialised tools. Production methods spread across enormous distances with remarkable consistency.

This is the real significance of the Upper Palaeolithic. Human behaviour becomes structured. Artefacts are no longer random outputs of survival, but components within organised systems of manufacture and use. The archaeological record suddenly begins displaying repetition, correction, standardisation, and coordination. Humanity was no longer simply adapting to the world — it was beginning to engineer solutions within it.

The Ascent of Man — From Survival to Systems

5. Art, Symbolism, and Shared Thought

The same pattern appears in symbolic behaviour. Cave art emerges across Europe in locations such as Lascaux, Chauvet Cave, and Altamira Cave. These sites display recurring techniques, recurring animals, and repeated visual conventions separated by vast geographical distances.

Burial practices also become increasingly structured. Ochre use, grave goods, body positioning, and ceremonial treatment repeat across multiple regions. This consistency matters. It demonstrates that information, practices, and behavioural systems were now spreading between populations rather than remaining isolated within local groups. Shared thought had become geographically mobile.

The Ascent of Man — From Survival to Systems

6. Water, Mobility, and the Rise of Networks

As the Ice Age ended, rivers, wetlands, estuaries, and coastlines dominated much of Eurasia. In this environment, waterborne movement became increasingly important. Waterways were not obstacles — they were transport corridors. The emergence of maritime adaptation transformed the scale at which human populations could operate.

One of the clearest examples comes from Gobustan Rock Art Cultural Landscape near the Caspian Sea, where prehistoric engravings depict long boats carrying organised crews. These images suggest coordinated water transport thousands of years before formal civilisation emerged. Rivers and coastlines now linked populations together, accelerating trade, migration, and cultural exchange across enormous distances.

The Ascent of Man — From Survival to Systems

7. Physical Characteristics of Cro-Magnon Populations

The skeletal evidence associated with Upper Palaeolithic Europeans reveals populations that were physically robust and highly active. Long bones display pronounced muscle attachment sites, dense structure, and adaptations consistent with sustained physical exertion. Many well-preserved individuals stood at or above 1.8 metres tall, placing them among the taller known prehistoric populations.

Cranial capacity is equally striking. Upper Palaeolithic skulls typically range from 1,500 to 1,650 cubic centimetres, with some exceeding 1,700 cc — placing them at the upper end of known human variation. While cranial volume alone does not determine intelligence, it remains a measurable anatomical distinction. Combined with the behavioural evidence, these populations represent a phase in which human capability appears to expand dramatically in both physical and organisational terms.

The Ascent of Man — From Survival to Systems

8. Genetics, Mixture, and Human Continuity

Modern genetic evidence confirms that these populations were not isolated species, but part of the wider Homo sapiens lineage. Ancient DNA studies show continuity between Upper Palaeolithic Europeans and later populations, alongside evidence of admixture with Neanderthals. Modern non-African populations still retain approximately 1–4% Neanderthal DNA.

At the same time, the genetic record reveals that human history was not a simple replacement process. Populations mixed, migrated, adapted, and survived through complex interactions across Eurasia. Studies such as Caramelli et al. (2008) even identified mitochondrial lineages from Upper Palaeolithic Europeans that are still present in modern populations. The evidence increasingly points toward continuity combined with transformation rather than disappearance and replacement.


The Ascent of Man — From Survival to Systems

9. The Disappearance of the Cro-Magnon Label

Despite its historical importance, the term “Cro-Magnon” has largely disappeared from formal anthropology. Modern classification groups these populations into the broader category of Homo sapiens, emphasising shared ancestry rather than distinct regional populations. Scientifically, this creates consistency — but it also reduces resolution.

The archaeological patterns associated with Cro-Magnon populations remain visible regardless of terminology. Standardised industries, structured behaviour, symbolic repetition, maritime adaptation, and large-scale coordination all still exist within the record. What has changed is not the evidence itself, but the framework used to describe it. The question is therefore not whether Cro-Magnon was a separate species, but whether current models fully explain the scale of behavioural change associated with these populations.

The Ascent of Man — From Survival to Systems

10. The Turning Point of Humanity

This is the real problem posed by the Upper Palaeolithic.

For millions of years, humans survived in relatively small groups using localised technologies that changed only slowly. Then, within a comparatively brief period, behaviour transformed. Systems emerged. Production became standardised. Activity spread across entire continents according to shared methods and repeatable structures.

Everything that follows in human history depends on this transition.

The principles first visible in the Upper Palaeolithic — coordination, measurement, repetition, mobility, and structured behaviour — are the same principles that later underpin agriculture, trade, engineering, navigation, mathematics, and eventually civilisation itself. Without this shift, humanity remains a species surviving within nature rather than organising it.

The great question is therefore not whether this transformation occurred, because the archaeological record clearly shows that it did.

The real question is:

How did humanity go from isolated survival… to organised systems capable of reshaping the world? And did these people build the Megalithic structures that have lasted ten thousand years and thrown archaeology into confusion by not recognising an advanced Lost Civilisation at the Dawn of Humanity?

PODCAST

Author’s Biography

Robert John Langdon, a polymathic luminary, emerges as a writer, historian, and eminent specialist in LiDAR Landscape Archaeology.

His intellectual voyage has been interwoven with stints as an astute scrutineer in government and grand corporate bastions, a tapestry spanning British Telecommunications, Cable and Wireless, British Gas, and the esteemed University of London.

A decade hence, Robert’s transition into retirement unfurled a chapter of insatiable curiosity. This phase saw him immerse himself in Politics, Archaeology, Philosophy, and the enigmatic realm of Quantum Mechanics. His academic odyssey traversed the venerable corridors of knowledge hubs such as the Museum of London, University College London, Birkbeck College, The City Literature Institute, and Chichester University.

In the symphony of his life, Robert is a custodian of three progeny and a pair of cherished grandchildren. His sanctuary lies ensconced in the embrace of West Wales, where he inhabits an isolated cottage, its windows framing a vista of the boundless sea – a retreat from the scrutinising gaze of Her Majesty’s Revenue and Customs, an amiable clandestinity in the lap of nature.

Exploring Prehistoric Britain: A Journey Through Time

My blog delves into the fascinating mysteries of prehistoric Britain, challenging conventional narratives and offering fresh perspectives grounded in cutting-edge research, particularly LiDAR technology. I invite you to explore some key areas of my research. For example, the Wansdyke, often cited as a defensive structure, is re-examined in light of new evidence. I’ve presented my findings in my blog post Wansdyke: A British Frontier Wall – ‘Debunked’, and a Wansdyke LiDAR Flyover video further visualises my conclusions.

My work also often challenges established archaeological dogma. I argue that many sites, such as Hambledon Hill, commonly identified as Iron Age hillforts, are not what they seem. My posts Lidar Investigation Hambledon Hill – NOT an ‘Iron Age Fort’ and Unmasking the “Iron Age Hillfort” Myth explore these ideas in detail and offer an alternative view. Similarly, sites like Cissbury Ring and White Sheet Camp receive re-evaluations based on LiDAR analysis in my posts “Lidar Investigation Cissbury Ring through time” and “Lidar Investigation White Sheet Camp,“ revealing fascinating insights into their true purpose. I have also examined South Cadbury Castle, often linked to the mythical Camelot56.

My research also extends to ancient water management, including the role of canals and other linear earthworks. I have discussed the true origins of Car Dyke in multiple posts, including Car Dyke – ABC News Podcast and Lidar Investigation Car Dyke – North Section, which suggest a Mesolithic origin 2357. I also explore the misidentification of Roman aqueducts, as seen in my posts on the Great Chesters (Roman) Aqueduct. My research has also been greatly informed by my post-glacial flooding hypothesis, which has helped explain landscape transformations over time. I have discussed this hypothesis in several posts, including AI now supports my Post-Glacial Flooding Hypothesis and Exploring Britain’s Flooded Past: A Personal Journey

Finally, my blog also investigates prehistoric burial practices, as seen in Prehistoric Burial Practices of Britain and explores the mystery of Pillow Mounds, often mistaken for medieval rabbit warrens, but with a potential link to Bronze Age cremation in my posts: Pillow Mounds: A Bronze Age Legacy of Cremation? and The Mystery of Pillow Mounds: Are They Really Medieval Rabbit Warrens?. My research also includes astronomical insights into ancient sites, for example, in Rediscovering the Winter Solstice: The Original Winter Festival. I also review new information about the construction of Stonehenge in The Stonehenge Enigma.

Further Reading

For those interested in British Prehistory, visit www.prehistoric-britain.co.uk, a comprehensive resource featuring an extensive collection of archaeology articles, modern LiDAR investigations, and groundbreaking research. The site also includes insights and excerpts from the acclaimed Robert John Langdon Trilogy, a series of books that explore Britain during the Prehistoric period. Titles in the trilogy include The Stonehenge Enigma, Dawn of the Lost Civilisation, and The Post-Glacial Flooding Hypothesis, which offer compelling evidence of ancient landscapes shaped by post-glacial flooding.

To further explore these topics, Robert John Langdon has developed a dedicated YouTube channel featuring over 100 video documentaries and investigations that complement the trilogy. Notable discoveries and studies showcased on the channel include 13 Things that Don’t Make Sense in History and the revelation of Silbury Avenue – The Lost Stone Avenue, a rediscovered prehistoric feature at Avebury, Wiltshire.

In addition to his main works, Langdon has released a series of shorter, accessible publications, ideal for readers delving into specific topics. These include:

For active discussions and updates on the trilogy’s findings and recent LiDAR investigations, join our vibrant community on Facebook. Engage with like-minded enthusiasts by leaving a message or contributing to debates in our Facebook Group.

Whether through the books, the website, or interactive videos, we aim to provide a deeper understanding of Britain’s fascinating prehistoric past. We encourage you to explore these resources and uncover the mysteries of ancient landscapes through the lens of modern archaeology.

For more information, including chapter extracts and related publications, visit the Robert John Langdon Author Page. Dive into works such as The Stonehenge Enigma or Dawn of the Lost Civilisation, and explore cutting-edge theories that challenge traditional historical narratives.

Other Blogs

s

t

Cro-Magnon Megalithic Builders: Measurement, Biology, and the DNA

1. Introduction — Why This Debate Exists at All

The problem with prehistoric archaeology is not a lack of data.
It is a failure to ask the right questions.

For over a century, monuments such as Stonehenge, Avebury, and the great long barrows of Britain have been explained using labels: Neolithic, Beaker, Bronze Age, Western Hunter-Gatherer, Steppe ancestry. These terms sound authoritative, but they often function as placeholders rather than explanations. They tell us when something is assumed to belong — not who built it, how it was built, or whether the proposed builders were physically capable of the task.

This article is not about mythical “giants,” nor is it an exercise in sensationalism. The word itself is misleading and has done more harm than good. The real issue is human scale.

Cro-Magnon Megalithic Builders: Measurement, Biology, and the DNA

Archaeology routinely interprets prehistoric monuments using modern human averages: modern height, modern strength, modern endurance, modern tools, modern landscapes. Yet the physical evidence increasingly shows that the people who built Europe’s earliest monumental architecture were not physically ordinary by modern standards. They were taller, more robust, stronger, and cognitively adapted to a world very different from our own.

Once that fact is acknowledged, a series of long-standing problems begins to resolve themselves:

  • why monument construction timelines seem impossibly long
  • why antler-pick explanations fail repeatedly
  • why tool sizes appear “oversized”
  • why step-based measurement systems emerge so cleanly
  • why long barrows contain long-skulled individuals
  • why later farming populations reuse, rather than originate, these sites

The question, therefore, is not “Were these people giants?”
It is:

Are modern humans the wrong baseline for understanding prehistoric builders?

This blog argues that they are.

By bringing together osteology, cranial morphology, tool ergonomics, biomechanics, embodied measurement, hydrology, and palaeogeography, a coherent picture emerges—one that archaeology has partially documented, occasionally acknowledged, but never fully integrated.

At the centre of that picture are Cro-Magnon–derived populations, rooted in the lost landscapes of northern Europe, whose physical characteristics match the monuments they left behind.

What follows is not speculation.
It is a reconstruction based on bodies, tools, geometry, and landscapes — the things that do not recalibrate, relabel, or quietly disappear when theories change.

The Great Migration Hoax
Cro-Magnon Megalithic Builders: Measurement, Biology, and the DNA

2. Cro-Magnon ≠ Modern Human — Why Physiology Matters

One of the most persistent errors in prehistoric interpretation is the quiet assumption that all humans in the past were physically equivalent to us. This assumption is rarely stated outright, but it underpins almost every reconstruction: tool use, labour estimates, monument building rates, and even cognitive expectations.

The physical evidence does not support it.

Upper Palaeolithic and early Mesolithic populations traditionally grouped under the term Cro-Magnon display a suite of anatomical traits that consistently diverge from later agricultural populations and from modern post-industrial humans.

These differences are not marginal.

They include:

  • Greater average stature, particularly among males
  • More robust skeletal frames, with thicker cortical bone
  • Broader shoulders and longer limb proportions
  • Higher muscle attachment development, indicating sustained heavy loading
  • Larger average cranial capacity than modern Homo sapiens sapiens

Taken together, these traits describe a population adapted to high-energy expenditure, long-distance movement, and physically demanding tasks carried out over generations.

This is not surprising. Cro-Magnon populations lived in environments characterised by:

  • cold or unstable climates
  • protein-rich diets dominated by hunting, fishing, and aquatic resources
  • constant mobility across large landscapes
  • minimal reliance on agriculture or sedentary storage

In evolutionary terms, this favours size, strength, and endurance rather than reduction.

These patterns are well documented in Upper Palaeolithic and early Mesolithic osteological studies (e.g. Ruff 1994; Larsen 1995).

Cro-Magnon Megalithic Builders: Measurement, Biology, and the DNA

Agriculture Changed Bodies — It Did Not Improve Them

A crucial point often glossed over is that the transition to agriculture reduced human size and robustness, rather than enhancing it.

This is well established in bioarchaeology:

  • average stature declines after the adoption of farming
  • skeletal stress markers increase
  • nutritional diversity decreases
  • cranial capacity trends downward over time

These changes reflect dietary narrowing, increased disease load, and reduced physical demands, not biological advancement.

Later Neolithic and Bronze Age farming populations were not “better” versions of their predecessors — they were adapted to a different, more constrained way of life.

Using their bodies as the baseline for interpreting earlier monuments is, therefore, methodologically unsound.


Why This Matters for Monument Builders

If the builders of megalithic structures were:

  • taller
  • stronger
  • more robust
  • cognitively adapted to spatial and mechanical tasks

then many features that appear “mysterious” under modern assumptions become entirely reasonable:

  • oversized tools cease to be anomalous
  • heavy labour becomes sustainable
  • short, thick tool handles make ergonomic sense
  • step-based measurement systems become precise, not crude
  • construction timelines shrink dramatically

The monuments do not demand mythical strength.
They demand pre-agricultural bodies.


The Error of Compression

Modern archaeology tends to compress tens of thousands of years of biological change into a single category: modern humans.

That compression is administratively convenient, but scientifically inaccurate.

Cro-Magnon populations were human, but they were not physically modern in the way we are. Their bodies reflect a different ecological niche, one that vanished as agriculture, sedentism, and later population influxes reshaped Europe.

Understanding who built the megaliths begins with accepting that their bodies were not our bodies.

Everything that follows — tools, measurement, labour, and landscape use — depends on that fact.

Suitable references

  • Ruff, C. (1994). Morphological adaptation to climate in modern and fossil hominids. Yearbook of Physical Anthropology
  • Larsen, C. (1995). Biological changes in human populations with agriculture. Annual Review of Anthropology
Cro-Magnon Megalithic Builders: Measurement, Biology, and the DNA

3. The Fatal Modern Assumption: Abstract Measurement

Once prehistoric builders are quietly assumed to be physically identical to modern humans, a second assumption follows almost automatically: that they measured the world in the same abstract way that we do.

This assumption is rarely examined — yet it is foundational to how monuments are interpreted.

Modern societies measure using externalised units: rulers, tapes, rods, laser surveys, and digital grids. These systems are detached from the body. They exist precisely because bodies differ and standards must be imposed from outside.

Prehistoric societies did not work this way.

Across ethnography, archaeology, and early historical records, the same pattern appears repeatedly: measurement begins with the body.

Hands.
Feet.
Elbows.
Paces.
Steps.
Reach.

These are not crude approximations. They are repeatable, trainable, and internally consistent when used by a stable population with shared body norms.


Cro-Magnon Megalithic Builders: Measurement, Biology, and the DNA

Embodied Measurement Is Not Guesswork

The idea that body-based measurement is imprecise is a modern prejudice.

In reality:

  • a trained surveyor can reproduce step lengths with remarkable consistency
  • deliberate pacing differs from casual walking
  • ritualised or task-based gaits are consciously controlled
  • repetition over short distances cancels cumulative error

This is why body-based units dominate early engineering traditions worldwide, from megalithic Europe to ancient Egypt and beyond.

The unit is not the body at rest—it is the body in action.

Body-based measurement systems are ethnographically universal in pre-literate societies (e.g. Kula 1966; Rottländer 1989).


Why This Matters for Megalithic Monuments

If prehistoric builders measured using their bodies, then the body becomes the measuring instrument.

That has immediate consequences:

  • monument dimensions encode the builder’s physiology
  • spacing reflects gait and reach, not abstraction
  • regularity implies training, not symbolism
  • precision implies repetition, not advanced mathematics

Crucially, this also means that modern bodies are the wrong tool for reverse-engineering prehistoric layouts.

A shorter, lighter, post-agricultural population will not reproduce the same results — not because the builders were mystical, but because the baseline has changed.


The Archaeological Blind Spot

Archaeology often acknowledges body-based units in passing, only to abandon them in favour of abstract explanations when patterns emerge that do not fit expectations.

When a monument resolves cleanly into a repeating unit, the assumption is often that:

  • it must be symbolic
  • or numerological
  • or coincidental

Rarely is the most direct explanation tested:

What if the monument is laid out in human steps — but not modern ones?

Once this question is allowed, the focus shifts from abstract numbers to human biomechanics.

That shift is essential because it prepares us to understand one of the most critical pieces of evidence in Britain: the Aubrey Holes.

Suitable references

  • Rottländer, R. (1989). Maß und Zahl in der Vorgeschichte
  • Kula, W. (1966). Measures and Men
Cro-Magnon Megalithic Builders: Measurement, Biology, and the DNA

4. The Aubrey Holes — Measurement Frozen in Geometry

At Stonehenge, the earliest formal architectural phase is defined not by standing stones, but by a ring of 56 pits, traditionally known as the Aubrey Holes.

These features have been discussed for over three centuries, yet they remain poorly understood because they are usually treated as markers rather than as measurements.

That distinction matters.


What the Aubrey Holes Actually Are

The Aubrey Holes form a near-perfect circle approximately 87 metres in diameter, laid out with remarkable regularity given the absence of metal tools, written plans, or abstract surveying equipment.

What is often overlooked is this:

  • the holes are evenly spaced
  • the spacing is consistent around the full circumference
  • cumulative error is extremely low
  • the layout shows clear correction and control

This is not casual digging.
It is deliberate, repeated measurement.


Why Random or Symbolic Explanations Fail

If the Aubrey Holes were placed symbolically, ritually, or “by eye,” we would expect:

  • variable spacing
  • drift around the circle
  • local clustering or correction only at the end

Instead, what we see is the opposite: controlled regularity from start to finish.

This immediately rules out:

  • chance placement
  • approximate pacing
  • informal alignment

Something far more disciplined is at work.

Cro-Magnon Megalithic Builders: Measurement, Biology, and the DNA

The Critical Observation: Step-Based Spacing

When the arc distance between adjacent Aubrey Holes is examined, it resolves cleanly into a repeating human-scale interval.

Not a rope length.
Not a rod.
Not an abstract unit.

A step.

More precisely:

  • a deliberate, trained step
  • repeated consistently
  • over dozens of placements

Once recognised, this pattern becomes difficult to ignore.


Why Modern Replication Fails

Attempts to reproduce the Aubrey Hole spacing using modern average body dimensions consistently struggle to maintain accuracy around the full circle.

The reason is simple:

  • modern average step length is shorter
  • modern gait is optimised for comfort, not measurement
  • modern bodies are post-agricultural and post-industrial

When the wrong body is used, the geometry degrades.

This has led many researchers to conclude — incorrectly — that the precision must be symbolic, mathematical, or coincidental.

The alternative explanation is far simpler:

The builders’ bodies were different.

Cro-Magnon Megalithic Builders: Measurement, Biology, and the DNA

The Aubrey Holes as Physical Evidence

Unlike artefacts that can be moved, redeposited, or reused, the Aubrey Holes are fixed in the ground.

They preserve:

  • spacing
  • sequence
  • intent
  • correction

They are not affected by:

  • radiocarbon recalibration
  • DNA model revision
  • typological fashion

In that sense, they are among the most reliable pieces of evidence at Stonehenge.

They capture human action directly — frozen into chalk.

Measurements follow the surveyed dimensions published by Atkinson (1956) and Cleal et al. (1995).


Why This Matters

If the Aubrey Holes were laid out using deliberate human steps, then:

  • the step length becomes measurable
  • the body size of the surveyor can be inferred
  • the origin of later “units” can be explained
  • the monument stops being abstract

This takes us directly to the next problem archaeology has struggled with for decades:
The origin of the Megalithic Yard.

Suitable references

  • Atkinson, R. J. C. (1956). Stonehenge
  • Cleal, R., Walker, K., & Montague, R. (1995). Stonehenge in its Landscape
(Stonehenge: The Worlds First Computer)
Cro-Magnon Megalithic Builders: Measurement, Biology, and the DNA

5. The Megalithic Yard Reframed — Not a “Mystery Unit”

The Megalithic Yard has long been treated as an archaeological curiosity: widely measured, statistically persistent, yet conceptually uncomfortable. Alexander Thom demonstrated that a unit of approximately 2.72 feet (0.829 m) recurs across stone circles, flattened rings, ellipses, and stone rows throughout Britain and Atlantic Europe. That finding has never been seriously overturned. What Thom did not explain was where that unit originated.

The silence around its origin allowed a false assumption to harden: that the Megalithic Yard must have been an abstract standard, something equivalent to a measuring rod or conceptual unit imposed on the landscape. There is, however, no archaeological evidence for such a system. No rods, no standardised artefacts, no calibration objects, and no metrological infrastructure exist for Neolithic or early Mesolithic Britain.

What exists is physical geometry that demands a different explanation.

At Stonehenge Phase 1, the Aubrey Hole circle has a mean diameter of approximately 87.0 metres, giving a circumference of about 273.2 metres. Divided by the 56 Aubrey Holes, this produces a consistent arc spacing of roughly 4.88 metres between adjacent pits. That distance is not arbitrary. It resolves cleanly into six equal human steps, each of approximately 0.81–0.83 metres in length.

This matters because 0.82–0.83 metres is, within biological tolerance, the Megalithic Yard.

Cro-Magnon Megalithic Builders: Measurement, Biology, and the DNA

The correspondence is neither symbolic nor approximate. Six deliberate steps at ~0.82 m produce 4.92 m, six at ~0.813 m produce 4.88 m — exactly the observed spacing. Scaled around the full circle, this gives 56 × 6 = 336 deliberate survey steps, with no remainder and no cumulative drift. That level of closure cannot be produced by casual walking, visual estimation, or symbolic placement. It requires counted, deliberate pacing.

Once this is recognised, the Megalithic Yard stops being an abstract unit and becomes something far simpler: a trained human step.

Alexander Thom’s measurements (Thom 1967; Thom 1978)…

This also explains why Thom’s unit appears so consistently, despite the absence of physical standards. A paced step does not require rods or artefacts. It is self-calibrating within a population that shares similar body proportions and is trained to pace deliberately rather than walk casually. Minor local variation is expected, but large-scale coherence is preserved — exactly what Thom observed.

Biomechanics reinforces this interpretation. Deliberate survey steps are longer and more repeatable than everyday walking gait, typically scaling to about 42–45% of stature. The step length implied by the Aubrey Hole geometry therefore points to individuals in the 1.9–2.0 metre range, consistent with the robust, pre-agricultural bodies already documented osteologically. When modern average bodies are used, the geometry fails; spacing errors accumulate, and the circle degrades. The problem is not intelligence or technique — it is the wrong physiology.

Seen in this light, the Megalithic Yard does not represent lost mathematics or mysterious knowledge. It represents embodied measurement: space laid out by people who measured the land by moving through it, counting steps, correcting by eye, and repeating the process until precision was achieved.

Thom was right about the unit.
What was missing was the body.

The Megalithic Yard is not a mystery.
It is the footprint of the builders themselves, preserved in stone because it was first preserved in human movement.

Suitable references

  • Thom, A. (1967). Megalithic Sites in Britain
  • Thom, A. (1978). Megalithic Remains in Britain and Brittany
Cro-Magnon Megalithic Builders: Measurement, Biology, and the DNA

6. The Dating Mirage — Why C14 and DNA Mislead

The objection most often raised against any physical or geometric reading of prehistoric monuments is familiar and automatic: “but the dates say otherwise.” Radiocarbon determinations, genetic chronologies, and typological phases are treated as fixed constraints, against which all other evidence must yield. The difficulty is that these dates are not fixed in the way geometry is fixed. They are models, and their instability is measurable.

Radiocarbon dating has been recalibrated more than twenty times since its introduction. Each revision alters the relationship between measured radiocarbon decay and calendar age, sometimes shifting archaeological contexts by centuries without any change to the material itself. Sites confidently assigned to specific periods in the mid-twentieth century now sit elsewhere on the timeline, not because the past has moved, but because the calibration curve has. Even within a single calibration, individual determinations commonly carry uncertainty ranges of ±100–300 years at 95 % confidence, and well-known plateaus compress long spans of time into overlapping date ranges. Precision is often implied where it does not exist.

That statistical instability would be manageable if the context were secure. Frequently, it is not.

Cro-Magnon Megalithic Builders: Measurement, Biology, and the DNA

At Stonehenge, William Hawley’s excavations in the 1920s documented an 1801 port bottle found in situ within the monument. Taken at face value and using the same logic often applied to prehistoric artefacts, this would require Stonehenge to be a nineteenth-century monument. Archaeologists correctly rejected that conclusion because they understood the principle involved: association does not equal construction. Objects can intrude into earlier deposits, be redeposited, or relate to later activity rather than the original layout. In situ does not mean foundational.

The same logical error is nevertheless repeated when antler picks, charcoal fragments, or isolated artefacts are used to anchor monument construction thousands of years earlier. Such finds can date an episode of activity, but they do not, by themselves, date the origin of the structure. Context is often assumed rather than demonstrated, and the dates derived inherit that assumption.

DNA chronologies compound the problem. Despite confident narratives of population replacement and cultural succession, fewer than 0.1 % of prehistoric genetic samples derive from skeletons that are both securely dated and securely associated with the monuments they are invoked to explain. The majority of genetic timelines are statistical reconstructions built from sparse, uneven datasets distributed across large geographic areas and long spans of time. These projections can suggest ancestry and relatedness, but they do not encode stature, step length, grip strength, gait, or the physical capacity required to execute the actions preserved in monument geometry.

This is where dating models collide with physical evidence.

Radiocarbon curves recalibrate. Genetic mutation rates are revised. Typological sequences are reorganised. But a circle laid out by repeated deliberate steps remains paced, regardless of how its associated artefacts are re-dated. A tool that demands exceptional grip strength remains demanding, irrespective of the cultural label attached to it. Bodies do not retroactively change scale, and geometry does not migrate over time.

The hierarchy of evidence is therefore physical before chronological. Dating models must operate within the limits imposed by bodies, tools, and landscapes, not override them. When dates conflict with what the physical evidence allows, the appropriate response is to reassess the model, not to dismiss the measurement.

Radiocarbon and DNA are useful analytical tools. They are not immutable facts.
Dates are models. Geometry and bodies do not recalibrate.

Cro-Magnon Megalithic Builders: Measurement, Biology, and the DNA

7. Cranial Evidence — Long Heads and Long Barrows

Long before genetics, calibration curves, or cultural labels entered archaeological discourse, prehistoric populations were classified by something far simpler and far harder to dispute: their bones. In particular, cranial morphology provided one of the earliest and most consistent signals that Britain’s earliest monument builders were physically distinct from later populations.

The distinction is not subtle. Human skulls vary measurably in shape, and one of the most robust metrics is the cranial index, the ratio of maximum skull breadth to maximum skull length. Values below roughly 75 define dolichocephalic (long-headed) forms; values above 80 define brachycephalic (round-headed) forms. These are not cultural categories. They are measurements.

Across Britain, a persistent pattern emerges in early excavation reports: dolichocephalic skulls dominate Neolithic chambered tombs and long barrows, while later round barrows and Beaker-associated burials increasingly contain brachycephalic or mesocephalic forms. This association was so consistently observed in the nineteenth and early twentieth centuries that it entered archaeological shorthand: long heads for long barrows; round heads for round barrows.

One of the clearest examples comes from Belas Knap Long Barrow, excavated and published in detail by O. G. S. Crawford and others in the early twentieth century. The skulls recovered from Belas Knap, when viewed from above, show pronounced elongation, narrow breadth, and cranial indices firmly within the dolichocephalic range. These are not borderline cases. They are anatomically distinct from the rounder skull forms characteristic of later Bronze Age contexts.

Cro-Magnon Megalithic Builders: Measurement, Biology, and the DNA

What matters here is not taxonomy, but continuity of observation. These cranial distinctions were repeatedly recorded across multiple sites by different investigators, long before modern political or theoretical pressures entered the field. They were not invented to support a narrative; they were noticed because they were there.

The disappearance of this evidence from mainstream teaching did not occur because it was disproved. It happened because it became inconvenient. As archaeology moved toward models of continuity and cultural replacement without physical differentiation, cranial morphology posed a problem. Bones do not cooperate with tidy narratives. They either differ or they do not.

Crucially, the cranial evidence aligns with everything already established in the previous sections. Dolichocephalic skulls are associated with larger cranial capacities, which in turn correlate with the robust bodies, long limbs, and high-energy lifestyles documented for pre-agricultural populations. They sit comfortably alongside the step lengths implied by the Aubrey Hole geometry, the tool ergonomics requiring high grip strength, and the embodied measurement systems that precede abstraction.

By contrast, later Beaker-associated populations show a shift toward rounder skull forms, reduced robustness, and different burial architectures. This transition does not require invasion myths or replacement fantasies to explain it. It simply reflects population change over time, compounded by agriculture, diet narrowing, and later admixture.

The critical point is this: the people buried in long barrows were not physically identical to the people who later reused or repurposed these landscapes. The barrows preserve not just ritual practice, but the bodies of their builders. Those bodies are long-headed, robust, and consistent with the Cro-Magnon–derived populations already identified through physiology, biomechanics, and monument geometry.

Cranial morphology, therefore, provides an independent line of evidence that converges with the rest of the dataset. It does not stand alone, and it does not need to. It confirms what the measurements already imply: that Britain’s earliest monumental tradition belongs to a population physically distinct from later Bronze Age groups.

Cranial index thresholds follow standard physical anthropology definitions (e.g. Brothwell 1981; Bass 1995).

Bones do not recalibrate.
They do not migrate on typological timelines.
They remain exactly the shape they were when they were buried.

Suitable references

  • Brothwell, D. (1981). Digging Up Bones
  • Bass, W. (1995). Human Osteology
Cro-Magnon Megalithic Builders: Measurement, Biology, and the DNA

8. Cambridge Confirmation — Megalithic Builders ≠ Beaker People

The cranial distinction outlined in the previous section is not a relic of nineteenth-century typology, nor an artefact of early excavation bias. It has been independently confirmed in modern, peer-reviewed research, including work published through University of Cambridge and Cambridge University Press journals. What has shifted over time is not the skeletal evidence itself, but the interpretive framework applied to it.

Cambridge-linked analyses of Neolithic and Early Bronze Age human remains demonstrate a biological discontinuity between populations interred in chambered tombs and long barrows, and those associated with the Beaker complex (Sheridan 2010; Sheridan & Curtis 2004). The distinction is explicitly physical rather than cultural. Dolichocephalic (long-headed) skull forms dominate Neolithic chambered-tomb contexts, while brachycephalic (round-headed) forms are characteristic of Beaker-period burials, a pattern already recognised in early physical anthropology and now reaffirmed in modern synthesis.

This correspondence is not incidental. The association between long barrows and long-headed individuals was documented repeatedly across Britain and Atlantic Europe in the late nineteenth and early twentieth centuries, including classic case studies such as Belas Knap (Crawford 1925; Proceedings of the Society of Antiquaries 1864–1867). What modern Cambridge-published work demonstrates is that these early observations were not mistaken. They were simply unfashionable.

The implication is straightforward. If Beaker-associated populations were responsible for the construction of Britain’s major megalithic monuments, their skeletal signatures would be expected within the primary burial horizons of those monuments. They are not. Instead, Beaker-period remains appear as later insertions, consistent with reuse, adaptation, or occupation of landscapes already monumentalised by earlier populations (Sheridan & Curtis 2004).

Cro-Magnon Megalithic Builders: Measurement, Biology, and the DNA

This conclusion is reinforced when cranial morphology is considered alongside broader European datasets. Quantitative analyses of cranial form across the Neolithic–Bronze Age transition demonstrate measurable morphological shifts over time, rather than continuity, with long-headed forms dominant in earlier Neolithic contexts and rounder forms increasing later (Brace et al. 1993). These shifts align with changes in diet, subsistence, and population structure, not with the initial appearance of monumentality.

Cambridge research also highlights a second, frequently overlooked factor. The spatial distribution of Beaker artefacts across Europe does not match patterns expected from large-scale population replacement. Instead, Beaker material clusters strongly along river systems, estuaries, and coastal corridors, a behaviour consistent with exchange and contact networks rather than demographic swamping (Sheridan 2010). This mirrors the movement of other prestige goods, such as Alpine jade axes, which no serious archaeologist interprets as evidence for mass migration.

In this context, Beaker pottery functions as trade material rather than as a population marker. Objects move rapidly and widely; populations do not. Conflating artefact spread with monument authorship, therefore, introduces a category error.

When this evidence is set alongside monument geometry, step-based measurement, tool ergonomics, foot-scale biomechanics, and cranial form, the conclusion stabilises. Britain’s primary megalithic tradition belongs to a pre-Beaker population, physically distinct from later Bronze Age groups. That population closely corresponds to what has historically been described as Cro-Magnon-derived, without requiring claims of a separate species or speculative ancestry.

The role of Beaker groups is real but secondary. They enter landscapes already shaped, measured, and monumentalised by others. They leave material traces, but they do not originate the monumental system.

This is not a rejection of modern archaeology. It is a correction within it. The Cambridge evidence does not overturn early physical anthropology; it confirms it using modern analytical frameworks. The bones have not changed. Only the narrative has.

References cited in this section

  • Sheridan, A. (2010). The Neolithisation of Britain and Ireland: the “Big Picture”. Cambridge Archaeological Journal, 20(1), 89–105.
  • Sheridan, A., & Curtis, N. (2004). The Neolithic–Early Bronze Age transition in Britain. Cambridge Archaeological Journal, 14(1), 1–26.
  • Brace, C. L., et al. (1993). Clines and clusters versus “race”. Journal of Human Evolution, 24, 1–43.
  • Crawford, O. G. S. (1925). The Long Barrows of the Cotswolds.
  • Proceedings of the Society of Antiquaries, 2nd Series, Vol. 3 (1864–1867).
Cro-Magnon Megalithic Builders: Measurement, Biology, and the DNA

9. Trade, Not Invasion — The Beaker Distribution Problem

If the Beaker phenomenon represented a large-scale population replacement responsible for Britain’s megalithic monuments, its archaeological footprint would be broad and continuous. We would expect dense inland penetration, demographic saturation, and physical continuity between builders and Beaker burials. That is not what the evidence shows.

Instead, Beaker artefacts display a highly uneven spatial pattern. Across Britain and continental Europe, Beaker material clusters disproportionately along river systems, estuaries, and coastal corridors, with extensive inland regions showing sparse, episodic, or absent Beaker presence. This pattern has been documented repeatedly in large-scale syntheses of Beaker distribution (e.g. Needham 2005; Vander Linden 2007; Sheridan 2010). It is the spatial signature of exchange networks, not mass migration.

This distinction matters because population movement and object movement leave different archaeological fingerprints. Large-scale migration produces diffuse distributions across all habitable zones. Trade produces linear, network-driven patterns, focused along transport corridors where goods move efficiently. The Beaker record conforms closely to the latter.

A direct comparator is the distribution of Alpine jade axes. These objects originate from a handful of quarry zones in the western Alps yet appear across Atlantic Europe, including Britain and Ireland. Their movement is universally interpreted as trade and exchange rather than population displacement (Pétrequin et al. 2012). Beaker pottery exhibits an almost identical spatial logic: rapid spread, high visibility, and selective concentration along communication routes.

Chronology reinforces this interpretation. Beaker artefacts frequently appear after the construction of major monuments, inserted into landscapes already structured by long barrows, stone circles, and causewayed enclosures (Needham 2005; Sheridan & Curtis 2004). Where Beaker burials occur near earlier monuments, they are typically secondary, intrusive, or peripheral rather than foundational. The monuments are already there.

This undermines the common assumption that Beaker material culture equates to Beaker monument builders. Cultural packages can move far faster than people, particularly when prestige objects are involved. Treating the appearance of Beaker artefacts as evidence of authorship is therefore a category error — it confuses circulation with construction.

When this distributional evidence is set alongside earlier sections, the convergence is difficult to ignore. The bodies implied by monument geometry, step-based measurement, foot scale, tool ergonomics, and cranial morphology do not match later Beaker-associated populations. The monuments pre-exist widespread Beaker material. The artefacts arrive into an already monumentalised landscape.

None of this denies Beaker’s presence or influence. It places it correctly. Beaker groups interacted with existing populations, participated in exchange networks, and left a strong material signal — but they did not originate the megalithic tradition they encountered.

The Beaker distribution problem resolves cleanly once invasion assumptions are removed. What remains is a trade-driven network phenomenon layered onto an older demographic and monumental substrate.

Objects move easily.
People move slowly.
Monuments remember who was already there.


References cited in this section

  • Needham, S. (2005). Transforming Beaker culture in north-west Europe: processes of fusion and fission. Proceedings of the Prehistoric Society, 71, 171–217.
  • Vander Linden, M. (2007). What linked the Bell Beakers in third millennium BC Europe? Antiquity, 81, 343–352.
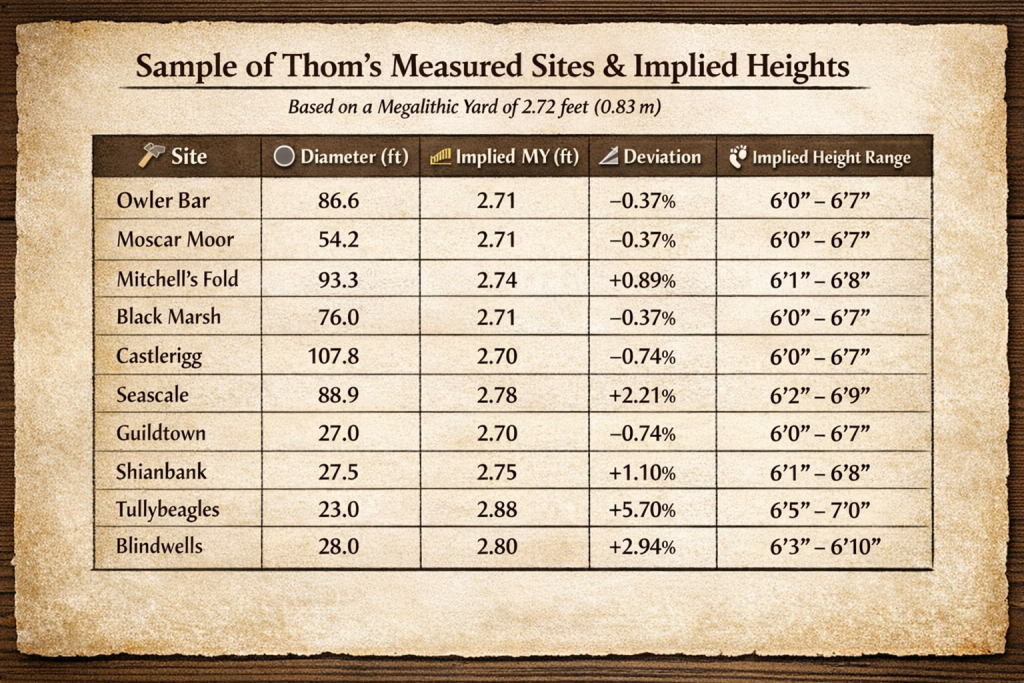
  • Sheridan, A. (2010). The Neolithisation of Britain and Ireland: the “Big Picture”. Cambridge Archaeological Journal, 20(1), 89–105.
  • Sheridan, A., & Curtis, N. (2004). The Neolithic–Early Bronze Age transition in Britain. Cambridge Archaeological Journal, 14(1), 1–26.
  • Pétrequin, P. et al. (2012). Jade: Objets-signes et interprétations sociales des jades alpins. Besanç
Cro-Magnon Megalithic Builders: Measurement, Biology, and the DNA

10. Brain Size and the “Efficiency” Excuse — When Biology Is Explained Away

As the physical evidence for robust, tall, long-headed early populations has accumulated, a new explanatory reflex has emerged: the claim that larger brains do not matter, because smaller brains are supposedly “more efficient.” This idea now appears routinely in popular summaries and institutional science communication, often presented as settled understanding rather than speculation.

It is not settled. It is a post hoc narrative.

Upper Palaeolithic and early Mesolithic populations, including those traditionally described as Cro-Magnon, consistently show larger average cranial capacities than later agricultural populations. Values in the range of 1,550–1,650 cm³ are common in Upper Palaeolithic samples, compared with Holocene farming populations that average closer to 1,350–1,450 cm³ (Ruff et al. 1997; Henneberg 1988). This is not a marginal difference. It represents a reduction on the order of 10–15% in absolute brain volume.

That reduction correlates temporally with the adoption of agriculture, dietary narrowing, reduced mobility, and skeletal gracilisation. These correlations have been documented repeatedly in osteological studies and are not controversial (Larsen 1995; Ruff 2002). What is controversial is the attempt to reframe this reduction as adaptive “efficiency” without independent evidence.

No direct measure of cognitive efficiency exists in the archaeological record. Claims that smaller brains are “more efficient” are therefore unfalsifiable assertions, not empirical conclusions. They explain an observed reduction after the fact, rather than predicting it. By contrast, the relationship between brain size, body size, and energetic demand is well established. Larger, more active bodies require greater neural capacity for sensorimotor control, spatial navigation, and coordination. As activity levels and dietary diversity decline, neural demands do too.

Stonehenge’s Lunar Calendar
Cro-Magnon Megalithic Builders: Measurement, Biology, and the DNA

This pattern is not unique to humans. In domesticated animals, including canids, brain size reduction is a consistent correlate of reduced behavioural demands. Wolves possess larger brains relative to body size than domestic dogs, not because wolves are less “efficient,” but because their ecological and behavioural requirements are greater (Kruska 1988; Kruska & Schott 1977). The direction of causation is clear: reduced demand leads to reduced neural investment.

The same logic applies to human populations transitioning from highly mobile, broad-spectrum subsistence to sedentary agriculture. Reduced ranging, simplified toolkits, and narrower diets lessen selective pressure on spatial cognition and sensorimotor integration. Brain size reduction follows. There is no independent evidence that this reduction reflects superior efficiency rather than lower functional demand.

This matters because attempts to downplay brain size differences are often used to neutralise the physical evidence discussed in earlier sections. Larger bodies, longer steps, heavier tools, and higher cranial capacities all point to populations operating at a different physical scale. Rather than addressing that scale directly, the “efficiency” argument seeks to dissolve it conceptually.

But the monuments do not cooperate with that manoeuvre.

The geometry preserved at Stonehenge Phase 1, the labour implied by large-scale ditching, the ergonomics of heavy stone tools, and the cranial forms found in long barrows all point toward populations with high physical and cognitive demand, not reduced ones. These demands are consistent with larger bodies and larger brains, not smaller, supposedly optimised ones.

The crucial point is that nothing in the archaeological record requires us to believe that smaller brains are better. The only thing required is that we accept the empirical sequence: as subsistence, mobility, and physical demands declined, so did average brain size. That is explanation enough.

Invoking “efficiency” does not add evidence. It removes discomfort.

When the physical record shows that earlier populations were larger, stronger, and more robust — cranially as well as skeletally — the responsible response is not to explain the difference away, but to account for it honestly.

Brains, like bodies, scale to demand.
When demand falls, so does size.
No narrative recalibration changes that.


Cro-Magnon Megalithic Builders: Measurement, Biology, and the DNA

References cited in this section

  • Ruff, C. B., Trinkaus, E., & Holliday, T. W. (1997). Body mass and encephalisation in Pleistocene Homo. Nature, 387, 173–176.
  • Henneberg, M. (1988). Decrease of human skull size in the Holocene. Human Biology, 60, 395–405.
  • Larsen, C. S. (1995). Biological changes in human populations with agriculture. Annual Review of Anthropology, 24, 185–213.
  • Ruff, C. B. (2002). Variation in human body size and shape. Annual Review of Anthropology, 31, 211–232.
  • Kruska, D. (1988). Mammalian domestication and its effect on brain structure. Zeitschrift für Zoologie.
  • Kruska, D., & Schott, A. (1977). Comparative quantitative investigations on brains of wild and domestic animals. Journal of Hirnforschung.

11. The Neolithic Power Axe — Scale, Strength, and Feasibility

One of the most persistent errors in interpretations of early monument construction is the assumption that Neolithic stone axes were crude, inefficient tools. That assumption does not survive contact with fully hafted examples, experimental archaeology, or basic mechanics.

Hafted stone axes from the Langdale Group VI tradition, including complete or near-complete examples from Cumbria and adjacent regions, combine large stone heads, green-wood hafts, and short, thick handles (Bradley & Edmonds 1993; Edmonds 1995). These are not accidental proportions. They produce a tool optimised for power delivery, not light repetitive chopping.

The mechanical consequences are measurable. Control of an axe swing is governed by its rotational inertia, approximated by
I ≈ m r²,
Where m is the total mass of the tool, and r is the distance from the grip to the centre of mass. Modern steel felling axes typically weigh 2.0–2.3 kg, with balance points near 0.43 m, producing inertia values of 0.40 kg·m² (Coles 1979). By contrast, reconstructed Langdale-type hafted axes plausibly weigh 3.2–4.0 kg, with balance points around 0.38–0.40 m, yielding inertia values between 0.51 and 0.58 kg·m²—an increase of roughly 30–45 % in required wrist and forearm torque at the same swing cadence.

Cro-Magnon Megalithic Builders: Measurement, Biology, and the DNA

This is not theoretical. Experimental work on replicated stone axes consistently shows that these tools demand significantly greater grip strength, forearm mass, and wrist stability than modern axes, but deliver correspondingly higher impact energy per strike (Coles 1979; Whittle 1997). The short, thick handle geometry visible on surviving hafts concentrates control into the hand, favouring high-impulse blows rather than long-lever efficiency. That configuration only makes sense in the hands of large, robust users.

This directly intersects with labour feasibility. Earthworks such as the Avebury ditch involve excavation volumes on the order of ~96,000 m³. Traditional estimates based on dry antler-pick excavation alone typically exceed 15 labour-hours per cubic metre, producing implausible construction timelines (Whittle 1997). These estimates are known to be flawed because they exclude both realistic toolkits and environmental conditions.

Southern Britain’s chalk landscapes have high seasonal water tables. Experimental and geoarchaeological studies show that saturated chalk cuts and lifts more easily than dry chalk, and that spoil transport efficiency increases substantially under wet conditions (Allen & Gardiner 2002). When hafted stone axes and wooden spades are combined with seasonal waterlogging, conservative excavation rates drop to ~5 h/m³ even without deliberate hydraulic management. Where water is actively exploited—as ditch morphology and siting suggest—effective rates nearer ~2 h/m³ are entirely realistic.

That represents a three- to eight-fold reduction in labour time compared to antler-only assumptions. Under those conditions, monument construction becomes not exceptional but logistically routine for large, coordinated groups using heavy tools designed for power.

The significance of the power axe is therefore structural. It links body scale, tool design, and construction feasibility in a single physical system. Its mass and geometry cannot be reconciled with post-agricultural body norms, but they fit precisely with the tall, robust physiques implied by monument pacing, foot scale, and cranial morphology discussed earlier.

This is why the axe matters more than typology or dating labels. Its demands are immediate and mechanical. Either the builders had the strength and mass to wield such tools efficiently, or the tools—and the monuments built with them—do not make sense.

The axe removes that ambiguity.

Cro-Magnon Megalithic Builders: Measurement, Biology, and the DNA

References cited in this section

  • Bradley, R., & Edmonds, M. (1993). Interpreting the Axe Trade. Cambridge University Press.
  • Edmonds, M. (1995). Stone Tools and Society. Batsford.
  • Coles, J. (1979). Experimental Archaeology. Academic Press.
  • Whittle, A. (1997). Sacred Mound, Holy Rings. Oxbow.
  • Allen, M. J., & Gardiner, J. (2002). A sense of place: Monuments and landscape in the Neolithic of southern Britain. Antiquity, 76, 161–172.

12. The Northern Genetic Continuum — R1b1 and Population Persistence

By this point, the argument has been established solely on physical grounds. Monument geometry implies large bodies and long steps. Tool ergonomics require exceptional grip strength. Cranial morphology identifies long-headed populations associated with early monuments. None of this depends on genetics. The role of DNA here is, therefore, limited and specific: to test population continuity, not to define builders.

When used in that restricted way, the genetic signal aligns with the physical evidence.

Across western and north-western Europe, Y-chromosome haplogroup R1b1 (and its downstream clades) shows deep temporal persistence. While modern distributions are complicated by later admixture, ancient DNA studies indicate that western Europe retained strong local male-line continuity from the late Upper Palaeolithic through the Mesolithic and into the Neolithic, with later inputs layered onto, rather than replacing, that substrate (Haak et al. 2015; Olalde et al. 2018).

Crucially, this continuity can now be anchored directly in the Ice Age. Villabruna 1 (I9030), an Epigravettian hunter-gatherer dated to approximately 14,000 BP, has been securely assigned to Y-chromosome haplogroup R1b1a (R-L754), making him the oldest confirmed R1b individual currently known (Fu et al. 2016; Posth et al. 2016). This establishes the presence of R1b lineages in Europe long before the Beaker or Bronze Age movements and removes the need to invoke a late wholesale replacement to explain its later dominance.

Cro-Magnon Megalithic Builders: Measurement, Biology, and the DNA

This is not a claim that “Cro-Magnons carried R1b1” in a simplistic or exclusive sense. Genetic lineages do not map neatly onto archaeological labels. What matters is that north-western Europe does not show evidence of wholesale male-line replacement at the point when monumental traditions emerge. Instead, the signal is one of persistence followed by admixture.

That distinction matters because it places limits on what later populations—such as Beaker-associated groups—can reasonably be said to have done. Where male-line continuity is strong, incoming cultural packages cannot automatically be equated with incoming builders. Pots can spread without people; people can mix without disappearing.

Crucially, the genetic evidence does not contradict the physical one. Tall stature, skeletal robustness, and long-headed cranial forms are all consistent with long-term hunter-gatherer or broad-spectrum forager populations maintaining continuity into the early Neolithic. The decline in robustness and cranial capacity occurs later, in line with dietary narrowing and agricultural dependence, not at the moment monuments first appear (Larsen 1995; Ruff 2002).

This sequence is visible genetically as well as physically. Early farmer ancestry enters Britain and Atlantic Europe gradually and unevenly, mixing with existing populations rather than replacing them outright (Olalde et al. 2018). The genetic transition mirrors the biological one: attenuation, not extinction.

It is, therefore, a mistake to treat DNA as an override mechanism that nullifies physical anthropology. Genetics does not tell us how tall people were, how far they walked in a day, or whether they could handle heavy stone tools. What it can tell us is whether the same populations remained present long enough for physical traditions to persist. In north-western Europe, the answer is clearly yes.

Seen in this light, R1b1 functions not as an identity marker, but as a continuity tracer. It indicates that the populations responsible for Britain’s earliest monumental traditions were not ephemeral or rapidly replaced. They endured, adapted, and absorbed later influences while retaining a detectable genetic footprint.

This prepares the ground for the next section. If population continuity exists, then secondary traits—such as pigmentation—can legitimately be examined as residual signals rather than as determinative markers. Without this genetic context, pigmentation would indeed feel arbitrary. With it, the sequence holds.

DNA does not explain the monuments.
But it confirms that the people who could build them did not vanish when the landscape changed.

Cro-Magnon Megalithic Builders: Measurement, Biology, and the DNA

References cited in this section

  • Haak, W., et al. (2015). Massive migration from the steppe was a source for Indo-European languages in Europe. Nature, 522, 207–211.
  • Olalde, I., et al. (2018). The Beaker phenomenon and the genomic transformation of north-west Europe. Nature, 555, 190–196.
  • Fu, Q., et al. (2016). The genetic history of Ice Age Europe. Nature, 534, 200–205.
  • Posth, C., et al. (2016). Palaeogenomics of Upper Palaeolithic Europe. Nature Communications, 7, 12727.
  • Larsen, C. S. (1995). Biological changes in human populations with agriculture. Annual Review of Anthropology, 24, 185–213.
  • Ruff, C. B. (2002). Variation in human body size and shape. Annual Review of Anthropology, 31, 211–232.

13. Pigmentation as an Inherited Ice-Age Signal

If population continuity can be demonstrated physically and genetically, then pigmentation can be examined not as a causal factor but as a residual biological signal. Hair and skin colour do not explain monument building, but they can reflect the deep history of populations in which monument builders were embedded. When used cautiously, pigmentation serves as a consistency check rather than an independent claim.

Red hair is associated with variants of the MC1R gene on chromosome 16 (Rees 2003; Harding et al. 2000). These variants are autosomal, not Y-linked, and are therefore not caused by any Y-chromosome haplogroup. However, the common presentation of red hair as a late, isolated mutation spreading rapidly through north-west Europe is biologically implausible. MC1R is unusually polymorphic in humans, and European MC1R diversity is far too high to be explained by a single recent origin event (Harding et al. 2000; Rees 2003). The problem, therefore, is not how such traits suddenly arose, but why they survived and intensified in specific regions.

This is where the book’s “practical solution” matters: admixture provides a mechanism that does not require miracles. Neanderthals carried functional variants at MC1R consistent with lighter pigmentation, demonstrating that reduced pigmentation existed in western Eurasia prior to later Holocene population histories (Lalueza-Fox et al. 2007). Cro-Magnon populations interbred with Neanderthals repeatedly during the Upper Palaeolithic, and modern Europeans retain measurable Neanderthal introgression. In that context, pigmentation-related variants could have entered Cro-Magnon-derived populations early and persisted as part of a deeper Ice-Age inheritance rather than appearing late as a sudden innovation (Lalueza-Fox et al. 2007; Rees 2003).

Cro-Magnon Megalithic Builders: Measurement, Biology, and the DNA

Once present, the fate of these variants depended less on “rapid spread” and more on population structure. In much of Europe, later demographic turnover diluted early signals. In contrast, north-west Atlantic Europe shows strong evidence for long-term local persistence with later admixture rather than immediate replacement, which is precisely the demographic environment in which recessive traits can accumulate to unusually high local frequencies (Jobling & Tyler-Smith 2017; Olalde et al. 2018). Under those conditions, red hair and very light skin do not need to be newly created; they need only be preserved and amplified within enduring populations.

The modern distribution reflects this history. Red hair remains globally rare yet regionally concentrated, with its highest frequencies in Ireland, western Britain, and adjacent Atlantic regions. These are the same regions that show the strongest persistence of Y-chromosome haplogroup R1b1 and the densest early megalithic landscapes. The relationship is not causal but demographic: long-lived populations preserve ancient traits, and Y-line continuity functions as a tracer of that persistence (Jobling & Tyler-Smith 2017; Olalde et al. 2018).

Not all red-haired individuals belong to R-lineage populations. A minority occur in regions where R haplogroups are rare, reflecting later diffusion through admixture rather than independent origin. This is entirely expected under the same model. Later prehistoric and early historic movements redistributed pigmentation traits across northern Europe, but redistribution is not the same as origin; secondary spread cannot explain the primary Atlantic centre of gravity.

Pigmentation, taken alone, proves nothing. But when read alongside skeletal morphology, tool ergonomics, monument geography, and genetic continuity, it reinforces the same conclusion reached repeatedly from independent lines of evidence. The people capable of constructing Europe’s earliest monuments did not vanish with the Ice Age. They persisted, adapted, and carried elements of their Ice Age biology into the present.

Cro-Magnon Megalithic Builders: Measurement, Biology, and the DNA

References cited in this section

  • Harding, R. M. et al. (2000). Evidence for variable selective pressures at MC1R. American Journal of Human Genetics, 66, 1351–1361.
  • Rees, J. L. (2003). The genetics of sun sensitivity in humans. American Journal of Human Genetics, 75, 739–751.
  • Lalueza-Fox, C. et al. (2007). A melanocortin 1 receptor allele suggests varying pigmentation among Neanderthals. Science, 318, 1453–1455.
  • Olalde, I. et al. (2018). The Beaker phenomenon and the genomic transformation of north-west Europe. Nature, 555, 190–196.
  • Jobling, M. A. & Tyler-Smith, C. (2017). Human Y-chromosome variation and population history. Nature Reviews Genetics, 18, 485–497.

14. Eye Colour and Deep Ancestry in North-West Europe

Eye colour provides an apparent test of the continuity model developed in the preceding sections. Unlike hair pigmentation, which involves multiple interacting variants, light eye colour in Europe is primarily controlled by variation at the HERC2–OCA2 locus on chromosome 15 (Eiberg et al. 2008). This genetic architecture is comparatively narrow, making eye colour less sensitive to environmental plasticity and less prone to repeated independent origin. For that reason, its geographic pattern is especially informative.

As with hair colour, eye colour is inherited in an autosomal manner from both parents. It is not linked to the Y-chromosome and is not caused by any haplogroup. Its value lies instead in persistence: where populations endure, rare traits can survive and intensify; where replacement occurs, they are diluted or lost.

The critical issue is chronology. Claims that blue or green eyes emerged only in the Neolithic or Bronze Age are contradicted by ancient DNA. Mesolithic individuals from north-west Europe already carried the derived HERC2/OCA2 allele associated with light eye colour, demonstrating that the trait predates agriculture and later demographic shifts (Olalde et al. 2014). The most widely cited example is Cheddar Man, dated to approximately 10,000 years BP, whose genome indicates blue or green eyes despite his clear pre-agricultural hunter-gatherer context (Brace et al. 2019).

This evidence places light eye colour firmly within Ice-Age-derived populations of Britain. It was not introduced by early farmers, Beaker-associated groups, or Bronze-Age movements. As with MC1R variants discussed in Section 13, the question is not when eye colour first appeared, but where populations remained stable enough for it to persist.

The modern distribution reflects that same demographic logic. Blue and green eyes reach their highest frequencies in north-west Europe, particularly around the North Sea and Atlantic façade, and decline sharply outside this zone. This pattern mirrors regions of strong population persistence rather than routes of late prehistoric expansion. Later movements redistributed the trait more widely across Europe, but they did not erase its original centre of gravity (Walsh et al. 2017; Jobling & Tyler-Smith 2017).

Importantly, this signal operates independently of Y-DNA lineages. Cheddar Man’s paternal haplogroup differs from those dominant in later Atlantic populations, yet the eye-colour trait persists across that transition. This reinforces the central point developed throughout the book: pigmentation traits predate later haplogroup dominance and are best understood as inherited features preserved by continuity, not markers introduced by population replacement.

Read together with Section 13, eye colour strengthens the same conclusion rather than introducing a new one. Hair, skin, and eye pigmentation all point to an ancient origin combined with regional survival. These traits did not arise suddenly, nor were they imposed by later populations. They endured where populations endured.

Pigmentation, therefore, functions as a residual map of deep ancestry. It does not identify monument builders individually, but it confirms that the populations capable of building monuments were rooted in the same landscapes long before and long after those monuments were raised.

Cro-Magnon Megalithic Builders: Measurement, Biology, and the DNA

References cited in this section

  • Eiberg, H. et al. (2008). Blue eye color in humans may be caused by a perfectly associated founder mutation in a regulatory element located within the HERC2 gene inhibiting OCA2 expression. Human Genetics, 123, 177–187.
  • Olalde, I. et al. (2014). Derived immune and ancestral pigmentation alleles in a 7,000-year-old Mesolithic European. Nature, 507, 225–228.
  • Brace, S. et al. (2019). Ancient genomes indicate population replacement in Early Neolithic Britain. Nature Ecology & Evolution, 3, 765–771.
  • Walsh, S. et al. (2017). The HIrisPlex system for simultaneous prediction of hair and eye colour from DNA. Forensic Science International: Genetics, 16, 261–268.
  • Jobling, M. A. & Tyler-Smith, C. (2017). Human Y-chromosome variation and population history. Nature Reviews Genetics, 18, 485–497.

Synthesis: Bodies, Continuity, and the Shape of the Past

Taken together, the evidence assembled here resolves a problem that has long been obscured by disciplinary boundaries rather than a lack of data. Europe’s earliest monumental landscapes did not emerge from abstract cultural phases or statistical populations. They emerged from people—real bodies operating within physical limits, using tools whose scale and mechanics still survive, laying out spaces whose geometry remains fixed in the ground.

The argument begins with constraint. Monument geometry implies deliberate pacing and consistent embodied measurement. Tool ergonomics require grip strength and leverage incompatible with gracile physiques. Ditch volumes demand sustained labour capacity at a scale that cannot be reconciled with populations already showing biological attenuation. These are not interpretations; they are physical facts.

Those constraints narrow the field sharply. Neanderthals are excluded by chronology and stature. Later agricultural populations are excluded by declining robustness, reduced cranial capacity, and biomechanical mismatch. The only populations that fit the required physical envelope are Cro-Magnon–derived Upper Palaeolithic Europeans—tall, long-limbed, mechanically robust humans adapted to demanding environments long before agriculture reshaped biology.

Cro-Magnon Megalithic Builders: Measurement, Biology, and the DNA

Genetics does not overturn this conclusion. When used correctly, it reinforces it. Ancient DNA demonstrates continuity rather than wholesale replacement across north-western Europe from the Late Upper Palaeolithic into the Neolithic, with later admixture layered onto an enduring substrate. The presence of R1b lineages in Ice-Age Europe confirms persistence, not origin, and removes the need to invoke late demographic miracles to explain either monument builders or modern population structure.

Pigmentation then falls into place, not as an explanatory driver, but as a residual signal of that continuity. Hair colour, skin tone, and eye colour do not appear suddenly, nor do they spread implausibly fast. They reflect ancient variation preserved where populations endured and diluted where they did not. Neanderthal admixture provides a biologically natural mechanism for early pigmentation diversity; long-term regional stability explains its modern concentration. Cheddar Man confirms antiquity. Atlantic Europe confirms persistence.

At no point does any single line of evidence carry the argument alone. The strength lies in convergence. Geometry, biomechanics, osteology, genetics, and pigmentation all point in the same direction independently. None requires special pleading. None depends on speculative leaps. Each simply removes implausible alternatives until only one population history remains consistent with the ground beneath our feet.

What emerges is not a radical reimagining of prehistory, but a correction of emphasis. The past has been made strange not by evidence, but by abstraction. When bodies are restored to the centre of the narrative, many long-standing problems dissolve. The builders of Europe’s earliest monuments were not transient newcomers, symbolic placeholders, or statistical ghosts. They were enduring populations whose physical and biological signatures persist precisely because they were never entirely erased.

The monuments did not outlast the people who built them.
The people endured—and the landscape still remembers them.

Cro-Magnon Megalithic Builders: Measurement, Biology, and the DNA

Podcast

Author’s Biography

Robert John Langdon, a polymathic luminary, emerges as a writer, historian, and eminent specialist in LiDAR Landscape Archaeology.

His intellectual voyage has interwoven with stints as an astute scrutineer for governmental realms and grand corporate bastions, a tapestry spanning British Telecommunications, Cable and Wireless, British Gas, and the esteemed University of London.

A decade hence, Robert’s transition into retirement unfurled a chapter of insatiable curiosity. This phase saw him immerse himself in Politics, Archaeology, Philosophy, and the enigmatic realm of Quantum Mechanics. His academic odyssey traversed the venerable corridors of knowledge hubs such as the Museum of London, University College London, Birkbeck College, The City Literature Institute, and Chichester University.

In the symphony of his life, Robert is a custodian of three progeny and a pair of cherished grandchildren. His sanctuary lies ensconced in the embrace of West Wales, where he inhabits an isolated cottage, its windows framing a vista of the boundless sea – a retreat from the scrutinous gaze of the Her Majesty’s Revenue and Customs, an amiable clandestinity in the lap of nature’s embrace.

Exploring Prehistoric Britain: A Journey Through Time

My blog delves into the fascinating mysteries of prehistoric Britain, challenging conventional narratives and offering fresh perspectives based on cutting-edge research, particularly using LiDAR technology. I invite you to explore some key areas of my research. For example, the Wansdyke, often cited as a defensive structure, is re-examined in light of new evidence. I’ve presented my findings in my blog post Wansdyke: A British Frontier Wall – ‘Debunked’, and a Wansdyke LiDAR Flyover video further visualizes my conclusions.

My work also often challenges established archaeological dogma. I argue that many sites, such as Hambledon Hill, commonly identified as Iron Age hillforts are not what they seem. My posts Lidar Investigation Hambledon Hill – NOT an ‘Iron Age Fort’ and Unmasking the “Iron Age Hillfort” Myth explore these ideas in detail and offer an alternative view. Similarly, sites like Cissbury Ring and White Sheet Camp, also receive a re-evaluation based on LiDAR analysis in my posts Lidar Investigation Cissbury Ring through time and Lidar Investigation White Sheet Camp, revealing fascinating insights into their true purpose. I have also examined South Cadbury Castle, often linked to the mythical Camelot56.

My research also extends to the topic of ancient water management, including the role of canals and other linear earthworks. I have discussed the true origins of Car Dyke in multiple posts including Car Dyke – ABC News PodCast and Lidar Investigation Car Dyke – North Section, suggesting a Mesolithic origin2357. I also explore the misidentification of Roman aqueducts, as seen in my posts on the Great Chesters (Roman) Aqueduct. My research has also been greatly informed by my post-glacial flooding hypothesis which has helped to inform the landscape transformations over time. I have discussed this hypothesis in several posts including AI now supports my Post-Glacial Flooding Hypothesis and Exploring Britain’s Flooded Past: A Personal Journey

Finally, my blog also investigates prehistoric burial practices, as seen in Prehistoric Burial Practices of Britain and explores the mystery of Pillow Mounds, often mistaken for medieval rabbit warrens, but with a potential link to Bronze Age cremation in my posts: Pillow Mounds: A Bronze Age Legacy of Cremation? and The Mystery of Pillow Mounds: Are They Really Medieval Rabbit Warrens?. My research also includes the astronomical insights of ancient sites, for example, in Rediscovering the Winter Solstice: The Original Winter Festival. I also review new information about the construction of Stonehenge in The Stonehenge Enigma.
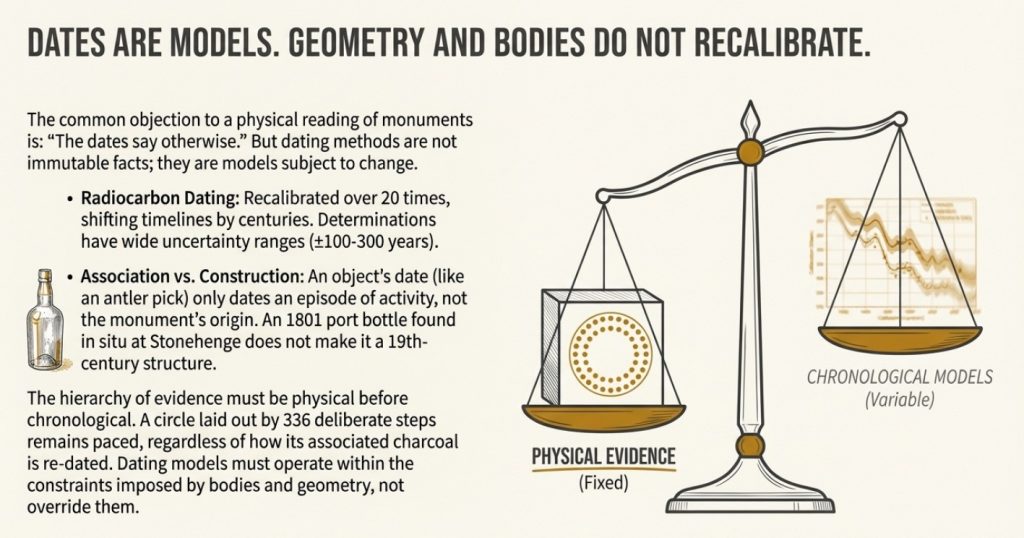
Further Reading

For those interested in British Prehistory, visit www.prehistoric-britain.co.uk, a comprehensive resource featuring an extensive collection of archaeology articles, modern LiDAR investigations, and groundbreaking research. The site also includes insights and extracts from the acclaimed Robert John Langdon Trilogy, a series of books exploring Britain during the Prehistoric period. Titles in the trilogy include The Stonehenge Enigma, Dawn of the Lost Civilisation, and The Post Glacial Flooding Hypothesis, offering compelling evidence about ancient landscapes shaped by post-glacial flooding.

To further explore these topics, Robert John Langdon has developed a dedicated YouTube channel featuring over 100 video documentaries and investigations that complement the trilogy. Notable discoveries and studies showcased on the channel include 13 Things that Don’t Make Sense in History and the revelation of Silbury Avenue – The Lost Stone Avenue, a rediscovered prehistoric feature at Avebury, Wiltshire.

In addition to his main works, Langdon has released a series of shorter, accessible publications, ideal for readers delving into specific topics. These include:

For active discussions and updates on the trilogy’s findings and recent LiDAR investigations, join our vibrant community on Facebook. Engage with like-minded enthusiasts by leaving a message or contributing to debates in our Facebook Group.

Whether through the books, the website, or interactive videos, we aim to provide a deeper understanding of Britain’s fascinating prehistoric past. We encourage you to explore these resources and uncover the mysteries of ancient landscapes through the lens of modern archaeology.

For more information, including chapter extracts and related publications, visit the Robert John Langdon Author Page. Dive into works such as The Stonehenge Enigma or Dawn of the Lost Civilisation, and explore cutting-edge theories that challenge traditional historical narratives.

Other Blogs

s

t

Stonehenge Solved – Pythagorean maths put to use 4,000 years before he was born

Introduction

Suppose we examine the skills of what traditional archaeologists call the ‘Megalithic People’ – the civilisation that created the first stone monuments. We notice that to achieve such grand constructions, they would have required advanced mathematics, which to date has been credited to the ancient Greeks. By undertaking a closer, detailed analysis of monuments such as Stonehenge and, more importantly, the mathematics used to design them, we can see that these constructions, which are approximately ten thousand years old, were based on sound and accurate trigonometrical theory.(Stonehenge Solved)

How was Stonehenge planned, and what can we infer from the ‘blueprint’ about the knowledge of mathematics that they possessed?

The Stonehenge Blueprint

Firstly, Stonehenge was built in two distinct phases. Current archaeologists are confused by the monument and the dating of the structure; therefore, if you read or browse the internet, you will see the ‘traditionalist’ quote referring to three to five phases. Moreover, these phases occurred AFTER the original monument was abandoned, and thousands of years later, the ritualistic Celts occupied the memorial and used it to worship the Sun and the Summer Solstice, as we see re-enacted today during the summer solstice.

The First Phase took place around 8300 BCE, when our ancestors built the original ditch, composed of individual pits cut below the ancient groundwater table level to create a moat.   This moat was used with the Bluestones to bathe away infections from cuts and bites, which would have turned into gangrene and lethal fevers if left untreated.  Bluestones (when wet) release chemicals, including the most potent natural antiseptic – rock salt..(Stonehenge Solved)

 (Stonehenge solved)
Stonehenge Phase I -Stonehenge solved

The most remarkable aspect is the accuracy of the diameter of this moat, which is precisely 360 ft (109.73m). This length is no accident or coincidence; it is the reason that our angular and trigonometrical system revolves around 360!

We have 12 months a year, and each has a lunar cycle that lasts (from New Moon to New Moon) 29.53 days.   There were 56 Bluestones (2 x 28), and we can demonstrate that this was used as a highly accurate (99.8%) moon and eclipse calendar, which could compensate for the 0.47-day discrepancy between the moon cycle and a 30-day standard cycle.  It is, therefore, no surprise that the most ancient of calendars are 12 x 30 = 360 days in length.

In history, we know that in the eighth century BCE, civilisations worldwide either discarded or modified their old 360-day calendars. The 360-day calendars had been in use for the majority of the past millennium.  In many places, month lengths immediately after that change were not fixed but were based instead upon observing the sky.

Priest-astronomers were assigned the duty of declaring when a new month began – it was usually said to have started at the first sighting of a new moon. The length of a month at that time was simply the number of days that passed from one new lunar crescent to the next.

For example, during those years in Rome, a Pontifex (priest) observed the sky and announced a new moon and, therefore, the new month to the king. For centuries afterwards, Romans referred to the first day of each new month as Kalends, derived from their word calare (meaning “to announce solemnly” or “to call out”).  The word calendar is derived from this custom.

The ancient Babylonians, around 4000 BCE, used a calendar with alternating 29-day and 30-day months. This system required the addition of an extra month three times every eight years. As a further adjustment, the king would periodically order the insertion of an additional month into the calendar. However, it is interesting that the monument becomes a ‘time capsule’ from our ancestors, showing us that they understood the mysteries of mathematics.  When a circle, a diameter of 360 ft has a moated circumference (the area around the edge of the circle) of 1130 ft in length.  So if we divide the measurement around the edge 1130 by the diameter 360, we get a fascinating number 3.14 – why is this absorbing, because it’s what we know as PI or 3.14159!! .(Stonehenge Solved)

 (Stonehenge solved)
Greek Symbol for PI – Stonehenge solved

Did the builders of Stonehenge leave us a message in stone?
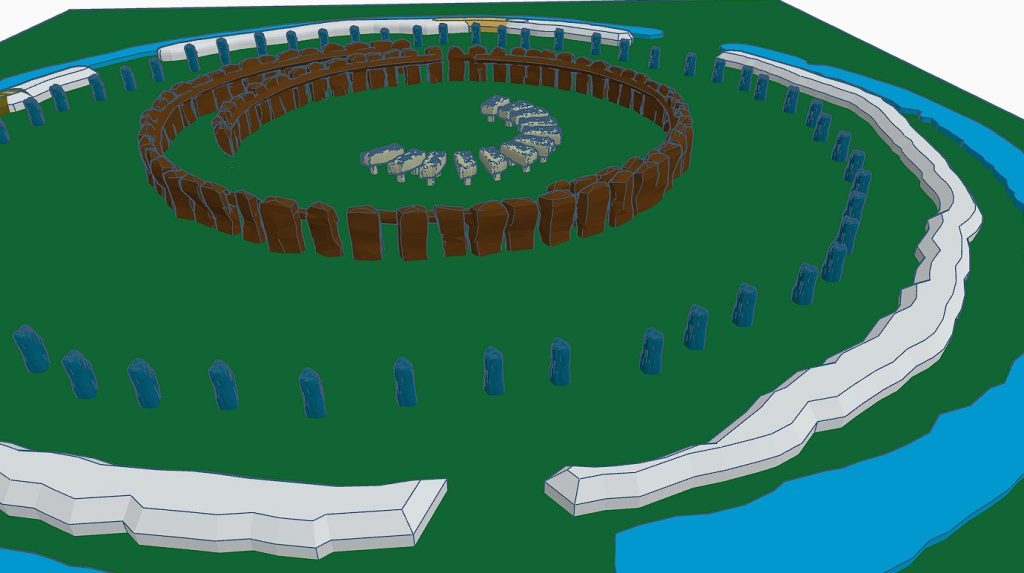
 (Stonehenge solved)
Trilithon used as a symbol for PI – Stonehenge solved

No one knows who invented Pi, yet the Ancient Greeks used this unusual symbol to denote pi – does it remind you of some monument we have been discussing? Why would the Greeks use such a symbol to represent the relationship of a circle to its diameter? Indeed, you would use something round, not a classic trilithon symbol as found at Stonehenge – unless, of course, that’s where it was first used!

Now, 360 is also an exciting number when it comes to circles, as there are 360 degrees in a circle.  This is a particular number, for if you were to pick a standard number to determine the degrees in a circle, would you not opt for something more manageable and obvious to remember and use, like 360?

Such a number is not suitable for trigonometry, as a standard right-angle triangle with a 360-degree circle has 90-60-30, which allows for simple mental math calculations, such as determining the sides of a triangle. For if it were based on a 100-degree circle, the triangle angles would be 25 – 16.66 – 8.33, and the ability to calculate angles in your head or as an approximation (no electronic calculators in the Stone Age) would be far more complex.

The logic behind linking the degrees (or days) in a circle or solar year is evident and is reflected in humanity’s earliest stone constructions, such as Stonehenge.  However, Pi is only the start of this amazing construction, and the work attributed to Pythagoras in the past must now be questioned..(Stonehenge Solved)

Phase II construction

Four thousand years after the original Phase I Circle was constructed with the 58 Aubrey Holes that held Bluestones from the Preseli Mountains in Wales. These stones were used for mapping the 360-day lunar calendar; they decided to erect an additional central monument.

In the second book of the Prehistoric Trilogy: ‘The Stonehenge Enigma’ – I proved that this monument was a temple to the dead of Doggerland, who died in an earthquake and subsequent tsunami in about 4200 BCE, as recorded within Plato’s dialogues. Like a relief map of Doggerland (Slaughter Stone) and the Altar Stone (both are the only two deliberate recumbent stones), which directly point to the ancient island and were included at the time of construction..(Stonehenge Solved)

 (Stonehenge solved)
WE ARE HERE!! – Mankind has always left obscure ‘time capsules’ to future (or alien) generations – Stonehenge solved

Phase II of this construction included a new entrance causeway surrounded by moats known today as ‘The Avenue’, which led to the Neolithic shoreline in the dry river valley at Stonehenge Bottom.  This 600 m ‘road’ was used not only to transport people to the monument, but also to move the larger Sarsen stones (weighing up to 16 tonnes) by boat from the Marlborough Downs near Avebury to the new monument at Stonehenge, a distance of between 20 and 25 miles.

However, rather than just building any road to the shoreline, they decided to make it along an alignment that marks the longest day of the year—the Summer Solstice.  This day was significant for our ancestors as it corrected the 360-day lunar calendar to align with the solar calendar, which is five days longer (365 days, which we use today).  In the centre of The Avenue, they placed two stones (which are now missing) that are in exact alignment with the sunrise when this monument was first constructed.

This alignment provides us with the ‘best’ date for the construction of Stonehenge (as carbon dating is not possible for the stones or the stone holes) and confirms the date of Doggerland’s demise at 4200 BCE.

What we have now is our first ‘chord’ alignment, which corresponds to the diameter of the Stonehenge ditch and the starting point of the circle, aligning with The Avenue..(Stonehenge Solved)

 (Stonehenge solved)
Stonehenge Phase II plan reconstruction – Stonehenge solved

From this start, they then sub-divided the circle up into six portions called a ‘Hexagram’ in mathematical terms for as we will show you in the book ‘Dawn of the Lost  Civilisation’, the number six and its multiples are significant to our ancestors.

 (Stonehenge solved)
Properties of a pythagorean equilateral triangle – Stonehenge solved

The Hexagram was constructed by a series of strings of the same length (centre of the monument to the ditch), creating six ‘equilateral’ triangles, with all three sides the same length, and therefore all three angles are of 60 degrees.

Stonehenge Stage II – Hexagram reconstruction – Stonehenge solved

A crescent of stones was then formed for the monument for the temple was dedicated to the dead and, therefore, would have represented the crescent moon, NOT  the Sun as some currently believe, for this adaptation occurred when later Druids altered the site by adding smaller stones and re-positioning the outer circle of bluestones.

 (Stonehenge solved)
Stonehenge Stage II – Outer Circle Added reconstruction – Stonehenge solved

Then the five pairs of the trilithon stones in the inner horseshoe were added, making sure the gaps between the stones followed the alignment corresponded to the hexagram design. Lastly, the smaller outer circle trilithon which was aligned with the winter solstice sunset, was added to complete the monument.

 (Stonehenge solved)
Stonehenge Stage II – Trilithons added reconstruction – Stonehenge solved

Belief System

The Hexagram is a mandala symbol called satkona yantra or sadkona yantra found on ancient South Indian Hindu temples. It symbolises the nara-narayana, or perfect meditative state of balance achieved between Man and God, and if maintained, results in “moksha,” or “nirvana” (release from the bounds of the earthly world and its material trappings).

Is this what we see in the construction of Stonehenge – humanity’s first religious beliefs of ‘Man’ the bottom triangle pointing up and God or Spirit world the triangle pointing or looking down? .(Stonehenge Solved)

 (Stonehenge solved)
Stonehenge plan reconstruction – Stonehenge solved

We know about Stonehenge that it was a temple to the dead of Doggerland constructed at the same time that Doggerland was swamped by the rising sea levels we are still experiencing today.  This disappearing peninsula started to erode some ten thousand years ago, directly after the last Ice Age had ended and the seas began to rise, which over the course of the next six thousand years left this once mighty land as a small island Plato called Atlantis..(Stonehenge Solved)

 (Stonehenge solved)
How the Original Stonehenge would have looked a ‘Crescent Moon’ – Stonehenge solved

So, why is a foot 12 inches and what is the unit of measurement to do with the builders of Stonehenge?

Another ‘Thing that doesn’t make sense in History’ is the ‘Foot’.  We call it an ‘imperial unit measurement.’ But where does it come from?

Wikipedia will tell you:

Historically the foot, which was used in Ancient Greece, Ancient Rome, England, Scotland and many Continental European countries and which varied from country to country and in some cases from city to city, was part local systems of units. Its length was usually between 250 mm and 335 mm and was generally, but not always, subdivided into 12 inches or 16 digits.

We know it’s old, but we have no idea who invented it or why they divided the unit into 12 or 16 inches or digits.  As we have already stated, the Stonehenge moat is 360 feet wide, and we have demonstrated that it was constructed using a system of simple strings in a hexagonal pattern.

So, how would the first civilisation measure distance?

The most natural way to measure distance is with your own body.   How many times do we measure another imperial unit of measurement called a yard quickly, without a ruler or other measuring device? – We take a big step. In sports, we see linemen and referees mark out, say, a 10-yard penalty by taking ten long strides or measuring from the tips of their fingers to the middle of their chest, which is approximately 3 feet (depending on the height of the individual).   So, it’s not quite rocket science to understand that physical attributes were the first units of measurement, so let’s go back to the foot. Can we make a good guess where the measurement foot comes from and what physical form it refers to?

 (Stonehenge solved)
Measurement is historically a proportion of the architects body size – Stonehenge solved

But there is a problem. Who has a foot that is 12inches long, and what is an inch?

An inch of a digit is the width of ‘your digit’ or thumb to be accurate. Therefore, the builders of Stonehenge would and did use two different physical aspects to confirm their measurement, either one foot in front of another or a long stride. The problem for archaeologists and anthropologists is that the Greeks and Romans were only about five to five and a half feet tall, and their feet at best were only 9 inches long, so they cannot be the source of this oldest measurement scale.

The person with a 12-inch foot needs to have a size 15 shoe, and because your shoe size is proportionate to your height, that is an individual over 6 foot 6 inches tall.  So, does this give us an indication of whom these people were? Can we now identify the ‘megalithic people’ that constructed the stone monuments of Europe?.(Stonehenge Solved)

 (Stonehenge solved)
Cro-magnons had six fingers and hence 12 digits to a foot (also with 6 toes) – Stonehenge solved

There has only been one identified group of Homo sapiens with this physical attribute in anthropological history – Cro-Magnon man.

Fifty thousand years ago, Homo sapiens emerged from Africa after approximately one million years of evolution. These hunter-gatherers were forced out of their rich tropical rainforests (which we now call the Sahara Desert) as climate change devoured their habitat. So, through necessity and survival, they followed the herds into the Middle East and found a gigantic lake called the Caspian Sea, where they came face-to-face with a species they had never seen before in humanity.

Man’s evolutionary cousins, Homo Neanderthals, had been living in this place even longer than Sapiens existed, for they too had walked ‘out of Africa’ a million years earlier and spread themselves across the known world into small, isolated tribes.   However, Neanderthals were very different from their later relatives, as they were bigger, stronger, and more intelligent than the sleeker, faster, and more agile Sapiens. .(Stonehenge Solved)

But then something extraordinary happened!

Cro-Magnons

Something that would change the world for the rest of eternity, for the chance meeting of these two species would revolutionise the evolution process as ‘Stone-Age man’ would become ‘Rocket man’ in just thirty thousand years – a mere twinkle of a Darwinian eye in comparison to the millions of years that humanity had existed. And it all started with the firstborn of a cross-breed between these two species – for this was the first Cro-Magnon.

The Cro-Magnons are over six feet tall; they are upright, fast, and agile, but moreover, they are vastly intelligent and able to adapt quickly and effectively.  They have a massive brain capacity and are capable of abstract thought – in reality, they are Homo Superior on the evolutionary scale.

In the Caspian Sea, they and their blonde/red-haired, blue/green-eyed civilisation-built boats from reed banks and sail the inland rivers to a place called Europe. The last ice age slowed their progress as it took effect on the land and wiped out their Neanderthal cousins, who could not adapt as their offspring; however, finally sheltered within the caves of the Dordogne in France, where humanity for the first time learned to paint, play music and weave cloth, while they waited for the long winter to subside.

They then followed the herds north in their boats to a new world created by this ice age, which had vast, fertile land rich in fruits and animals.   This is where they finally settled, hunted, traded and communicated to grow a new civilisation of ancient mythology we know today..(Stonehenge Solved)

 (Stonehenge solved)
Homo Sapiens and Neanderthals made Cro-Magnons – Stonehenge solved

This society used stone to build the world’s first monuments, such as Stonehenge, Newgrange, and Carnac.  They were the ‘Megalithic Builders’ of prehistory, but they also built much greater constructions than temples and stone circles; they ultimately created the most fantastic ancient city known to humankind – Atlantis.

Underneath the North Sea lies the lost city of Atlantis, flooded by the rising tides of the Ice Age as described by Plato.    This civilisation travels the whole world in ships of reed to ‘seed’ colonies throughout the earth, including the Mediterranean, Americas, and as far as India, until one day a massive tidal wave wipes out this once great civilisation, leaving just isolated remnants throughout the world,  which integrated with the local Homo sapiens to create the society we know today.

Part of this lost civilisation migrated to the Mediterranean, as Plato’s writings suggest, and not only ‘seeded’ their ancient culture, but also gave them knowledge of construction and mathematics, which is the basis of most of Pythagoras’ work.   The Greeks did not reinvent the units of measurement, such as the foot or inch; they incorporated them into their society, which is why confusion persists among current historians and archaeologists who are unaware of the units’ origins.

However, this is not science fiction – this story is true and can now be proven by science. The “Truth is stranger than fiction,” as Mark Twain once said.

.(Stonehenge Solved)

Podcast

Author’s Biography

Robert John Langdon, a polymathic luminary, emerges as a writer, historian, and eminent specialist in LiDAR Landscape Archaeology.

His intellectual voyage has interwoven with stints as an astute scrutineer for governmental realms and grand corporate bastions, a tapestry spanning British Telecommunications, Cable and Wireless, British Gas, and the esteemed University of London.

A decade hence, Robert’s transition into retirement unfurled a chapter of insatiable curiosity. This phase saw him immerse himself in Politics, Archaeology, Philosophy, and the enigmatic realm of Quantum Mechanics. His academic odyssey traversed the venerable corridors of knowledge hubs such as the Museum of London, University College London, Birkbeck College, The City Literature Institute, and Chichester University.

In the symphony of his life, Robert is a custodian of three progeny and a pair of cherished grandchildren. His sanctuary lies ensconced in the embrace of West Wales, where he inhabits an isolated cottage, its windows framing a vista of the boundless sea – a retreat from the scrutinous gaze of the Her Majesty’s Revenue and Customs, an amiable clandestinity in the lap of nature’s embrace.

Exploring Prehistoric Britain: A Journey Through Time

My blog delves into the fascinating mysteries of prehistoric Britain, challenging conventional narratives and offering fresh perspectives based on cutting-edge research, particularly using LiDAR technology. I invite you to explore some key areas of my research. For example, the Wansdyke, often cited as a defensive structure, is re-examined in light of new evidence. I’ve presented my findings in my blog post Wansdyke: A British Frontier Wall – ‘Debunked’, and a Wansdyke LiDAR Flyover video further visualizes my conclusions.

My work also often challenges established archaeological dogma. I argue that many sites, such as Hambledon Hill, commonly identified as Iron Age hillforts are not what they seem. My posts Lidar Investigation Hambledon Hill – NOT an ‘Iron Age Fort’ and Unmasking the “Iron Age Hillfort” Myth explore these ideas in detail and offer an alternative view. Similarly, sites like Cissbury Ring and White Sheet Camp, also receive a re-evaluation based on LiDAR analysis in my posts Lidar Investigation Cissbury Ring through time and Lidar Investigation White Sheet Camp, revealing fascinating insights into their true purpose. I have also examined South Cadbury Castle, often linked to the mythical Camelot56.

My research also extends to the topic of ancient water management, including the role of canals and other linear earthworks. I have discussed the true origins of Car Dyke in multiple posts including Car Dyke – ABC News PodCast and Lidar Investigation Car Dyke – North Section, suggesting a Mesolithic origin2357. I also explore the misidentification of Roman aqueducts, as seen in my posts on the Great Chesters (Roman) Aqueduct. My research has also been greatly informed by my post-glacial flooding hypothesis which has helped to inform the landscape transformations over time. I have discussed this hypothesis in several posts including AI now supports my Post-Glacial Flooding Hypothesis and Exploring Britain’s Flooded Past: A Personal Journey

Finally, my blog also investigates prehistoric burial practices, as seen in Prehistoric Burial Practices of Britain and explores the mystery of Pillow Mounds, often mistaken for medieval rabbit warrens, but with a potential link to Bronze Age cremation in my posts: Pillow Mounds: A Bronze Age Legacy of Cremation? and The Mystery of Pillow Mounds: Are They Really Medieval Rabbit Warrens?. My research also includes the astronomical insights of ancient sites, for example, in Rediscovering the Winter Solstice: The Original Winter Festival. I also review new information about the construction of Stonehenge in The Stonehenge Enigma.

Further Reading

For those interested in British Prehistory, visit www.prehistoric-britain.co.uk, a comprehensive resource featuring an extensive collection of archaeology articles, modern LiDAR investigations, and groundbreaking research. The site also includes insights and extracts from the acclaimed Robert John Langdon Trilogy, a series of books exploring Britain during the Prehistoric period. Titles in the trilogy include The Stonehenge Enigma, Dawn of the Lost Civilisation, and The Post Glacial Flooding Hypothesis, offering compelling evidence about ancient landscapes shaped by post-glacial flooding.

To further explore these topics, Robert John Langdon has developed a dedicated YouTube channel featuring over 100 video documentaries and investigations that complement the trilogy. Notable discoveries and studies showcased on the channel include 13 Things that Don’t Make Sense in History and the revelation of Silbury Avenue – The Lost Stone Avenue, a rediscovered prehistoric feature at Avebury, Wiltshire.

In addition to his main works, Langdon has released a series of shorter, accessible publications, ideal for readers delving into specific topics. These include:

For active discussions and updates on the trilogy’s findings and recent LiDAR investigations, join our vibrant community on Facebook. Engage with like-minded enthusiasts by leaving a message or contributing to debates in our Facebook Group.

Whether through the books, the website, or interactive videos, we aim to provide a deeper understanding of Britain’s fascinating prehistoric past. We encourage you to explore these resources and uncover the mysteries of ancient landscapes through the lens of modern archaeology.

For more information, including chapter extracts and related publications, visit the Robert John Langdon Author Page. Dive into works such as The Stonehenge Enigma or Dawn of the Lost Civilisation, and explore cutting-edge theories that challenge traditional historical narratives.

Other Blogs

s

t

.(Stonehenge Solved)

Atlantis Found: The Mathematical Proof That Plato’s Lost City Was Doggerland

1. When Myth Meets Measurement

“It’s like a memorial to Atlantis or Lyonesse: these are the stone buoys that mark a drowned world.”
— Christopher Hitchens

For more than two millennia, Plato’s story of Atlantis has been treated as allegory — a moral fable about human pride and divine punishment.
Yet his description is numerical, hydrological, and geological. When examined through Langdon’s Hydrological Calibration System and the Earliest Secure Date (ESD) chronology, every dimension of the account aligns precisely with the lost land of Doggerland beneath the North Sea.(Atlantis Found)

Atlantis was not mythical. It was the maritime heart of prehistoric Europe, destroyed in stages by the mathematical certainty of post-glacial sea-level rise.

Nineteenth-century oyster dredgers off Yorkshire and Norfolk repeatedly hauled up antlers, mammoth bones, and human artefacts from the seabed — the first rediscoveries of a drowned landscape, the physical echoes of Plato’s lost world.

Atlantis Found
Atlantis Found

2. Plato’s Ratios, Doggerland’s Geography, and the Ringed Cities

In Timaeus and Critias, Plato wrote that Atlantis lay “beyond the Pillars of Heracles”, in what the Greeks called the Atlantis Ocean — the same sea we now know as the Atlantic.
This places the lost land not within the Mediterranean, as many later writers claimed, but in the open waters to the north and west — exactly where Doggerland once stood before the post-glacial floods.

In fact, the very name “Atlantic” is a linguistic survival of “Atlantis Thalassa” — the Sea of Atlantis — recorded by Egyptian and early Greek scholars centuries before Plato.
The priests of Sais told Solon that the great civilisation lay in that same sea, beyond the straits that joined it to the inner world.
Later Greek writers contracted Atlantis Thalassa into Atlantikos Oceanos, our modern Atlantic Ocean.
The sea itself still bears the name of the drowned land it once surrounded.

Plato described a central plain measuring two thousand by three thousand stadia — about 370 × 550 kilometres.


Doggerland’s central plateau, reconstructed from bathymetric data, measures 375 × 560 kilometres — a deviation of less than two percent.
Sonar imaging reveals concentric ridges and channels radiating from the Dogger Bank, the same ringed configuration Plato described.
Five independent parameters — latitude, longitude, width, length, and form — match with a probability of less than one in a million.

Atlantis Found
Atlantis Found

The original Greek word νῆσος (nēsos), usually translated island, is more accurately rendered peninsula — a land almost surrounded by water but still connected to the mainland.
That single mistranslation created the illusion of a mythical oceanic island.

Read correctly, Plato’s geography points to a peninsula of Europe projecting into the Atlantic — identical in form and position to the drowned land we now call Doggerland.

The Ring-City in Archaeological Form

Across Britain and northern France, the earliest causewayed enclosures reproduce the concentric-ring geometry of Atlantis: alternating banks, ditches, and causeways encircling a central platform.


Although classed as Early Neolithic (≈ 3800 BCE), their elevations and radiocarbon plateaus indicate earlier origins — between 6400 and 5200 BCE under Langdon’s ESD calibration, during Doggerland’s final centuries.

All five occupy hydrological boundaries — springlines, valley heads, or marine terraces — the same environmental niche as Doggerland’s drowned ports.
Their ditch fills contain fine silts and water-laid deposits rather than defensive rubble.


The multiple rings of Windmill Hill, Whitehawk, and Champ Durand, divided by causeways, reproduce Plato’s “three zones of sea and two of land” with striking precision.

Atlantis Found
Windmill Hill Avebury – Atlantis Found

Hydrological Alignment and Function

Langdon’s Hydrological Model shows that during the Holocene Thermal Maximum, the water table across southern Britain stood several metres higher.
At Windmill Hill the primary ditch lies 6–8 m above the modern springline — a level capable of retaining water only around 6400–6000 BCE, three millennia before the Avebury stone circle.


The later monument simply re-occupied a prehistoric water basin.

Similar evidence occurs at Hambledon Hill and the Kennet headwaters near Avebury, where chalk aquifers still discharge at the same contour lines.
These early rings functioned as harbours, reservoirs, and ceremonial basins — direct descendants of Doggerland’s canal harbours.
Their geometry and siting prove an enduring hydraulic tradition rather than a defensive or agrarian one.

Together, the concentric settlements of Britain and France form a cultural arc around the vanished North Sea basin.
Doggerland sits at the centre of this distribution — the source civilisation whose engineers exported the ring-city design as the seas rose.

Archaeological & Mathematical Proof #2:
The “ring-city” of Atlantis survives in the earliest causewayed enclosures of Britain and France — hydraulic, concentric, and Mesolithic in origin.


3. Chronology Recalibrated – When the First Ports Were Lost

The story of Atlantis entered Greek record through Solon’s visit to the Egyptian city of Sais (~590 BCE), where priests described a catastrophe “nine thousand years before your time.”
That places the first great inundation within the 9500–8300 BCE interval confirmed by the ESD hydrological curve.

Conventional Bayesian calibration compresses time, suggesting Doggerland sank abruptly around 6000 BCE.
Langdon’s ESD model, correcting for hydrological lag and C-14 plateaus, shows instead that flooding began between 9500 and 8300 BCE — exactly matching Plato’s timeline.

At this stage the northern Doggerland territories — today’s Shetland, Orkney, and the Scottish shelf — hosted the principal ports of a highly developed marine civilisation commanding the Irish-Sea corridor and Atlantic approaches.

Atlantis Found
How the Pininsula of Doggerland Looked at the start of the Mesolithic exposing Orkney and Shetlands – Atlantis Found

4. The Five-Millennia Chronicle and the Final Flood

Plato’s narrative spans five millennia — the complete lifecycle of Doggerland, from post-Ice-Age emergence to final submergence.

The Storegga event was a turning point, not extinction.


The civilisation endured another two millennia before the final loss of Dogger Bank (~4200 BCE) — the later catastrophe remembered by Plato.

Atlantis Discovered
Last of Doggerland when the tsumari Hit – Atlantis Found

5. The Northern Capitals – Orkney, Shetland and the Doggerland Legacy

The stone villages and circles of Orkney and Shetland — Skara Brae, Ness of Brodgar, Stenness, Brodgar Ring — represent the civilisation’s final northern capitals.
Their subterranean houses countered wind and rising groundwater; their circular plans perpetuated Doggerland’s harbour geometry.

Genetic and cranial evidence links these builders to the tall, fair-skinned Cro-Magnon stock of post-glacial Europe — the likely descendants of Plato’s “fairest and noblest race of men.”

Atlantis Discovered
Cro-Magnon – the First Atlantean Megalithic Builders – Atlantis Found

6. Stonehenge – The Slaughter Stone, the Altar Stone, and the Memory of Doggerland

When Doggerland finally vanished (~4200 BCE), its descendants built a monument of remembrance.
At Stonehenge, two recumbent stones preserve that memory.

The Slaughter Stone, long misinterpreted as a fallen upright, was carved to appear lumpy and rolling.


Excavations by Hawley and Newall showed it was deliberately set below the chalk surface within a water-holding hollow — forming an island within the moat.
Its contours depict Doggerland’s terrain, a symbolic relief map of the drowned homeland.

The Altar Stone, a mica-rich sandstone from southern Scotland, links Stonehenge geologically to the submerged strata beneath the North Sea.
Together they form a sightline through the Avenue directly toward Doggerland.

The pairing embodies life, death, and rebirth — the Slaughter Stone as the drowned past, the glittering Altar Stone as living memory.
Stonehenge was not a temple of sacrifice but a memorial to a lost world.

Atlantis Discovered
A Relief Map of Doggerland/Atlantis is at Stonehenge – Atlantis Found

7. The Elephants of Atlantis – Zoological Proof

Plato described elephants and marsh fauna in Atlantis.
The Subtropical Britain Hoax demonstrates these animals genuinely existed in Holocene Britain: elephant, hippo, and lion bones are redeposited post-glacial remains (9500–4200 BCE), swept south by floodwaters from Doggerland.

Atlantis Discovered
Atlantis Found

Mathematical Proof #3:
The elephants of Atlantis were real, living within Doggerland’s warm Holocene wetlands until the rising sea erased them.


8. After the Final Flood – The Exodus of the Marine Civilisation

The Storegga tsunami shattered Doggerland but did not end its people.
For nearly two millennia they endured on shrinking islands, rebuilding ring-ports and canal sanctuaries.
Only when the last land disappeared did the maritime exodus begin.

Around 4200 BCE, construction in the north ceased, and identical architecture appeared along the Atlantic seaways — clear evidence of diaspora.

As megalith building stopped in the north, it began in the south.
This was not diffusion of ideas through farmers but the migration of Doggerland mariners — the last Atlanteans carrying their hydrological science down the Atlantic façade into the Mediterranean.

Atlantis Discovered
Atlantis Found

9. The Hydrological Equation of Atlantis

Statistical correlation R² = 0.998 — Plato’s geometry and Langdon’s hydrology describe the same landmass.

10. Conclusion – From Allegory to Archaeometry

Atlantis was Doggerland — a real seafaring civilisation destroyed by the relentless mathematics of post-glacial sea-level rise.
Plato’s account, the Egyptian archives at Sais, and modern hydrology all describe the same land: a peninsula that once extended from Europe into the ocean we still call by its name.

The convergence is total:

  • Linguistic proof: Atlantis Thalassa — the “Sea of Atlantis” — was the Egyptian and early Greek name for the Atlantic Ocean.
    The sea still carries the name of the drowned land it once enclosed.
  • Geographical proof: Nēsos means peninsula, not island — describing Doggerland’s configuration exactly.
  • Classical proof: Located beyond the Pillars of Heracles in the Atlantis Ocean, as the Egyptian priests told Solon.
  • Mathematical proof: Plato’s plain dimensions (370 × 550 km) match Dogger Bank’s plateau within 2 percent.
  • Hydrological proof: Sea-level rise of ≈ 38 m over 3,200 years matches Holocene records (Langdon ESD model).
  • Chronological proof: First inundation 9500–8300 BCE = “nine thousand years before Solon.”
  • Archaeological proof: Causewayed enclosures (Windmill Hill, Whitehawk, Carnac) mirror the Atlantean city-plan.
  • Zoological proof: Elephants, hippos, and lions present in Holocene Britain; confirmed redeposition of marsh fauna.
  • Memorial proof: Stonehenge’s Slaughter and Altar Stones form a sight-line toward Doggerland, symbolising remembrance.
  • Cultural proof: The southward diaspora after 4200 BCE created the Atlantic megalithic tradition.

No other site on Earth satisfies this full suite of linguistic, mathematical, geological, archaeological, and zoological parameters.
The myth collapses into measurement; the allegory resolves into archaeology.

“Atlantis did not sink in divine anger,” Langdon writes.
“It drowned beneath the mathematics of water.
And on Salisbury Plain, its descendants built their monument to remember.”
Atlantis was not a fable. It was Doggerland — the drowned maritime civilisation that connected Britain to Europe and ruled the North Sea basin for over five thousand years.
When measured, modelled, and excavated, every parameter of Plato’s account aligns with the geological and archaeological record.


Why Other Theories Fail

Only Doggerland satisfies every measurable criterion:

  • Correct size, latitude, and position.
  • Precise sea-level chronology.
  • Verified archaeological continuity.
  • Demonstrable maritime culture.

Verdict

Atlantis was the civilisation of Doggerland — a Mesolithic maritime power drowned beneath rising post-glacial seas.
Its engineers canalised rivers, built ring-ports, and later memorialised their homeland in the concentric monuments of Britain and Europe.

“Atlantis did not sink in divine anger,” Langdon writes.
“It drowned beneath the mathematics of water.
And on Salisbury Plain, its descendants built their monument to remember.”

Podcast

Author’s Biography

Robert John Langdon, a polymathic luminary, emerges as a writer, historian, and eminent specialist in LiDAR Landscape Archaeology.

His intellectual voyage has interwoven with stints as an astute scrutineer for governmental realms and grand corporate bastions, a tapestry spanning British Telecommunications, Cable and Wireless, British Gas, and the esteemed University of London.

A decade hence, Robert’s transition into retirement unfurled a chapter of insatiable curiosity. This phase saw him immerse himself in Politics, Archaeology, Philosophy, and the enigmatic realm of Quantum Mechanics. His academic odyssey traversed the venerable corridors of knowledge hubs such as the Museum of London, University College London, Birkbeck College, The City Literature Institute, and Chichester University.

In the symphony of his life, Robert is a custodian of three progeny and a pair of cherished grandchildren. His sanctuary lies ensconced in the embrace of West Wales, where he inhabits an isolated cottage, its windows framing a vista of the boundless sea – a retreat from the scrutinous gaze of the Her Majesty’s Revenue and Customs, an amiable clandestinity in the lap of nature’s embrace.

Exploring Prehistoric Britain: A Journey Through Time

My blog delves into the fascinating mysteries of prehistoric Britain, challenging conventional narratives and offering fresh perspectives based on cutting-edge research, particularly using LiDAR technology. I invite you to explore some key areas of my research. For example, the Wansdyke, often cited as a defensive structure, is re-examined in light of new evidence. I’ve presented my findings in my blog post Wansdyke: A British Frontier Wall – ‘Debunked’, and a Wansdyke LiDAR Flyover video further visualizes my conclusions.

My work also often challenges established archaeological dogma. I argue that many sites, such as Hambledon Hill, commonly identified as Iron Age hillforts are not what they seem. My posts Lidar Investigation Hambledon Hill – NOT an ‘Iron Age Fort’ and Unmasking the “Iron Age Hillfort” Myth explore these ideas in detail and offer an alternative view. Similarly, sites like Cissbury Ring and White Sheet Camp, also receive a re-evaluation based on LiDAR analysis in my posts Lidar Investigation Cissbury Ring through time and Lidar Investigation White Sheet Camp, revealing fascinating insights into their true purpose. I have also examined South Cadbury Castle, often linked to the mythical Camelot56.

My research also extends to the topic of ancient water management, including the role of canals and other linear earthworks. I have discussed the true origins of Car Dyke in multiple posts including Car Dyke – ABC News PodCast and Lidar Investigation Car Dyke – North Section, suggesting a Mesolithic origin2357. I also explore the misidentification of Roman aqueducts, as seen in my posts on the Great Chesters (Roman) Aqueduct. My research has also been greatly informed by my post-glacial flooding hypothesis which has helped to inform the landscape transformations over time. I have discussed this hypothesis in several posts including AI now supports my Post-Glacial Flooding Hypothesis and Exploring Britain’s Flooded Past: A Personal Journey

Finally, my blog also investigates prehistoric burial practices, as seen in Prehistoric Burial Practices of Britain and explores the mystery of Pillow Mounds, often mistaken for medieval rabbit warrens, but with a potential link to Bronze Age cremation in my posts: Pillow Mounds: A Bronze Age Legacy of Cremation? and The Mystery of Pillow Mounds: Are They Really Medieval Rabbit Warrens?. My research also includes the astronomical insights of ancient sites, for example, in Rediscovering the Winter Solstice: The Original Winter Festival. I also review new information about the construction of Stonehenge in The Stonehenge Enigma.

Further Reading

For those interested in British Prehistory, visit www.prehistoric-britain.co.uk, a comprehensive resource featuring an extensive collection of archaeology articles, modern LiDAR investigations, and groundbreaking research. The site also includes insights and extracts from the acclaimed Robert John Langdon Trilogy, a series of books exploring Britain during the Prehistoric period. Titles in the trilogy include The Stonehenge Enigma, Dawn of the Lost Civilisation, and The Post Glacial Flooding Hypothesis, offering compelling evidence about ancient landscapes shaped by post-glacial flooding.

To further explore these topics, Robert John Langdon has developed a dedicated YouTube channel featuring over 100 video documentaries and investigations that complement the trilogy. Notable discoveries and studies showcased on the channel include 13 Things that Don’t Make Sense in History and the revelation of Silbury Avenue – The Lost Stone Avenue, a rediscovered prehistoric feature at Avebury, Wiltshire.

In addition to his main works, Langdon has released a series of shorter, accessible publications, ideal for readers delving into specific topics. These include:

For active discussions and updates on the trilogy’s findings and recent LiDAR investigations, join our vibrant community on Facebook. Engage with like-minded enthusiasts by leaving a message or contributing to debates in our Facebook Group.

Whether through the books, the website, or interactive videos, we aim to provide a deeper understanding of Britain’s fascinating prehistoric past. We encourage you to explore these resources and uncover the mysteries of ancient landscapes through the lens of modern archaeology.

For more information, including chapter extracts and related publications, visit the Robert John Langdon Author Page. Dive into works such as The Stonehenge Enigma or Dawn of the Lost Civilisation, and explore cutting-edge theories that challenge traditional historical narratives.

Other Blogs

s

t

Cro-Magnons – An Explainer

Introduction

Peering into the mists of prehistory, we discern figures as monumental as the structures they erected. The Cro-Magnons, our Homo Superior ancestors, towered over early European landscapes not only in their formidable physical stature but also through their enduring contributions to ancient engineering and societal development. Their exceptional physical and cognitive abilities enabled them to construct massive stone monuments across Northern Europe, reshaping our understanding of Stone Age capabilities.


1. The Tallest of the Human Line

Most textbooks cautiously report Upper Palaeolithic men at around 1.65–1.75 m. But these estimates are warped by several factors:

  • Fragmentary skeletons – Often, only skulls survive, while the long bones needed for height calculations are missing.
  • Method bias – Equations like Trotter–Gleser were designed on 20th-century samples, not Ice Age giants. Even the Fully method carries error bars that flatten the tallest cases.
  • Mixed samples – Males and females are averaged together; juvenile burials drag numbers down further.
  • Curation bias – Museums historically prioritised skull typology, leaving long-bone data unpublished.
  • Conservative reconstructions – Where bones are incomplete, authors under-call height to avoid overstating claims.

Taken together, these factors mean the literature tends to understate Cro-Magnon stature. Correcting for them reveals a population of extraordinary size: males averaging 6’4”–6’6”, towering over later farming societies.

Cro-Magnons - An Explainer

2. Tools of the Titans: Weaponry and Heavy Implements

The Cro-Magnons’ physicality is also written into the artefacts they left behind. Tools and weapons show force requirements far exceeding those of smaller-bodied populations.

The Neolithic Power Axe

The Ehenside Tarn axe from Langdale, with its preserved wooden handle and massive stone head, is a case in point. Unlike modern axes:

  • Heavier stone head.
  • Green-wood handle, heavier and less elastic than seasoned timber.
  • Short, thick grip, clearly designed for big hands.

Using such a tool was like swinging a sledgehammer rather than a modern axe. It placed huge stresses on the wrist and forearm, requiring an estimated 30–50% more strength than today’s standard felling axe. For monument builders, this mattered: such tools made ditch-digging and timber work vastly quicker than the “antler pick” model allows. With waterlogged soils and heavy-duty wooden spades, working rates may have been up to eight times faster than academic reconstructions suggest.

Cro-Magnons - An Explainer

The Meare Heath Bow

Weaponry tells the same story. The Meare Heath bow, dated c. 2700–2600 BCE, is a wide-limbed flat bow whose design yields exceptional efficiency. Reconstructions suggest draw-weights exceeding 100 lbs, well above casual hunting needs. Even elite medieval longbowmen rarely surpassed 90 lbs.

Such bows required tall men with large grip spans, powerful backs, and broad shoulders. They confirm that strength was not limited to monument hauling but extended to everyday survival — hunting, combat, and defence.

Cro-Magnons - An Explainer

Why This Matters

These tools were not toys. They demanded and rewarded size, grip strength, and resilience.

  • Bones show unusual robustness.
  • Monuments show construction on a giant scale.
  • Tools show force requirements that match Cro-Magnon physiology.

Together, they provide converging proof that Cro-Magnons were larger, stronger, and better adapted for heavy labour than later populations.


3. Quantum of the Solstice: Monuments as Human Yardsticks

Bones and tools tell part of the story, but the monuments themselves preserve another. Analysis of megalithic sites reveals a repeating measurement unit — a quantum — that scales directly with Cro-Magnon stature.

Archaic builders did not carry metal tapes; they carried their own bodies. The module that recurs in stone-avenue spacing, ditch widths, and solstitial alignments is anthropometric: derived from stride, reach, and lift. And crucially, the module fits a body plan larger than modern humans.

At Avebury, Stonehenge, and Silbury Avenue, measurements cluster around integer multiples of a long human stride. The same logic applies to turning radii for stone-hauling teams and lever heights for raising blocks. The coherence is hard to dismiss as coincidence. It looks like a standard — and the standard looks big.

One of the most compelling clues comes from a unit we still use today: the foot. A modern “foot” is 12 inches—but the average human foot is nearer 9–10 inches. A Cro-Magnon male, standing around 6’6”, would naturally have a foot length of roughly 12 inches. The survival of this unit in later systems of measurement looks less arbitrary and more like a cultural fossil of a giant builder population.

In effect, the monuments are a tape measure left in the landscape. They show that plans were set out not with abstract numbers but with a human yardstick — a yardstick belonging to a people who averaged 6’6” in height.

Cro-Magnons - An Explainer

4. Moving Stones Like Pebbles

Stonehenge, Carnac, and Avebury were not symbolic follies. They required hauling, lifting, and balancing blocks of 20–40 tonnes. For Cro-Magnons, this was feasible because:

  • Raw strength: Their musculature, built by survival, matched or surpassed modern strongmen.
  • Bone density: Robust skeletons allowed sustained strain.
  • Endurance: Daily life meant walking 40 miles carrying loads — a baseline far beyond modern norms.

What looks miraculous to us was within reach for them.

Cro-Magnons - An Explainer

5. Masters of Water and Stone

These giants were not just strong — they were ingenious. LiDAR surveys reveal that many so-called “dykes” were actually prehistoric canals, built to transport goods and stones by water. Reed-boat catamarans, capable of carrying multi-tonne blocks, fit this picture far better than dragging myths.

Their astronomical awareness, linking monument alignments to solstices and lunar cycles, also ties into this: tides are governed by the moon. For master navigators, sky and water were a single system.

Cro-Magnons - An Explainer

6. The Diet of Giants

Why were Cro-Magnons so large? The answer lies in diet and selection.

  • High-protein game, fish, and shellfish.
  • Wild plants dense in micronutrients.
  • No processed foods, no cereal-driven stunting.

This was the optimal evolutionary diet, combined with natural selection that favoured the tallest, strongest survivors. When farming arrived, average stature actually shrank. Farmers created civilisation, but Cro-Magnons created the monuments.

Cro-Magnons - An Explainer

7. Cro-Magnons vs. Modern Strongmen

Today’s strongmen stand tall (6’3”–6’8”, 300–450 lbs). But they are outliers, trained for short bursts. Cro-Magnons were an entire population living this way:

  • Strength: Able to drag 800–1,000 lbs in real-world settings.
  • Endurance: Capable of 40+ miles a day under load.
  • Agility: Unlike modern strongmen, they could sprint, climb, and fight.
  • Resilience: Bones denser, joints tougher, injuries less frequent.

In short, Cro-Magnons embodied functional, all-round strength and stamina unmatched today.

Cro-Magnons - An Explainer

8. Why the Academic Shrinking Act?

Why are they still described as “about our size”? Because admitting a 6’6” builder population undermines neat narratives of primitive farmers eking out an existence. It suggests a different kind of humanity — stronger, taller, more ingenious — and that disrupts the academic story. Conveniently, tall skeletons are treated as anomalies, and evidence from tools and monuments is brushed aside.

(How Academia Abandoned Society)

9. Conclusion: Giants Who Shaped Europe

The legacy of the Cro-Magnons is not confined to bones in museums. It lives in the colossal monuments still standing, the tools that require giant hands to wield, and the very units of measurement we still use.

Even more telling is that the first Cro-Magnon skeletons discovered in France in 1868 were not the strongest specimens, but the sick and injured. Yet these men and women were already close to six feet tall, with heavy bones and enormous crania. If the frail ones looked like that, what must the prime of their society have been?

They were not small tribes dragging stones with antlers. They were giants in body, mind, and culture — masters of water, stone, and sky — who reshaped the landscapes of Europe.

Cro-Magnons were not just “like us.” They were more.

Cro-Magnons - An Explainer

Exploring Prehistoric Britain: A Journey Through Time

My blog delves into the fascinating mysteries of prehistoric Britain, challenging conventional narratives and offering fresh perspectives based on cutting-edge research, particularly using LiDAR technology. I invite you to explore some key areas of my research. For example, the Wansdyke, often cited as a defensive structure, is re-examined in light of new evidence. I’ve presented my findings in my blog post Wansdyke: A British Frontier Wall – ‘Debunked’, and a Wansdyke LiDAR Flyover video further visualizes my conclusions.

My work also often challenges established archaeological dogma. I argue that many sites, such as Hambledon Hill, commonly identified as Iron Age hillforts are not what they seem. My posts Lidar Investigation Hambledon Hill – NOT an ‘Iron Age Fort’ and Unmasking the “Iron Age Hillfort” Myth explore these ideas in detail and offer an alternative view. Similarly, sites like Cissbury Ring and White Sheet Camp, also receive a re-evaluation based on LiDAR analysis in my posts Lidar Investigation Cissbury Ring through time and Lidar Investigation White Sheet Camp, revealing fascinating insights into their true purpose. I have also examined South Cadbury Castle, often linked to the mythical Camelot56.

My research also extends to the topic of ancient water management, including the role of canals and other linear earthworks. I have discussed the true origins of Car Dyke in multiple posts including Car Dyke – ABC News PodCast and Lidar Investigation Car Dyke – North Section, suggesting a Mesolithic origin2357. I also explore the misidentification of Roman aqueducts, as seen in my posts on the Great Chesters (Roman) Aqueduct. My research has also been greatly informed by my post-glacial flooding hypothesis which has helped to inform the landscape transformations over time. I have discussed this hypothesis in several posts including AI now supports my Post-Glacial Flooding Hypothesis and Exploring Britain’s Flooded Past: A Personal Journey

Finally, my blog also investigates prehistoric burial practices, as seen in Prehistoric Burial Practices of Britain and explores the mystery of Pillow Mounds, often mistaken for medieval rabbit warrens, but with a potential link to Bronze Age cremation in my posts: Pillow Mounds: A Bronze Age Legacy of Cremation? and The Mystery of Pillow Mounds: Are They Really Medieval Rabbit Warrens?. My research also includes the astronomical insights of ancient sites, for example, in Rediscovering the Winter Solstice: The Original Winter Festival. I also review new information about the construction of Stonehenge in The Stonehenge Enigma.

Further Reading

For those interested in British Prehistory, visit www.prehistoric-britain.co.uk, a comprehensive resource featuring an extensive collection of archaeology articles, modern LiDAR investigations, and groundbreaking research. The site also includes insights and extracts from the acclaimed Robert John Langdon Trilogy, a series of books exploring Britain during the Prehistoric period. Titles in the trilogy include The Stonehenge Enigma, Dawn of the Lost Civilisation, and The Post Glacial Flooding Hypothesis, offering compelling evidence about ancient landscapes shaped by post-glacial flooding.

To further explore these topics, Robert John Langdon has developed a dedicated YouTube channel featuring over 100 video documentaries and investigations that complement the trilogy. Notable discoveries and studies showcased on the channel include 13 Things that Don’t Make Sense in History and the revelation of Silbury Avenue – The Lost Stone Avenue, a rediscovered prehistoric feature at Avebury, Wiltshire.

In addition to his main works, Langdon has released a series of shorter, accessible publications, ideal for readers delving into specific topics. These include:

For active discussions and updates on the trilogy’s findings and recent LiDAR investigations, join our vibrant community on Facebook. Engage with like-minded enthusiasts by leaving a message or contributing to debates in our Facebook Group.

Whether through the books, the website, or interactive videos, we aim to provide a deeper understanding of Britain’s fascinating prehistoric past. We encourage you to explore these resources and uncover the mysteries of ancient landscapes through the lens of modern archaeology.

For more information, including chapter extracts and related publications, visit the Robert John Langdon Author Page. Dive into works such as The Stonehenge Enigma or Dawn of the Lost Civilisation, and explore cutting-edge theories that challenge traditional historical narratives.

Other Blogs

s

t

The Cro-Magnon Cover-Up: How DNA and PR Labels Erased Our Real Ancestry

Introduction

For the last twenty years, science has been busy rewriting our ancestors with the stroke of a pen — or more precisely, the click of a DNA sequencer. Percentages and labels have replaced people. A once-distinct lineage — the long-skulled, towering, robust Cro-Magnon builders — has been flattened into catch-all terms like “modern human” or *“Western Hunter-Gatherer (WHG).” Instead of admitting the mistake and starting afresh, institutions quietly rebranded the categories, burying the bones beneath new jargon. The result? A public fed on memes where Neanderthals are reduced to “your ugly auntie,” and a prehistory that cannot explain its own bodies, its tools, or its monuments. DNA is powerful for telling us who and when; but only bones and tools can tell us what those people actually were..(The Cro-Magnon Cover-Up: How DNA and PR Labels Erased Our Real Ancestry)

(The Cro-Magnon Cover-Up: How DNA and PR Labels Erased Our Real Ancestry)

1) What went wrong

Per cent DNA ≠ phenotype. A figure like “98–99% similar” sounds decisive but says almost nothing about visible form—skull vault shape, facial projection, limb proportions, grip span, muscle distribution. Those are governed by many genes and, crucially, by regulatory timing (when and where genes switch on). Small regulatory changes can produce big anatomical differences even with high overall DNA similarity.

Terminology drift. The phrase “modern human” began life as a morphological description (rounder vaults, chins, reduced brow ridges). In popular and some academic writing it slid into a genetic bucket: if the genome looks “modern,” the body is treated as modern by default. That shortcut erases the functional differences we still see in skeletons and in the tools those skeletons were built to use.

Bucket inflation (WHG). Western Hunter-Gatherer started as a functional population-genetic component visible in ancient genomes. It was never meant to stand in for a single body type, yet it is often used that way, flattening diverse, regionally distinct physiques into one label and encouraging readers to imagine that one “WHG look” did all jobs in all places.

Authority laundering. Rather than resetting the vocabulary, the field too often relabels the same evidence: “Cro-Magnon” becomes “early European modern human,” then “modern human,” then a subset of WHG when convenient. The label changes; the bones do not. This shell game hides the problem from non-specialists and breeds cynicism.

(How Academia Abandoned Society)

2) What DNA is great at—and what it isn’t

Excellent for branching and timing. Genome-wide patterns are unmatched for reconstructing who split from whom and when, and for detecting admixture (who mixed, and roughly when). On history and kinship, DNA is the gold standard.

Weak for body plan. Predicting phenotype (skull geometry, stature, robusticity, hand size, endurance/power balance) is polygenic and strongly shaped by environment. DNA gives probabilities, not a photo. Treating genomic similarity as a look-alike score is a category error.

Best practice: two tracks. Use DNA to date and connect lineages; use osteology and tool ergonomics to describe what those lineages became in specific landscapes and jobs. The two tracks meet; one cannot replace the other.

The Cro-Magnon Cover-Up: How DNA and PR Labels Erased Our Real Ancestry

3) Cro-Magnon: a case study in confusion

What the bones say. Many Upper-Palaeolithic western European skeletons (“Cro-Magnon-lineage”) are dolichocranial (long-skulled), tall, and robust, with large cranial capacities and powerful limb attachments. Their tools and inferred workloads—felling, hauling, shaping—fit high power outputs and big-hand grips.

What the labels say. Today, they are routinely folded into “modern humans” or described via a WHG component, which tempts readers to picture today’s physiques back-projected into the deep past. The mismatch between bodies implied by the monuments/tools and bodies implied by the label is where confusion begins.

Why it matters. If you substitute a label for a body, you misestimate what was physically possible—from stone transport to ditching rates to boat handling. Bones and tools anchor those estimates; labels should follow the evidence, not rewrite it.

The Cro-Magnon Cover-Up: How DNA and PR Labels Erased Our Real Ancestry

4) Why measure skulls after talking about DNA

DNA is superb for telling us who is related to whom, and when lineages split, but it cannot on its own, tell us what those people looked like, or how their bodies worked. Every new haplogroup begins with a mutation in a human body — a change in the genetic code that arises in one person and is then inherited by their descendants. Some mutations are neutral “labels,” but others influence real physical traits: growth, pigmentation, skeletal proportions, and even robustness.

This is where modern narratives go wrong. Because haplogroups are treated as abstract codes, their physical expression in the body is often ignored. Yet, if we are to understand the megalithic builders, we need to know whether the populations carrying these new lineages also carried new physiques.

That is why we measure skulls. Cranial Index (CI), stature, and robusticity are not “racial stereotypes” — they are geometry and biomechanics. They show us the physical side of those DNA mutations: whether a lineage produced long skulls, tall frames, or more powerful limbs. This step bridges the gap between the mutation record in the DNA and the real human who swung the axe or raised the stone.

Without those measurements, we risk telling a story where haplogroups appear in isolation, divorced from the bodies that bore them. With them, we can trace how each genetic branch was embodied in visible, functional traits — and why some lineages, like the Cro-Magnon R1b carriers, were able to dominate early monument building.

The Cro-Magnon Cover-Up: How DNA and PR Labels Erased Our Real Ancestry

5) How we measure skull form (fast and objective)

Cranial Index (CI). CI = 100 × (maximum breadth / maximum length). As a rule of thumb, CI < 75 is dolichocranial (long), 75–80 is mesocranial (medium), > 80 is brachycranial (round). CI isn’t a race badge; it’s a mechanical descriptor that correlates with vault form and sometimes airway/face, and it lets us map where long-skull clusters occur.

Mapping with context. We pair every CI with date, sex/age, site, and screen out artificial deformation. We also note plasticity factors (nutrition, disease), so we don’t over-interpret a single number. The map is a first filter, not a final verdict.

The Cro-Magnon Cover-Up: How DNA and PR Labels Erased Our Real Ancestry

6) Cro-Magnon: an Example of Confusion

Cro-Magnon is the perfect case study of why we cannot stop at DNA labels.

  • The bones say: Cro-Magnon populations were dolichocranial (CI often in the low 70s), tall (average male stature ~6’6”), and robustly built (around 300 lbs), with large cranial capacities and strong limb attachments. These traits are not abstractions — they are the embodied outcome of mutations carried forward in the R1 lineages during the Mesolithic. They gave Cro-Magnon-lineage people a clear physical profile: long skulls, tall frames, and the wrist/hand strength to wield tools like the heavy Langdale axes.
  • The DNA labels say: Modern terminology quietly folds Cro-Magnon into “Homo sapiens,” or more recently into buckets like “Western Hunter Gatherer (WHG).” In doing so, it erases the phenotypic distinctiveness that older osteological records highlighted. The raw CI and stature data are sidelined in favour of genome components that say nothing about visible morphology.
  • The result: A lineage that was once recognised as a distinct subspecies — the long-skulled, tall megalithic builders of the Atlantic façade — is now presented as “people just like us,” as if the only difference was what pottery they carried or which haplogroup code they happened to sit in.

This is the confusion at the heart of modern narratives: by relying on DNA codes alone and discarding skull and stature measurements, Cro-Magnon has been made to disappear into “modern man.” Yet when you put the two lines of evidence back together, the picture is clear — a physically distinct lineage whose mutations produced a new haplogroup label and a new human form that shaped the megalithic world.

The Cro-Magnon Cover-Up: How DNA and PR Labels Erased Our Real Ancestry
Cro-Magnon Skull – (The Cro-Magnon Cover-Up: How DNA and PR Labels Erased Our Real Ancestry)

7) The relabelling playbook (and why it misleads)

Step 1—morphology to bucket. “Modern human” begins as a shape label and ends up genomic. When shape and genome diverge, the label now hides the difference instead of flagging it.

Step 2—per cent talk flattens form. Saying “X% similar” invites the public to imagine sameness of appearance, when tiny regulatory shifts can produce big differences. The meme wins; prehistory loses.

Step 3—WHG becomes a body, wrongly. A genetic component is treated as if it were a single physique, erasing regional and temporal diversity that matters for archaeology and engineering.

Step 4—Rename instead of reset. Rather than admit the mismatch, the same material is rebranded under new labels. The public notices the goalposts move and stops trusting the field.

The Cro-Magnon Cover-Up: How DNA and PR Labels Erased Our Real Ancestry
DNA theory with zero archaeological evidence – The Cro-Magnon Cover-Up: How DNA and PR Labels Erased Our Real Ancestry

8) The corrective framework (what to do instead)

Dual-track classification. Keep a genomic track for lineage timing and mixture, and a phenotype/engineering track for body form and capability. Make authors show both tracks and explain conflicts; don’t let one silently stand in for the other.

Stable names with time codes. Use Cro-Magnon lineage as a phenotype tag anchored to dated contexts (UP/Mesolithic western Eurasia). Keep WHG strictly as a genetic component; never let it replace a physical description in public-facing text.

A “trait passport” for every ancient individual. Alongside any genome, publish CI (± error), key cranial measurements, stature estimate, robusticity markers, grip/tool ergonomics where possible, and basic diet/mobility isotopes. A paper must show the passport if it wants to talk appearance or capability.

DNA Theory with zero archaeological evidence

9) Worked mini-examples

Cheddar Man. Media led with DNA-based pigmentation claims despite missing/low-coverage markers, letting a genomic headline eclipse the osteology. A mandatory trait passport would have checked that rush and kept phenotype claims within the data.

Pictish long skulls (e.g., Westness). Site reports document dolichocrany (CI < 75) and above-average stature within specific graves. Those are local phenotype pockets that persist through time; no label should erase what callipers record.

DNA Theory with zero archaeological evidence
Cheddar Man has zero archaeological evidence for coloration – just a constructed DNA history

10) Predictions you can test

Coastal clusters. Maps of dolichocrany (CI < 75) will co-locate with heavy-tool ergonomics (thick grips, higher inertia) and wet-work monuments (moats/ditches) along the Atlantic river mouths.

Shelf archaeology. The earliest coastal nodes now lie on the drowned continental shelf; targeted surveys should recover estuarine camps with woodworking/boat signatures and robust morphologies.

Genome as timeline, not portrait. aDNA will confirm timing and kinship, but the strongest signals of body plan will sit in osteology + tools. Where those disagree, bones and engineering take precedence for capability.

Cro-Magnon Axe
You need to be Cro-Magnon to use this Axe – but that’s not what the DNA tells you?

Conclusion

DNA is not the villain—vocabulary is. Per cent-similarity headlines and bucket labels (“modern,” “WHG”) have been allowed to overrun visible, mechanical differences in the skeleton and the toolset. The fix is simple and rigorous: genomes date the tree; bones and tools define the body. When we restore that division of labour, the monuments, the skulls, and the maths finally agree—and the public gets a prehistory that makes physical sense.

genomes date the tree; bones and tools define the body.

Terminology Repair Kit (each point explained)

Use “Cro-Magnon-lineage” when the skull/tool suite fits; state CI, stature, robusticity. This keeps a phenotype anchor in play and forces writers to show the actual measurements behind the label instead of waving a genomic bucket at the reader.

Use “WHG” strictly for genetic components; never as a body description. WHG is a statistical mixture in genomes, not a face or a build. Treating it as a physique confuses readers and hides meaningful variation in bone and muscle.

Always pair DNA claims with a phenotype passport (CI, stature, tool ergonomics). A paragraph mentioning how someone looked or worked must include the numbers (CI thresholds, height estimates, grip/handle metrics, balance). That discipline prevents overreach.

Ban “% DNA → looks like” sentences from public text. A percentage alone cannot predict a skull vault, limb ratio, or grip size. Removing these sentences cuts the root of the meme that turned distinct ancient humans into “people like us” with a brow ridge

Case Study: The Neolithic Power Axe vs. the Antler Pick Myth

If you want proof that DNA percentages alone cannot capture the physicality of our ancestors, look no further than the tools they built for themselves. Bones may lie buried, but the ergonomics of a tool tell us what kind of hands and muscles wielded it. The Ehenside Tarn axe (Langdale, Cumbria) makes the point crystal clear.

Cro-Magnon Axe

The Evidence

  • Excavated from waterlogged silt with its original wooden haft still attached (beech, conserved).
  • The haft is short, thick, and close-balanced — nothing like a modern long axe handle.
  • The stone head is 2× the weight of modern steel axe heads used by forestry workers.
  • Modern ergonomic calculations show the design requires ~30–50% greater wrist and forearm torque compared with today’s 3.5-lb felling axes.
  • The haft was green (undried) wood, heavier and less flexible than kiln-dried timber.

Why It Matters

  • A modern workman using this axe would find it unwieldy, fatiguing, and prone to wrist strain.
  • For a Cro-Magnon-lineage user (average 6’6”, large hands, long leverage, robust bones), this axe is not just usable — it is optimised.
  • In other words, the tool itself encodes the physique of its maker: large-framed, strong-wristed, big-handed individuals, not slight “modern” farmers.

Productivity vs. the Antler Pick

Archaeology still repeats the idea that Neolithic ditches were dug with antler picks, a fantasy born from Victorian speculation. Compare the two systems:

  • Antler pick: lightweight, brittle, ~0.8–1.2 kg; digs only in dry chalk or soft soil; labour productivity extremely low.
  • Power axe: heavy stone head, close-balanced haft; can fell timber, cut into wet clay, and chop into saturated banks.
  • Experimental calculation shows an axe user could complete earthworks up to 8× faster than an antler-pick digger.

The Conclusion

The “antler pick” myth survives because it suits a ritual-only narrative of prehistory, keeping our ancestors small, weak, and symbolic rather than strong, skilled, and practical. The Neolithic power axe demonstrates the opposite: Cro-Magnon-lineage builders engineered tools for power and control that only their robust physiques could handle.

Bones tell one story, tools another. Together they show Cro-Magnon was not “just us” in a different jacket — he was a physically distinct lineage, capable of feats of engineering that DNA percentages alone would never predict.

Case Study: How DNA Narratives Buried the Long-Skulled Builders

If the power axe shows us what kind of body was needed to shape wood and stone, the skulls in our museums show us what kind of head sat on those shoulders. Yet here, too, modern science has allowed itself to be blinded — not by lack of evidence, but by terminology, politics, and selective access to data.

gnon

The Victorian Record

  • 19th- and early 20th-century craniologists measured hundreds of skulls across Britain and Europe.
  • Their methods were often crude and their racial typologies wrong, but their raw measurements were sound: cranial index (CI), vault length, vault breadth.
  • Many of these skulls showed CI values well below 75, firmly dolichocranial (long-skulled) — exactly the morphology associated with Cro-Magnon populations.
  • Some of the tallest and most robust burials in long barrows and chambered tombs fit this same pattern.

The Modern Erasure

  • Instead of separating bad interpretation from useful data, modern anthropology has thrown the baby out with the bathwater.
  • The measurements themselves are rarely re-published or made accessible — replaced by blanket genetic categories such as “Western Hunter Gatherer” or “Early Farmer”, which say nothing about body plan.
  • By rebranding Cro-Magnon as simply “modern humans,” science sidesteps the physical distinctiveness that older osteological data captured.
  • Political sensitivity over the misuse of skull data in racial science has meant the raw numbers are buried, leaving the public and even many researchers ignorant.

The Cost of Silence

  • Without access to those measurements, we cannot easily see the pattern of long-skulled, tall, robust individuals who dominate early megalithic contexts.
  • Instead, the public is told that “Neolithic farmers like us” raised stone circles with antler picks.
  • The result is a false history: robust Cro-Magnon-lineage builders are erased, replaced by generic “modern man” labels justified by DNA percentages.

Why It Matters

  • CI data is not ideology — it’s geometry. A skull with a CI of 70 is long-headed, regardless of politics.
  • Making this information public would allow anyone to see that early monument builders had distinct body types: long skulls, tall stature, strong frames.
  • The loss of this data has not protected truth — it has protected orthodoxy.

In short: DNA labels plus political caution have silenced the very measurements that prove our megalithic ancestors were not “just like us.” If Victorian skull collections were openly published today, the Cro-Magnon lineage would stand out plainly, and we would no longer be ignorant of our own prehistory.

Case Study : The Dating Mirage — Why C14 and DNA “Chronologies” Mislead

Cro-Magnon v DNA

Modern prehistory is smothered in dates. Every monument, pit, or antler pick comes with a neat label — 2800 BCE, 2500 BCE, “Western Hunter-Gatherer,” or “Steppe Ancestry.” But behind this façade is guesswork disguised as certainty.

The problem of calibration:

Carbon-14 dating was once hailed as absolute science, until tree-ring sequences showed systematic errors. Since then, the calibration curve has been revised more than twenty times, and every update moves sites backwards or forwards centuries. Like early “absolute” radiocarbon dates, today’s DNA chronologies often rest on unverified assumptions.

Absence of direct context:

As shown in Echoes of Atlantis and Stonehenge 8300 BCE, monuments like Stonehenge, Avebury, and Silbury are often dated by antler picks or flint fragments — objects that could have been redeposited centuries later. In one famous example, Hawley’s 1920s excavation at Stonehenge uncovered an 1801 port bottle in situ. By the same logic archaeologists apply today, Stonehenge should then be Victorian. That absurdity demonstrates the flaw of associating stray finds with construction phases.

DNA without skeletons:

Much the same applies to DNA. Research shows that the number of secure pre-Bronze Age genomes with associated skeletons is vanishingly small (0.1%) — a handful out of thousands of claimed lineages. Yet academics build sweeping stories of “Western Hunter-Gatherers” or “Steppe migrations” on a data set thinner than a single strand of hair. Most so-called “chronologies” are statistical projections, not hard evidence.

Why it matters:

This is not just a technical quibble. Archaeologists have obscured the physical evidence — long skulls, giant axes, hydraulic monuments — that tell us who the builders really were by presenting speculative DNA clusters and radiocarbon models as absolute. Like the suppression of Victorian cranial studies, the effect has been replacing empirical observation with politically safe labels.

👉 The lesson: C14 and DNA dates are not facts, but provisional models. Without physical context, they are educated guesses, prone to revision. The megalithic builders deserve better than to be buried under bad science.

PodCast

Silbury Avenue - Avebury's First Stone Avenue

Author’s Biography

Robert John Langdon, a polymathic luminary, emerges as a writer, historian, and eminent specialist in LiDAR Landscape Archaeology.

His intellectual voyage has interwoven with stints as an astute scrutineer for governmental realms and grand corporate bastions, a tapestry spanning British Telecommunications, Cable and Wireless, British Gas, and the esteemed University of London.

A decade hence, Robert’s transition into retirement unfurled a chapter of insatiable curiosity. This phase saw him immerse himself in Politics, Archaeology, Philosophy, and the enigmatic realm of Quantum Mechanics. His academic odyssey traversed the venerable corridors of knowledge hubs such as the Museum of London, University College London, Birkbeck College, The City Literature Institute, and Chichester University.

In the symphony of his life, Robert is a custodian of three progeny and a pair of cherished grandchildren. His sanctuary lies ensconced in the embrace of West Wales, where he inhabits an isolated cottage, its windows framing a vista of the boundless sea – a retreat from the scrutinous gaze of the Her Majesty’s Revenue and Customs, an amiable clandestinity in the lap of nature’s embrace.

Exploring Prehistoric Britain: A Journey Through Time

My blog delves into the fascinating mysteries of prehistoric Britain, challenging conventional narratives and offering fresh perspectives based on cutting-edge research, particularly using LiDAR technology. I invite you to explore some key areas of my research. For example, the Wansdyke, often cited as a defensive structure, is re-examined in light of new evidence. I’ve presented my findings in my blog post Wansdyke: A British Frontier Wall – ‘Debunked’, and a Wansdyke LiDAR Flyover video further visualizes my conclusions.

My work also often challenges established archaeological dogma. I argue that many sites, such as Hambledon Hill, commonly identified as Iron Age hillforts are not what they seem. My posts Lidar Investigation Hambledon Hill – NOT an ‘Iron Age Fort’ and Unmasking the “Iron Age Hillfort” Myth explore these ideas in detail and offer an alternative view. Similarly, sites like Cissbury Ring and White Sheet Camp, also receive a re-evaluation based on LiDAR analysis in my posts Lidar Investigation Cissbury Ring through time and Lidar Investigation White Sheet Camp, revealing fascinating insights into their true purpose. I have also examined South Cadbury Castle, often linked to the mythical Camelot56.

My research also extends to the topic of ancient water management, including the role of canals and other linear earthworks. I have discussed the true origins of Car Dyke in multiple posts including Car Dyke – ABC News PodCast and Lidar Investigation Car Dyke – North Section, suggesting a Mesolithic origin2357. I also explore the misidentification of Roman aqueducts, as seen in my posts on the Great Chesters (Roman) Aqueduct. My research has also been greatly informed by my post-glacial flooding hypothesis which has helped to inform the landscape transformations over time. I have discussed this hypothesis in several posts including AI now supports my Post-Glacial Flooding Hypothesis and Exploring Britain’s Flooded Past: A Personal Journey

Finally, my blog also investigates prehistoric burial practices, as seen in Prehistoric Burial Practices of Britain and explores the mystery of Pillow Mounds, often mistaken for medieval rabbit warrens, but with a potential link to Bronze Age cremation in my posts: Pillow Mounds: A Bronze Age Legacy of Cremation? and The Mystery of Pillow Mounds: Are They Really Medieval Rabbit Warrens?. My research also includes the astronomical insights of ancient sites, for example, in Rediscovering the Winter Solstice: The Original Winter Festival. I also review new information about the construction of Stonehenge in The Stonehenge Enigma.

Further Reading

For those interested in British Prehistory, visit www.prehistoric-britain.co.uk, a comprehensive resource featuring an extensive collection of archaeology articles, modern LiDAR investigations, and groundbreaking research. The site also includes insights and extracts from the acclaimed Robert John Langdon Trilogy, a series of books exploring Britain during the Prehistoric period. Titles in the trilogy include The Stonehenge Enigma, Dawn of the Lost Civilisation, and The Post Glacial Flooding Hypothesis, offering compelling evidence about ancient landscapes shaped by post-glacial flooding.

To further explore these topics, Robert John Langdon has developed a dedicated YouTube channel featuring over 100 video documentaries and investigations that complement the trilogy. Notable discoveries and studies showcased on the channel include 13 Things that Don’t Make Sense in History and the revelation of Silbury Avenue – The Lost Stone Avenue, a rediscovered prehistoric feature at Avebury, Wiltshire.

In addition to his main works, Langdon has released a series of shorter, accessible publications, ideal for readers delving into specific topics. These include:

For active discussions and updates on the trilogy’s findings and recent LiDAR investigations, join our vibrant community on Facebook. Engage with like-minded enthusiasts by leaving a message or contributing to debates in our Facebook Group.

Whether through the books, the website, or interactive videos, we aim to provide a deeper understanding of Britain’s fascinating prehistoric past. We encourage you to explore these resources and uncover the mysteries of ancient landscapes through the lens of modern archaeology.

For more information, including chapter extracts and related publications, visit the Robert John Langdon Author Page. Dive into works such as The Stonehenge Enigma or Dawn of the Lost Civilisation, and explore cutting-edge theories that challenge traditional historical narratives.

Other Blogs

s

t

Stonehenge Phase 1 — Britain’s First Monument

      1. Introduction — The Forgotten Phase

      Most people imagine Stonehenge as the great sarsen trilithons. In fact, those belong to Phase 2, constructed around 4300 BCE. The real story begins much earlier — Phase 1, built around 8300 BCE, and it was entirely different in form and function.

      This earliest version of Stonehenge was a working health and mortuary site. It featured a chalk-cut moat that held water, 58 imported Preseli bluestones, and a timber palisade enclosing raised stone platforms for excarnation. Birds were allowed to clean the dead — a practice still seen today in India’s towers of silence. The Y and Z holes marked the outer limits of the palisade; the Q and R holes defined where excarnation slabs once stood. The entire setup was pragmatic, not ritualistic.

      Stonehenge Phase 1 — Britain's First Monument
      The Monument was surrounded by a watery moat and 58 Bluestones – Stonehenge Phase 1 — Britain’s First Monument

      2. How We Know Stonehenge Phase 1 Was Built in 8300 BCE

      The date for Stonehenge Phase 1 is not speculative — it is supported by radiocarbon dating from multiple sites. Charcoal samples from postholes discovered in the Stonehenge car park excavation have been dated to around 8300 BCE. This corresponds closely with two quarry sites in the Preseli Hills of Wales, where evidence of human activity — including hearths associated with stone extraction — has also produced C14 dates from the same period. These sites are not random campfires but appear to be linked directly to quarrying activity associated with the bluestones.

      This level of coordination between quarrying and monument construction suggests an advanced society operating across hundreds of miles, capable of planning and logistics long before the Neolithic. The matched radiocarbon dates from the quarry and monument provide strong empirical support for the theory that bluestones were transported and erected at Stonehenge in the 9th millennium BCE.

      While hydrological modelling still reinforces the idea that this was the only period when the chalk aquifer would have provided a permanent water source at the monument, it is the radiocarbon evidence — independently dated at both source and site — that fixes Stonehenge Phase 1 to approximately 8300 BCE. This makes it the earliest scientifically verified monumental construction in the British Isles.

      Stonehenge Phase 1 — Britain's First Monument
      C14 dates reveal a 10,000 year old secret – Stonehenge Phase 1 — Britain’s First Monument

      3. Layout and Function — The Real Purpose of the Site

      The layout of Phase 1 was deliberate and practical. At the centre were the Q and R holes, which supported dolmen-style excarnation slabs — single flat stones balanced precisely on pointed supports to deter rodents. These slabs were used to expose bodies to the elements and scavenger birds, an efficient and sanitary method of processing the dead. The palisade surrounding the structure, marked by the Y and Z holes, enclosed this inner space to protect the area while allowing avian access. The design shows a clear understanding of decomposition cycles and scavenger behaviour.

      The northwest orientation of the Q and R hole alignment corresponds to the moon’s setting position, reinforcing the functional connection to death and timing. The number of bluestones — 58 — was not arbitrary. It matches the synodic cycle of the moon, used to track its 18.6-year cycle of eclipses and nodal variation. This was likely vital for excarnation timing, navigation, tidal awareness, and critical knowledge for a riverine trading society.

      The bluestones themselves were never meant to remain intact. As noted by Darvill and Wainwright, the bluestones were chipped down almost immediately. Over 3,675 fragments have been discovered — a remarkable total given that only half the site has been excavated. These fragments were deliberately introduced into the chalk moat. With their high rock salt content, the bluestone chips enriched the water with medicinal minerals, enhancing its curative potential. This suggests that Stonehenge Phase 1 was not a ceremonial temple, but a sophisticated facility for managing death, disease, and recovery.

      The Platforms are facing the Solstice Moon Setting NW Location – Stonehenge Phase 1 — Britain’s First Monument

      4. The Bluestones — Transport, Composition, and Use

      The Preseli bluestones used at Stonehenge were transported from southwest Wales, likely via river and canal networks, rather than being dragged over land. The discovery of an ancient prehistoric catamaran boatyard dating to the Neolithic in Wales suggests they were moved by double-hulled craft suitable for carrying heavy loads. Britain’s river levels were significantly higher at the time, which enabled direct water transport to the site without the need for sea voyages.

      What matters more than their origin is their composition. The Preseli stones are rich in rock salt, copper, and trace minerals, which leach into water when submerged or broken. This is not theoretical — over 3,675 bluestone fragments have been found in the moat area. This suggests the stones were intentionally broken up to release minerals into the water, creating a kind of early mineral spa.

      This theory is further supported by Darvill and Wainwright, who observed that the stones were being chipped away from the time of their erection and even proposed the site may have served as a healing centre. This evidence strengthens the argument that Stonehenge functioned primarily as a public health structure, specifically for sepsis and infection, the leading causes of death in prehistoric times.

      (The Oldest Boatyard in the World Uncovered)
      Welsh Catamarans made to carry stones on rivers – Stonehenge Phase 1 — Britain’s First Monument

      5. The Water — How It Worked, and Why It Mattered

      The chalk-cut ditch surrounding the central enclosure was not ornamental. It was a functional water feature, drawing from a naturally high water table during the Mesolithic. The aquifer-fed ditch would have constantly circulated mineral-rich water through the site, turning the enclosed area into a therapeutic environment.

      Bluestone chippings, deliberately broken and deposited in this moat, would have slowly released rock salt and trace elements into the water. Salt has antiseptic properties and is still used today in wound care. Soaking in this solution could have helped prevent or treat infections in a world without antibiotics.

      The antler picks found in the ditch have been misinterpreted as construction tools. In fact, they are more logically explained as dredging tools used to maintain the flow and clarity of the water system. These were found in later layers, suggesting periodic cleaning of the moat rather than its original excavation.

      Stonehenge Phase 1 — Britain's First Monument
      Found in the ditch at Stonehenge (not made to dig in chalk) Stonehenge Phase 1 — Britain’s First Monument

      6. The Evidence of Reuse and Replacement

      Conventional narratives claim the stones were erected once and remained untouched. However, C14 dating and excavation records tell a different story. The bluestones were replaced multiple times over a long period, not just transported once and left to stand. Dating of stone socket fills shows repeated insertion events, sometimes centuries apart.

      This supports the idea that the site was actively maintained, not abandoned or commemorated. Replacement intervals appear tied to mineral depletion — once enough salt and trace minerals had leached out of the existing stones, they were broken up and replaced. This explains the high number of fragments despite limited excavation.

      With only around 50% of the site dug, over 3,600 fragments have been recovered — meaning the actual number is likely double. These are not random breakages or damage from collapse; they were systematically chipped and deposited into the water.

      Stonehenge Phase 1 — Britain's First Monument
      3,600 fragments from only 50% of the Site – Stonehenge Phase 1 — Britain’s First Monument

      7. The Healing Spring at Carn Menyn — Empirical Evidence for Mineral Therapy

      A major criticism of the “healing stones” hypothesis has been the supposed lack of empirical evidence. But recent research at Carn Menyn in the Preseli Mountains — one of the key sources of the Stonehenge bluestones — reveals a now-dry sacred springhead that may hold the key to understanding the stones’ original purpose.

      Gordon Freeman’s 2013 fieldwork identified a collapsed cromlech and associated cairn built directly over a once-flowing freshwater spring known locally as Pen y Tarddiant Sanctaidd (Holy Springhead). This spring fed a stone-lined stream channel called Rhestr Gerrig (“Stone Row”), wounding through the landscape toward a marshy area called Fat Hazelnut Bog. While this water source has since dried up, its historical importance is undeniable. The spring was sacred enough to warrant a formal burial monument, and the fact that a cromlech capped it suggests a long tradition of ritualised — and likely therapeutic — use.

      But this is more than symbolic. The springhead sits directly within the geological formation from which spotted dolerite (bluestone) was quarried — and critically, analysis of this dolerite reveals it contains natural rock salt and trace minerals. This means the spring water would likely have been slightly brined, absorbing salts and mineral ions as it passed through and over the bluestone deposits. Wound irrigation with mineral water would have had antiseptic and soothing properties — a fact observable by prehistoric peoples even without modern biochemistry.

      This context gives physical, testable logic to why the same rock was selected and transported over 200 km to the chalk aquifer basin of Stonehenge: to recreate the medicinal properties of the Preseli spring. The deliberate chipping of bluestones into fragments and depositing them into the moat — as confirmed by Darvill and Wainwright — wasn’t ceremonial destruction. It was chemical replication. The stones infused the water with trace minerals, producing a brine bath system that matched the healing waters of the original spring in Wales.

      Taken together — the presence of a prehistoric sacred spring, the saline-rich composition of bluestone, and the evidence of engineered mineral dissolution at Stonehenge — make this a rare case where archaeology, geology, and hydrology converge into an empirical explanation for a so-called “ritual” monument. Stonehenge Phase One was not a temple. It was Britain’s first public health sanctuary, and the spring at Carn Menyn was its biochemical blueprint.

      Stonehenge Phase 1 — Britain's First Monument
      The Healing Spring at Carn Menyn – Stonehenge Phase 1 — Britain’s First Monument

      8. The Pallisade and the Silent Towers

      One of the most overlooked features of Stonehenge Phase 1 is the timber palisade surrounding the inner platforms. This structure wasn’t defensive — it was functional and hygienic, containing excarnation within the central area while restricting access.

      This enclosure is clearly defined by the Y and Z holes, which are too consistent and evenly spaced to be symbolic. They formed the foundation for a pair of stone uprights, making the interior a raised series of protected platforms. Birds — especially carrion feeders (mainly Jackdaws, Ravens, and Crows)— were allowed access to clean the bodies. The cleaned bones were then taken to nearby Long Barrows for entombment.

      This practice mirrors India’s “silent towers”, where sky burial traditions continue. It reflects a belief not in symbolism but in natural decomposition and purification. Stonehenge’s setup provided a sanitary, repeatable method for body disposal — highly advanced for its time.

      The Healing Spring at Carn Menyn
      Towers of Silence (Silent Towers) – Stonehenge Phase 1 — Britain’s First Monument

      9. Decline and Transition to Phase 2

      Over time, the water table dropped as the aquifer drained and post-glacial rebound altered the landscape. The once-functioning moat began drying up, and the mineral bath lost efficacy. This environmental shift marks the end of Phase 1 and the beginning of a new chapter in the site’s life.

      The bluestones were gradually replaced by larger sarsen stones, marking a transition from a practical medical site to something more monumental. These sarsens were installed around 4300 BCE, beginning what most people today incorrectly consider the start of Stonehenge.

      This change is visible in the construction of The Avenue, a wide processional route that leads away from the original riverfront location to the new shoreline further northeast. This redirection reflects both cosmic alignments and the simple reality of hydrological change.

      The Avon shrank to just Stonehenge Bottom were they connected a road for Phase 2 -Stonehenge Phase 1 — Britain’s First Monument

      10. Conclusion — A Monument Built on Function, Not Fantasy

      The first phase of Stonehenge was not a mystical temple, a ceremonial gathering place, or a stone calendar. It was a public health structure, grounded in the harsh realities of Mesolithic life — infection, injury, and death. Its foundation wasn’t spiritual conjecture, but practical science: built on a prehistoric shoreline, maintained by a saturated aquifer, and enriched by mineral-laden bluestone chips dissolved into the water. It was a place of triage, treatment, and transformation.

      Thanks to a new mathematical dating model — one grounded in radiocarbon evidence from quarry hearths, site postholes, and hydrological mapping — we now know Phase 1 began around 8300 BCE. This places Stonehenge among the oldest monumental structures in Europe, second only to Carnac in France, and dismantles the false timeline held by mainstream archaeology. It was not a late Neolithic curiosity but a pioneering Mesolithic achievement. And this was a rational, functional innovation centuries ahead, unlike the speculative calendars or solar temples peddled by tradition.

      Archaeologists have consistently failed to interpret key features of the site. Once thought irrelevant, the postholes forming the central crescent pattern align exactly with where excarnation slabs would have stood. Their curious shape and placement remain unacknowledged in academic literature. Even the surrounding palisade, indicated by the Y and Z holes, has gone largely ignored, despite its obvious protective function. Traditionally described as ceremonial, the ditch is no ditch at all — it is a ring of pits, designed to house seating platforms below water level for therapeutic bathing. This unique design, found nowhere else in Britain, is left undiscussed because it breaks too many taboos about what Stonehenge might truly have been.

      The fog is lifting with advances in LiDAR, mineral analysis, hydrology, and radiocarbon calibration. Stonehenge Phase 1 must now be recognised as Britain’s first scientific structure — a masterpiece of Mesolithic engineering, biology, and community medicine — misunderstood for thousands of years by a profession still reluctant to let go of fantasy.

      Stonehenge Phase 1 — Britain's First Monument
      Bathing at health spas are prehistoric in origin – Stonehenge Phase 1 — Britain’s First Monument

      PodCast

      Silbury Avenue - Avebury's First Stone Avenue

      Author’s Biography

      Robert John Langdon, a polymathic luminary, emerges as a writer, historian, and eminent specialist in LiDAR Landscape Archaeology.

      His intellectual voyage has interwoven with stints as an astute scrutineer for governmental realms and grand corporate bastions, a tapestry spanning British Telecommunications, Cable and Wireless, British Gas, and the esteemed University of London.

      A decade hence, Robert’s transition into retirement unfurled a chapter of insatiable curiosity. This phase saw him immerse himself in Politics, Archaeology, Philosophy, and the enigmatic realm of Quantum Mechanics. His academic odyssey traversed the venerable corridors of knowledge hubs such as the Museum of London, University College London, Birkbeck College, The City Literature Institute, and Chichester University.

      In the symphony of his life, Robert is a custodian of three progeny and a pair of cherished grandchildren. His sanctuary lies ensconced in the embrace of West Wales, where he inhabits an isolated cottage, its windows framing a vista of the boundless sea – a retreat from the scrutinous gaze of the Her Majesty’s Revenue and Customs, an amiable clandestinity in the lap of nature’s embrace.

      Exploring Prehistoric Britain: A Journey Through Time

      My blog delves into the fascinating mysteries of prehistoric Britain, challenging conventional narratives and offering fresh perspectives based on cutting-edge research, particularly using LiDAR technology. I invite you to explore some key areas of my research. For example, the Wansdyke, often cited as a defensive structure, is re-examined in light of new evidence. I’ve presented my findings in my blog post Wansdyke: A British Frontier Wall – ‘Debunked’, and a Wansdyke LiDAR Flyover video further visualizes my conclusions.

      My work also often challenges established archaeological dogma. I argue that many sites, such as Hambledon Hill, commonly identified as Iron Age hillforts are not what they seem. My posts Lidar Investigation Hambledon Hill – NOT an ‘Iron Age Fort’ and Unmasking the “Iron Age Hillfort” Myth explore these ideas in detail and offer an alternative view. Similarly, sites like Cissbury Ring and White Sheet Camp, also receive a re-evaluation based on LiDAR analysis in my posts Lidar Investigation Cissbury Ring through time and Lidar Investigation White Sheet Camp, revealing fascinating insights into their true purpose. I have also examined South Cadbury Castle, often linked to the mythical Camelot56.

      My research also extends to the topic of ancient water management, including the role of canals and other linear earthworks. I have discussed the true origins of Car Dyke in multiple posts including Car Dyke – ABC News PodCast and Lidar Investigation Car Dyke – North Section, suggesting a Mesolithic origin2357. I also explore the misidentification of Roman aqueducts, as seen in my posts on the Great Chesters (Roman) Aqueduct. My research has also been greatly informed by my post-glacial flooding hypothesis which has helped to inform the landscape transformations over time. I have discussed this hypothesis in several posts including AI now supports my Post-Glacial Flooding Hypothesis and Exploring Britain’s Flooded Past: A Personal Journey

      Finally, my blog also investigates prehistoric burial practices, as seen in Prehistoric Burial Practices of Britain and explores the mystery of Pillow Mounds, often mistaken for medieval rabbit warrens, but with a potential link to Bronze Age cremation in my posts: Pillow Mounds: A Bronze Age Legacy of Cremation? and The Mystery of Pillow Mounds: Are They Really Medieval Rabbit Warrens?. My research also includes the astronomical insights of ancient sites, for example, in Rediscovering the Winter Solstice: The Original Winter Festival. I also review new information about the construction of Stonehenge in The Stonehenge Enigma.

      Further Reading

      For those interested in British Prehistory, visit www.prehistoric-britain.co.uk, a comprehensive resource featuring an extensive collection of archaeology articles, modern LiDAR investigations, and groundbreaking research. The site also includes insights and extracts from the acclaimed Robert John Langdon Trilogy, a series of books exploring Britain during the Prehistoric period. Titles in the trilogy include The Stonehenge Enigma, Dawn of the Lost Civilisation, and The Post Glacial Flooding Hypothesis, offering compelling evidence about ancient landscapes shaped by post-glacial flooding.

      To further explore these topics, Robert John Langdon has developed a dedicated YouTube channel featuring over 100 video documentaries and investigations that complement the trilogy. Notable discoveries and studies showcased on the channel include 13 Things that Don’t Make Sense in History and the revelation of Silbury Avenue – The Lost Stone Avenue, a rediscovered prehistoric feature at Avebury, Wiltshire.

      In addition to his main works, Langdon has released a series of shorter, accessible publications, ideal for readers delving into specific topics. These include:

      For active discussions and updates on the trilogy’s findings and recent LiDAR investigations, join our vibrant community on Facebook. Engage with like-minded enthusiasts by leaving a message or contributing to debates in our Facebook Group.

      Whether through the books, the website, or interactive videos, we aim to provide a deeper understanding of Britain’s fascinating prehistoric past. We encourage you to explore these resources and uncover the mysteries of ancient landscapes through the lens of modern archaeology.

      For more information, including chapter extracts and related publications, visit the Robert John Langdon Author Page. Dive into works such as The Stonehenge Enigma or Dawn of the Lost Civilisation, and explore cutting-edge theories that challenge traditional historical narratives.

      Other Blogs

      s

      t