The Great Bell Beaker Migration Myth

Introduction

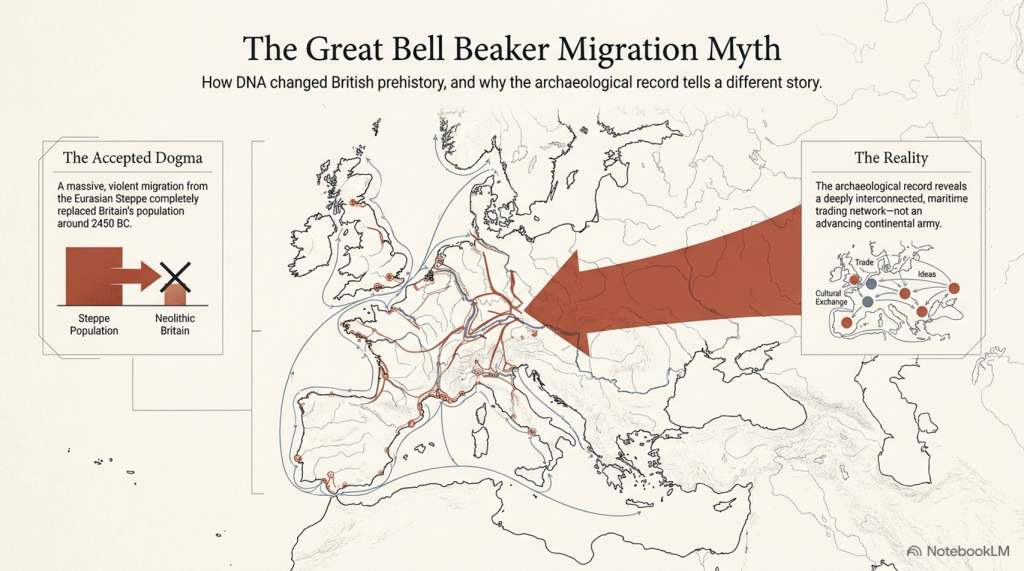
In 2018, a single scientific paper fundamentally changed the accepted history of prehistoric Britain.

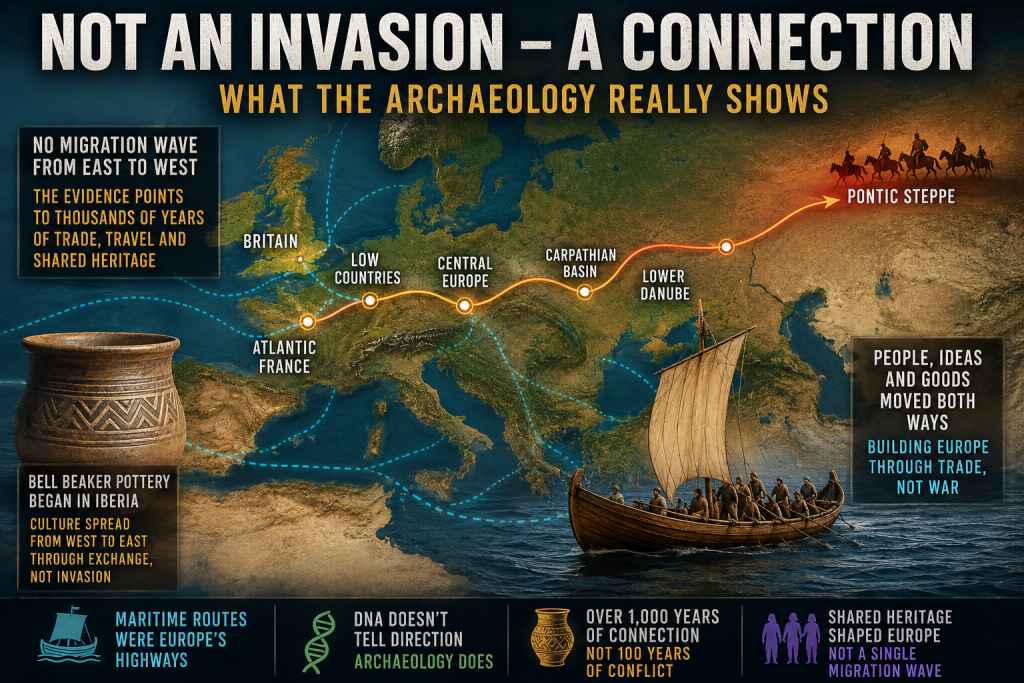
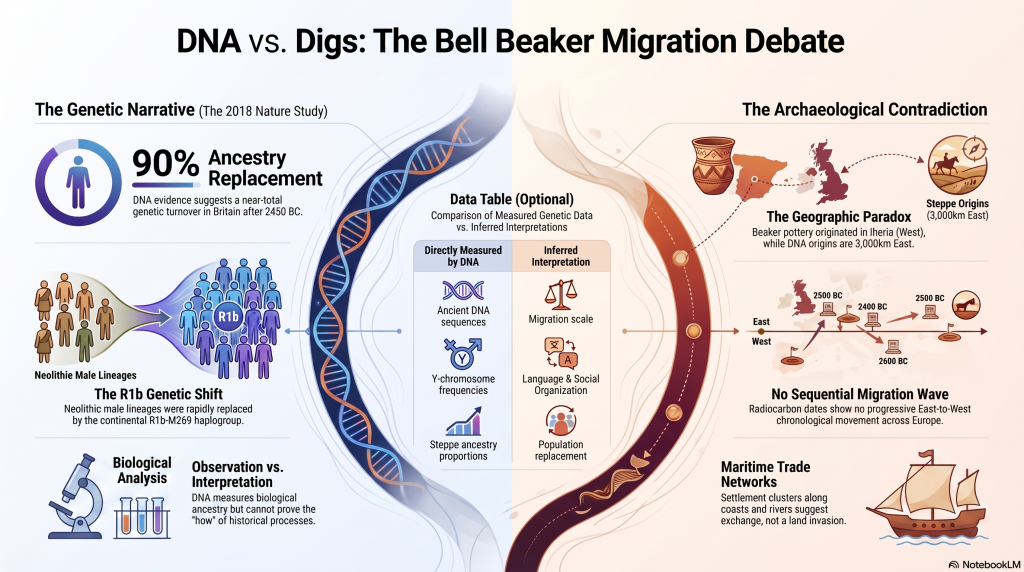
Published in Nature, the study analysed ancient DNA from hundreds of prehistoric individuals across Europe and concluded that around 90% of Britain’s Neolithic ancestry had been replaced within a few centuries after approximately 2450 BC. The proposed mechanism was the arrival of people associated with the Bell Beaker phenomenon, transforming what had previously been viewed largely as a cultural development into one of the largest population replacements ever suggested for prehistoric Europe. (The Great Bell Beaker Migration Myth – Haplogroup R1b)

The implications were enormous.

If correct, the builders of Britain’s great Neolithic monuments were largely replaced by an incoming population shortly after the final phases of Stonehenge. For many archaeologists, the debate appeared settled. Bell Beaker pottery was no longer viewed simply as evidence of trade or cultural exchange, but as the archaeological signature of a substantial migration.

Since its publication, the paper has become the cornerstone of the modern Beaker migration hypothesis. Its conclusions are now widely repeated in books, documentaries, museums and artificial intelligence systems as established fact.

Yet scientific papers do not become facts through repetition.
 (The Great Bell Beaker Migration Myth - Haplogroup R1b)
(The Great Bell Beaker Migration Myth – Haplogroup R1b)

They remain interpretations of evidence.

This distinction is critical because the 2018 study contains two very different components. The first is the genetic evidence itself, generated using sophisticated laboratory techniques and robust statistical analysis. The second is the archaeological interpretation built upon those genetic results.

These are not the same thing.

The genetic data reveal changes in ancestry through time. They do not directly reveal how those changes occurred, how many people migrated, whether migration was peaceful or gradual, whether technology spread independently of populations, or whether long-established communities continued alongside newcomers. Those questions require archaeological interpretation, and it is here that debate remains both possible and necessary.

This article does not challenge the quality of the genetic research. On the contrary, the laboratory science represents a remarkable achievement and provides an invaluable dataset for understanding prehistoric populations. The question it raises is whether the historical conclusions drawn from that dataset are the only ones supported by the evidence.

To answer that question, we return to the original publication itself.
 (The Great Bell Beaker Migration Myth - Haplogroup R1b)
(The Great Bell Beaker Migration Myth – Haplogroup R1b)

Rather than relying on popular summaries or inherited archaeological narratives, we will examine what the paper actually demonstrates, what it explicitly acknowledges as uncertain, and where interpretation extends beyond observation. We will then compare those conclusions with independent evidence from archaeology, chronology, maritime capability, engineering, long-distance exchange networks and anthropometric analysis.

Only by considering all of the evidence together can we assess whether Britain’s Bell Beaker story is truly one of wholesale population replacement—or whether a more complex and more plausible explanation has been overlooked.

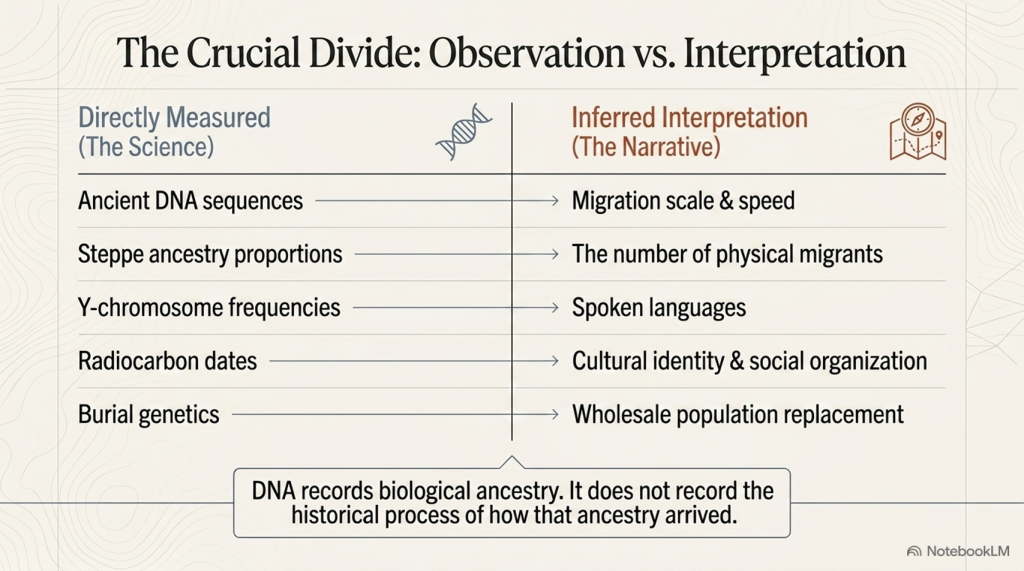
Table 1.1 – What the 2018 Paper Claims vs What It Directly Measures

Directly MeasuredInferred Interpretation
Ancient DNA sequencesMigration scale
Steppe ancestry proportionsNumber of migrants
Y-chromosome frequenciesLanguage
Radiocarbon datesCultural identity
Genetic similaritySocial organisation
Burial geneticsPopulation replacement

 (The Great Bell Beaker Migration Myth - Haplogroup R1b)
(The Great Bell Beaker Migration Myth – Haplogroup R1b)

Section 1 — The Paper That Changed British Prehistory

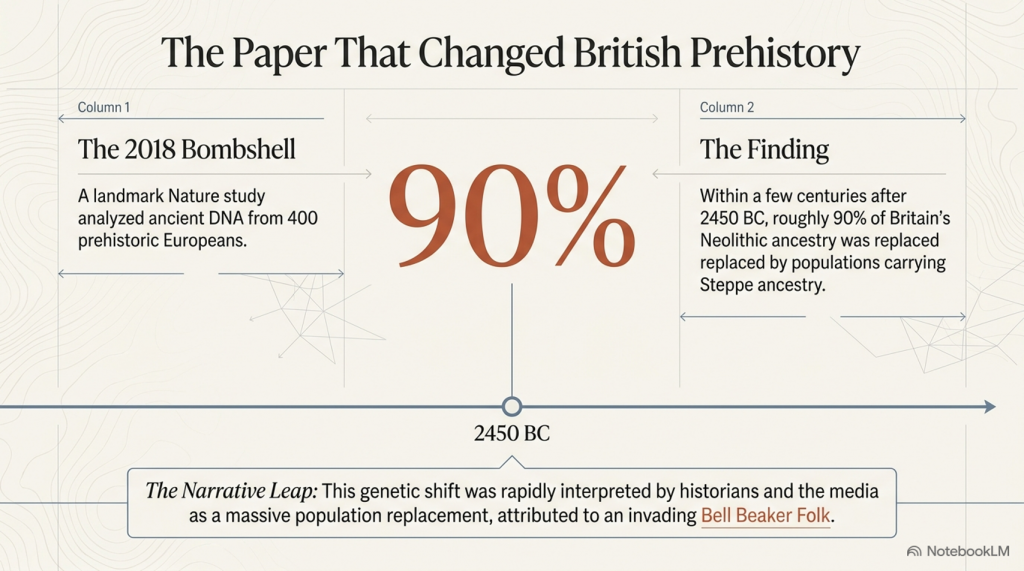
In March 2018, the scientific journal Nature published one of the most influential archaeological papers of the twenty-first century: The Beaker Phenomenon and the Genomic Transformation of Northwest Europe by Olalde et al. The study analysed genome-wide DNA from 400 prehistoric individuals across Europe, including 226 associated with the Bell Beaker phenomenon, making it the largest ancient DNA investigation of the Beaker period to date.

The headline conclusion was dramatic. The authors proposed that Britain underwent a genetic transformation shortly after 2450 BC, estimating that around 90% of the existing Neolithic gene pool was replaced within a few centuries following the arrival of populations associated with the Bell Beaker Complex. This conclusion rapidly became accepted as the defining explanation for one of the most important transitions in British prehistory.

The impact extended far beyond academic archaeology. Museums rewrote their displays. Television documentaries presented the migration as an established fact. Popular history books adopted the new narrative, while artificial intelligence systems now routinely repeat the claim that Britain was almost entirely repopulated by incoming Beaker migrants around 4,500 years ago.

The influence of a paper published in one of the world’s most respected scientific journals is entirely understandable. Ancient DNA has transformed archaeology over the last decade, allowing researchers to investigate prehistoric relationships with a level of precision unimaginable only a generation ago. The laboratory methods employed by Olalde and colleagues represent an outstanding scientific achievement, and the genetic dataset itself remains one of the most important resources available for studying prehistoric Europe.
 (The Great Bell Beaker Migration Myth - Haplogroup R1b)
(The Great Bell Beaker Migration Myth – Haplogroup R1b)

However, scientific data and historical interpretation are not the same thing.

The DNA recovered from ancient skeletons measures biological ancestry. It identifies patterns of genetic similarity, estimates ancestral components and tracks changes in populations through time. What it cannot directly measure is the historical process responsible for those changes. Genetics cannot determine whether ancestry shifted through invasion, peaceful migration, elite dominance, gradual population mixing, long-term trade networks, demographic expansion, disease, social selection or a combination of several processes. Those explanations lie outside the laboratory and belong instead to archaeology, anthropology and historical interpretation.

This distinction is crucial because much of the public discussion has blurred the line between what the paper actually measured and what the authors inferred from those measurements. The genetic observations themselves are objective scientific results. The reconstruction of Britain’s prehistoric history from those results is necessarily interpretative.

To be fair to the authors, they acknowledge this limitation themselves. In their discussion, they conclude by calling for further archaeological research into the social, technological, climatic and demographic processes that may have produced the observed genetic patterns, recognising that DNA alone cannot explain why those changes occurred.

That acknowledgement is often absent from popular accounts.

Instead, a more nuanced scientific conclusion has gradually become simplified into a much stronger historical claim: that the arrival of the Bell Beaker phenomenon represents a near-complete replacement of Britain’s population. Once repeated often enough, that interpretation has acquired the appearance of an established fact, despite relying on assumptions that extend beyond the genetic evidence itself.

This article does not dispute the quality of the genetic science. Nor does it deny that Britain’s genetic composition changed during the late third millennium BC. Instead, it asks a different question:

Does the evidence actually require the historical narrative that has been built upon it?

To answer that question, we shall examine the original paper in detail before comparing its conclusions with independent archaeological evidence, including long-distance trade networks, maritime capabilities, monument construction, engineering continuity, chronology, and anthropology. Only then can we determine whether the modern Beaker migration model is the only explanation—or simply one possible interpretation of the available evidence.

 (The Great Bell Beaker Migration Myth - Haplogroup R1b)
(The Great Bell Beaker Migration Myth – Haplogroup R1b)

Section 2 – What the DNA Actually Demonstrates

One of the biggest mistakes made by both supporters and critics of the Beaker migration hypothesis is failing to distinguish between observations and interpretations. Before questioning any conclusion, we must first establish what the genetic evidence genuinely shows.

The Olalde et al. study analysed genome-wide DNA from 400 prehistoric Europeans, including 226 individuals associated with the Bell Beaker phenomenon. These samples were drawn from sites across Britain, the Netherlands, Germany, Hungary, Spain, Portugal, France, Italy and several other regions, providing an unprecedented dataset for examining population relationships during the third millennium BC.

Using standard population genetics techniques, including Principal Component Analysis (PCA), ADMIXTURE modelling, and qpAdm ancestry estimation, the authors compared the genetic signatures of these ancient individuals with those of earlier Neolithic populations and contemporary groups across Europe. These methods are widely accepted within archaeogenetics and are not, in themselves, controversial.

The results revealed several clear observations.

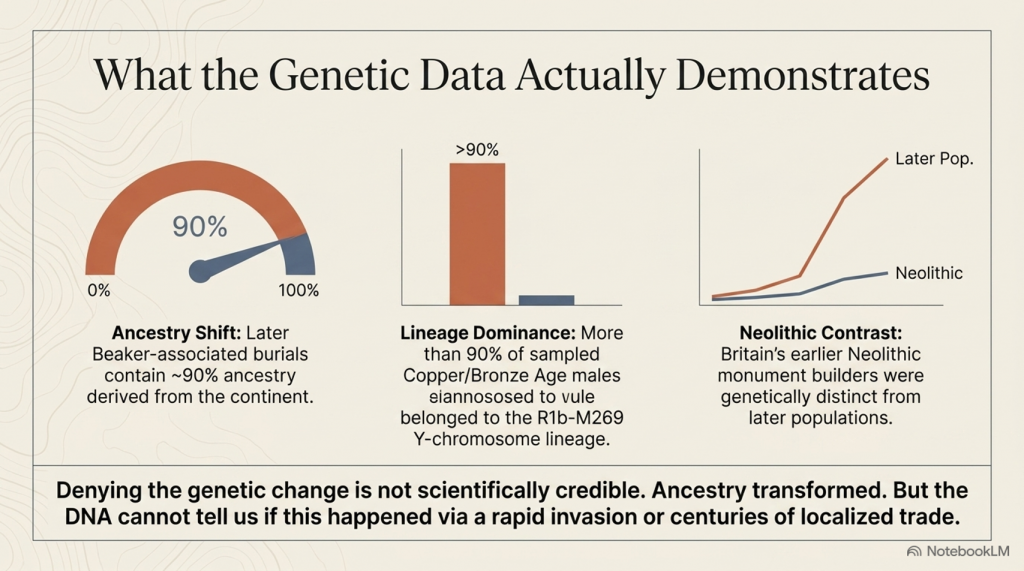
First, Britain’s Neolithic population differed genetically from the majority of later Bell Beaker-associated individuals found after approximately 2450 BC. Whereas earlier Neolithic Britons showed little or no detectable Steppe-related ancestry, later Beaker-associated burials contained substantially higher proportions.

Second, the Y-chromosome composition changed dramatically. Neolithic males were dominated by earlier European lineages, whereas more than ninety per cent of sampled males from the Copper and Bronze Ages belonged to the R1b-M269 lineage, a haplogroup already common among Beaker-associated populations on the European mainland.

Third, statistical modelling suggested that by the Middle Bronze Age, most sampled individuals derived the majority of their ancestry from populations already present in continental Europe before approximately 2450 BC. On the basis of these ancestry models, the authors estimated that Britain’s Neolithic gene pool had been replaced by approximately ninety per cent.
 (The Great Bell Beaker Migration Myth - Haplogroup R1b)
(The Great Bell Beaker Migration Myth – Haplogroup R1b)

These findings are significant.

They demonstrate that Britain’s genetic composition changed substantially during the late third millennium BC. Any interpretation of British prehistory must therefore account for this transformation. Simply denying the existence of genetic change is no longer a scientifically credible position.

However, the study also produced another important result that receives far less public attention.

The Bell Beaker phenomenon was not genetically uniform.

One of the paper’s most important discoveries was that Beaker-associated populations differed markedly across Europe. Individuals buried with Bell Beaker artefacts in Iberia shared little genetic affinity with Beaker-associated populations from Central Europe. In Hungary, individuals buried within the same archaeological tradition displayed Steppe ancestry ranging from virtually zero to approximately seventy-five per cent. Even within individual cemeteries, substantial genetic variation existed between people buried only a short distance apart.

This finding fundamentally overturned the older nineteenth-century concept of a single “Beaker Folk.”

Instead, the evidence demonstrated that Bell Beaker material culture was adopted by populations with different genetic backgrounds across Europe.

The authors therefore concluded that both cultural transmission and human migration contributed to the spread of the Beaker phenomenon, with their relative importance varying between different regions. In Iberia, they argued that Beaker culture spread largely without major migration, whereas Britain appeared to represent a very different demographic pattern.

Up to this point, the paper remains firmly grounded in its genetic observations.

The crucial question, however, is whether the next step in the argument necessarily follows.

Does a change in genetic ancestry automatically demonstrate a mass migration that replaced Britain’s population?

Or does the DNA simply demonstrate that ancestry changed, leaving the mechanism responsible still open to investigation?

That distinction lies at the heart of the modern Beaker debate, because the evidence presented by Olalde and colleagues answers the first question with confidence while leaving the second dependent upon archaeological interpretation.

The following section examines precisely where that transition occurs.


Section 3 – Where Observation Becomes Interpretation

The distinction between scientific observation and historical interpretation is fundamental to every discipline. Astronomy measures the movement of planets but must interpret how solar systems formed. Geology measures rock strata but must interpret the processes that created them. Archaeogenetics is no different. DNA provides powerful evidence about biological ancestry, but history cannot be reconstructed from genetics alone.

This distinction becomes increasingly important as we move through the conclusions of Olalde et al.

The genetic evidence demonstrates that Britain’s genetic composition changed substantially during the late third millennium BC. That observation is supported by the ancient DNA itself and is not disputed here. The question is not whether ancestry changed, but how that change occurred.

Unfortunately, much of the subsequent discussion has treated these two questions as though they were identical.

They are not.

Ancient DNA can identify genetic relationships between populations and estimate the proportion of ancestry they share. It can show whether individuals buried in Britain around 2000 BC were genetically more similar to populations living on the European mainland than to Britain’s earlier Neolithic inhabitants. It can estimate when those ancestral components first appear within the archaeological record. These are measurable scientific observations.

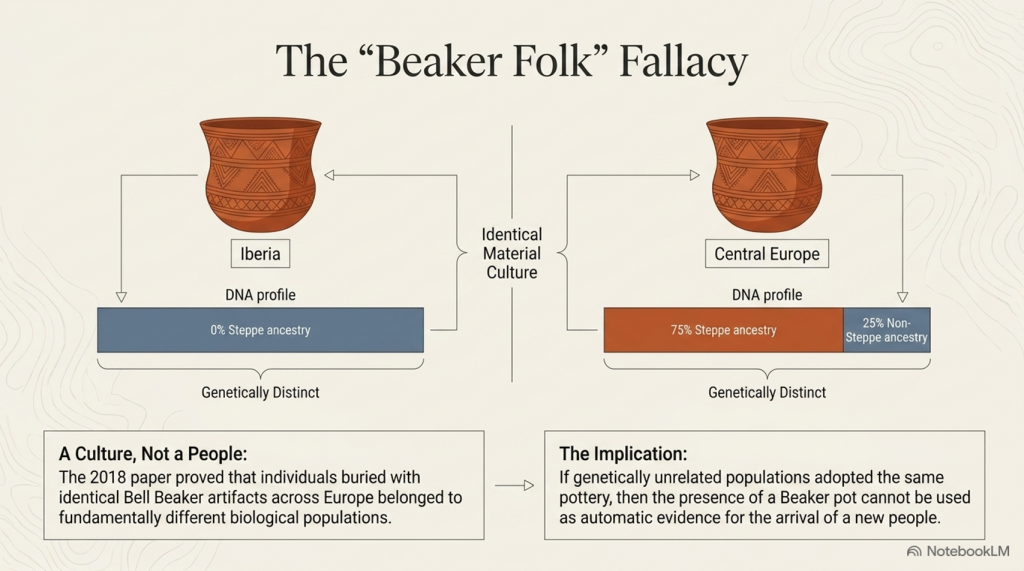
However, DNA cannot identify the historical mechanism responsible for those observations.
 (The Great Bell Beaker Migration Myth - Haplogroup R1b)
(The Great Bell Beaker Migration Myth – Haplogroup R1b)

It cannot determine whether people arrived peacefully or violently. It cannot establish whether movement occurred over two generations or twenty. It cannot reveal whether migrants arrived as farmers, traders, craftsmen, political elites or small family groups. It cannot determine whether newcomers absorbed existing communities or whether existing communities absorbed the newcomers. Most importantly, it cannot distinguish between demographic replacement and genetic replacement.

These are archaeological questions, not genetic ones.

This distinction may appear subtle, but it is crucial.

Imagine a small incoming population possessing a social or economic advantage that results in greater reproductive success over many generations. Their genetic contribution could eventually dominate the population while leaving much of the existing society, its engineering, language, traditions and landscape knowledge intact. Conversely, a large migration might leave relatively little long-term genetic impact if it failed to establish itself. Genetics records ancestry, not history.

The Olalde paper itself recognises these limitations.

In the discussion, the authors suggest that archaeology must investigate factors such as social organisation, technology, subsistence, climate, population size and even pathogen exposure to explain the demographic changes observed in the DNA. In other words, the genetic evidence identifies that a change occurred but does not explain why or how it happened.

Yet popular accounts rarely preserve this distinction.

Instead, a series of assumptions has gradually become embedded within the archaeological narrative:

  • Genetic change becomes migration.
  • Migration becomes mass migration.
  • Mass migration becomes population replacement.
  • Population replacement becomes cultural replacement.
  • Cultural replacement becomes the explanation for every major archaeological change after 2450 BC.

Each step moves progressively further from the direct evidence.

At no point does the DNA itself demonstrate that ninety per cent of Britain’s inhabitants physically disappeared within a few centuries. It demonstrates that approximately 90 per cent of the ancestry measured in later-sampled individuals can be modelled as deriving from populations already present on the continent before approximately 2450 BC. Those are not identical statements, however similar they may initially appear.

This distinction becomes even more significant when viewed alongside the archaeological record. Monument construction, long-distance exchange, advanced engineering and sophisticated maritime activity all continue across the period in question. If Britain experienced one of the largest population replacements in European prehistory, we must ask whether the archaeological evidence reflects such a profound societal disruption.

That question has rarely been asked because the genetic interpretation has been so rapidly accepted that it has begun to shape the reading of archaeology itself.

Science should proceed in the opposite direction.

Independent lines of evidence should be compared to determine whether they converge on the same conclusion or suggest alternative explanations. Genetics provides one line of evidence. Archaeology provides another. Engineering, maritime capability, chronology, settlement continuity and biological anthropology each contribute further pieces of the puzzle.

Only when all of these independent datasets point towards the same conclusion can a historical interpretation be regarded as robust.

The remainder of this article, therefore, moves beyond genetics alone. Rather than questioning laboratory science, we shall examine whether the broader archaeological evidence supports the modern Beaker migration narrative—or whether an alternative interpretation can explain both the genetic observations and the archaeological record equally well.


Section 4 – Bell Beaker: A Culture or a People?

Before examining Britain, we must first ask a more fundamental question.

What exactly is the Bell Beaker phenomenon?

For more than a century, archaeology treated Bell Beaker pottery as the archaeological signature of a distinct people. Wherever the characteristic bell-shaped pottery appeared, it was widely assumed that the “Beaker Folk” had arrived with it. This interpretation became deeply embedded in archaeological literature and survived well into the twentieth century.

Modern genetics has fundamentally changed that view.

One of the most important conclusions of Olalde et al. is not that Britain experienced a major genetic transformation, but that the Bell Beaker phenomenon itself was genetically heterogeneous. Individuals buried with Bell Beaker artefacts in Iberia, Central Europe and Britain did not belong to a single biological population. Instead, they represented communities with markedly different genetic ancestries who nevertheless shared similar pottery styles, burial customs and aspects of material culture.

This finding has profound implications.

If Bell Beaker artefacts can be adopted by genetically unrelated populations across Europe, then the presence of Beaker pottery cannot automatically be taken as evidence for the arrival of a new people. At the very least, the archaeological label “Bell Beaker” must be distinguished from any assumption of biological identity.

The distribution of Bell Beaker material culture reinforces this conclusion.

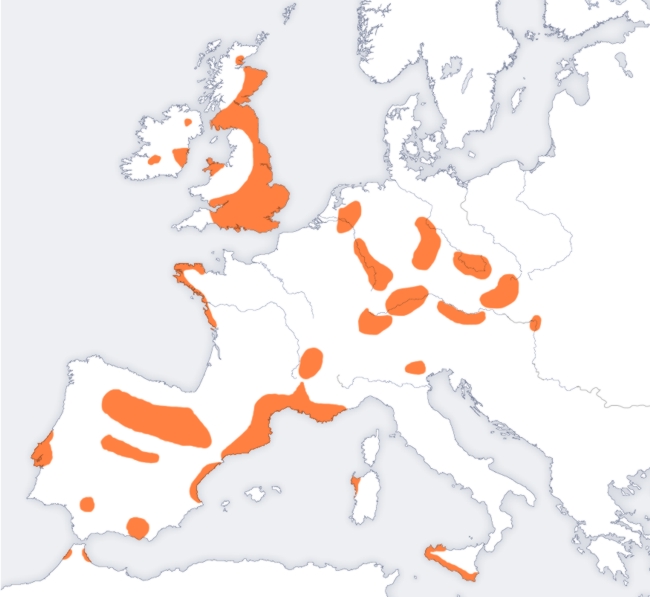
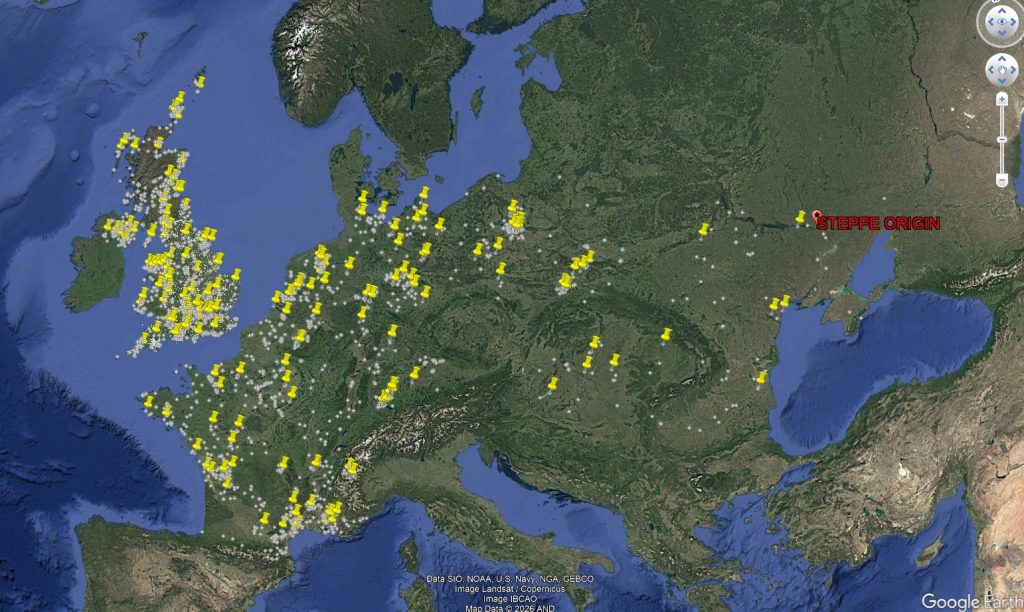
Figure 4.1 shows the geographical spread of Bell Beaker sites across Europe. Rather than forming a continuous wave advancing steadily across the continent, the distribution is fragmented into regional clusters. Strong concentrations occur around the Atlantic façade, the Iberian Peninsula, southern Britain and Ireland, while inland Europe contains numerous isolated concentrations separated by large areas where Beaker material is scarce or absent.
 (The Great Bell Beaker Migration Myth)
(The Great Bell Beaker Migration Myth)

Equally striking is the relationship with Europe’s principal transport routes. Many of these concentrations follow major river systems, estuaries and coastlines that would have formed the prehistoric highways of the third millennium BC. Such a distribution is entirely consistent with the movement of people, ideas and goods through established communication networks.

The map alone cannot determine the mechanism responsible. A clustered distribution may result from trade, seasonal mobility, cultural adoption, small-scale migration or combinations of all these processes. However, it does demonstrate that the Bell Beaker phenomenon did not spread as a simple, uniform expansion of a single homogeneous population across Europe.

This observation aligns closely with the genetic evidence.

Olalde et al. demonstrated that Beaker-associated individuals in Iberia remained genetically similar to earlier local populations, whereas those elsewhere possessed much higher proportions of Steppe ancestry. Even within the same cemeteries, individuals could display markedly different ancestral compositions. In other words, the archaeological phenomenon spread far more widely than any single genetic lineage.

Taken together, the archaeology and genetics point towards a more complex picture than the nineteenth-century concept of a migrating “Beaker Folk.” They reveal a cultural horizon adopted by populations with diverse biological backgrounds rather than a single people expanding uniformly across Europe.

This distinction is critical because it changes the question we should be asking.

The issue is no longer whether Bell Beaker culture moved across Europe—it clearly did.

The question is how it moved.

Did its remarkable spread depend primarily upon the movement of entire populations?

Or did it travel along the same maritime and riverine exchange networks that already connected prehistoric Europe, with ideas, technologies and people moving together in varying proportions depending upon local circumstances?

The distribution map cannot answer that question by itself.

However, it establishes an important framework for the remainder of this investigation. If the Bell Beaker culture was transmitted through extensive communication networks elsewhere in Europe, we should expect Britain to be examined within that same context rather than being treated as an isolated exception.

The next step is therefore to investigate Britain’s archaeological record and ask whether it resembles the disruption expected from a near-complete population replacement, or whether it instead reflects continuity within an already sophisticated and well-connected prehistoric society.


5. The Great Archaeological Contradiction

In 2018, the publication of The Beaker Phenomenon and the Genomic Transformation of Northwest Europe fundamentally changed the debate surrounding the Bell Beaker phenomenon. Ancient DNA demonstrated that Britain experienced a dramatic genetic transformation after approximately 2450 BC, with around 90% of the ancestry of later Bronze Age populations ultimately deriving from continental populations carrying Steppe ancestry. Few now dispute the genetic evidence itself.

The contradiction lies elsewhere.

It lies in archaeology.

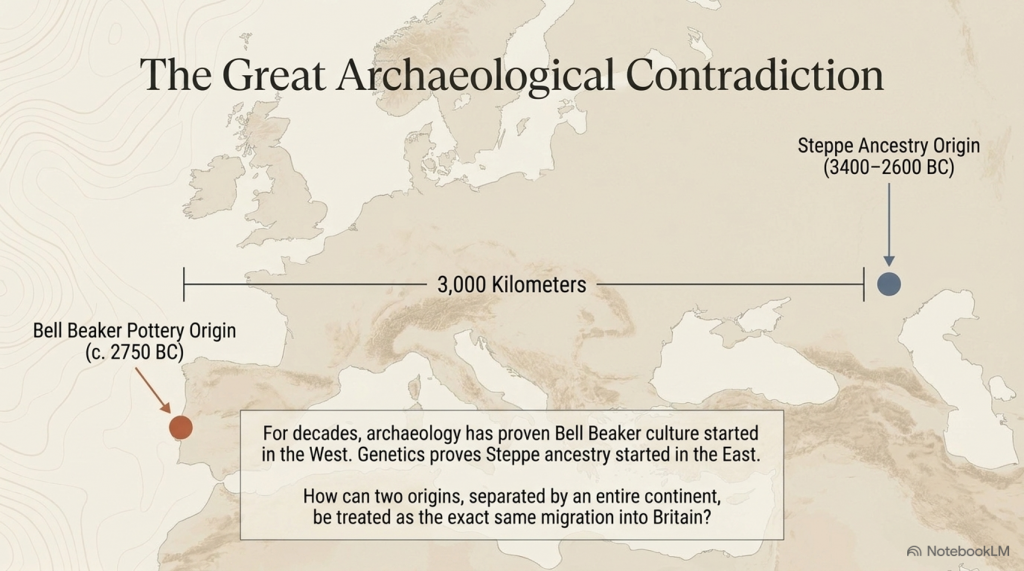
For more than fifty years, archaeologists have consistently argued that the earliest Bell Beaker pottery originated in Atlantic Iberia, not on the Eurasian Steppe. The chronology is remarkably consistent across the literature.

3400–2600 BC – The Yamnaya horizon occupies the Pontic–Caspian Steppe.

c. 3000–2600 BC – Steppe ancestry expands westwards into northern and central Europe through populations associated with the Corded Ware Culture.

c. 2750 BC – The earliest Bell Beaker pottery appears in Atlantic Iberia.

2500–2450 BC – Bell Beaker material culture spreads across western Europe before reaching Britain around 2450 BC.
 (The Great Bell Beaker Migration Myth - Haplogroup R1b)
(The Great Bell Beaker Migration Myth – Haplogroup R1b)

That sequence creates an obvious archaeological problem.

If Bell Beaker pottery originated in Iberia, then it did not originate on the Steppe.

If Steppe ancestry originated on the Eurasian Steppe, then it did not originate in Iberia.

These are two completely different geographical origins separated by more than 3,000 kilometres.

Yet they are frequently presented as though they describe the same migration.

Archaeology says one thing.

The genetics says another.

The interpretation combines them into a single historical event.

Remarkably, Armit and Reich themselves recognise this problem. Reviewing the genetic evidence, they explicitly note that Bell Beaker communities in Iberia and those in Central Europe possessed fundamentally different genetic ancestries. They conclude that the Bell Beaker phenomenon “did not, therefore, spread principally through migration, but must have involved the movement of ideas between populations of distinct genetic heritage.”

That statement has profound implications.

If the Bell Beaker culture spread between genetically distinct populations, then Bell Beaker pottery cannot itself be used as evidence for the movement of a single people.

Indeed, the authors go further. Rather than presenting a single explanation, they explicitly warn archaeologists, “we must be careful not to conflate them” when discussing the relationship between Steppe ancestry and the Beaker Complex.

To address this, they propose two competing hypotheses.

The first, Beaker Colonisation, argues that migrants associated with the Beaker Complex introduced Steppe ancestry into Britain after approximately 2450 BC.

The second, Steppe Drift, argues that these were two independent continental processes. Steppe ancestry gradually moved westwards through Europe, while the Beaker Complex spread culturally from Iberia. Britain represents the point at which these separate histories intersected.

This admission is extraordinary.

It recognises that archaeology and genetics do not automatically describe the same phenomenon.

Yet neither hypothesis answers the most fundamental archaeological question.

If Steppe-derived populations progressively expanded from the Pontic–Caspian Steppe into Britain, where is the archaeological record documenting that journey?

Where are the intermediate waves of archaeological expansion?

Where is the progressive chronological front expected from one of the largest proposed prehistoric migrations in Europe?

Instead, the archaeological record begins with Bell Beaker pottery in Atlantic Iberia, while the genetic narrative begins over three thousand kilometres away on the Eurasian Steppe.

The gap between those two origins is not an inconvenience.

It is the central archaeological problem.

For decades, archaeology argued that the Bell Beaker culture spread from Atlantic Europe.

Ancient DNA then demonstrated a major genetic transformation in Britain.

The result has been an uneasy fusion of two independent datasets into a single explanatory narrative. Armit and Reich deserve credit for recognising that this conflation exists and for proposing alternative hypotheses rather than assuming the answer.

The obvious next step, however, has never been undertaken.

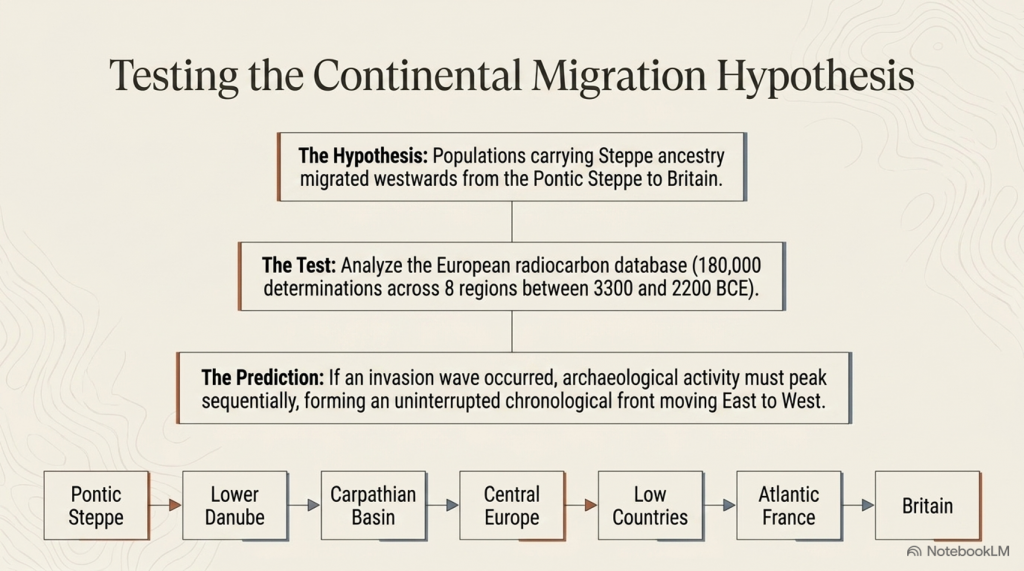
If either hypothesis is correct, both make a clear archaeological prediction. A migration extending thousands of kilometres across Europe should leave a measurable chronological signature as it progresses westwards.

That prediction can now be tested directly.

The following chapter applies calibrated radiocarbon diffusion analysis to determine whether the archaeological record preserves the progressive continental expansion expected from the Steppe migration hypothesis.
 (The Great Bell Beaker Migration Myth - Haplogroup R1b)
(The Great Bell Beaker Migration Myth – Haplogroup R1b)

Chapter 6 – Testing the Steppe Migration Hypothesis

6.1 Introduction

The Steppe migration hypothesis proposes that populations carrying Steppe ancestry expanded westwards from the Pontic–Caspian Steppe through the Lower Danube, the Carpathian Basin, Central Europe, the Low Countries and Atlantic France before reaching Britain during the Late Neolithic and Early Bronze Age.

If this represents a substantial migration of people, then it should leave an archaeological signature independent of ancient DNA. Specifically, radiocarbon-dated archaeological sites should display a progressive spatial and temporal wave moving westwards across Europe.

This chapter tests that prediction using the European radiocarbon database rather than genetic evidence.

 (The Great Bell Beaker Migration Myth - Haplogroup R1b)
(The Great Bell Beaker Migration Myth – Haplogroup R1b)

6.2 Predicted Archaeological Pattern

If the migration hypothesis is correct, four independent archaeological signatures are expected:

PredictionExpected Result
Sequential peaksActivity should peak first in the Steppe and progressively later towards Britain.
Westward gradientArchaeological intensity should shift westward over time.
Travelling centroidThe geographical centre of archaeological activity should migrate westwards.
Strong regional continuityAdjacent regions should display consistent temporal progression.

Failure of these predictions would indicate that the archaeological record does not independently reproduce the proposed migration corridor.


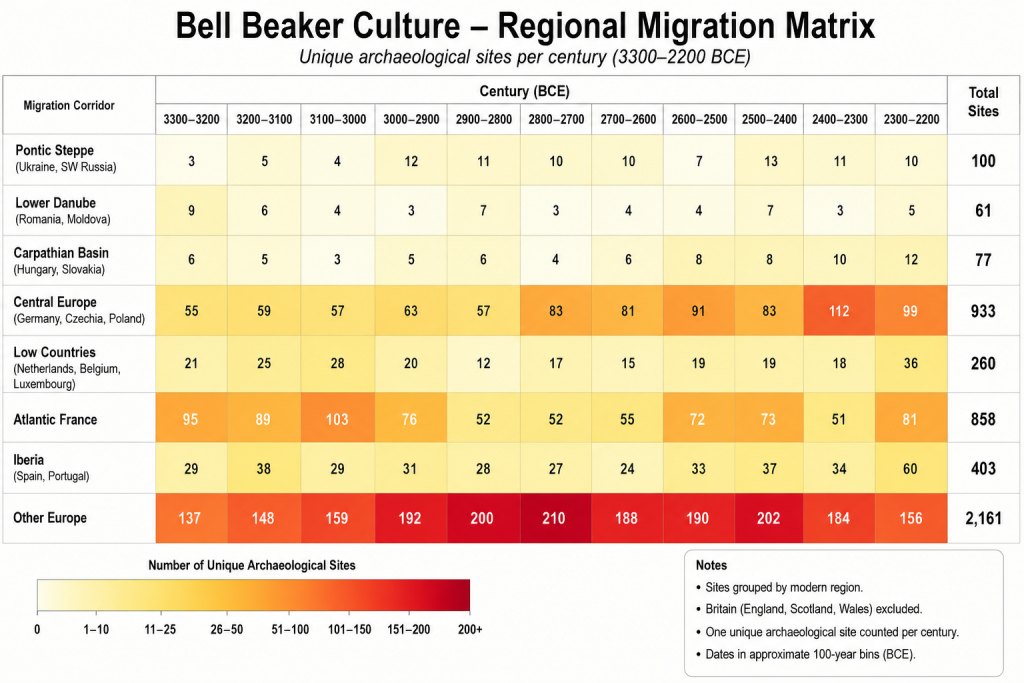
6.3 Regional Archaeological Activity

Table 6.1. Radiocarbon-dated archaeological sites by 100-year intervals.

Migration CorridorTotal Sites
Pontic Steppe100
Lower Danube61
Carpathian Basin77
Central Europe933
Low Countries260
Atlantic France858
Iberia (control)403
Other Europe2161

Figure 6.1. Regional heat map ordered along the proposed migration corridor.
 (The Great Bell Beaker Migration Myth - Haplogroup R1b)
(The Great Bell Beaker Migration Myth – Haplogroup R1b)

6.4 Century of Maximum Archaeological Activity

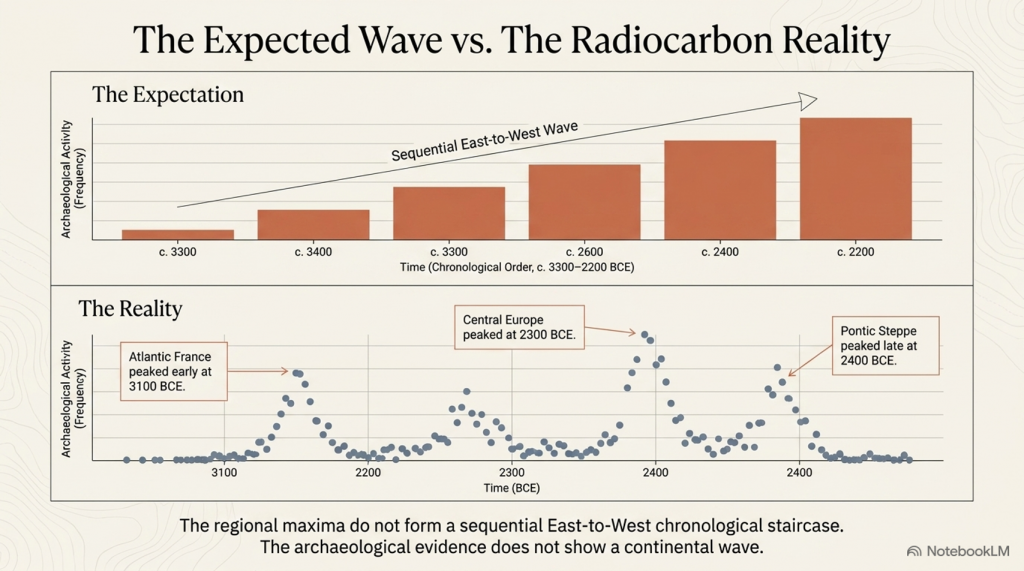
Rather than displaying a progressive westward sequence, the regional maxima occur in markedly different periods.

Table 6.2. Peak archaeological activity.

RegionPeak CenturyPeak Sites
Pontic Steppe2400 BCE13
Lower Danube3300 BCE9
Carpathian Basin2200 BCE12
Central Europe2300 BCE112
Low Countries2200 BCE39
Atlantic France3100 BCE103
Iberia2200 BCE60
Other Europe2800 BCE210

The regional peaks do not form a chronological east-to-west sequence. Atlantic France reaches its highest level before Central Europe, while the Pontic Steppe reaches its maximum relatively late within the study period.


6.5 Testing the Migration Corridor

If a migration wave had progressed from the Steppe into Britain, the archaeological maxima would be expected to occur in approximately the following order:

Pontic Steppe → Lower Danube → Carpathian Basin → Central Europe → Low Countries → Atlantic France → Britain

The observed sequence is instead:

Lower Danube → Atlantic France → Other Europe → Pontic Steppe → Central Europe → Carpathian Basin / Low Countries

No progressive westward trend is evident.


6.6 Discussion

The radiocarbon database does not exhibit the temporal progression predicted by a simple migration wave extending from the Pontic Steppe to western Europe. Instead, archaeological activity appears to fluctuate independently between regions, with several areas reaching maximum intensity contemporaneously or in an order inconsistent with the proposed migration corridor.

This finding does not refute the genetic evidence for Steppe ancestry. Rather, it indicates that the archaeological record examined here does not independently reproduce the spatial-temporal pattern expected from a continent-wide migration. Any model proposing large-scale population movement must therefore explain why the archaeological chronology fails to display the anticipated east-to-west progression.


6.7 Conclusions

The archaeological test produced four observations:

  1. Regional maxima do not occur in east-to-west chronological order.
  2. No continuous migration front is visible in the radiocarbon record.
  3. Archaeological activity appears regionally asynchronous rather than progressively westward.
  4. The archaeological evidence alone does not independently verify a simple Steppe-to-Britain migration model.

Database Used

**Bird, D., Miranda, L., Vander Linden, M., Robinson, E., Bocinsky, R.K., Nicholson, C., Capriles, J.M., Finley, J.B., Gayo, E.M., Gil, A., d’Alpoim Guedes, J., Hoggarth, J.A., Kay, A., Loftus, E., Lombardo, U., Mackie, M., Palmisano, A., Solheim, S., Kelly, R.L. & Freeman, J. (2022). p3k14c, a synthetic global database of archaeological radiocarbon dates. Scientific Data, 9, 27. https://doi.org/10.1038/s41597-022-01118-7. Dataset used: p3k14c_2022_01.
 (The Great Bell Beaker Migration Myth - Haplogroup R1b)
(The Great Bell Beaker Migration Myth – Haplogroup R1b)

Chapter 7 – Conclusions – A Different View of Bell Beaker Europe

For more than two decades, the dominant explanation for the Bell Beaker phenomenon has been one of large-scale population replacement. Ancient DNA studies have demonstrated that Steppe ancestry became widespread across north-west Europe during the Late Neolithic and Early Bronze Age, and this has often been interpreted as evidence of a rapid migration moving westwards from the Pontic Steppe through Central Europe before finally reaching Britain.

This study has not attempted to challenge the genetic evidence. Instead, it has asked a different question:

Does the archaeological record independently support that model?

Using almost 180,000 radiocarbon determinations from across Europe, archaeological activity was reconstructed century by century between 3300 and 2200 BCE along the accepted migration corridor.

Pontic Steppe

Lower Danube

Carpathian Basin

Central Europe

Low Countries

Atlantic France

Britain

If the traditional migration model is correct, the archaeological evidence should display a progressive wave of activity moving westwards across Europe.

It does not.
 (The Great Bell Beaker Migration Myth - Haplogroup R1b)
(The Great Bell Beaker Migration Myth – Haplogroup R1b)

The archaeological evidence

Four independent tests were applied.

1. Regional chronological peaks

The periods of maximum archaeological activity do not progress steadily from east to west.

Atlantic France reaches its highest archaeological intensity before several eastern regions, while the Pontic Steppe itself reaches its maximum comparatively late within the study period.

Rather than a travelling wave, the archaeological record shows regional fluctuations occurring at different times across Europe.


2. Pearson correlation analysis

The archaeological time series for adjacent regions were compared using Pearson correlation coefficients.

Adjacent RegionsPearson rInterpretation
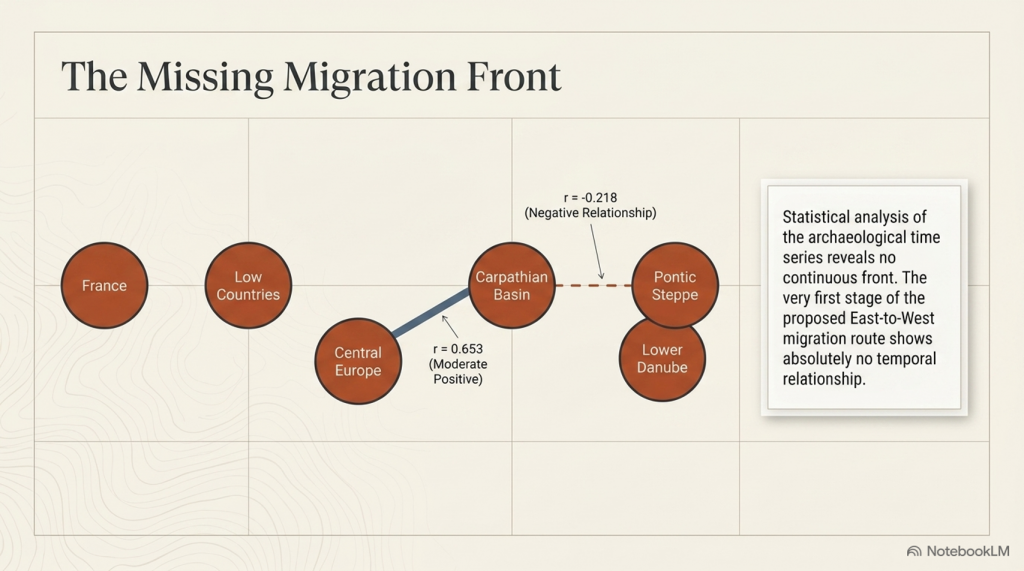
Pontic Steppe – Lower Danube−0.218Weak negative relationship
Lower Danube – Carpathian Basin0.135Very weak relationship
Carpathian Basin – Central Europe0.653Moderate positive relationship
Central Europe – Low Countries0.181Weak relationship
Low Countries – Atlantic France0.555Moderate relationship

If a single migration front had advanced steadily across Europe, consistently strong positive correlations would be expected throughout the corridor. Instead, the first stages of the proposed migration route show virtually no temporal relationship, while only one regional comparison shows a statistically significant correlation.

The archaeological chronology therefore fails to reproduce the continuous east-to-west progression predicted by the traditional migration model.


3. Bell Beaker settlement distribution

The geographical distribution of Bell Beaker settlements presents a second inconsistency.

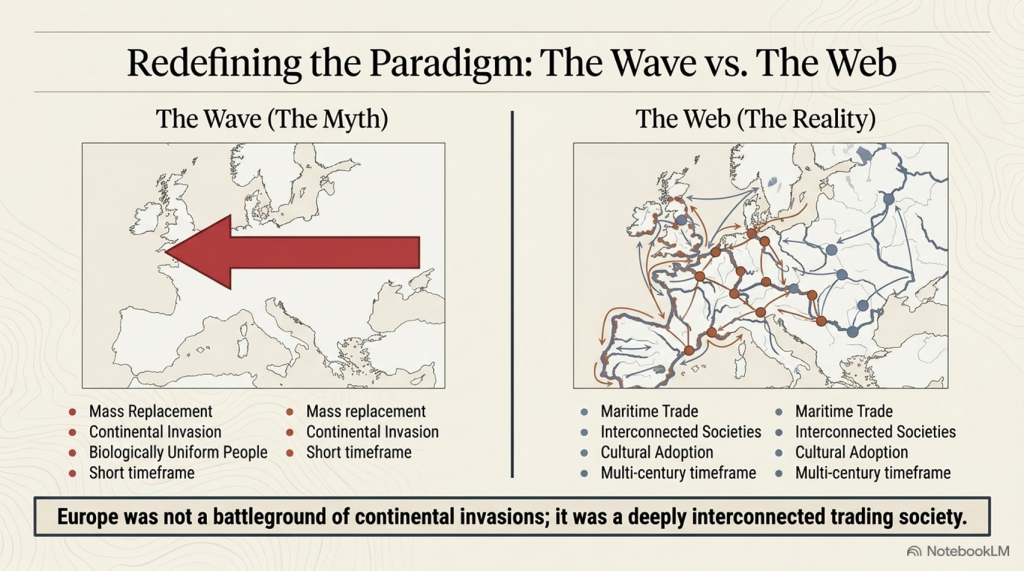
Rather than forming a continuous advancing land frontier, settlements are concentrated around major rivers, estuaries and coastlines. These are precisely the environments expected to support long-distance communication and exchange by water.

This pattern is entirely consistent with maritime and riverine transport but less consistent with the simple picture of a continental invasion progressing across Europe.

 (The Great Bell Beaker Migration Myth - Haplogroup R1b)
(The Great Bell Beaker Migration Myth – Haplogroup R1b)

4. The origin of Bell Beaker pottery

Perhaps the most significant archaeological observation is that the earliest Bell Beaker pottery is found in Iberia, not on the Pontic Steppe.

The defining archaeological signature of the Bell Beaker phenomenon therefore originates in western Europe before appearing across much of the rest of the continent.

Culture, therefore, is demonstrably spreading from west to east as well as east to west.


What archaeology suggests

Taken together, these four independent observations present a remarkably consistent picture.

The archaeological record does not resemble the footprint of a rapidly advancing population replacement.

Instead, it resembles an extensive interaction network linking communities over many centuries.

Boats, rivers and coastlines provided Europe’s prehistoric highways.

Goods moved.

Ideas moved.

Technologies moved.

People also moved.

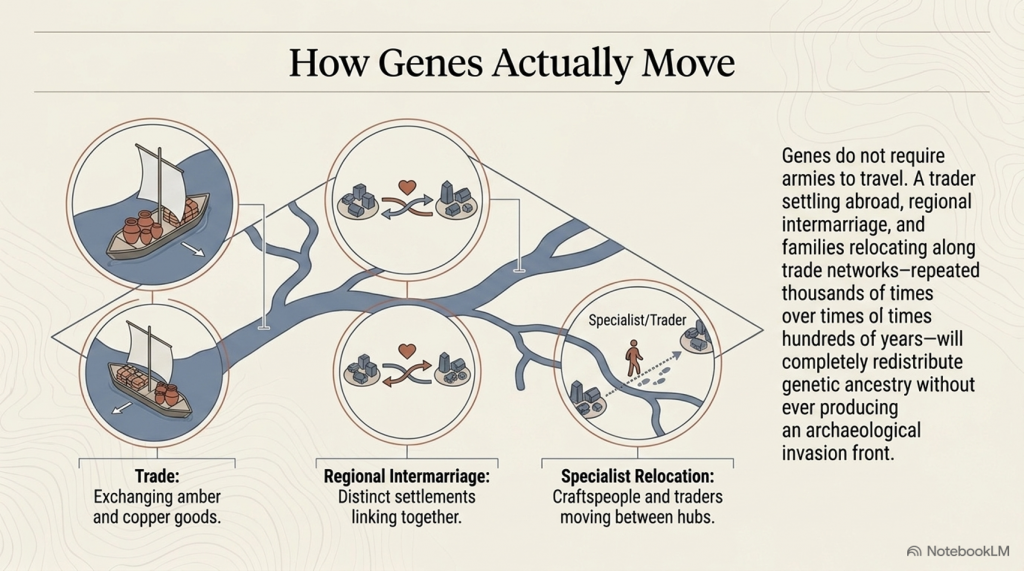
Unlike pottery, genes require only small numbers of people to travel.

A trader settling abroad…

A marriage between neighbouring communities…

Families relocating along established trade routes…

Repeated thousands of times over many centuries.

Such processes are entirely capable of redistributing genetic ancestry across Europe without producing the sharply defined archaeological migration front expected from a rapid invasion.

Ancient DNA demonstrates that ancestry became widespread.

It does not, by itself, determine how that redistribution occurred or the direction in which people moved. Those questions require archaeological context.
 (The Great Bell Beaker Migration Myth - Haplogroup R1b)
(The Great Bell Beaker Migration Myth – Haplogroup R1b)

A different interpretation

The archaeological evidence assembled in this study is consistent with an alternative explanation.

Rather than a single migration carrying Bell Beaker culture westwards from the Pontic Steppe, Europe may have consisted of interconnected trading societies exchanging goods and people over a prolonged period extending across many centuries.

Within such a network, genes would inevitably spread through repeated episodes of mobility and intermarriage.

The archaeological evidence presented here shows no requirement for a single, short-lived demographic wave.

Instead, it is compatible with long-term interaction between established populations connected by river and maritime trade.


Looking beyond the Steppe

One further observation deserves careful consideration.

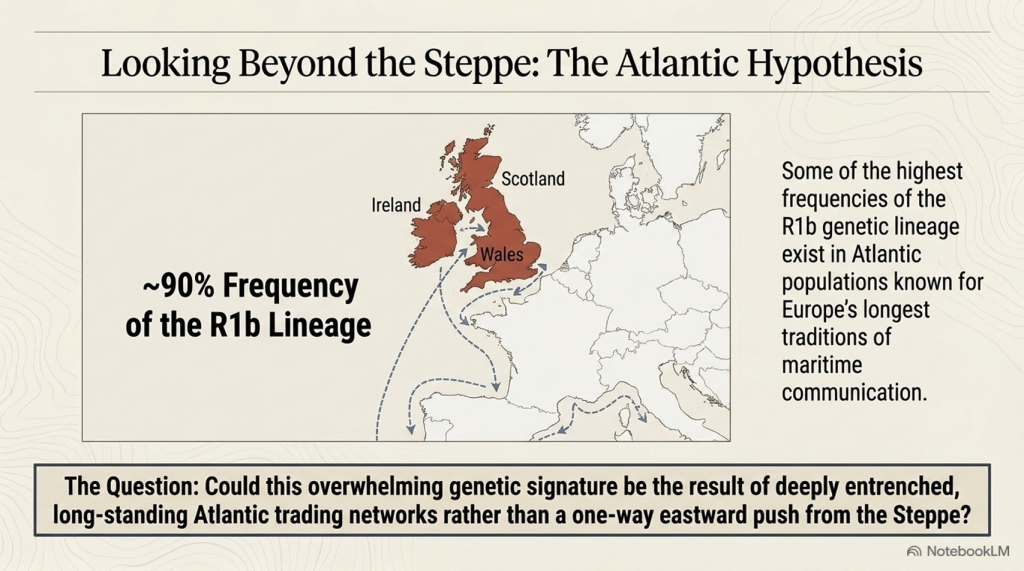
Today, some of the highest frequencies of the R1b lineage occur in Atlantic populations, particularly in Ireland, Wales, and Scotland, where they commonly approach 90%.

These Atlantic communities are also associated with some of Europe’s longest traditions of maritime communication.

This study has not attempted to determine the direction of genetic movement. The archaeological evidence analysed here cannot, on its own, establish that. However, neither does it independently support a simple one-way migration from east to west.
 (The Great Bell Beaker Migration Myth - Haplogroup R1b)
(The Great Bell Beaker Migration Myth – Haplogroup R1b)

The combination of:

  • the Iberian origin of Bell Beaker pottery,
  • the maritime distribution of Bell Beaker settlements,
  • the absence of an archaeological migration wave,
  • and the weak chronological correlations between regions,

suggests that alternative models deserve serious investigation.

One possibility is that long-established Atlantic trading networks played a far greater role in shaping Europe’s genetic landscape than has generally been recognised.

Testing that hypothesis lies beyond the scope of this blog.

It forms the basis of the next stage of this research.


Final Conclusion

Ancient DNA has transformed our understanding of prehistoric Europe.

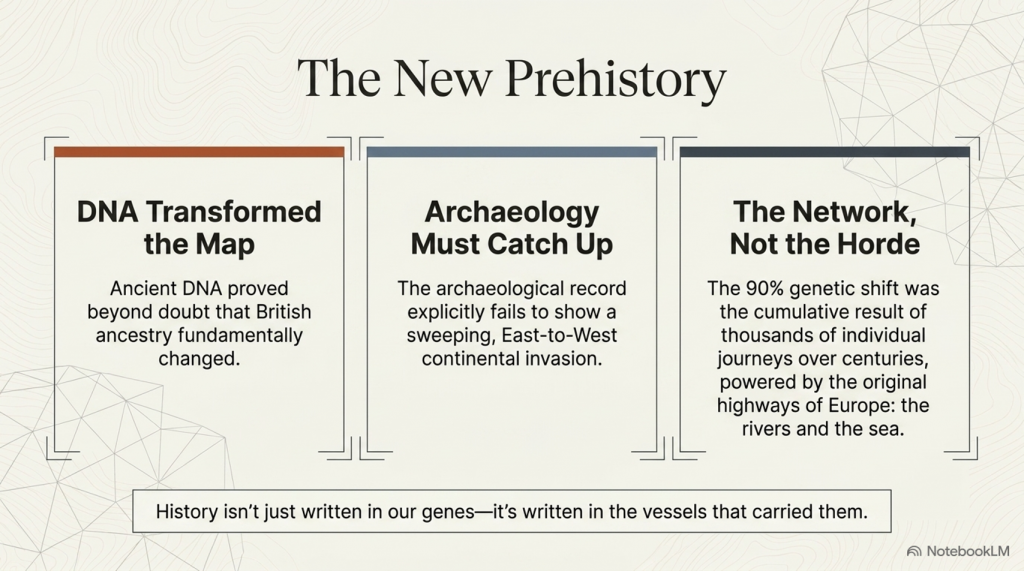
Archaeology must now catch up.

The evidence presented in this study does not deny the presence of Steppe ancestry in Britain. Instead, it demonstrates that the archaeological record does not independently reproduce the simple east-to-west migration model that has frequently been used to explain it.

The Bell Beaker phenomenon appears less like the trace of a continental invasion and more like the product of a Europe already connected by rivers, coastlines and maritime trade.

If that interpretation is correct, then the movement of genes across prehistoric Europe may have been the cumulative result of thousands of individual journeys rather than a single great migration.

Understanding those journeys—and the trading networks that made them possible—may ultimately prove to be the key to understanding the true origins of prehistoric Europe.

I think the “smoking gun” isn’t that your hypothesis is proven. The smoking gun is that the traditional model fails its own archaeological test. Then you can present your Doggerland model as the explanation that currently best fits the evidence.

I’d write it more like this:
 (The Great Bell Beaker Migration Myth - Haplogroup R1b)
(The Great Bell Beaker Migration Myth – Haplogroup R1b)

Author’s Comment – The Smoking Gun

For almost twenty years, the public has been told a simple story.

A population from the Pontic-Caspian Steppe migrated westward, carrying R1b and the Bell Beaker culture across Europe before replacing much of Britain’s existing population.

It is an elegant theory.

The problem is that the archaeology refuses to cooperate.

If Bell Beaker people really carried this migration, then the archaeological record should reveal a clear trail from east to west. It should begin on or near the Steppe, strengthen through Central Europe and culminate in Atlantic Europe.

It does not.

The Bell Beaker phenomenon begins in Atlantic Europe, not on the Steppe.

There are no Bell Beaker communities in the Steppe heartland.

There is no Bell Beaker archaeological origin in the east.

And when nearly 180,000 radiocarbon dates are analysed, the predicted migration wave simply fails to appear.

That is not a minor inconsistency.

It is the central prediction of the entire model.

If archaeology cannot demonstrate the migration, then archaeology cannot be used as evidence that Bell Beaker people carried Steppe populations across Europe.

Once that assumption is removed, the accepted explanation for the spread of R1b is no longer the only interpretation available.

In fact, the archaeological evidence points in precisely the opposite direction.

The earliest Bell Beaker pottery appears along the Atlantic façade. The strongest maritime connections lie around the coasts of western Europe. The mathematical analysis presented in this book consistently identifies Atlantic Europe—not the Pontic Steppe—as the primary centre of expansion.

That observation leads to a different hypothesis.

Rather than populations moving west from the Steppe, the evidence is equally consistent with populations, technologies and paternal lineages expanding outwards from the North Sea basin and the now-submerged landscape of Doggerland, using the extensive maritime trading networks that already connected Atlantic Europe.

Unlike the traditional model, this hypothesis does not require that Bell Beaker pottery originated hundreds of kilometres from the people supposedly carrying it. It does not require the archaeological record to contain a migration that cannot be found. And it does not ask archaeology to support a demographic event that the archaeological chronology itself fails to reproduce.

This blog does not claim that the Doggerland hypothesis has been fully proven.

It demonstrates something just as important.

The traditional Bell Beaker migration model fails its own archaeological test.

When a scientific model no longer fits the evidence, science does not defend the model.

It builds a better one.


That deserves investigation, rather than being presented as an already established fact.

PODCAST

Author’s Biography

Robert John Langdon, a polymathic luminary, emerges as a writer, historian, and eminent specialist in LiDAR Landscape Archaeology.

His intellectual voyage has been interwoven with stints as an astute scrutineer in government and grand corporate bastions, a tapestry spanning British Telecommunications, Cable and Wireless, British Gas, and the esteemed University of London.

A decade hence, Robert’s transition into retirement unfurled a chapter of insatiable curiosity. This phase saw him immerse himself in Politics, Archaeology, Philosophy, and the enigmatic realm of Quantum Mechanics. His academic odyssey traversed the venerable corridors of knowledge hubs such as the Museum of London, University College London, Birkbeck College, The City Literature Institute, and Chichester University.

In the symphony of his life, Robert is a custodian of three progeny and a pair of cherished grandchildren. His sanctuary lies ensconced in the embrace of West Wales, where he inhabits an isolated cottage, its windows framing a vista of the boundless sea – a retreat from the scrutinising gaze of Her Majesty’s Revenue and Customs, an amiable clandestinity in the lap of nature.

Exploring Prehistoric Britain: A Journey Through Time

My blog delves into the fascinating mysteries of prehistoric Britain, challenging conventional narratives and offering fresh perspectives grounded in cutting-edge research, particularly LiDAR technology. I invite you to explore some key areas of my research. For example, the Wansdyke, often cited as a defensive structure, is re-examined in light of new evidence. I’ve presented my findings in my blog post Wansdyke: A British Frontier Wall – ‘Debunked’, and a Wansdyke LiDAR Flyover video further visualises my conclusions.

My work also often challenges established archaeological dogma. I argue that many sites, such as Hambledon Hill, commonly identified as Iron Age hillforts, are not what they seem. My posts Lidar Investigation Hambledon Hill – NOT an ‘Iron Age Fort’ and Unmasking the “Iron Age Hillfort” Myth explore these ideas in detail and offer an alternative view. Similarly, sites like Cissbury Ring and White Sheet Camp receive re-evaluations based on LiDAR analysis in my posts “Lidar Investigation Cissbury Ring through time” and “Lidar Investigation White Sheet Camp, revealing fascinating insights into their true purpose. I have also examined South Cadbury Castle, often linked to the mythical Camelot56.

My research also extends to ancient water management, including the role of canals and other linear earthworks. I have discussed the true origins of Car Dyke in multiple posts, including Car Dyke – ABC News Podcast and Lidar Investigation Car Dyke – North Section, which suggest a Mesolithic origin 2357. I also explore the misidentification of Roman aqueducts, as seen in my posts on the Great Chesters (Roman) Aqueduct. My research has also been greatly informed by my post-glacial flooding hypothesis, which has helped explain landscape transformations over time. I have discussed this hypothesis in several posts, including AI now supports my Post-Glacial Flooding Hypothesis and Exploring Britain’s Flooded Past: A Personal Journey

Finally, my blog also investigates prehistoric burial practices, as seen in Prehistoric Burial Practices of Britain and explores the mystery of Pillow Mounds, often mistaken for medieval rabbit warrens, but with a potential link to Bronze Age cremation in my posts: Pillow Mounds: A Bronze Age Legacy of Cremation? and The Mystery of Pillow Mounds: Are They Really Medieval Rabbit Warrens?. My research also includes astronomical insights into ancient sites, for example, in Rediscovering the Winter Solstice: The Original Winter Festival. I also review new information about the construction of Stonehenge in The Stonehenge Enigma.

Further Reading

For those interested in British Prehistory, visit www.prehistoric-britain.co.uk, a comprehensive resource featuring an extensive collection of archaeology articles, modern LiDAR investigations, and groundbreaking research. The site also includes insights and excerpts from the acclaimed Robert John Langdon Trilogy, a series of books that explore Britain during the Prehistoric period. Titles in the trilogy include The Stonehenge Enigma, Dawn of the Lost Civilisation, and The Post-Glacial Flooding Hypothesis, which offer compelling evidence of ancient landscapes shaped by post-glacial flooding.

To further explore these topics, Robert John Langdon has developed a dedicated YouTube channel featuring over 100 video documentaries and investigations that complement the trilogy. Notable discoveries and studies showcased on the channel include 13 Things that Don’t Make Sense in History and the revelation of Silbury Avenue – The Lost Stone Avenue, a rediscovered prehistoric feature at Avebury, Wiltshire.

In addition to his main works, Langdon has released a series of shorter, accessible publications, ideal for readers delving into specific topics. These include:

For active discussions and updates on the trilogy’s findings and recent LiDAR investigations, join our vibrant community on Facebook. Engage with like-minded enthusiasts by leaving a message or contributing to debates in our Facebook Group.

Whether through the books, the website, or interactive videos, we aim to provide a deeper understanding of Britain’s fascinating prehistoric past. We encourage you to explore these resources and uncover the mysteries of ancient landscapes through the lens of modern archaeology.

For more information, including chapter extracts and related publications, visit the Robert John Langdon Author Page. Dive into works such as The Stonehenge Enigma or Dawn of the Lost Civilisation, and explore cutting-edge theories that challenge traditional historical narratives.

Other Blogs

s

t

Underestimating the Physical Size of Prehistoric Europeans?

Introduction

Scientific progress often begins with a simple question.

What happens if we revert to the original measurements rather than accept the final calculations?

In a previous analysis of the European skeletal database compiled by Christopher Ruff and colleagues, I examined one of the most fundamental characteristics of prehistoric populations—their height. Rather than relying solely on the published stature estimates, I returned to the original long-bone measurements from which those estimates were derived. (Underestimating the Physical Size of Prehistoric Europeans – Cro-Magnons?)

The distinction is important.

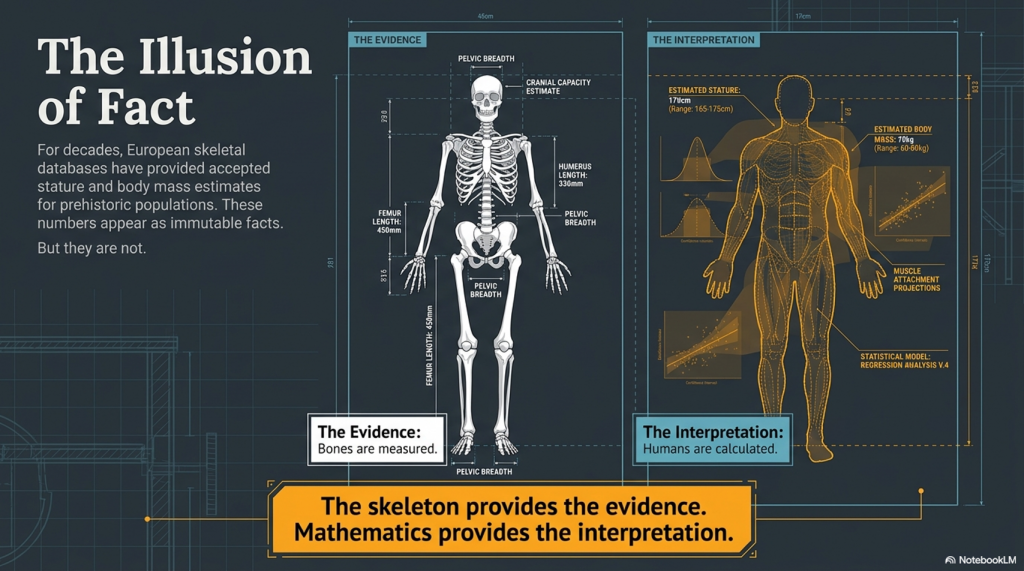
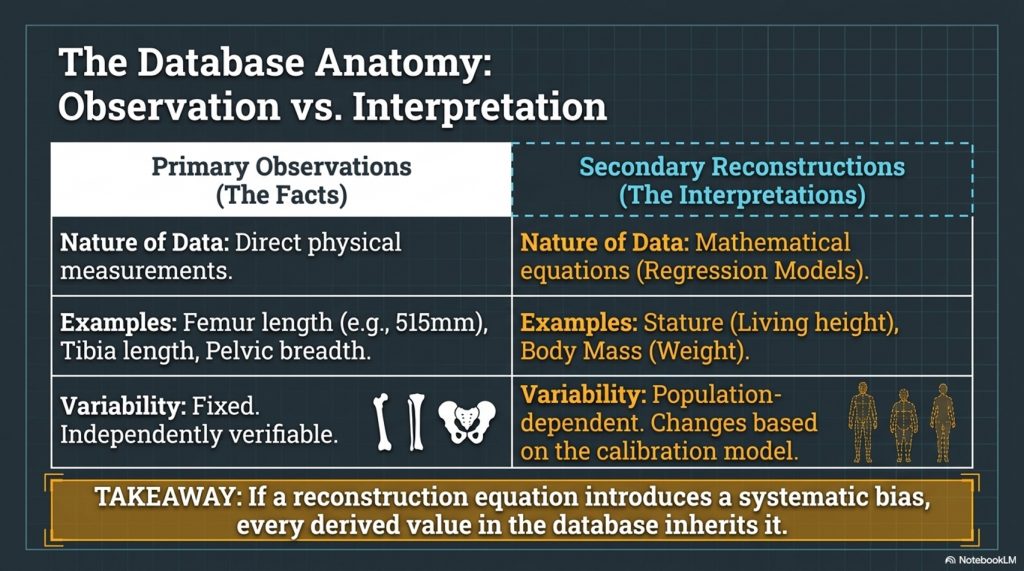
Long-bone measurements are primary observations. They are the direct measurements taken from the skeleton itself. Stature, however, is a secondary calculation produced from those measurements using a reconstruction method. If the reconstruction equation introduces even a small systematic bias, every calculated height in the database will inherit that bias.

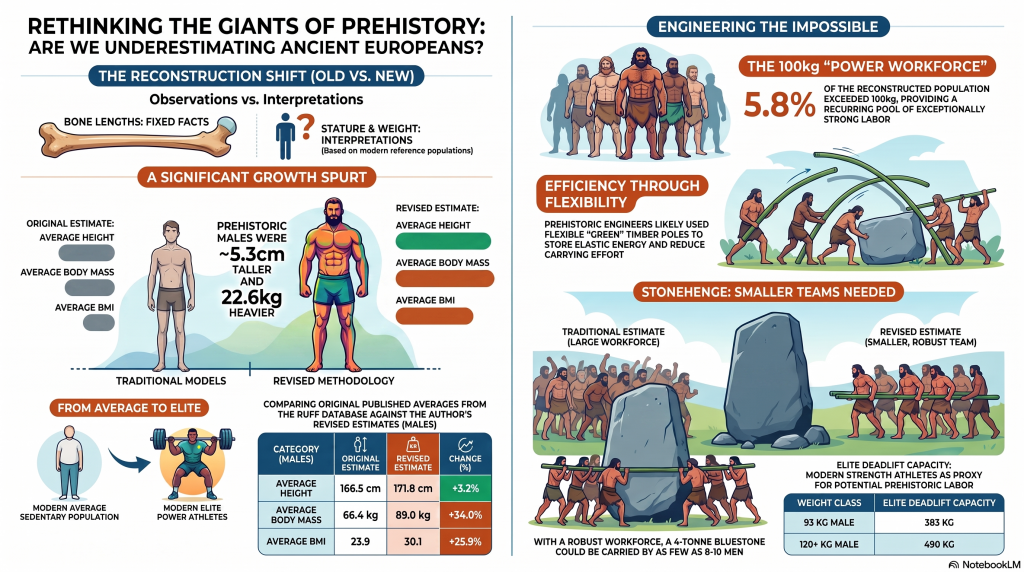
Using the complete long-bone data available for each individual, I recalculated stature across the database. The revised estimates consistently produced taller individuals than the published values. In many cases, the difference was only a few centimetres, but when applied across hundreds of skeletons, the pattern became remarkably consistent. The raw skeletal measurements had not changed. Only the method used to interpret them had.

That naturally raised a second question.

(Underestimating the Physical Size of Prehistoric Europeans - Cro-Magnons?)
(Underestimating the Physical Size of Prehistoric Europeans – Cro-Magnons?)

If Prehistoric Europeans were taller than previously reconstructed, should their estimated body mass be reconsidered as well?

Unlike stature, body mass cannot be measured directly from a skeleton. It is another reconstructed value derived from regression equations using skeletal dimensions. Consequently, if one reconstructed variable proves sensitive to the choice of calculation method, it is reasonable to ask whether another reconstructed variable deserves the same scrutiny.

This blog does not claim that existing anthropological research is incorrect. Christopher Ruff’s European database remains one of the most important resources ever assembled for understanding prehistoric populations, and the underlying skeletal measurements themselves are invaluable. The question is not whether the bones are accurate—they are. The question is whether the mathematical models used to convert those measurements into estimates of living stature and body mass always produce the most realistic representation of prehistoric people.

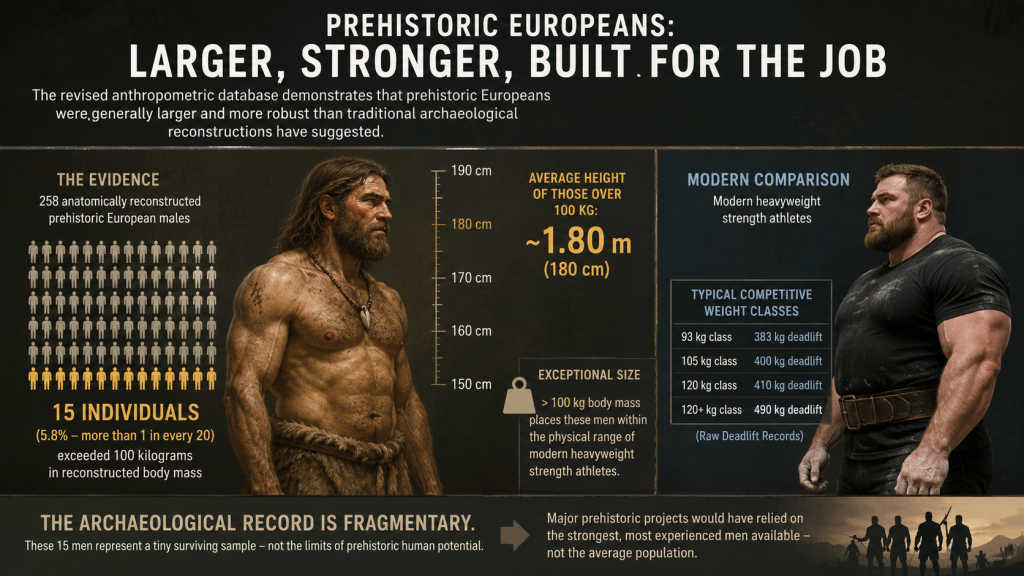
To explore that question, this study compares the revised stature estimates with the physiques of modern elite power athletes—individuals whose lives are shaped by strength, physical labour, repeated loading and muscular development. The comparison is not intended to suggest that prehistoric Europeans were rugby players or American football athletes. Rather, it asks whether people who spent their lives hunting, quarrying stone, digging massive earthworks, and constructing megalithic monuments may have possessed physiques that more closely resembled those of today’s most powerful athletes than those of today’s average sedentary population.

The purpose of this investigation is therefore broader than simply estimating body weight. It begins by examining the methods used to reconstruct prehistoric stature from skeletal remains and explains why those estimates have been recalculated using the complete long-bone measurements available within the database. It then considers the consequences of those revised heights for our understanding of prehistoric physique, comparing the resulting body sizes with those of modern elite power athletes. The objective is not to replace one assumption with another, but to test whether Europe’s prehistoric populations have been consistently reconstructed as smaller and lighter than the evidence itself may actually suggest.


(Underestimating the Physical Size of Prehistoric Europeans - Cro-Magnons?)
(Underestimating the Physical Size of Prehistoric Europeans – Cro-Magnons?)

1. The Biggest Europeans Ever Measured?

How large were the people who built prehistoric Europe?

It is a deceptively simple question, yet one that influences almost every aspect of archaeology. The physical size of prehistoric people affects our interpretation of hunting, farming, warfare, monument construction, transport, health, nutrition and even social organisation. A population averaging 170 centimetres in height with relatively modest physiques presents a very different picture from one averaging several centimetres taller with substantially greater muscle mass and skeletal robustness.

For decades, one of the principal sources for answering this question has been the European skeletal database compiled by Christopher Ruff and his colleagues. It covers more than 2,000 prehistoric individuals from across Europe and represents one of the most comprehensive collections of human skeletal measurements ever assembled. It has become a cornerstone of biological anthropology, providing researchers with reconstructed estimates of stature and body mass spanning tens of thousands of years.

It is an outstanding piece of scientific work.

However, the database contains two fundamentally different types of information that are often treated as equally certain.

The first consists of direct skeletal measurements. These include the lengths of the femur, tibia, humerus and radius, together with dozens of other anatomical dimensions. These measurements are objective observations. Once recorded correctly, they remain fixed and can be independently verified by any researcher examining the same skeleton.

The second consists of reconstructed values. Stature and body mass cannot be measured directly from ancient skeletons. Instead, they are calculated using mathematical equations developed from modern reference populations. These reconstructions are not observations; they are interpretations of the underlying skeletal measurements.

That distinction is crucial.

If the original bone measurements are accurate, but the mathematical model used to reconstruct living height or body mass introduces a systematic bias, then every derived value produced by that model will inherit the same bias. The bones remain correct. Only the interpretation changes.

This study revisits those derived values.

Rather than accepting the published reconstructions at face value, it returns to the original skeletal measurements and asks a straightforward scientific question: if we rebuild prehistoric stature directly from the complete long-bone evidence, and then reassess body mass using those revised heights, do we arrive at a different picture of prehistoric Europeans?

The answer, as we shall see, is that we do.

Not because the skeletons have changed.

Not because the archaeological evidence has changed.

But the mathematics used to interpret that evidence can change our perception of the people themselves.

(Underestimating the Physical Size of Prehistoric Europeans - Cro-Magnons?)
(Underestimating the Physical Size of Prehistoric Europeans – Cro-Magnons?)

2. Raw Measurements vs Mathematical Reconstructions

Before examining prehistoric height and body mass, it is important to understand exactly what the European skeletal database contains. Although it is often referred to simply as a database of prehistoric people, it actually contains two fundamentally different categories of information. One consists of direct physical measurements taken from the skeleton itself. The other consists of biological characteristics reconstructed from those measurements using statistical equations.

Confusing these two categories can easily lead to the impression that every number in the database carries the same level of certainty. It does not.

Primary Observations – The Facts

Primary observations are the measurements recorded directly from the skeleton. They are physical facts that can be independently checked by any researcher examining the same remains. If the femur measures 515 millimetres, then that is an observation, not an opinion. It does not depend upon any mathematical model or statistical assumption.

Examples of these direct measurements include:

  • Femur length
  • Tibia length
  • Humerus length
  • Radius length
  • Femoral head diameter
  • Pelvic breadth
  • Sacral dimensions
  • Joint dimensions
  • Numerous other anatomical measurements

These measurements form the foundation of the entire database. They are objective data collected from the archaeological remains themselves and represent the closest information we have to the original living individual.

Secondary Reconstructions – The Interpretations

Other values within the database cannot be measured directly because they no longer exist.

A skeleton cannot tell us exactly how tall a person stood when alive, nor can it reveal their body weight. Instead, these characteristics are estimated using mathematical equations developed from modern reference populations.

The two most familiar examples are:

  • Stature (estimated living height)
  • Body Mass (estimated living weight)

These values are not measurements; they are reconstructions.

They represent the best estimate produced by a particular mathematical model using the available skeletal evidence. Different equations applied to the same skeleton can therefore produce different estimates, even when the underlying bone measurements remain identical.

This distinction is fundamental.

Changing a femur length would require discovering that the original measurement was wrong. Changing a stature estimate simply requires using a different reconstruction equation. The skeleton remains exactly the same.

Why This Matters

Many readers understandably assume that a published height of 180 centimetres is a direct observation from the archaeological record. It is not.

It is the output of a reconstruction model.

Likewise, a reconstructed body mass of 80 kilograms was not measured from the skeleton. It is another calculated estimate derived from anatomical dimensions.

This difference between observation and interpretation lies at the heart of scientific investigation. Observations provide the evidence. Mathematical models attempt to explain what those observations mean.

As new methods become available, those models can be tested, refined, and, where appropriate, improved without altering a single bone.

That is precisely the approach adopted in this study.

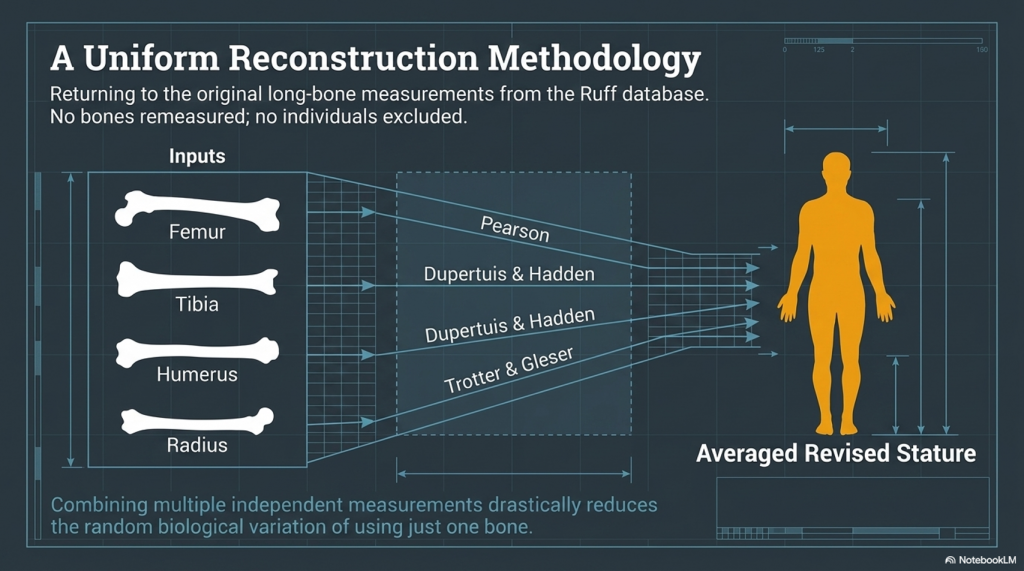
The raw skeletal measurements remain exactly as recorded in the original database. Nothing has been altered, discarded or remeasured. Instead, the analysis returns to those original observations and asks whether alternative reconstruction methods produce a more realistic picture of prehistoric Europeans. If they do, then it is not the evidence that has changed—it is simply our interpretation of it.

(Underestimating the Physical Size of Prehistoric Europeans - Cro-Magnons?)
(Underestimating the Physical Size of Prehistoric Europeans – Cro-Magnons?)

3. Regression Models – Where Prehistoric People Are Reconstructed

One of the greatest misconceptions in archaeology is that prehistoric height and body mass are measurements taken directly from skeletons.

They are not.

The skeleton provides the evidence. Mathematics provides the interpretation.

This distinction lies at the heart of biological anthropology and is fundamental to understanding every stature and body-mass estimate published for prehistoric populations.

The Skeleton Never Changes

Imagine a femur measuring 510 mm.

That measurement is a physical fact.

Every competent osteologist measuring the same bone should obtain essentially the same value, allowing only for tiny measurement differences of a fraction of a millimetre.

The same applies to every other anatomical measurement within the database:

  • Femur length
  • Tibia length
  • Humerus length
  • Radius length
  • Femoral head diameter
  • Pelvic breadth
  • Joint dimensions

These are observations.

Once recorded correctly, they do not change.

They are the archaeological evidence.

The Living Person Must Be Reconstructed

The difficulty begins when we attempt to recreate the living individual.

A skeleton cannot tell us directly:

  • How tall the person stood.
  • How much they weighed.
  • How much muscle they possessed.
  • How much body fat they carried.

Those characteristics disappeared when the individual died.

To estimate them, anthropologists rely upon regression equations.

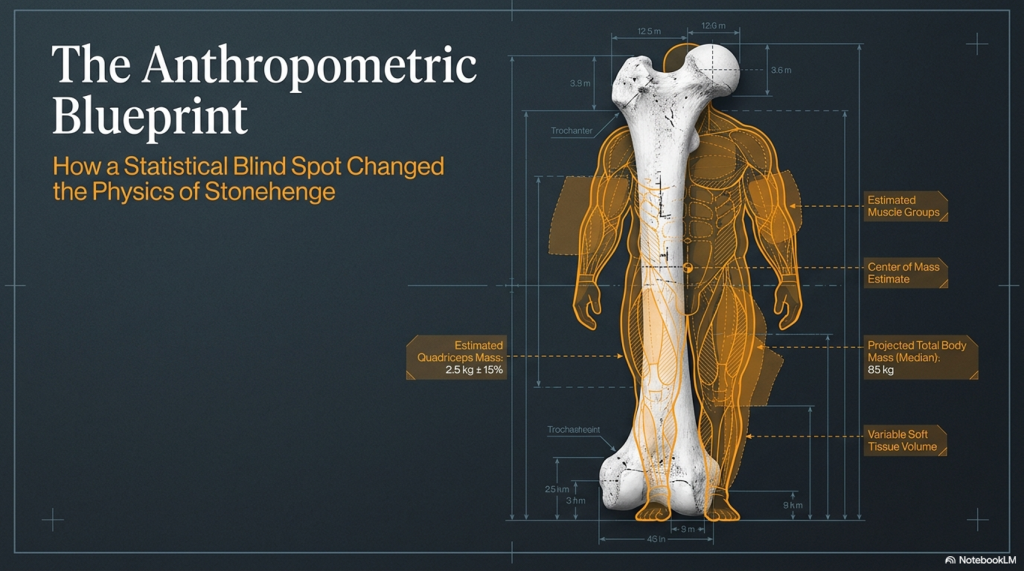
Regression analysis is a statistical technique developed by comparing people whose skeletons and living measurements are both known. By examining thousands of modern individuals, relationships can be identified between skeletal dimensions and characteristics such as stature or body mass.

These relationships are then expressed as mathematical equations.

For stature, a simplified example might take the form:

Stature = a + (b × Femur Length)

where a and b are constants derived from the reference population used to construct the equation.

The same principle applies to body mass, except that it is generally reconstructed from measurements such as femoral head diameter, pelvic breadth, and, in some methods, reconstructed stature.

The mathematics is perfectly valid.

The important question is whether the underlying assumptions remain valid when applied to prehistoric Europeans living tens of thousands of years ago.

Every Regression Equation Has Assumptions

Regression equations are not universal laws of nature.

They are statistical models.

Every model depends upon:

  • the reference population from which it was derived,
  • the number of individuals included,
  • their biological characteristics,
  • and the variables selected by the researcher.

If two researchers develop equations using different reference populations, they may legitimately obtain different stature estimates from exactly the same skeleton.

The bone has not changed.

Only the statistical model has changed.

This is not a flaw in anthropology.

It is an unavoidable consequence of reconstructing living people from incomplete archaeological evidence.

Why Recalculate the Database?
This distinction explains the purpose of the present study.

The original Ruff database remains one of the finest collections of prehistoric skeletal measurements ever assembled.

Nothing within the archaeological record has been altered.

Every femur, tibia, humerus and radius remains exactly as originally measured.

The only question is whether a different reconstruction strategy yields a different result.

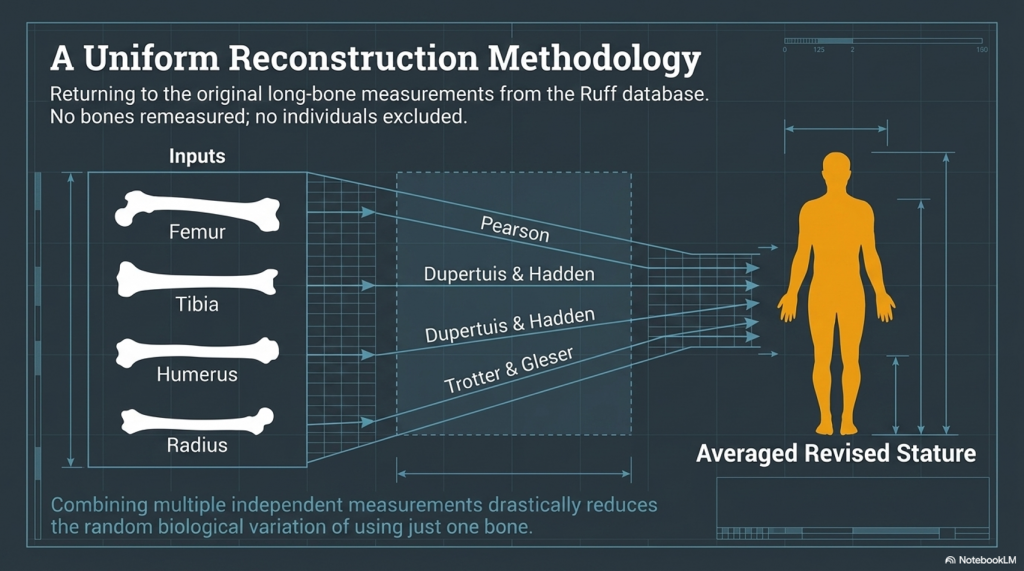
Rather than accepting a single published stature estimate, this study returns to the complete long-bone evidence available for each individual. Independent stature estimates are calculated from each available long bone before combining them into a single revised stature estimate.

The skeletal evidence remains identical.

Only the mathematics changes.

A Scientific Test, Not a Criticism

This distinction is important because it changes the nature of the investigation.

The objective is not to demonstrate that previous anthropologists measured skeletons incorrectly.

They did not.

Nor is it to suggest that regression equations are inherently flawed.

They are indispensable tools in biological anthropology.

Instead, the question is far more straightforward.

If different but equally valid reconstruction methods yield systematically different estimates from the same archaeological evidence, how much confidence should we place in the published averages that have been accepted as descriptions of prehistoric Europeans?

That is the question explored throughout the remainder of this study.

Only after understanding how reconstructed humans are created can we meaningfully examine whether Europe’s prehistoric populations have been consistently portrayed as smaller and lighter than the original skeletal evidence itself may suggest.

(Underestimating the Physical Size of Prehistoric Europeans - Cro-Magnons?)
(Underestimating the Physical Size of Prehistoric Europeans – Cro-Magnons?)

4. How Fixed Is a Reconstructed Human?

At first glance, prehistoric anthropology appears reassuringly precise.

A skeleton is excavated, its bones are measured, regression equations are applied, and the result is presented as a living person—175 centimetres tall, weighing 72 kilograms. Once published, these figures quickly acquire an authority that suggests they are objective facts recovered directly from the archaeological record. They appear in scientific papers, museum displays, documentaries, school textbooks, Wikipedia, and increasingly within artificial intelligence systems. Repeated often enough, they become accepted reality.

Yet there is a fundamental question that is rarely asked.

How fixed is that reconstructed human?

Suppose the same prehistoric skeleton had been analysed not today, but in Victorian Britain shortly after the Cro-Magnon discoveries of the nineteenth century. The femur would still measure exactly the same length. The tibia, humerus and radius would remain unchanged. Every archaeological observation would be identical.

Only one thing would differ.

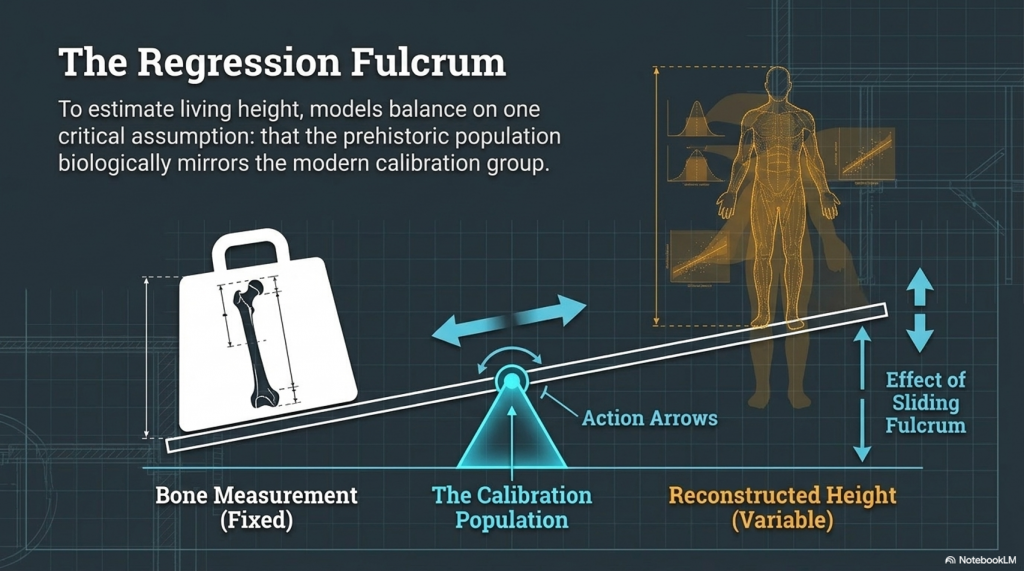
The modern population is used to calibrate the reconstruction equations.

Victorian Europeans were generally shorter, lighter and lived very different lives from those of today. Had anthropologists developed their regression equations from that population, the resulting prehistoric reconstructions would almost certainly have differed from those produced using modern reference populations.

Now repeat the thought experiment.

Instead of using Victorian Britain, construct the regression equations using modern Dutch populations, which are among the tallest people in the world.

Now repeat the process using populations from East Asia.

Then again, using populations from sub-Saharan Africa.

The prehistoric skeleton has not been altered by a single millimetre.

The femur remains identical.

The tibia remains identical.

Every archaeological observation remains identical.

Only the statistical relationship between those bones and the living population has changed.

The reconstructed prehistoric person changes even though the archaeological evidence does not.

This is not a weakness of regression analysis.

It is an unavoidable consequence of how regression models work.

Every regression equation is calibrated against a particular reference population. It assumes that the statistical relationship observed in that population is sufficiently similar to that of the reconstructed archaeological population. If that assumption changes, the reconstructed height, body mass and physique may also change.

Mathematics has not failed.

It has simply produced the result expected from the assumptions built into the model.

This distinction is critical because it changes how we should interpret prehistoric averages.

When we read that Neolithic men averaged 171 centimetres, or that Upper Palaeolithic Europeans averaged 176 centimetres, it is tempting to imagine these values were measured directly from ancient people.

They were not.

They are the outputs of statistical models.

That does not make them incorrect.

It makes them conditional.

Their accuracy depends upon the suitability of the reconstruction method, the calibration population from which the equations were derived, and the assumptions underlying the statistical model itself.

In other words, prehistoric stature is not a fixed archaeological fact preserved within the skeleton.

It is a scientific estimate produced by interpreting the skeleton.

That distinction may appear subtle, but its implications are profound.

If different, equally legitimate reconstruction methods can produce materially different prehistoric populations from exactly the same skeletal evidence, then published averages should never be regarded as immutable truths. They are hypotheses expressed mathematically—often excellent hypotheses, supported by careful science—but hypotheses nonetheless.

This is precisely why returning to the original skeletal measurements is so important.

The bones themselves do not change.

Only our interpretation of them.

The remainder of this study, therefore, asks a simple scientific question.

If we reconstruct Europe’s prehistoric populations using a single, transparent methodology applied consistently across the same skeletal database, does the resulting picture differ from the one that has become widely accepted?

(Underestimating the Physical Size of Prehistoric Europeans - Cro-Magnons?)
(Underestimating the Physical Size of Prehistoric Europeans – Cro-Magnons?)

Illustrative Example: How the Same Skeleton Can Produce Different Prehistoric Humans

The following example is illustrative.

It is not intended to reconstruct a real prehistoric individual. Instead, it demonstrates a fundamental statistical principle: regression equations are calibrated from living populations. If the calibration population changes, the reconstructed prehistoric human also changes—even though the archaeological skeleton itself remains completely unchanged.

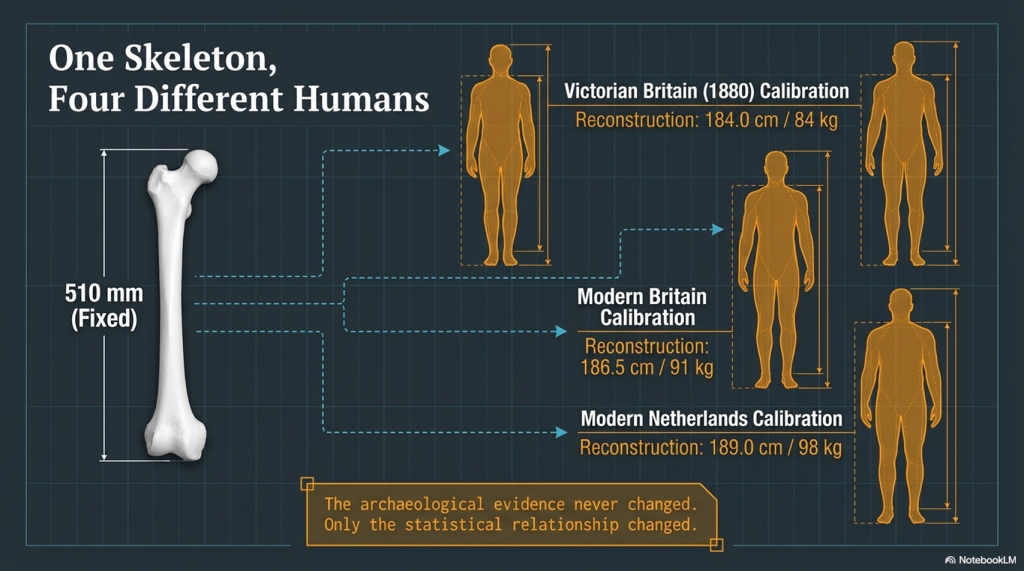
Imagine a prehistoric skeleton preserving a complete femur measuring exactly 510 mm.

Every osteologist agrees on the measurement.

Every archaeologist records exactly the same femur length.

The skeleton never changes.

Independent Evidence Supports Greater Robusticity

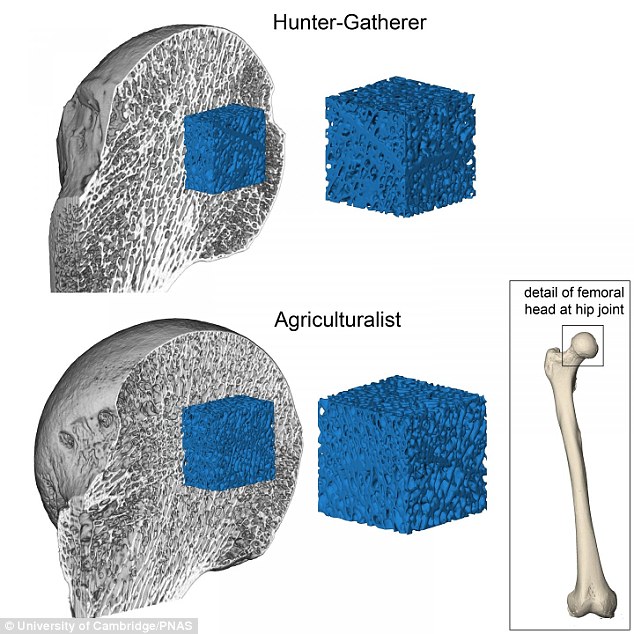
Interestingly, the conclusion that Europe’s earliest hunter-gatherers were physically exceptional is not unique to this analysis. Christopher Ruff and colleagues have independently shown that skeletal robusticity and mobility declined progressively following the adoption of agriculture. Their research demonstrates that pre-agricultural Europeans possessed substantially stronger limb bones than later farming populations, reflecting lives characterised by greater mobility and repeated heavy mechanical loading.

This is an important point because it means the debate is not really about whether these people were unusually robust. Even the published research accepts that they were. The question is whether the mathematical models used to reconstruct their living height and body mass fully reflect that exceptional anatomy.

(Underestimating the Physical Size of Prehistoric Europeans - Cro-Magnons?)
Research from the University of Cambridge, spanning more than 7,000 years of human evolution, has revealed that modern-day skeletons (pictured bottom) are lighter and more fragile than those of our hunter-gatherer ancestors (pictured top). They studied hip joints on ancient femurs – (Underestimating the Physical Size of Prehistoric Europeans – Cro-Magnons?)

The original database itself makes this distinction clear. Skeletal dimensions are measured directly from the bones, whereas stature and body mass are calculated using reconstruction equations derived from modern reference populations. Different equations applied to exactly the same skeleton can therefore produce different estimates, even though the bones themselves remain unchanged.

If independent research already demonstrates that Europe’s earliest populations possessed stronger skeletons than their farming descendants, then it is entirely reasonable to ask whether regression equations based upon modern populations are introducing systematic bias into estimates of prehistoric height and body mass.

That is the question explored below.

Now imagine that four independent anthropological teams develop their regression equations from four different modern populations.

Scenario 1 – Victorian Britain (c.1880)

Average adult male stature: 167 cm

The regression equation is calibrated using the Victorian population.

The prehistoric skeleton is reconstructed as:

  • Estimated Height: 184.0 cm
  • Estimated Body Mass: 84 kg

Scenario 2 – Modern Britain

Average adult male stature: 177 cm

A new regression equation is developed using a modern British reference population.

Exactly the same prehistoric skeleton now becomes:

  • Estimated Height: 186.5 cm
  • Estimated Body Mass: 91 kg

Scenario 3 – Modern Netherlands

Average adult male stature: 184 cm

The equation is now calibrated from one of the tallest populations in Europe.

Without altering a single archaeological measurement, the reconstruction becomes:

  • Estimated Height: 189.0 cm
  • Estimated Body Mass: 98 kg

Scenario 4 – Modern East Asia

Average adult male stature: 171 cm

A fourth research team develops its own regression equation using an East Asian calibration population.

Once again, the prehistoric skeleton itself remains unchanged.

The reconstruction becomes:

  • Estimated Height: 182.5 cm
  • Estimated Body Mass: 81 kg

What Actually Changed?

Calibration PopulationAverage Modern MaleReconstructed Height*Reconstructed Body Mass*
Victorian Britain (1880)167 cm184.0 cm84 kg
Modern Britain177 cm186.5 cm91 kg
Modern Netherlands184 cm189.0 cm98 kg
Modern East Asia171 cm182.5 cm81 kg

*Illustrative values showing the principle of population-dependent regression. They are not reconstructed from published equations.

Notice what never changed.

  • The prehistoric femur was 510 mm.
  • The archaeological evidence never changed.
  • No new skeleton was discovered.
  • No measurement was corrected.

Only the reference population used to construct the regression equation changed.

The prehistoric skeleton remained unchanged.

The prehistoric human did not.

This simple illustration demonstrates why reconstructed stature and body mass should never be regarded as direct archaeological observations. They are products of statistical models whose outputs depend upon the assumptions built into their calibration. That does not make them unscientific—it simply means they are conditional upon the population and methodology from which the equations were derived.

The following chapters move from this illustrative example to the real archaeological evidence. Using the original skeletal measurements from Christopher Ruff’s European database, the reconstruction methodology is changed, while every bone measurement remains identical. The results show that changing the mathematical interpretation alone is sufficient to produce a materially different prehistoric population.

(Underestimating the Physical Size of Prehistoric Europeans - Cro-Magnons?)
(Underestimating the Physical Size of Prehistoric Europeans – Cro-Magnons?)

5. Reconstructing Height – A Consistent Methodology

Having established that prehistoric stature is a reconstructed value rather than a direct archaeological observation, the obvious question becomes:

Can the same skeletal evidence produce a different picture if reconstructed using a single, transparent and consistent methodology?

This chapter attempts to answer that question.

The objective was never to make prehistoric Europeans taller.

Nor was it to demonstrate that previous anthropologists had measured skeletons incorrectly.

Every skeletal measurement contained within Christopher Ruff’s European database was accepted exactly as published. Every femur, tibia, humerus and radius remained unchanged throughout the study.

Only one element was altered.

The mathematical reconstruction of living stature.

Returning to the Original Evidence

The original database contains two very different forms of information.

The first consists of the raw skeletal measurements:

  • Femur length
  • Tibia length
  • Humerus length
  • Radius length

These are direct archaeological observations.

The second consists of a reconstructed stature.

Unlike the bone measurements themselves, stature is calculated using regression equations and therefore depends upon the reconstruction methodology selected by the researcher.

Rather than accepting the published stature estimate as the final answer, this study returned to the original long-bone measurements and independently reconstructed stature from each available long bone.

Why Use Multiple Long Bones?

Every long bone contains information about stature.

However, no individual bone is perfect.

One femur may slightly overestimate living height.

Another tibia may slightly underestimate it.

A humerus may be affected by individual variation.

A radius may reflect different proportions within the same population.

Using a single bone, therefore, increases the influence of random biological variation.

Using several independent long bones reduces that uncertainty.

Instead of allowing one measurement to dominate the reconstruction, every available long bone contributes to the final estimate.

The resulting stature therefore represents the mean of all available independent long-bone reconstructions for each individual.

This is a simple principle, but an important one.

When several independent measurements describe the same biological characteristic, combining them generally yields a more stable estimate than relying on a single measurement.

(Underestimating the Physical Size of Prehistoric Europeans - Cro-Magnons?)
(Underestimating the Physical Size of Prehistoric Europeans – Cro-Magnons?)

The Reconstruction Procedure

For every individual within the database:

  1. The original skeletal measurements were accepted exactly as published.
  2. Independent stature estimates were calculated from every available long bone.
  3. The equations employed were those published by:
  • Pearson (1899)
  • Dupertuis & Hadden (1951)
  • Trotter & Gleser (1952, 1958)
  1. The independent stature estimates derived from the femur, tibia, humerus and radius were then averaged to produce a single revised stature for each individual.

No skeletal measurements were altered.

No archaeological evidence was removed.

No individuals were excluded because they produced inconvenient results.

Every skeleton was treated using exactly the same reconstruction procedure.

A Uniform Reconstruction

One of the principal advantages of this approach is consistency.

Large archaeological databases are often assembled from numerous excavations undertaken over many decades using different researchers, different objectives and, in some cases, different reconstruction methods.

By returning to the original skeletal measurements and applying a single transparent methodology across the entire database, each individual is reconstructed using the same analytical procedure.

This does not guarantee that the revised heights are definitive.

No regression equation can claim that.

It does, however, ensure that every individual in the study has been treated consistently using the same methodology, allowing meaningful comparisons across regions, archaeological periods, and populations.

The Results

The effect of this recalibration was immediate.

Some individuals became taller.

Some became shorter.

That is precisely what should happen when a single reconstruction methodology is applied objectively across a large archaeological dataset.

Had every individual increased in height, the results would immediately have appeared suspicious.

Instead, the recalculation corrected both overestimates and underestimates.

What mattered was not the change in any single individual.

It was the change across the population as a whole.

The following chapter examines those statistical changes for the first time, revealing how the average prehistoric European changed when exactly the same skeletal evidence was reconstructed using a single, consistent methodology.

(Underestimating the Physical Size of Prehistoric Europeans - Cro-Magnons?)
(Underestimating the Physical Size of Prehistoric Europeans – Cro-Magnons?)

6. What Changed Across the Entire Population?

Individual skeletons are interesting, but archaeology is ultimately concerned with populations.

A single exceptionally tall individual tells us very little about prehistoric Europe. A systematic change across hundreds of skeletons, however, has the potential to alter our understanding of prehistoric populations as a whole.

Having recalculated stature using a single, consistent methodology, the revised database was analysed statistically to determine whether the changes represented isolated corrections or a genuine shift in the reconstructed population.

The answer was unambiguous.

The recalibration did not simply alter a handful of exceptional individuals.

It changed the statistical profile of the entire database.

Overall Population Statistics

Table 6.1 compares the original published reconstructions with the revised stature and body-mass estimates.

SexSample SizeOriginal HeightRevised HeightChangeOriginal Body MassRevised Body MassChange
Male237166.5 cm171.8 cm+5.3 cm66.4 kg89.0 kg+22.6 kg
Female157156.4 cm164.1 cm+7.7 cm56.1 kg76.8 kg+20.7 kg

The revised analysis increased the average reconstructed stature in both sexes.

The increase was not confined to males or females, suggesting that the recalibration was affecting the reconstruction methodology itself rather than merely correcting a small number of unusual individuals.

Percentage Change

Expressing the same data as percentages illustrates the magnitude of the change.

Table 6.2 Percentage Change Following Recalibration

SexHeight IncreaseBody Mass Increase
Male+3.2%+34.0%
Female+4.9%+36.9%

At first sight, the increase in body mass appears remarkably large.

This is entirely expected.

Body mass does not increase linearly with stature.

Because body mass is related to the square of height (through Body Mass Index), even modest increases in reconstructed stature produce substantially larger increases in reconstructed body weight.

Average Body Mass Index

The revised body masses were calculated using fixed comparison BMIs derived from elite power athletes.

Table 6.3 Average Body Mass Index

SexOriginal BMIRevised BMI
Male23.930.1
Female22.928.5

The original reconstructions describe a population with body proportions similar to those of healthy modern adults.

The revised comparison model represents substantially more robust physiques, comparable to those of modern elite strength athletes.

These values should not be interpreted as direct measurements of prehistoric BMI. Rather, they provide a standardised comparison model against which the engineering and logistical implications of prehistoric physique can be explored.

Table 6.4. The Ten Tallest Prehistoric European Males (Revised Anatomical Reconstruction)

RankSiteRegionPeriodYears BPRevised HeightHeight (ft/in)Revised Body Mass
1Over VindingeScandinavia / FinlandNeolithic3,975189.5 cm6 ft 3 in108.1 kg
2HolmstrupScandinavia / FinlandNeolithic5,350189.1 cm6 ft 2 in107.6 kg
3Schela CladoveiBalkansMesolithic9,271187.2 cm6 ft 2 in105.5 kg
4Barma GrandeItalyEarly Upper Palaeolithic29,576187.0 cm6 ft 2 in105.3 kg
5PavlovNorth-Central EuropeEarly Upper Palaeolithic31,039186.8 cm6 ft 2 in105.0 kg
6Grotte des EnfantsItalyEarly Upper Palaeolithic28,304185.7 cm6 ft 1 in103.8 kg
7GrydehøjScandinavia / FinlandNeolithic4,800185.2 cm6 ft 1 in103.2 kg
8Schela CladoveiBalkansMesolithic9,271184.2 cm6 ft 1 in102.1 kg
9Schela CladoveiBalkansMesolithic9,271183.5 cm6 ft 0 in101.4 kg
10SunghirScandinavia / Finland*Early Upper Palaeolithic27,530183.2 cm6 ft 0 in101.0 kg

What Do These Statistics Mean?

Several important observations emerge from the analysis.

First, the recalibration does not simply affect exceptional individuals.

Average stature changes across the entire population.

Second, because body mass is derived from stature, relatively modest changes in reconstructed height produce much larger changes in estimated body weight.

Finally, the analysis demonstrates an important methodological principle.

The archaeological evidence remained unchanged throughout the study.

No bones were remeasured.

No skeletons were added or removed.

Only the reconstruction methodology changed.

Yet the average prehistoric European became taller and substantially heavier.

That is perhaps the most significant finding of the entire investigation.

The skeletons never changed.

Only our mathematical interpretation of them did.

6.5 Top 10 Tallest Prehistoric European Females

RankSiteRegionPeriodYears BPRevised HeightHeight (ft/in)Revised Body Mass
1CaviglioneItalyEarly Upper Palaeolithic24,360178.0 cm5 ft 10 in90.3 kg
2Parabita (Veneri)ItalyEarly Upper Palaeolithic23,560176.6 cm5 ft 9½ in88.9 kg
3DrosaNorth-Central EuropeMesolithic8,350175.9 cm5 ft 9 in88.2 kg
4Schela CladoveiBalkansMesolithic9,271175.8 cm5 ft 9 in88.1 kg
5OstuniItalyEarly Upper Palaeolithic24,590175.6 cm5 ft 9 in87.9 kg
6Cro-MagnonFranceEarly Upper Palaeolithic27,680174.9 cm5 ft 9 in87.2 kg
7Schela CladoveiBalkansMesolithic9,271174.3 cm5 ft 8½ in86.6 kg
8PaglicciItalyEarly Upper Palaeolithic28,100174.0 cm5 ft 8½ in86.3 kg
9San TeodoroItalyEarly Upper Palaeolithic14,350172.4 cm5 ft 7¾ in84.7 kg
10Wayland’s Smithy IBritainNeolithic5,495172.2 cm5 ft 7¾ in84.5 kg

Calibration Is Already Recognised as a Limitation


The observations presented in this chapter should not be interpreted as a criticism unique to Christopher Ruff’s work. In fact, biological anthropologists have long recognised that regression equations are dependent upon the populations from which they are derived.

Christopher Ruff himself discusses the limitations of body-mass reconstruction and notes that different estimation methods produce different results depending upon the skeletal variables employed and the assumptions underlying each model.

Likewise, forensic anthropology routinely develops separate regression equations for different populations because no single equation can be assumed to reconstruct every human population equally well. Researchers have repeatedly shown that stature equations calibrated on one population often perform less accurately when applied to another.

The present study therefore does not challenge the principle of regression analysis. Instead, it examines the consequences of applying an alternative reconstruction methodology to the same archaeological evidence. The question is not whether regression equations work, but how sensitive prehistoric reconstructions are to the assumptions built into those equations.

The Next Question

If prehistoric Europeans were consistently reconstructed as taller and considerably more robust than previously estimated, what effect would that have on our understanding of prehistoric engineering?

How many people would be required to transport a four-tonne bluestone?
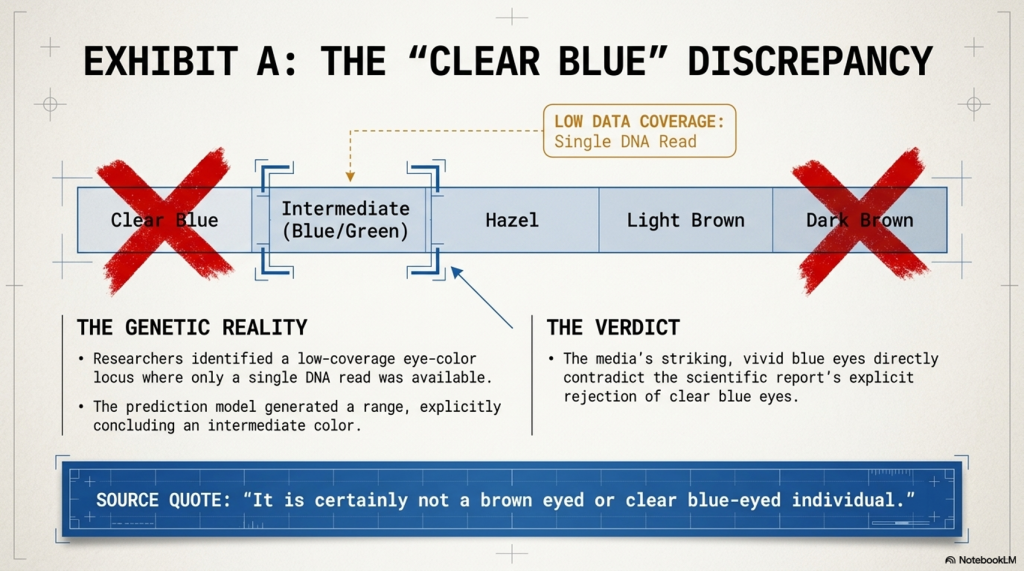
How many would be needed to haul a twenty-five-tonne sarsen?

Would the logistics of prehistoric monument construction look different if the workforce itself were physically different?

(Underestimating the Physical Size of Prehistoric Europeans - Cro-Magnons?)
(Underestimating the Physical Size of Prehistoric Europeans – Cro-Magnons?)

Here’s a version that works much better as a Facebook post. It leads with the surprising conclusion rather than the table.


📏 HOW MANY GIANTS WALKED ACROSS PREHISTORIC EUROPE?

One criticism I often hear is:

“Surely there weren’t many really tall people?”

Well… let’s do the maths.

My reconstructed anthropometric database shows that 5.4% of prehistoric European males exceeded 6 feet in height, compared with around 3% today.

That means these ancient populations were almost twice as likely to produce exceptionally tall individuals.

If Mesolithic/Neolithic Europe contained around 500,000 people, the numbers become fascinating…

HeightEstimated Number of People
📏 Over 6’0″27,000
📏 Over 6’6″135–270
📏 Over 6’9″4–14
📏 Over 7’0″0–2

So what does this tell us?

It doesn’t suggest a continent full of mythical giants.

Instead, it paints a picture of a physically impressive population where men over six feet were commonplace, individuals over 6 feet 6 inches were unusual but regularly encountered, and the occasional giant approaching or exceeding seven feet would have been exceptionally rare—but no longer statistically impossible.

Perhaps the most important implication is this:

A population capable of producing almost twice as many very tall men is unlikely to have been undernourished or physically inferior. Instead, it suggests people living close to their genetic growth potential, supported by abundant food, excellent childhood nutrition, and physically demanding lifestyles.

Maybe we’ve been underestimating not only the size of prehistoric Europeans…

…but also their capabilities.

The archaeological evidence may be telling us far more than we’ve been prepared to hear.

Chapter 7 – The Engineering Reality of Bluestone Transport

Rethinking the Stonehenge Transport Problem

For more than a century, archaeologists have reconstructed the transport of the Stonehenge bluestones as an enormous logistical exercise requiring large workforces, sledges, rollers, prepared timber trackways and complex hauling systems. These reconstructions share one fundamental assumption: prehistoric people were physically comparable to modern populations.

The previous chapters have shown that the assumption is questionable.

Our revised anthropometric database presents a markedly different picture of prehistoric Europe. The study includes 258 anatomically reconstructed prehistoric males from across Europe, of whom 13 were from Britain. Despite the fragmentary nature of the archaeological record, 15 individuals (5.8% – more than 1 in 20) possess reconstructed body masses exceeding 100 kg, placing them firmly within the physical range of modern heavyweight strength athletes. These skeletons represent only a minute fraction of the prehistoric population, yet they demonstrate that exceptionally large and powerful men (6%) formed a recurring component of European societies rather than representing isolated anomalies.

Although the number of sufficiently complete Mesolithic and Neolithic skeletons available for full anatomical reconstruction remains relatively limited, this observation is statistically important. The archaeological record represents only a minute fraction of the millions of people who once lived throughout prehistoric Britain and Europe. Recovering multiple individuals weighing over 100 kg from such a small surviving sample strongly suggests that powerful, heavyweight men were a recurring component of prehistoric society rather than isolated biological curiosities.

More importantly, prehistoric monument construction would never have depended upon the average member of society.

Table 7.1 – Tallest Individual by Period (Male)

PeriodSiteRevised HeightHeight (ft/in)Revised Body Mass
Early Upper PalaeolithicBarma Grande187.0 cm6 ft 2 in105.3 kg
Late Upper PalaeolithicOberkassel175.1 cm5 ft 9 in92.3 kg
MesolithicSchela Cladovei187.2 cm6 ft 2 in105.5 kg
NeolithicOver Vindinge189.5 cm6 ft 3 in108.1 kg

Observation: Exceptionally tall and robust males occur throughout prehistory. Rather than declining over time, stature peaks in the Neolithic dataset, with the tallest reconstructed individual reaching almost 1.90 metres (6 ft 3 in).

Just as modern construction projects rely upon the strongest, most experienced and most highly skilled members of the workforce rather than a random cross-section of the population, the transport and erection of multi-tonne megaliths would almost certainly have been entrusted to the physically largest and most capable individuals available.

The engineering calculations presented in this chapter, therefore, concern the workforce most likely to have undertaken megalithic construction rather than the average physique of prehistoric society.

Once this revised population is used instead of modern averages, the engineering problem changes completely.

Every engineering calculation begins with the workforce. If the workforce has been underestimated, then every estimate of manpower, lifting capacity, transport logistics, construction time and monument building must also be reconsidered. The engineering cannot remain unchanged if the engineers themselves have changed.

The question is no longer:

How could hundreds of relatively small people move a four-tonne stone?

Instead, it becomes:

How few exceptionally robust prehistoric men would actually have been required?

That distinction lies at the heart of this chapter.

Table 7.2 – Largest Reconstructed Body Masses (Male)

RankSitePeriodRevised HeightRevised Body Mass
1Over VindingeNeolithic189.5 cm108.1 kg
2HolmstrupNeolithic189.1 cm107.6 kg
3Schela CladoveiMesolithic187.2 cm105.5 kg
4Barma GrandeEarly Upper Palaeolithic187.0 cm105.3 kg
5PavlovEarly Upper Palaeolithic186.8 cm105.0 kg
6Grotte des EnfantsEarly Upper Palaeolithic185.7 cm103.8 kg
7GrydehøjNeolithic185.2 cm103.2 kg
8Schela CladoveiMesolithic184.2 cm102.1 kg
9Schela CladoveiMesolithic183.5 cm101.4 kg
10SunghirEarly Upper Palaeolithic183.2 cm101.0 kg

A Simple Engineering Problem

A typical Stonehenge bluestone weighs approximately:

4 tonnes (4,000 kg)

If eight equally spaced carriers support the stone using flexible carrying poles, the simple static calculation becomes:

4,000 kg ÷ 8 = 500 kg per carrier

At first sight, this appears impossible.

However, this calculation represents only the stone’s static weight.

It ignores two important engineering realities.

The first is the exceptional body size of the prehistoric workforce reconstructed in the previous chapters.

The second is the mechanical behaviour of flexible carrying poles.

This calculation also represents the maximum static load. It assumes a perfectly rigid carrying frame, no elastic energy storage, no redistribution of dynamic forces and no practical engineering solutions. In other words, it assumes the least efficient carrying system imaginable. Real prehistoric engineering almost certainly did not operate in this way.

Table 7.3 – Top 20 “Giants” (≥180 cm)

RankSitePeriodHeightft/inBody Mass
1Over VindingeNeolithic189.56 ft 3 in108.1
2HolmstrupNeolithic189.16 ft 2 in107.6
3Schela CladoveiMesolithic187.26 ft 2 in105.5
4Barma GrandeEarly Upper Palaeolithic187.06 ft 2 in105.3
5PavlovEarly Upper Palaeolithic186.86 ft 2 in105.0
6Grotte des EnfantsEarly Upper Palaeolithic185.76 ft 1 in103.8
7GrydehøjNeolithic185.26 ft 1 in103.2
8Schela CladoveiMesolithic184.26 ft 1 in102.1
9Schela CladoveiMesolithic183.56 ft 0 in101.4
10SunghirEarly Upper Palaeolithic183.26 ft 0 in101.0
11GjerrildNeolithic183.16 ft 0 in100.9
12BorreNeolithic183.16 ft 0 in100.9
13PredmostíEarly Upper Palaeolithic183.06 ft 0 in100.8
14LangebjergNeolithic182.56 ft 0 in100.3
15PohoreliceNeolithic182.46 ft 0 in100.1
16Franzhausen IVNeolithic182.16 ft 0 in99.8
17Franzhausen VNeolithic181.95 ft 11.6 in99.6
18Parabita (Veneri)Early Upper Palaeolithic181.45 ft 11.4 in99.0
19Franzhausen IVNeolithic181.35 ft 11.4 in98.9
20ToedlingNeolithic180.85 ft 11.2 in98.4

Human Strength Has Been Underestimated

Modern strength sports provide an objective comparison.

Current raw deadlift records show:

Weight ClassMaximum Deadlift
93 kg383 kg
105 kg400 kg
120 kg410 kg
120+ kg490 kg

These performances are achieved by modern athletes who train for competition rather than daily heavy transport.

Modern heavyweight athletes demonstrate these performances despite living largely sedentary lives outside training, consuming highly processed diets and preparing specifically for sporting competition.

By contrast, the reconstructed prehistoric males examined in this study lived entirely different lives. Their daily existence involved felling trees, quarrying stone, transporting timber, excavating earthworks, constructing monuments, hunting and travelling on foot. Physical strength was not a recreational pursuit; it was an essential requirement for survival.

Whether every prehistoric man possessed exceptional strength is irrelevant.

Only a relatively small number of exceptionally powerful individuals would have been required.

Why Flexible Poles Matter

The assumption that prehistoric people carried stones on rigid beams is almost certainly incorrect.

Freshly cut timber naturally bends.

That bending stores elastic energy.

Modern engineering describes this behaviour using beam-deflection theory:

(Underestimating the Physical Size of Prehistoric Europeans - Cro-Magnons?)
(Underestimating the Physical Size of Prehistoric Europeans – Cro-Magnons?)

The prehistoric builders did not require this mathematics.

Thousands of years of practical experience moving timber, constructing monuments and engineering waterways would have taught them a much simpler lesson:

Flexible poles are easier to carry than rigid ones.

This observation requires no mathematical understanding. Anyone who has carried a freshly cut tree trunk instinctively recognises that a green pole behaves differently from a rigid beam. The pole bends, stores energy and returns it during the following stride. Modern beam mechanics merely explains a principle prehistoric engineers almost certainly discovered through practical experience.

If these communities were capable of constructing canals, monumental earthworks and transporting multi-tonne stones over many generations, selecting the most efficient carrying poles would have represented one of the simplest engineering problems they encountered. Practical engineering almost always precedes scientific explanation.

As the carriers walked, the poles bent and straightened, absorbing much of the vertical shock produced by each step.

Instead of repeatedly accelerating the entire four-tonne stone upwards, the poles temporarily stored part of that energy before returning it during the following stride.

The result is a smoother, more stable carrying system requiring less effort than an equivalent rigid beam.


Table 7.4 – Hall of Fame

RankIndividualPeriodHeightft/inRevised Body Mass
1Over VindingeNeolithic189.5 cm6 ft 3 in108.1 kg
2HolmstrupNeolithic189.1 cm6 ft 2 in107.6 kg
3Schela CladoveiMesolithic187.2 cm6 ft 2 in105.5 kg
4Barma GrandeEarly Upper Palaeolithic187.0 cm6 ft 2 in105.3 kg
5PavlovEarly Upper Palaeolithic186.8 cm6 ft 2 in105.0 kg
6Grotte des EnfantsEarly Upper Palaeolithic185.7 cm6 ft 1 in103.8 kg
7GrydehøjNeolithic185.2 cm6 ft 1 in103.2 kg
8PredmostíEarly Upper Palaeolithic183.0 cm6 ft 0 in100.8 kg

Boats Remove the Greatest Engineering Obstacle

Much of the traditional transport debate assumes the bluestones were dragged over enormous distances across land.

Yet once water transport is accepted, the engineering changes dramatically.

A boat supports almost the entire weight of the stone.

The engineering challenge, therefore, shifts from transporting four tonnes across Britain to moving four tonnes only between the quarry, the shoreline, the landing place and its final position within the monument.

Every metre carried by water removes a metre that does not need to be engineered across land.

The final land transport may therefore have consisted of carrying the bluestone from the landing place to its final position within the monument—a distance measured in tens of metres rather than hundreds of kilometres.

This is a completely different engineering problem.

Instead of asking how to haul four tonnes across Britain, we need only ask how to carry it a comparatively short distance using experienced men and practical engineering.


(Underestimating the Physical Size of Prehistoric Europeans - Cro-Magnons?)
(Underestimating the Physical Size of Prehistoric Europeans – Cro-Magnons?)

The Larger Sarsens

The bluestones represent only part of the engineering problem.

The largest Stonehenge sarsens weigh approximately 25 tonnes, about six times as much as the average bluestone. Traditional reconstructions therefore increase the workforce by a similar factor, often proposing enormous hauling parties involving many dozens or even hundreds of individuals.

The revised anthropometric model suggests a different picture.

If a typical four-tonne bluestone could be managed by a specialist team of around eight exceptionally robust men over the final land section, then a simple scaling exercise suggests that a twenty-five-tonne sarsen would require fewer than forty men under similar conditions. Even allowing for additional safety margins, this remains a comparatively small specialist workforce rather than the vast labour forces frequently illustrated in archaeological reconstructions.

More importantly, transport should not be viewed as a single continuous overland operation.

The engineering almost certainly changed according to the landscape.

Overland movement between the quarry and the river could have used wheeled carts or sledges along prepared routes. If the parallel cart tracks identified beneath the Stonehenge Avenue prove to represent prehistoric engineering rather than later disturbance, they provide a possible example of exactly this type of specialist transport system.

Once the stones reached navigable water, the engineering changed again.

Rather than dragging twenty-five tonnes across the countryside, prehistoric engineers needed only to load the stone once.

Simple timber A-frames, crib structures or lifting frames, combined with controlled use of river tides, would have allowed the effective height of the shoreline to rise and fall naturally. The incoming tide effectively serves as a hydraulic lift, reducing the lifting height required to transfer a stone between land and boat. As the tide falls, exactly the same process operates in reverse at the destination.

Such methods require planning rather than complexity.

They exploit the predictable behaviour of water instead of attempting to overcome it.

If, as argued throughout this volume, these communities possessed an intimate understanding of post-glacial rivers, groundwater behaviour and tidal systems, then using water itself as part of the engineering solution becomes not only plausible but entirely logical.

The engineering challenge, therefore, shifts once again.

Rather than asking how prehistoric people dragged twenty-five tonnes across southern Britain, we should ask how experienced hydraulic engineers exploited rivers, tides and short overland transport stages to minimise the work required.

The difference between those two questions is profound.


The Minimum Practical Workforce

Using our revised anthropometric model, the engineering field no longer requires dozens of workers.

The purpose of this calculation is not to determine the exact number of carriers employed on every occasion.

Its purpose is to demonstrate that the workforce required may have been dramatically smaller than traditionally assumed.

Once realistic prehistoric body size, practical engineering and flexible carrying systems are introduced, transport by as few as eight exceptionally robust prehistoric men becomes a credible engineering proposition rather than an archaeological impossibility.

Whether the actual team comprised eight, nine or ten men is largely irrelevant.

The important conclusion is that the required workforce becomes remarkably small once realistic body size and practical carrying methods are taken into account.

The enormous labour forces proposed in many traditional reconstructions are therefore no longer necessary for engineering.

(Underestimating the Physical Size of Prehistoric Europeans - Cro-Magnons?)
(Underestimating the Physical Size of Prehistoric Europeans – Cro-Magnons?)

The Wider Engineering Implications

The consequences extend far beyond the Stonehenge bluestones.

Every prehistoric engineering calculation begins with the workforce.

If the workforce has been underestimated, then every estimate of manpower, lifting capacity, construction time and engineering capability must also be reconsidered.

The same anthropometric correction applies equally to the transport of the larger sarsen stones, the construction of Avebury, Silbury Hill, long barrows, monumental earthworks, prehistoric canals and every other project that depended upon organised human labour.

One revised anthropometric model changes every engineering calculation built upon it.

This is precisely why the revised database matters.

The study includes 258 reconstructed prehistoric European males, of whom 13 were from Britain. Within that European dataset, 15 individuals (5.8% – more than 1 in 20) exceeded 100 kg in reconstructed body mass. These skeletons represent only a minute fraction of the prehistoric population, yet they demonstrate that exceptionally large and powerful men formed a recurring component of prehistoric society. The engineering of major monuments would almost certainly have relied upon these physically exceptional individuals rather than upon an average cross-section of the population.

Stonehenge is therefore not an isolated problem.

It is simply the first monument where the engineering consequences of a revised prehistoric workforce can be examined directly.


A Different Picture of Stonehenge

Stonehenge begins to look less like an impossible engineering miracle and more like the product of experienced builders using simple but highly effective technology.

No cranes.

No iron.

No wheels.

No elaborate timber highways.

Instead:

• robust prehistoric men,

• carefully selected flexible carrying poles,

• rope,

• boats,

• and generations of practical engineering knowledge.

The same people capable of constructing monumental earthworks, excavating prehistoric canals and organising large-scale building projects would have possessed little difficulty identifying which timbers carried heavy loads most efficiently. They did not require a knowledge of beam mechanics; they only needed experience.

Practical engineering almost always precedes scientific explanation.

That experience, accumulated over thousands of years, may have transformed the transport of the Stonehenge bluestones from an extraordinary archaeological mystery into a straightforward engineering exercise.


(Underestimating the Physical Size of Prehistoric Europeans - Cro-Magnons?)
(Underestimating the Physical Size of Prehistoric Europeans – Cro-Magnons?)

Conclusion

The conventional Stonehenge transport model relies on assumptions about prehistoric people.

Those assumptions have now been challenged.

The revised anthropometric database demonstrates that prehistoric Europeans were generally larger and more robust than traditional archaeological reconstructions have suggested. More significantly, among the 258 anatomically reconstructed prehistoric European males examined in this study, 15 individuals (5.8%, or more than one in every twenty) possessed reconstructed body masses exceeding 100 kilograms, placing them within the physical range of modern heavyweight strength athletes.

These figures should not be misunderstood.

The archaeological record does not represent a prehistoric census. It represents only an extraordinarily small surviving sample recovered by chance over thousands of years. The probability of recovering the complete skeletons of the largest and strongest individuals from populations numbering many thousands is therefore extremely small. Absolute proof of the physical characteristics of the elite construction workforce may never be available simply because the archaeological odds are overwhelmingly against their preservation and discovery.

More importantly, prehistoric monument construction would never have relied upon the average member of society.

A project such as Stonehenge did not require the participation of every able-bodied man. It required a relatively small specialist workforce selected for experience, practical engineering knowledge and physical capability. If a construction team numbered only fifty men, then it is entirely reasonable to expect that they represented the strongest individuals available rather than an average cross-section of the population. Modern society operates in exactly the same way. Elite athletes, heavyweight powerlifters, specialist construction workers and crane operators represent only a tiny proportion of the population, yet they perform tasks beyond the capabilities of most people.

The archaeological sample therefore almost certainly under-represents the very individuals most likely to have built Britain’s megalithic monuments.

Once this revised workforce is incorporated into engineering calculations, the transport problem changes fundamentally.

The four-tonne bluestones no longer require the enormous labour forces traditionally portrayed in archaeological reconstructions.

Nor do the largest sarsens necessarily demand hundreds of workers. At approximately 25 tonnes, the largest sarsens weigh around 6 times as much as a typical bluestone. Scaling the engineering accordingly suggests specialist workforces of fewer than forty exceptionally robust men rather than the vast hauling parties commonly illustrated.

Combined with prepared routes, wheeled carts where appropriate, timber lifting frames, boats and the controlled use of river tides as natural hydraulic lifts, the engineering becomes both practical and entirely consistent with the capabilities demonstrated elsewhere throughout prehistoric Britain.

The implications extend far beyond Stonehenge.

Every published engineering calculation based upon modern anthropometric assumptions must now be reconsidered. The transport of sarsens, the construction of Avebury, Silbury Hill, prehistoric canals, monumental earthworks and every other large engineering project depends upon the physical characteristics of the workforce that built them.

Stonehenge is not the exception.

It is simply the first monument in which those assumptions have been directly challenged.

If prehistoric Europeans have been systematically underestimated in both height and body mass, then prehistoric engineering has also been systematically underestimated.

The greatest mystery may not be how Stonehenge was built.

It may be why archaeology has spent more than a century attempting to solve prehistoric engineering problems using the wrong anthropometric model.

(Underestimating the Physical Size of Prehistoric Europeans - Cro-Magnons?)
(Underestimating the Physical Size of Prehistoric Europeans – Cro-Magnons?)

Data

These are the databases used for the article: The European Data Set is the full 2177 specimens in their original contexts, with notes on the column identifiers and methodology. The second Database is my amended extract that is used in this blog.

PODCAST

Author’s Biography

Robert John Langdon, a polymathic luminary, emerges as a writer, historian, and eminent specialist in LiDAR Landscape Archaeology.

His intellectual voyage has been interwoven with stints as an astute scrutineer in government and grand corporate bastions, a tapestry spanning British Telecommunications, Cable and Wireless, British Gas, and the esteemed University of London.

A decade hence, Robert’s transition into retirement unfurled a chapter of insatiable curiosity. This phase saw him immerse himself in Politics, Archaeology, Philosophy, and the enigmatic realm of Quantum Mechanics. His academic odyssey traversed the venerable corridors of knowledge hubs such as the Museum of London, University College London, Birkbeck College, The City Literature Institute, and Chichester University.

In the symphony of his life, Robert is a custodian of three progeny and a pair of cherished grandchildren. His sanctuary lies ensconced in the embrace of West Wales, where he inhabits an isolated cottage, its windows framing a vista of the boundless sea – a retreat from the scrutinising gaze of Her Majesty’s Revenue and Customs, an amiable clandestinity in the lap of nature.

Exploring Prehistoric Britain: A Journey Through Time

My blog delves into the fascinating mysteries of prehistoric Britain, challenging conventional narratives and offering fresh perspectives grounded in cutting-edge research, particularly LiDAR technology. I invite you to explore some key areas of my research. For example, the Wansdyke, often cited as a defensive structure, is re-examined in light of new evidence. I’ve presented my findings in my blog post Wansdyke: A British Frontier Wall – ‘Debunked’, and a Wansdyke LiDAR Flyover video further visualises my conclusions.

My work also often challenges established archaeological dogma. I argue that many sites, such as Hambledon Hill, commonly identified as Iron Age hillforts, are not what they seem. My posts Lidar Investigation Hambledon Hill – NOT an ‘Iron Age Fort’ and Unmasking the “Iron Age Hillfort” Myth explore these ideas in detail and offer an alternative view. Similarly, sites like Cissbury Ring and White Sheet Camp receive re-evaluations based on LiDAR analysis in my posts “Lidar Investigation Cissbury Ring through time” and “Lidar Investigation White Sheet Camp, revealing fascinating insights into their true purpose. I have also examined South Cadbury Castle, often linked to the mythical Camelot56.

My research also extends to ancient water management, including the role of canals and other linear earthworks. I have discussed the true origins of Car Dyke in multiple posts, including Car Dyke – ABC News Podcast and Lidar Investigation Car Dyke – North Section, which suggest a Mesolithic origin 2357. I also explore the misidentification of Roman aqueducts, as seen in my posts on the Great Chesters (Roman) Aqueduct. My research has also been greatly informed by my post-glacial flooding hypothesis, which has helped explain landscape transformations over time. I have discussed this hypothesis in several posts, including AI now supports my Post-Glacial Flooding Hypothesis and Exploring Britain’s Flooded Past: A Personal Journey

Finally, my blog also investigates prehistoric burial practices, as seen in Prehistoric Burial Practices of Britain and explores the mystery of Pillow Mounds, often mistaken for medieval rabbit warrens, but with a potential link to Bronze Age cremation in my posts: Pillow Mounds: A Bronze Age Legacy of Cremation? and The Mystery of Pillow Mounds: Are They Really Medieval Rabbit Warrens?. My research also includes astronomical insights into ancient sites, for example, in Rediscovering the Winter Solstice: The Original Winter Festival. I also review new information about the construction of Stonehenge in The Stonehenge Enigma.

Further Reading

For those interested in British Prehistory, visit www.prehistoric-britain.co.uk, a comprehensive resource featuring an extensive collection of archaeology articles, modern LiDAR investigations, and groundbreaking research. The site also includes insights and excerpts from the acclaimed Robert John Langdon Trilogy, a series of books that explore Britain during the Prehistoric period. Titles in the trilogy include The Stonehenge Enigma, Dawn of the Lost Civilisation, and The Post-Glacial Flooding Hypothesis, which offer compelling evidence of ancient landscapes shaped by post-glacial flooding.

To further explore these topics, Robert John Langdon has developed a dedicated YouTube channel featuring over 100 video documentaries and investigations that complement the trilogy. Notable discoveries and studies showcased on the channel include 13 Things that Don’t Make Sense in History and the revelation of Silbury Avenue – The Lost Stone Avenue, a rediscovered prehistoric feature at Avebury, Wiltshire.

In addition to his main works, Langdon has released a series of shorter, accessible publications, ideal for readers delving into specific topics. These include:

For active discussions and updates on the trilogy’s findings and recent LiDAR investigations, join our vibrant community on Facebook. Engage with like-minded enthusiasts by leaving a message or contributing to debates in our Facebook Group.

Whether through the books, the website, or interactive videos, we aim to provide a deeper understanding of Britain’s fascinating prehistoric past. We encourage you to explore these resources and uncover the mysteries of ancient landscapes through the lens of modern archaeology.

For more information, including chapter extracts and related publications, visit the Robert John Langdon Author Page. Dive into works such as The Stonehenge Enigma or Dawn of the Lost Civilisation, and explore cutting-edge theories that challenge traditional historical narratives.

Other Blogs

s

t

The Cheddar Man Hoax

CSI Cheddar Man – Examining the Evidence

Before discussing skin colour, eye colour, hair colour, race, ancestry, or the famous BBC reconstruction, we must first examine the actual evidence.

Not the headlines.

Not the artwork.

Not the political arguments.

The DNA report itself.

Like any forensic investigation, the first question is simple:

How reliable is the evidence upon which the conclusions are based?

If the foundations are uncertain, then every subsequent interpretation must be treated with caution.

This chapter, therefore, examines the report exactly as a forensic investigator might examine witness testimony in a courtroom: statement by statement, assumption by assumption, conclusion by conclusion.

The Cheddar Man Hoax

Exhibit A: Eye Colour

Report Statement

“There is 1 locus (LOC105374875 rs12896399) with low coverage (1x), hence a heterozygote is possible.”

CSI Observation

The report immediately acknowledges uncertainty. One of the key genetic markers used in the prediction was observed only once. In modern genetic analysis, a single read provides far less confidence than multiple independent observations. The authors, therefore, cannot be certain whether they are observing the complete genotype or only part of it.


Report Statement

“Prediction includes a range that includes what the 1x coverage found (ancestral G allele) and the possibility of an A-derived allele being present.”

CSI Observation

The prediction is therefore not based solely upon observed evidence. It is partly based on hypothetical genetic combinations that may exist but have not been directly observed.

The Cheddar Man Hoax

Report Statement

Blue eye: 0.564–0.711

Intermediate eye: 0.189–0.143

Brown eye: 0.247–0.145

CSI Observation

The software does not produce a single answer. It produces three competing probabilities. Brown remains possible. Intermediate remains possible. Blue remains possible. The model itself is expressing uncertainty.


Report Statement

“Final prediction: Intermediate (blue/green) eye colour.”

CSI Observation

Notice what has happened. Multiple probabilities have now been converted into a single descriptive conclusion. Yet the underlying model still contains alternative outcomes.


Report Statement

“It is certainly not a brown-eyed or clear blue-eyed individual.”

CSI Observation

This is perhaps the most revealing sentence in the entire eye-colour section. The report explicitly states that Cheddar Man was neither brown-eyed nor clear blue-eyed. Yet many subsequent headlines simply described him as ‘blue-eyed’. The report and the headlines are not saying the same thing.


Exhibit B: Hair Colour

Report Statement

“There is 1 locus PIGU rs2378249 with low coverage (1x), hence a heterozygote is possible.”

CSI Observation

Again, we encounter the same problem. One of the markers used to predict hair colour was only observed once. The authors, therefore, acknowledge that an alternative genotype may exist but remain undetected.


Report Statement

Blond: 0.009

Brown: 0.692–0.741

Red: 0.006–0.012

Black: 0.292–0.237

CSI Observation

The model strongly favours brown hair. Black hair remains a secondary possibility. Red hair and blond hair are assigned very low probabilities.


The Cheddar Man Hoax

Report Statement

“Final Prediction: Dark Brown/Black hair colour.”

CSI Observation

This conclusion is reasonable based on the probability table. However, it is important to note that the strongest probability favours brown hair rather than black hair.


Report Statement

“This individual would be perceived as having dark brown hair. However, black cannot be ruled out.”

CSI Observation

The report itself is considerably more cautious than many later reconstructions. Dark brown is presented as the preferred interpretation. Black remains one possible alternative.


CSI Question

If the report favours dark brown hair, why do many reconstructions depict almost jet-black hair?


Exhibit C: Skin Pigmentation

Report Statement

“There are 3 loci missing.”

CSI Observation

This is arguably the single most important sentence in the entire report. Three pigmentation markers contain no data whatsoever. They are absent from the genetic record.


Report Statement

“The profile does contain 2 loci with low coverage (n=1x).”

CSI Observation

In addition to the three missing markers, two additional markers were observed only once. The prediction, therefore, contains both missing information and uncertain information simultaneously.


The Cheddar Man Hoax

Report Statement

“When factoring in possible genotype combinations, a prediction range may be generated.”

CSI Observation

The report is not calculating a single answer. It is generating multiple possible outcomes because the complete genetic profile is unknown.


Report Statement

“The range consists of assuming the two loci with low coverage are correct as homozygote for their sequenced allele…”

CSI Observation

The model must now make assumptions. It assumes that the single observed allele is representative of the complete genotype. This may be correct, but it remains an assumption rather than a direct observation.


Report Statement

“…and omitting the 3 missing loci from the prediction model as they have no coverage…”

CSI Observation

The model is now attempting to predict appearance while simultaneously lacking three pieces of relevant information.


Report Statement

“…to including these SNPs with their ancestral… and also their derived allele counterparts.”

CSI Observation

The software, therefore, models multiple genetic scenarios because the true genotype is unknown.


Report Statement

Intermediate: 0.152–0.038

Dark-Black: 0.848–0.962

CSI Observation

These values are not observations. They are statistical outputs generated from a model operating with missing loci, low-coverage loci, and multiple possible genotype combinations.


Report Statement

“If we omit the three missing alleles, our tool produces 0.752 and 0.248 probabilities…”

CSI Observation

This may be the most damaging sentence in the entire report. By changing the assumptions, the model produces dramatically different results. This demonstrates how sensitive the prediction is to missing information.


The Cheddar Man Hoax

Report Statement

“The missing loci certainly impact on this prediction.”

CSI Observation

The authors explicitly acknowledge that the missing data affects the outcome.


Report Statement

“It is therefore best to have some allele present to infer the most probable range for Cheddar Man.”

CSI Observation

Notice the wording. The report is not observing the complete genotype. It is inferring a probable range from incomplete information.


Report Statement

“It is unlikely that this individual has the darkest possible pigmentation, but it cannot be ruled out.”

CSI Observation

Again, the report is discussing possibilities rather than certainties.


Report Statement

“Better sequencing coverage would clarify to what degree this individual has a dark complexion.”

CSI Observation

This sentence alone demonstrates that the issue remains unresolved. If better sequencing could alter the prediction, then the current prediction cannot be regarded as definitive.


Exhibit D: The Reliability Problem

At this point, a pattern emerges.

The report repeatedly uses the language of uncertainty:

“possible”

“heterozygote”

“prediction range”

“cannot be ruled out”

“better coverage would clarify”

“missing loci”

“infer”

These are not the words of certainty.

They are the words of probability.

The authors themselves repeatedly acknowledge uncertainty.

Yet by the time the public encountered Cheddar Man, much of this uncertainty had vanished.


The Cheddar Man Hoax

CSI Verdict

The report does not present a photograph.

The report does not present certainty.

The report presents a statistical model operating on incomplete ancient DNA.

The eye-colour prediction contains low-coverage markers.

The hair-colour prediction contains low-coverage markers.

The skin-colour prediction contains both low-coverage markers and completely missing loci.

The authors repeatedly acknowledge these limitations.

The real mystery, therefore, is not Cheddar Man.

The real mystery is how a report built upon uncertainty, assumptions, probability ranges and incomplete genetic information became a single face presented to millions of people as historical reality.

The Cheddar Man Hoax

How DNA Predictions Actually Work

Before continuing our investigation, we need to understand what the Cheddar Man report is actually doing.

Many people imagine that scientists recover ancient DNA and simply read the result:

Eye colour: Blue

Hair colour: Brown

Skin colour: Dark

Unfortunately, it is nothing like that.

The reality is considerably more complicated.

Understanding this process is essential because many of the report’s conclusions depend not on direct observation but on statistical prediction.


DNA Does Not Contain Labels

DNA does not contain a sentence that says:

“This individual had blue eyes.”

Nor does it contain a sentence that says:

“This individual had dark skin.”

Instead, scientists examine specific locations within the genome known as SNPs (Single Nucleotide Polymorphisms).

Think of these as tiny switches.

Certain combinations of switches are statistically associated with particular traits.

For example:

Some combinations are more common among people with blue eyes.

Some combinations are more common among people with brown eyes.

Some combinations are more common among people with darker pigmentation.

The prediction system, therefore, works backwards.

Instead of observing the colour directly, it attempts to infer the most likely appearance from a collection of genetic markers.


The Cheddar Man Hoax

Why Multiple Markers Are Needed

No single marker determines eye colour.

No single marker determines hair colour.

No single marker determines skin colour.

Instead, multiple genes interact.

The software, therefore, examines many locations simultaneously and combines them into a probability model.

This is important.

The software is not identifying a colour.

It is calculating the likelihood of different colours.

This is why the report produces percentages.

The model is effectively asking:

“Based upon the markers available, how often does this genetic pattern occur in people with blue eyes?”

The answer might be:

71%.

That does not mean the individual had blue eyes.

It means the model estimates a 71% probability.

The Cheddar Man Hoax

Why The Results Are Not Yes Or No

Most people expect science to provide definitive answers.

The problem is that biology rarely behaves that way.

Imagine a genetic profile that resembles:

70% of blue-eyed people

20% of green-eyed people

10% of brown-eyed people

The software cannot honestly answer:

Blue.

Instead, it produces probabilities.

This is exactly what we see in the Cheddar Man report.


What Is Coverage?

This is where the report becomes particularly important.

When scientists sequence DNA, they do not read a marker once and immediately trust the result.

Instead, they attempt to read it repeatedly.

Each successful read is known as coverage.

For example:

1x coverage = read once

5x coverage = read five times

10x coverage = read ten times

30x coverage = read thirty times

The more times a marker is observed, the greater the confidence that the result is correct.

The Cheddar Man Hoax

Why Ancient DNA Is Different

Modern forensic DNA usually comes from living individuals or recent biological samples.

Ancient DNA is very different.

Cheddar Man died approximately 10,000 years ago.

During that time, the DNA has been exposed to:

  • moisture
  • bacteria
  • chemical degradation
  • temperature change
  • physical decay

As a result, much of the original DNA has been damaged or lost.

Scientists, therefore, recover fragments rather than complete genetic sequences.


Why 1x Coverage Is A Problem

Imagine tossing a coin.

If you toss it once and obtain heads, can you conclude that the coin always lands heads?

Of course not.

You need multiple observations.

The same principle applies to DNA.

If a marker is observed only once, scientists cannot be completely certain they have captured the full genetic picture.

This is exactly why the report repeatedly states:

“A heterozygote is possible.”

The authors acknowledge that a second allele may exist, but it was simply not observed.

The Cheddar Man Hoax

What Is A Heterozygote?

Every person carries two copies of most genetic markers.

One inherited from their mother.

One inherited from their father.

Suppose the possible variants are:

A

and

G

The possible combinations are:

AA

AG

GG

If scientists only observe one G because coverage is 1x, they cannot know whether the actual genotype is:

GG

or

AG

This uncertainty forces the software to model multiple possibilities.


Why Missing Loci Matter

The report repeatedly refers to missing loci.

A missing locus means:

No data.

No observation.

No result.

The software, therefore, has a choice:

Ignore the marker completely.

Or estimate possible outcomes using statistical modelling.

Neither option is ideal.

This is why the report repeatedly discusses prediction ranges.

The Cheddar Man Hoax

Why The Predictions Change

One of the most revealing passages in the report shows that changing the assumptions yields dramatically different probabilities of pigmentation.

This happens because the model is attempting to fill gaps in incomplete information.

In simple terms:

Change the assumptions.

Change the outcome.

That does not mean the model is wrong.

It means the model is sensitive to missing information.


The Critical Distinction

This is the single most important point in the entire debate.

The report does not directly observe:

Eye colour.

Hair colour.

Skin colour.

Instead, it observes genetic markers and then uses a statistical model to estimate the most likely appearance.

The final result is therefore not an observation.

It is an inference.

And the reliability of that inference depends entirely upon the quality and completeness of the DNA available.

This distinction will become crucial when we examine how a report filled with probabilities, assumptions, missing loci and low-coverage markers eventually became a single face presented to the public as historical reality.

The Cheddar Man Hoax

The Wider Dataset – Do The Other Hunter-Gatherers Support The Headlines?

Having examined the Cheddar Man report in detail, the next question is obvious:

Was Cheddar Man unique?

Or do the other Mesolithic genomes support the popular narrative that Europe’s early hunter-gatherers were a uniform population of dark-skinned, blue-eyed people?

The answer is no.

The wider dataset reveals considerably more variation than most newspaper headlines ever acknowledged.


Exhibit 1: La Braña (Spain)

La Braña is often cited alongside Cheddar Man because the DNA results appear superficially similar.

Report Conclusion

Eyes:
Intermediate (green/hazel)

Hair:
Black/Dark Brown

Skin:
Dark to Dark-Black

CSI Observation

At first glance, La Braña appears to support the Cheddar Man narrative.

However, the same limitations remain present:

  • phenotype prediction rather than direct observation
  • probability modelling
  • incomplete ancient DNA
  • reconstruction through statistical inference

Most importantly, La Braña does not demonstrate that all Western Hunter-Gatherers looked alike.

It merely shows that another individual produced a similar probability profile.

One additional example is not proof of a continental population.


The Cheddar Man Hoax

Exhibit 2: Loschbour (Luxembourg)

Loschbour is where the simplistic narrative begins to break down.

Report Conclusion

Eyes:
Intermediate blue/green

Hair:
Dark Brown/Black

Skin:
Intermediate

CSI Observation

This result differs significantly from both Cheddar Man and La Braña.

The same prediction system now produces a substantially lighter complexion.

If the popular narrative were correct, we would expect all three individuals to cluster tightly together.

Instead, variation immediately appears.

The dataset itself, therefore, demonstrates that pigmentation diversity already existed among Western Hunter-Gatherers.


Exhibit 3: Sven (Carsington Pasture Cave)

Sven is rarely mentioned in media discussions.

Report Conclusion

Dark Hair

Intermediate to Dark Skin

CSI Observation

Again the prediction does not fit a simplistic black-versus-white framework.

Instead we find another combination occupying the middle ground.

The reality is considerably more complex than the headlines suggest.


What The Authors Actually Concluded

Perhaps the most overlooked part of the entire study is the authors’ own summary.

Rather than claiming a single uniform appearance, the report identifies variation between individuals and suggests that pigmentation characteristics may have varied geographically and temporally.

This is a very different conclusion from the one often presented to the public.


The Cheddar Man Hoax

The Statistical Problem

The media effectively reduced the dataset to:

Cheddar Man = dark skin

Therefore:

All Mesolithic Europeans = dark skin.

This is not how science works.

Three or four individuals cannot be assumed to represent an entire continent.

Even less can they be assumed to represent thousands of years of population history.

The actual dataset demonstrates variation, not uniformity.


The Reconstruction Problem

The public rarely encountered the probability tables.

They rarely encountered the caveats.

They rarely encountered the missing loci or low-coverage markers.

Instead they encountered reconstructed faces.

Once a face is produced, uncertainty tends to disappear.

The reconstruction becomes remembered as evidence, even though it is actually the final stage of a long chain of interpretation.


The Cheddar Man Hoax

CSI Verdict

The wider dataset does not support the simplistic narrative often promoted in newspapers and documentaries.

Instead it demonstrates:

• significant variation between individuals

• differing pigmentation predictions

• differing eye-colour probabilities

• differing skin-colour probabilities

• and the continued presence of uncertainty throughout the dataset.

Far from proving that all Western Hunter-Gatherers shared a single appearance, the study itself suggests a much more diverse and complex picture.

The further we move away from the original DNA and towards the final reconstructions, the more certainty appears.

Yet the underlying evidence remains probabilistic, incomplete and open to multiple interpretations.

That chapter then sets up Chapter 4 perfectly, where you introduce the Cro-Magnon evidence and ask the obvious question:

If blue eyes, lighter pigmentation alleles, and long-headed Cro-Magnon populations already existed in prehistoric Europe, why did the public end up with a reconstruction that many people instinctively associate with a modern African phenotype rather than a Mesolithic European hunter-gatherer?

That’s where the argument starts to become genuinely interesting.

The Cheddar Man Hoax

The Discovery

The Skeleton That Rewrote British History

Few archaeological discoveries in Britain have generated as much public attention as Cheddar Man.

Found in 1903 within Gough’s Cave in Cheddar Gorge, Somerset, the skeleton was immediately recognised as something extraordinary. Unlike the fragmented remains often recovered from prehistoric sites, Cheddar Man was remarkably complete and quickly became one of the most important human discoveries ever made in Britain. Later radiocarbon dating placed the individual in the Early Mesolithic period, approximately 10,000 years ago, making him one of the oldest nearly complete Homo sapiens skeletons ever found in Britain.
For over a century, Cheddar Man remained primarily an archaeological curiosity. He was important because of his age, his preservation, and what he could tell us about the hunter-gatherers who recolonised Britain after the retreat of the last Ice Age. Few outside archaeological circles paid much attention to him. (The Cheddar Man Hoax)

That changed dramatically in 2018.

Suddenly, Cheddar Man was no longer simply Britain’s oldest skeleton. He became a global news story.

Newspapers, television documentaries, museums, and websites across the world announced a remarkable discovery:

Britain’s earliest known inhabitant had dark skin and blue eyes.

The headline spread rapidly.

For some, it was a fascinating scientific revelation. For others, it challenged long-held assumptions about Britain’s ancient population. Social media exploded with debate. Politicians, commentators, journalists, and activists all weighed in on what the discovery supposedly meant.

The reconstruction itself was striking. The face presented to the public showed a man with very dark skin, dark curly hair, and vivid blue eyes. It was an image designed to challenge expectations, and it succeeded spectacularly. Within days, the reconstruction had become one of the most recognisable prehistoric faces in the world.

Yet buried beneath the headlines was a much more interesting question.

What exactly had scientists discovered?

At first glance the answer appears straightforward. Researchers extracted ancient DNA from the petrous portion of Cheddar Man’s skull, one of the densest bones in the human body and often the best source of preserved genetic material. Using modern sequencing techniques, they recovered enough DNA to investigate ancestry, physical traits, and population relationships. The resulting analysis was then used to create a facial reconstruction for television and museum audiences.

Case closed.

Or so it seemed.

However, archaeology has a long history of transforming cautious scientific observations into definitive public narratives. The journey from excavation trench to newspaper headline is rarely straightforward. Data must be interpreted. Models must be constructed. Probabilities must be assigned. Artists must make decisions. Journalists must simplify complex science into a few memorable sentences.

At every stage, uncertainty can become reduced until the final public story appears far more certain than the original evidence ever allowed.

This is particularly important in the case of Cheddar Man because the public generally encountered only the final reconstruction. Few people ever read the genetic reports, the supplementary data, or the technical discussions surrounding the limitations of ancient DNA analysis. Most simply saw the finished image and accepted it as a scientific fact.

But science does not operate through finished images.

Science operates through evidence.

This raises a crucial question.

Was the famous reconstruction simply a visual representation of the available evidence?

Or did the reconstruction become more definitive than the evidence itself?

To answer that question, we must set aside modern assumptions, political arguments, and media headlines. Instead, we must approach the case exactly as a forensic investigator would.

We begin not with conclusions, but with evidence.

The skeleton is our first witness.

The DNA is our second.

The prediction models are our third.

And the media narrative is our fourth.

Only when all four witnesses have been questioned can we determine whether the famous image of Cheddar Man represents a scientific certainty—or merely one possible interpretation among several.

The investigation begins.

The Cheddar Man Hoax

The Media Story

How a Scientific Study Became a Global Headline

Before examining the DNA, we must first examine the story that most people believe.

After all, very few members of the public have ever read a genetics paper. Even fewer have examined supplementary DNA datasets. What most people know about Cheddar Man comes from newspaper articles, television documentaries, museum websites, and social media posts.

In other words, they know the story rather than the evidence.

That distinction is important because the story that emerged in 2018 was remarkably simple.

Britain’s oldest known inhabitant had dark skin and blue eyes.

It was a powerful headline.

It was memorable.

Most importantly, it challenged modern assumptions about ancestry and appearance.

The Natural History Museum described Cheddar Man as a Mesolithic hunter-gatherer with dark skin and blue eyes, and further suggested that populations across Mesolithic Europe possessed similar characteristics.

The accompanying reconstruction reinforced that message visually.

The public was presented with a man possessing very dark skin, tightly curled dark hair, and striking pale blue eyes. The image rapidly became one of the most widely reproduced prehistoric reconstructions ever created.

For journalists, it was the perfect story.

It contained science.

It contained surprise.

It challenged conventional expectations.

And perhaps most importantly, it could be summarised in a single sentence.

Unfortunately, science rarely fits into a single sentence.

The moment a scientific finding is compressed into a headline, something is inevitably lost. Complex statistical probabilities become certainties. Nuance disappears. Caveats vanish. Alternative interpretations are quietly forgotten.

This process is not unique to archaeology.

It happens throughout science.

However, the Cheddar Man story provides a fascinating opportunity to observe the process in real time.

Consider the wording used throughout media reports.

The public repeatedly encountered phrases such as:

“Cheddar Man had dark skin and blue eyes.”

Not:

“The available genetic markers suggest.”

Not:

“The prediction model indicates.”

Not:

“One possible reconstruction.”

Instead, uncertainty largely disappeared, replaced by definitive statements.

This transformation is subtle but important.

Scientific investigations generally deal in probabilities.

Media reports generally deal in conclusions.

The gap between those two approaches is often where misunderstanding begins.

The Natural History Museum article provides a useful example. While discussing pigmentation, the article states:

“He is just one person, but also indicative of the population of Europe at the time. They had dark skin and most of them had pale coloured eyes, either blue or green, and dark brown hair.”

This is a significant claim.

A single individual has effectively become representative of an entire population spanning thousands of kilometres and many generations.

Yet anyone familiar with human populations knows that variation is the rule rather than the exception.

Even within modern populations, physical appearance varies enormously. It would therefore be surprising if Mesolithic Europe, stretching from Iberia to Scandinavia, displayed no comparable diversity.

This raises our first forensic question.

How much of the reconstruction is supported directly by Cheddar Man’s DNA?

And how much derives from broader assumptions regarding Mesolithic populations?

The distinction matters.

Because the public was not shown a range of possibilities.

They were shown a face.

A single face.

A definitive face.

A face that appeared to settle a debate before most people had even seen the evidence.

The reconstruction itself introduces another layer of interpretation.

Facial reconstruction is not the same as photography.

The artists responsible for the reconstruction openly acknowledge that the process combines science and artistic judgement. Measurements are taken from the skull. Tissue depths are estimated using modern comparative datasets. Missing details must be inferred. Hair texture, skin tone, facial expression, and numerous subtle characteristics require interpretation.

This does not make facial reconstruction unscientific.

Far from it.

But it does mean that every reconstruction contains assumptions.

Those assumptions may be reasonable.

They may even be highly probable.

Yet they remain assumptions nonetheless.

This creates an important chain of events:

DNA is analysed.

Genetic markers are selected.

Prediction models generate probabilities.

Scientists interpret those probabilities.

Artists interpret those interpretations.

Journalists simplify the result.

The public receives a finished image.

By the time the process is complete, the final product may appear far more certain than the original evidence ever was.

This is the central issue facing any forensic investigation of Cheddar Man.

The question is not whether the scientists acted in good faith.

Nor is it whether the artists were skilled.

The question is much simpler.

Did the certainty presented to the public accurately reflect the certainty contained within the underlying genetic evidence?

To answer that question, we must leave the headlines behind and examine the primary evidence itself.

The next witness is the DNA.

The Cheddar Man Hoax

The Blue-Eye Mystery

A Trait That Should Not Exist?

If there is one feature that has consistently puzzled geneticists, anthropologists, and evolutionary biologists, it is blue eyes.

Unlike skin colour, which varies continuously across human populations, blue eyes are unusual. They are rare globally and concentrated largely within populations of European ancestry.

For most of human history, the assumption was simple.

Blue eyes evolved relatively recently in northern Europe.

The logic appeared sound. Northern Europe receives less sunlight than equatorial regions. Fair skin and lighter pigmentation were thought to be evolutionary adaptations that improved vitamin D production in low-light environments. Consequently, blue eyes were often viewed as part of the same package of traits.

Then the ancient DNA evidence arrived.

Suddenly, that simple narrative began to unravel.

The genetic analysis of La Braña in Spain suggested that blue eyes were already present amongst European hunter-gatherers thousands of years before the arrival of later farming populations.

Cheddar Man appeared to tell a similar story.

The implication was profound.

Blue eyes may not have originated amongst later northern European populations at all.

They may have been inherited from a much older ancestral population.


Where Do Blue Eyes Come From?

Modern genetic studies suggest that most blue-eyed individuals share a common mutation affecting the regulation of the OCA2 gene.

This gene plays a major role in melanin production, the pigment responsible for skin, hair, and eye colour.

Research discussed in earlier studies suggested that all modern blue-eyed individuals ultimately trace their eye colour to a common ancestral mutation that altered how melanin was expressed within the iris. Rather than producing the high concentrations associated with brown eyes, the mutation reduced melanin production, creating the blue appearance we recognise today.

The important point is that blue eyes are not produced by a separate blue pigment.

There is no blue colouring within the iris.

Instead, blue eyes result from reduced melanin and the way light scatters through the eye.

In other words, blue eyes are a genetic modification of the ancestral brown-eyed condition.

The question, therefore, becomes:

When did this mutation first appear?


The Cheddar Man Hoax

The Problem for Traditional Narratives

The discovery of blue-eyed Mesolithic hunter-gatherers created an immediate problem.

If blue eyes already existed amongst populations such as La Braña and Cheddar Man, then the trait must predate many of the later migrations traditionally used to explain European pigmentation patterns.

This does not automatically tell us where the mutation originated.

However, it does demonstrate that the standard picture of blue eyes emerging alongside fair-skinned farming populations is incomplete.

Blue eyes clearly existed earlier.

The question is how much earlier.

And within which population?


Darwin's Children
The Cheddar Man Hoax

The Neanderthal Question

This is where the investigation becomes considerably more controversial.

Langdon research notes that Neanderthals possessed several pigmentation variants not commonly found in modern populations and that some Neanderthal individuals appear to have possessed lighter pigmentation traits, including red hair and fair skin.

Furthermore, it is now widely accepted that interbreeding occurred between Homo sapiens and Neanderthals, leaving a measurable genetic legacy within modern Eurasian populations.

This naturally raises an intriguing question.

Could traits such as blue eyes have originated within Neanderthal populations and later entered the Homo sapiens gene pool through interbreeding?

At present, the answer is unknown.

The evidence currently available does not allow such a conclusion to be demonstrated.

Nor does it allow it to be completely dismissed.

What can be said is that the existence of blue-eyed hunter-gatherers long before many later population movements suggests that the history of eye colour is likely to be far older and more complex than the simplified narratives often presented in popular media.

The important point is not whether the Neanderthal hypothesis is correct.

The important point is that alternative explanations exist and deserve investigation.

Science progresses by examining possibilities, not by prematurely closing them.


A Trait Looking for an Explanation

By now, the original Cheddar Man story is beginning to look very different.

The popular narrative suggests a simple conclusion:

Cheddar Man had blue eyes.

Yet the supplementary report itself actually describes an intermediate blue-green eye colour rather than clear blue eyes.

The wider European evidence reveals that similar eye-colour patterns already existed elsewhere in Mesolithic Europe.

The genetic history of blue eyes appears considerably older than once believed.

And the ultimate origin of the mutation remains a matter of continuing investigation.

Rather than answering questions, blue eyes create new ones.

Where did the mutation originate?

Why did it spread?

Why did it survive?

And what does its presence reveal about the populations that occupied Europe at the end of the Ice Age?

To answer those questions, we must move beyond pigmentation alone and examine the people themselves.

The next witness is not a genetic marker.

The next witness is the Cro-Magnon population.

The Cheddar Man Hoax

The Forgotten Evidence – The Skull Itself

Looking Beyond Pigmentation

By this point in our investigation, we have spent considerable time discussing skin colour, eye colour and hair colour.

That is understandable.

After all, these are the characteristics that dominated the headlines.

Yet there is an obvious problem.

Pigmentation is only a tiny fraction of what makes a person recognisable.

If two individuals share the same skin colour but have completely different skull shapes, facial structures, and body proportions, they can appear entirely unrelated.

Conversely, individuals with different pigmentation but similar skeletal anatomy may appear closely connected.

This raises an important question.

Why did the public debate surrounding Cheddar Man become almost entirely focused on colouration while largely ignoring the actual skeleton?

Because, unlike the pigmentation predictions, the skull is not a probability.

The skull is evidence.


How Anthropologists Originally Identified Ancient Populations

Long before the development of ancient DNA analysis, anthropologists classified prehistoric populations using skeletal morphology.

They examined:

  • skull shape
  • cranial length
  • cranial height
  • forehead profile
  • eye socket shape
  • nasal aperture
  • cheekbones
  • jaw structure
  • dentition

These characteristics allowed researchers to compare populations across both time and geography.

The presenter in the Cheddar Man documentary notes that Mesolithic hunter-gatherers were traditionally recognised by precisely these skeletal features, and that many displayed robust facial anatomy, powerful mandibles, and pronounced cranial characteristics.

In other words, before DNA entered the discussion, researchers already possessed a substantial body of evidence regarding the physical appearance of these populations.

That evidence did not disappear simply because genetic testing became available.


The Long-Headed Europeans

One of the most frequently recorded observations concerning Europe’s Upper Palaeolithic and Mesolithic populations was their tendency towards long skulls.

Traditional anthropologists referred to these populations as dolichocephalic.

The famous Cro-Magnon skeletons discovered in France were described as possessing:

  • long skulls
  • broad faces
  • low-set square eye sockets
  • strong jaws
  • powerful facial structure

These features became defining characteristics of Europe’s earliest modern populations.

Although many of the racial classifications used by nineteenth-century anthropologists have since been abandoned, the measurements themselves remain part of the archaeological record.

The skulls have not changed.

The measurements have not changed.

Only the terminology has changed.


The Curious Absence of Morphology

This is where the Cheddar Man story becomes rather strange.

The reconstruction was widely discussed because of its skin colour.

Yet comparatively little public attention was paid to the underlying skull morphology.

Most newspaper articles focused on:

  • black skin
  • blue eyes
  • dark hair

Very few discussed:

  • cranial proportions
  • facial architecture
  • jaw structure
  • orbital shape
  • skeletal robustness

Yet these are arguably the characteristics that define a face far more than pigmentation alone.

A person’s skull determines:

  • head shape
  • facial width
  • eye placement
  • nose shape
  • jaw profile
  • chin structure

These features dominate the appearance.

Skin colour merely overlays them.


What The Skull Suggests

The surviving skull formed the foundation of every reconstruction produced.

Without it, there would be no face to reconstruct.

Genetics can estimate pigmentation.

The skull determines the individual.

This distinction is often forgotten.

A pigmentation model can suggest probabilities.

A skull provides measurable anatomy.

Consequently, any attempt to reconstruct Cheddar Man should begin not with skin colour but with the physical evidence of the skeleton itself.

This is exactly how forensic reconstructions are normally performed.

The skeletal structure comes first.

The pigmentation is added later.

Yet much of the public discussion surrounding Cheddar Man reversed this process.

The pigmentation became the story.

The skeleton became secondary.


The Bigger Picture

The result is that many people now associate Cheddar Man with a skin colour rather than a population.

Yet the archaeological evidence suggests he was part of a wider Western Hunter-Gatherer community that occupied much of post-glacial Europe.

These populations possessed physical characteristics extending far beyond pigmentation alone.

To reduce them to a single skin-tone category risks losing sight of the broader biological reality.

The real lesson of Cheddar Man may therefore be that the most important evidence was present from the beginning.

Not the DNA.

Not the reconstruction.

Not the headlines.

But the skull itself.

And it is to that skull, combined with the genetic evidence, that we now turn for our final reconstruction.

The Cheddar Man Hoax

The Cro-Magnon Connection

The Evidence Everyone Forgot

By this point in our investigation, we have spent considerable time examining pigmentation.

Eye colour.

Hair colour.

Skin colour.

Yet there is an obvious problem.

Pigmentation is only a tiny fraction of what makes a human being look the way they do.

A person’s overall appearance is determined by dozens of other characteristics, including skull shape, facial structure, height, robustness, muscle attachment, cranial capacity and body proportions.

This raises an important question.

Why did the public discussion surrounding Cheddar Man become almost entirely focused on skin colour while largely ignoring the rest of the skeleton?

The answer may be because pigmentation generates headlines.

Skull morphology does not.

Yet if we wish to understand who Cheddar Man really was, the rest of the skeleton deserves equal attention.


The Wider Western Hunter-Gatherer Population

The genetic analysis places Cheddar Man within the Western Hunter-Gatherer population that occupied much of Europe following the end of the last Ice Age.

La Braña, the famous Spanish individual frequently cited alongside Cheddar Man, also belongs to this broader population.

This is important because it means that Cheddar Man was not an isolated individual.

He was part of a much larger population network stretching across post-glacial Europe.

The question, therefore, becomes:

What did these people actually look like?

Unfortunately, this is where the public narrative becomes surprisingly selective.

The newspapers focused on skin colour.

The documentaries focused on eye colour.

The headlines focused on race.

Very little attention was paid to the wider physical characteristics of the people themselves.


The Long-Headed Europeans

Long before the development of DNA analysis, Victorian anthropologists devoted enormous effort to measuring prehistoric skeletons.

Their methods were often imperfect, and many of their conclusions are now outdated. However, one observation repeatedly appeared throughout their studies.

Many early European skeletons possessed long skulls.

These were traditionally described as dolichocephalic populations.

The classic Cro-Magnon skeletons discovered in France displayed long skulls, large cranial capacities, strong facial structures and robust physiques. They differed sufficiently from modern Europeans that early researchers initially regarded them as a distinct variety of humanity.

Today, archaeologists classify these individuals as fully modern humans.

However, the physical characteristics remain.

The skulls did not suddenly become round.

The facial structure did not disappear.

The underlying morphology still exists within the archaeological record.


An Uncomfortable Coincidence

This is where the story becomes interesting.

The two most famous Mesolithic individuals associated with pale eyes and darker pigmentation are:

  • Cheddar Man
  • La Braña

Both belong to the Western Hunter-Gatherer population.

Both lived before the arrival of later Neolithic farming populations.

Both are repeatedly used as examples of Europe’s original post-glacial inhabitants.

Yet when modern articles discuss these individuals, almost all attention is directed towards pigmentation, while the wider physical characteristics of these populations receive little mention.

The result is a strange distortion.

Readers are encouraged to focus on a handful of pigmentation markers while largely ignoring the broader biological picture.

It is rather like trying to identify a suspect from their eye colour while ignoring the rest of their face.


More Than Skin Deep

The irony is that the genetic evidence itself repeatedly warns against oversimplification.

The pigmentation models generate probabilities.

The eye-colour predictions contain uncertainty.

The skin-colour predictions contain missing loci.

The hair-colour predictions contain alternative outcomes.

Yet despite all this uncertainty, the public discussion became increasingly focused upon a single characteristic:

Skin colour.

The wider physical appearance of Europe’s hunter-gatherers largely disappeared from view.

This is particularly surprising because prehistoric populations are often identified through combinations of traits rather than isolated characteristics.

Height matters.

Facial structure matters.

Cranial morphology matters.

Body proportions matter.

Population history is rarely written in a single SNP.


The Cro-Magnon Question

This brings us to a question that rarely appears in discussions of Cheddar Man.

If Western Hunter-Gatherers formed part of a wider European population with roots stretching back into the Upper Palaeolithic, how much continuity existed between these Mesolithic groups and the populations traditionally described as Cro-Magnons?

The question is not whether they were identical.

Ten thousand years of separation would make that unlikely.

The question is whether the pigmentation evidence has distracted attention away from broader population continuity.

Because if the discussion focuses solely on skin colour, an enormous amount of archaeological and biological evidence remains unexplored.

The reality may be that Cheddar Man was neither the modern racial symbol presented by some journalists nor the simplistic caricature presented by his critics.

Instead, he may represent part of a much older European population whose appearance was considerably more diverse and complex than modern labels allow.


The Real Lesson

The greatest weakness of the public narrative is not its discussion of pigmentation.

Pigmentation is important.

The weakness is that it discussed little else.

The public was shown a face.

A skin colour.

A pair of eyes.

A headline.

What they were not shown was the uncertainty within genetics, the diversity within Mesolithic populations, or the broader physical characteristics of the people themselves.

In short, they were shown a conclusion before they were shown the evidence.

And that brings us to the final stage of our investigation.

How did a series of probabilities become one of the most famous prehistoric faces ever created?

The next witness is the reconstruction itself.

The Cheddar Man Hoax

Reconstructing Cheddar Man – The Final Verdict

The Most Important Piece of Evidence

Throughout this investigation, enormous attention has been devoted to pigmentation.

Dark skin.

Blue eyes.

Brown hair.

Yet the most important piece of evidence has been sitting in front of us from the beginning.

The skull.

Unlike the pigmentation predictions, which are generated from incomplete DNA and statistical modelling, the skull is real evidence. It belonged to a living individual and survives today.

If a forensic scientist were reconstructing a suspect, they would begin with the skull and only then consider pigmentation.

The public discussion surrounding Cheddar Man largely reversed this process.


What The Skull Tells Us

The skull determines:

  • overall head shape
  • forehead profile
  • facial width
  • eye socket shape
  • nasal structure
  • jaw shape
  • chin shape
  • cheekbone position

These characteristics influence appearance far more than eye colour alone.

Traditional descriptions of Upper Palaeolithic and Mesolithic European populations frequently describe robust facial anatomy, long skulls and broad facial structures associated with the populations historically referred to as Cro-Magnons.

Whether every characteristic applied directly to Cheddar Man is less important than the broader observation:

The skull itself provides the foundation of the reconstruction.

Not the pigmentation.


What The DNA Actually Suggests

Having established the skeletal framework, we can then add the genetic evidence.

The DNA suggests:

Eyes

Not bright blue.

Instead, the report concludes:

Intermediate (blue/green)

and specifically states:

Not a clear blue-eyed individual.

Hair

Brown hair was the strongest prediction.

Dark brown was the author’s interpretation.

Black remained possible but was not the primary result.

Skin

The highest probabilities fell within darker pigmentation categories.

However, three loci were missing, and two others had low coverage, yielding a range of probabilities rather than certainty.


The CSI Reconstruction

If we reconstruct Cheddar Man using only the evidence presented during this investigation, the result would be:

A young Western Hunter-Gatherer male, approximately 5 feet 5 inches tall, with a long Mesolithic skull, robust facial features, broad eye sockets, a prominent nose, brown to dark-brown hair, pale intermediate blue-green eyes and skin pigmentation likely darker than many modern northern Europeans but impossible to define precisely from the available DNA evidence.

That reconstruction is less dramatic than the famous museum version.

It is also closer to the evidence.


The Verdict

After examining the genetics, the supplementary report, the pigmentation models and the wider Mesolithic evidence, the verdict is surprisingly simple.

The famous reconstruction cannot be proven.

Nor can it be disproven.

The evidence supports the possibility of darker pigmentation.

The evidence supports pale eyes.

The evidence supports brown hair.

What the evidence does not support is the level of certainty with which these features were presented to the public.

The DNA produced probabilities.

The scientists produced interpretations.

The artists produced a face.

The media produced a certainty.

And that certainty became the story.

The real lesson of the Cheddar Man case is not that the reconstruction is necessarily wrong.

It is that one possible interpretation became presented as though it were the only interpretation.

The skull is real.

The DNA is incomplete.

The reconstruction is a hypothesis.

And as every good investigator knows, a hypothesis is not the same thing as a proven fact.


PODCAST

Author’s Biography

Robert John Langdon, a polymathic luminary, emerges as a writer, historian, and eminent specialist in LiDAR Landscape Archaeology.

His intellectual voyage has been interwoven with stints as an astute scrutineer in government and grand corporate bastions, a tapestry spanning British Telecommunications, Cable and Wireless, British Gas, and the esteemed University of London.

A decade hence, Robert’s transition into retirement unfurled a chapter of insatiable curiosity. This phase saw him immerse himself in Politics, Archaeology, Philosophy, and the enigmatic realm of Quantum Mechanics. His academic odyssey traversed the venerable corridors of knowledge hubs such as the Museum of London, University College London, Birkbeck College, The City Literature Institute, and Chichester University.

In the symphony of his life, Robert is a custodian of three progeny and a pair of cherished grandchildren. His sanctuary lies ensconced in the embrace of West Wales, where he inhabits an isolated cottage, its windows framing a vista of the boundless sea – a retreat from the scrutinising gaze of Her Majesty’s Revenue and Customs, an amiable clandestinity in the lap of nature.

Exploring Prehistoric Britain: A Journey Through Time

My blog delves into the fascinating mysteries of prehistoric Britain, challenging conventional narratives and offering fresh perspectives grounded in cutting-edge research, particularly LiDAR technology. I invite you to explore some key areas of my research. For example, the Wansdyke, often cited as a defensive structure, is re-examined in light of new evidence. I’ve presented my findings in my blog post Wansdyke: A British Frontier Wall – ‘Debunked’, and a Wansdyke LiDAR Flyover video further visualises my conclusions.

My work also often challenges established archaeological dogma. I argue that many sites, such as Hambledon Hill, commonly identified as Iron Age hillforts, are not what they seem. My posts Lidar Investigation Hambledon Hill – NOT an ‘Iron Age Fort’ and Unmasking the “Iron Age Hillfort” Myth explore these ideas in detail and offer an alternative view. Similarly, sites like Cissbury Ring and White Sheet Camp receive re-evaluations based on LiDAR analysis in my posts “Lidar Investigation Cissbury Ring through time” and “Lidar Investigation White Sheet Camp, revealing fascinating insights into their true purpose. I have also examined South Cadbury Castle, often linked to the mythical Camelot56.

My research also extends to ancient water management, including the role of canals and other linear earthworks. I have discussed the true origins of Car Dyke in multiple posts, including Car Dyke – ABC News Podcast and Lidar Investigation Car Dyke – North Section, which suggest a Mesolithic origin 2357. I also explore the misidentification of Roman aqueducts, as seen in my posts on the Great Chesters (Roman) Aqueduct. My research has also been greatly informed by my post-glacial flooding hypothesis, which has helped explain landscape transformations over time. I have discussed this hypothesis in several posts, including AI now supports my Post-Glacial Flooding Hypothesis and Exploring Britain’s Flooded Past: A Personal Journey

Finally, my blog also investigates prehistoric burial practices, as seen in Prehistoric Burial Practices of Britain and explores the mystery of Pillow Mounds, often mistaken for medieval rabbit warrens, but with a potential link to Bronze Age cremation in my posts: Pillow Mounds: A Bronze Age Legacy of Cremation? and The Mystery of Pillow Mounds: Are They Really Medieval Rabbit Warrens?. My research also includes astronomical insights into ancient sites, for example, in Rediscovering the Winter Solstice: The Original Winter Festival. I also review new information about the construction of Stonehenge in The Stonehenge Enigma.

Further Reading

For those interested in British Prehistory, visit www.prehistoric-britain.co.uk, a comprehensive resource featuring an extensive collection of archaeology articles, modern LiDAR investigations, and groundbreaking research. The site also includes insights and excerpts from the acclaimed Robert John Langdon Trilogy, a series of books that explore Britain during the Prehistoric period. Titles in the trilogy include The Stonehenge Enigma, Dawn of the Lost Civilisation, and The Post-Glacial Flooding Hypothesis, which offer compelling evidence of ancient landscapes shaped by post-glacial flooding.

To further explore these topics, Robert John Langdon has developed a dedicated YouTube channel featuring over 100 video documentaries and investigations that complement the trilogy. Notable discoveries and studies showcased on the channel include 13 Things that Don’t Make Sense in History and the revelation of Silbury Avenue – The Lost Stone Avenue, a rediscovered prehistoric feature at Avebury, Wiltshire.

In addition to his main works, Langdon has released a series of shorter, accessible publications, ideal for readers delving into specific topics. These include:

For active discussions and updates on the trilogy’s findings and recent LiDAR investigations, join our vibrant community on Facebook. Engage with like-minded enthusiasts by leaving a message or contributing to debates in our Facebook Group.

Whether through the books, the website, or interactive videos, we aim to provide a deeper understanding of Britain’s fascinating prehistoric past. We encourage you to explore these resources and uncover the mysteries of ancient landscapes through the lens of modern archaeology.

For more information, including chapter extracts and related publications, visit the Robert John Langdon Author Page. Dive into works such as The Stonehenge Enigma or Dawn of the Lost Civilisation, and explore cutting-edge theories that challenge traditional historical narratives.

Other Blogs

s

t

Stonehenge’s The Lost Circle Revealed – DEBUNKED

13 things that don’t make sense about Waun Mawn (Stonehenge’s The Lost Circle Revealed)

Introduction

According to the BBC documentary, the discovery of the bluestone quarry in Wales was presented as a major breakthrough in understanding Stonehenge. At face value, that seems fair enough. Identifying a potential source for the stones is important.

But this is where the problem begins.

Because from that point onward, the investigation appears to shift away from asking what the evidence actually shows… and toward trying to make the evidence fit an already established timeline.

Instead of examining the quarry independently and comparing it objectively with Stonehenge, the focus becomes finding dates that support a pre-existing conclusion. That is not how science works. When you start with the answer and work backwards, you are no longer testing a hypothesis — you are trying to confirm one.

Craig Rhos-y-Felin is a good example of this.

Craig Rhos-Y-Felin from Stonehenge: The Lost Circle Revealed - Stonehenge's the lost circle
Craig Rhos-Y-Felin: Stonehenge: The Lost Circle Revealed

The site contains clear evidence of Mesolithic activity, particularly in the form of man-made hearths. That should be the starting point for interpretation. Yet the emphasis is instead placed on a small number of later samples that fall closer to the desired Neolithic timeframe.

When those dates still don’t quite align, the solution is not to question the model — it is to introduce another one. A “prototype” stone circle in Wales was later moved to Stonehenge. A theory designed not from evidence, but from necessity.

And so begins a decade-long search for that missing link.

Sites are proposed… then quietly dropped when the dates don’t match. New locations are suggested… then abandoned for the same reason. The pattern repeats. The goal is no longer discovery — it is validation.

Eventually, everything converges on Waun Mawn.

(Stonehenge's The Lost Circle Revealed)
(Stonehenge’s The Lost Circle Revealed)

This is presented as the long-awaited solution. But when you strip it back, the physical evidence is extremely limited. A handful of stones. A small number of possible stone holes. Nowhere near enough to replicate what exists at Stonehenge.

So the gaps are filled in.

Estimates are extended beyond what is actually present. Missing stones are assumed. Layouts are reconstructed from partial data. And suddenly, a fragment becomes a full circle.

Then we come to the dating.

Among a broad range of results spanning several millennia, one sample is highlighted as aligning with the proposed timeline. The rest — which do not support the theory — receive far less attention.

This is the core issue. You cannot treat a single favourable result as definitive while ignoring the wider dataset. That is not strengthening an argument — it is narrowing it.

The same pattern appears in other parts of the interpretation.

(Stonehenge's The Lost Circle Revealed)
(Stonehenge’s The Lost Circle Revealed)

Large stones at the quarry are presented as the source of Stonehenge’s bluestones, despite clear differences in size and shape. No explanation is provided for how they were reduced or reworked.

Transport by water is dismissed, despite experimental demonstrations showing it is entirely possible. Instead, overland transport through heavily forested and waterlogged terrain is presented as the more feasible option — a claim that raises more questions than it answers.

Even the more technical aspects, such as photogrammetry, are used in ways that assume ideal conditions. A stone is said to match a socket, without addressing the simple fact that removing a stone alters the shape of that socket. Basic mechanical realities are overlooked.

And then, towards the end, the programme drifts into broader speculation — cultural movements, symbolic alignments, and generalised astronomical claims. These are presented confidently, but without the level of supporting evidence required to justify them.

Meanwhile, key inconsistencies remain unresolved.

Stonehenge contains 56 bluestone positions. Waun Mawn does not. The construction methods differ. The depth of the stone holes differs. The overall structure is not the same.

These are not small details. There are fundamental differences.

(Stonehenge's The Lost Circle Revealed)
(Stonehenge’s The Lost Circle Revealed)

So what are we left with?

Not a clear, evidence-led conclusion — but a narrative built around selective interpretation. Certain data points are emphasised. Others are downplayed. Gaps are filled with theory rather than evidence.

The result is compelling television.

But it is not robust science.

Because real scientific analysis does not depend on finding the right answer.

It depends on being willing to accept when the evidence points somewhere else entirely.

(Stonehenge's The Lost Circle Revealed)
(Stonehenge’s The Lost Circle Revealed)

The Documentary

Therefore, the last hope for MPP’s reputation and his ’10-year search’ fell upon Waun Mawn, culminating in the BBC documentary “Stonehenge: The Lost Circle Revealed”, shown on the 12th February 2021. In it, he claimed many so-called ‘facts’ which I shall now highlight as ‘not making sense’, with the reasons why.

1. At (13:20) MPP shows signs of human-made quarrying and splitting of Bluestones at Carn Goedog in Wales – unfortunately, there are no extensive excavation reports on this site, just a published review showing that of the 31 carbon dates, only three random samples support his theory and none of the man-made hearths which are Mesolithic (like Craig Rhos-Y-Felin) or late Neolithic.

2. The program showed the suggested quarried stones at Carn Goedog, which are over 12 feet long and 5 feet wide, weighing therefore around 20+ tonnes. The Stonehenge bluestones are, on average, less than six feet high and about 18–24 inches wide, weighing 1-3 tonnes. The review on the site offered no evidence that the stones were cut down and reshaped for the journey to Stonehenge or elsewhere. (Stonehenge’s The Lost Circle Revealed)

Carn Goedog from Stonehenge: The Lost Circle Revealed (Stonehenge's The Lost Circle Revealed)
Carn Goedog – Stonehenge: The Lost Circle Revealed

3. MPP claims that the boat transport method (14.50) was infeasible as they did not have sturdy enough boats to carry the stones on such a journey – Sadly, you do not need a ‘boat’ to transport stones in a river as shown by Atkinson in the 1960’s who employed just four school kids to punt a raft with a 3 tonne stone attached down the Avon. Moreover, he has failed to recognise that the oldest boatyard in the world, located in the Solent (at the end of the Avon), was found with planked wood (and associated wheat grain from Turkey), indicating that substantial seafaring boats were available by the 7th Millennium BCE.

Punting Bluestone down the Avon from Stonehenge: The Lost Circle Revealed (Stonehenge's The Lost Circle Revealed)
Clearly MPP was too young to see this punt down the Avon?

4. Mike Parker-Pearson also suggested that an ‘ox-cart’ route that followed the current A40 was the most feasible way of transporting these stones to Stonehenge. He believed that they dragged these stones over 200 km on wooden sledges – unfortunately, the example shown on the program shows schoolboys dragging a small stone over flat grassland, which would not be available for another 4000+ years and after Stonehenge’s initial construction. At the time of Phase I construction, the environment (as indicated by pollen analysis) shows that 70% of the terrain was woodland and forest, and the remaining 30% was mostly rivers and swampland, making such an endeavour impossible.

5. The Discovery (21:15) of ‘random’ hazel nuts at Craig Rhos-Y-Felin provides MPP’s required date for Stonehenge of 3300 BCE (which is still 500 years before MPP’s supposed construction date) – This clear ‘cherry picking’ of the archaeological evidence is ‘Bad Science’. To take just two carbon dates from over 40 at the Craig-Rhos-Y-Felin site and ignoring the more solid man-made hearth dates, which are Mesolithic and moreover, compatible with 26 carbon dates found at Stonehenge, is plainly a falsehood.

6. When they eventually found their target site (36:15), Waun Mawn (after many claims that other sites were “the one we have been looking for” to eventually find that the carbon dating on these sites did not match the required date), they found just four bluestones, and so went on a stone hunt and found 10 further stone HOLES! – This is clearly a sad attempt to fit a square peg into a round hole. The excavation was flawed as it only identified 14 possible stone locations and the remainder of the estimated 15 – 25 stones was a ‘guesstimation’ based on the known 14 holes – two of which had non-bluestone stones in situ.

Waun Maun from Stonehenge: The Lost Circle Revealed (Stonehenge's The Lost Circle Revealed)
Nowhere near the 56 stones needed to create Stonehenge Phase I

7. The BBC reconstruction shows just 28 stones (38:05) of the 56 Bluestones required for the Aubrey holes to be filled at Stonehenge, and MPP goes on to suggest, that the stone circle is of equal size and dimensions as Stonehenge, quote “the chances of the two sites having the EXACT dimensions are very slim”- This sadly, is another falsehood, the Moat/Ditch at Stonehenge is approximately 110 metres in diameter, NOT the Aubrey holes which are 90 metres in diameter. Moreover, Stonehenge has a ditch/moat surrounding the stones (for a good reason) Waun Mawn does not!!

8. MPPs then used a new, unused tool in archaeology to prove their hypothesis, ‘photogrammetry’, and suggested that Stone 62 at Stonehenge fitted the stone hole 91 at Waun Mawn. The reason this method is not used is somewhat obvious to even non-academics. You would need a crane to lift the stone vertically out of the hole to get an exact imprint. If you are taking out a stone by hand and/or with levers, you will rock it from side to side, destroying the stone hole impression, as we have seen with post holes in numerous excavations.

9. The program fails to report that the 40 carbon dates from wood found on the site did not come up with MPP’s magic date, and so he employed another form of Dating OSL (40:17) to find this single piece of evidence he desperately required. – Sadly, watching Dr Kim Kinnaird’s efforts to get a light, uncontaminated sample from over a fallen Stone summed up the state of archaeology as a science for me. Armed with a black weed blocker and a bicycle light on his head, he set forth to get a sample to prove MPP’s hypothesis. Anyone who considers this an effective way of obtaining an OSL sample is beyond scientific redemption, as logic would suggest; doing it at night would perhaps be more suitable. This was finally compounded when we saw him transporting the sample in his hand into the detector in daylight, which was pure icing on that flawed cake.

10. Roberts indicated (quite rightly) that ALL the dates were “way out” and all hopes were put on this one sample, MPP then claimed (42:20) “we had dated the thing, and it just before Stonehenge’s construction” (3300 BCE) – Sadly, and not report in the program, but within the Waun Mawn excavation report, there was not one OSL samples taken but 18, which gave results in the range of 6980+/- 2120 BCE to AD 1900 +/- 20. So the 17 dating sample did not verify MPP’s hypothesis, only a single one, which was dated 3530 +/- 330 (with that date range, the probability it’s 3300 BCE is slim!!).In fact, the OSL data in the review document suggested “removal of the stones” in 2120 +/- 520 BCE, long after the Stonehenge phase I.

11. The program then went onto a flight of fantasy for 15 minutes (25% OF AIR TIME) with unscientific mythology and astroarchaeology (which proved MORE that astroarchaeology doesn’t have any significance as the ‘expert’ suggested that the stones were ‘in the general direction’ of an alignment  – which by the very nature of a stone circle of 360 degrees – every stone circle in the world is in the general direction of all astrological alignments!! Even more ludicrous came an idea that the Welsh culturally invaded England in 3300 BCE and took the stones of Waun Mawn with them –Sadly, at no point did the experts attempt to justify why Stonehenge had 56 Bluestones and the site at Waun Mawn had less than 30 at the most. Even if this idea were remotely true, why would you leave four stones behind when you are already going to be 30 stones short and need to go back and get some more from the quarry site?

12. The program never went into any detail of the OTHER carbon dates found at Waun Mawn, which would have allowed a balanced scientific program, allowing the viewer to decide whether MPP’s hypothesis was actually feasible. It presented speculation as fact, with a number of site workers and the presenter agreeing on MPP’s ideas without question or qualification – this is commonly known as ‘propaganda’ rather than scientific methodology.  Moreover, the REAL evidence can be found in the report and shows that of the carbon dating evidence at Waun Mawn (the OSL data was excluded from the report accept a small paragraph without all data!) shows that of the 42 samples taken:

  • 1 – sample were of 9th Millennium BCE
  • 3 – samples were of the 8th Millennium BCE
  • 8 – samples were of the 7th Millennium BCE
  • 4 – samples were of the 6th Millennium BCE
  • 10 – samples were of the 5th Millennium BCE
  • 6 – samples were of the 4th Millennium BCE
  • 11- samples from the 4th Millennium BCE to 17 AD.

13. The report on Waun Mawn contains other questionable evidence, which was excluded from the program. This includes the fact that the Aubrey holes at Stonehenge are ALL two to three times deeper than at Waun Mawn.  This indicates that the Stonehenge Bluestones were made from larger bluestones than those at Waun Mawn (Stonehenge Bluestone hole 69 is over 1.5m deep, as it is long and thin). It looks as if the original stone circle at Waun Mawn was made up of stones similar in shape to the existing recumbent stone 13, which is 6– 7 feet tall and surrounded by a moat. The shape of recumbent 13 indicates that rather than the long thin bluestones as at Stonehenge, Waun Mawn had ‘fat bottomed’ domed ends and hence the need for only shallow ditches.

Recumbent Stone 13 Waun Mawn from Stonehenge: The Lost Circle Revealed
recumbent stone 13; Stonehenge: The Lost Circle Revealed
Stonehenge Bluestone 69 from Stonehenge: The Lost Circle Revealed
Stonehenge Bluestone 69 – a third is underground. Stonehenge: The Lost Circle Revealed

Conclusion

In conclusion, it seems that the BBC has produced a nice piece of archaeological propaganda that supports the current false ‘archaeological narrative’ of mythology and speculation, rather than tested and qualified scientific fact. This lack of ‘critical analysis’ is a clear indication of why the ‘science’ of archaeology has not progressed much over the last 50 years, even with modern technology, which it has incorporated to very limited success.

(Stonehenge's The Lost Circle Revealed)
(Stonehenge’s The Lost Circle Revealed)

Memoir

I first met MPP on his excavation dig on the Avon in 2009, where he was preparing to announce his bluestone site, ‘Bluestonehenge’. At the time, we had a discussion about the date of the site, as he was convinced that (at that time) he believed it predated Stonehenge Phase I (we now know this was the first of many claims of a predated Stonehenge bluestone circle). I did point out that at the meeting that I thought this date would be incorrect as according to my research (of the surrounding 50 sites around Stonehenge) which was included in my published book and post-glacial flooded environment hypothesis ‘The Stonehenge Enigma’ in 2013 – that this site would have been below water as the River Avon would remain flooded throughout the Neolithic period. At this point, he ended the meeting and disappeared at such a rapid speed – it looked as if he thought I was clearly mad.

Later carbon dating proved my point and supported my hypothesis, as it is now accepted that Bluehenge was constructed between 2840 and 2230 BCE, in the Early Bronze Age.

PODCAST

Author’s Biography

Robert John Langdon, a polymathic luminary, emerges as a writer, historian, and eminent specialist in LiDAR Landscape Archaeology.

His intellectual voyage has been interwoven with stints as an astute scrutineer in government and grand corporate bastions, a tapestry spanning British Telecommunications, Cable and Wireless, British Gas, and the esteemed University of London.

A decade hence, Robert’s transition into retirement unfurled a chapter of insatiable curiosity. This phase saw him immerse himself in Politics, Archaeology, Philosophy, and the enigmatic realm of Quantum Mechanics. His academic odyssey traversed the venerable corridors of knowledge hubs such as the Museum of London, University College London, Birkbeck College, The City Literature Institute, and Chichester University.

In the symphony of his life, Robert is a custodian of three progeny and a pair of cherished grandchildren. His sanctuary lies ensconced in the embrace of West Wales, where he inhabits an isolated cottage, its windows framing a vista of the boundless sea – a retreat from the scrutinising gaze of Her Majesty’s Revenue and Customs, an amiable clandestinity in the lap of nature.

Exploring Prehistoric Britain: A Journey Through Time

My blog delves into the fascinating mysteries of prehistoric Britain, challenging conventional narratives and offering fresh perspectives grounded in cutting-edge research, particularly LiDAR technology. I invite you to explore some key areas of my research. For example, the Wansdyke, often cited as a defensive structure, is re-examined in light of new evidence. I’ve presented my findings in my blog post Wansdyke: A British Frontier Wall – ‘Debunked’, and a Wansdyke LiDAR Flyover video further visualises my conclusions.

My work also often challenges established archaeological dogma. I argue that many sites, such as Hambledon Hill, commonly identified as Iron Age hillforts, are not what they seem. My posts Lidar Investigation Hambledon Hill – NOT an ‘Iron Age Fort’ and Unmasking the “Iron Age Hillfort” Myth explore these ideas in detail and offer an alternative view. Similarly, sites like Cissbury Ring and White Sheet Camp receive re-evaluations based on LiDAR analysis in my posts “Lidar Investigation Cissbury Ring through time” and “Lidar Investigation White Sheet Camp, revealing fascinating insights into their true purpose. I have also examined South Cadbury Castle, often linked to the mythical Camelot56.

My research also extends to ancient water management, including the role of canals and other linear earthworks. I have discussed the true origins of Car Dyke in multiple posts, including Car Dyke – ABC News Podcast and Lidar Investigation Car Dyke – North Section, which suggest a Mesolithic origin 2357. I also explore the misidentification of Roman aqueducts, as seen in my posts on the Great Chesters (Roman) Aqueduct. My research has also been greatly informed by my post-glacial flooding hypothesis, which has helped explain landscape transformations over time. I have discussed this hypothesis in several posts, including AI now supports my Post-Glacial Flooding Hypothesis and Exploring Britain’s Flooded Past: A Personal Journey

Finally, my blog also investigates prehistoric burial practices, as seen in Prehistoric Burial Practices of Britain and explores the mystery of Pillow Mounds, often mistaken for medieval rabbit warrens, but with a potential link to Bronze Age cremation in my posts: Pillow Mounds: A Bronze Age Legacy of Cremation? and The Mystery of Pillow Mounds: Are They Really Medieval Rabbit Warrens?. My research also includes astronomical insights into ancient sites, for example, in Rediscovering the Winter Solstice: The Original Winter Festival. I also review new information about the construction of Stonehenge in The Stonehenge Enigma.

Further Reading

For those interested in British Prehistory, visit www.prehistoric-britain.co.uk, a comprehensive resource featuring an extensive collection of archaeology articles, modern LiDAR investigations, and groundbreaking research. The site also includes insights and excerpts from the acclaimed Robert John Langdon Trilogy, a series of books that explore Britain during the Prehistoric period. Titles in the trilogy include The Stonehenge Enigma, Dawn of the Lost Civilisation, and The Post-Glacial Flooding Hypothesis, which offer compelling evidence of ancient landscapes shaped by post-glacial flooding.

To further explore these topics, Robert John Langdon has developed a dedicated YouTube channel featuring over 100 video documentaries and investigations that complement the trilogy. Notable discoveries and studies showcased on the channel include 13 Things that Don’t Make Sense in History and the revelation of Silbury Avenue – The Lost Stone Avenue, a rediscovered prehistoric feature at Avebury, Wiltshire.

In addition to his main works, Langdon has released a series of shorter, accessible publications, ideal for readers delving into specific topics. These include:

For active discussions and updates on the trilogy’s findings and recent LiDAR investigations, join our vibrant community on Facebook. Engage with like-minded enthusiasts by leaving a message or contributing to debates in our Facebook Group.

Whether through the books, the website, or interactive videos, we aim to provide a deeper understanding of Britain’s fascinating prehistoric past. We encourage you to explore these resources and uncover the mysteries of ancient landscapes through the lens of modern archaeology.

For more information, including chapter extracts and related publications, visit the Robert John Langdon Author Page. Dive into works such as The Stonehenge Enigma or Dawn of the Lost Civilisation, and explore cutting-edge theories that challenge traditional historical narratives.

Other Blogs

s

t

Ivory Tower Collapse: How Academia Abandoned Society – and Took Education, Innovation, and Archaeology Down With It

Introduction:

Once seen as the guardians of progress and truth, our universities have now become detached fortresses — insulated from economic reality, unaccountable to public need, and increasingly irrelevant to the challenges they claim to address.

Instead of saving us from economic decline, social division, and failing education — academia has accelerated these crises through poor management, obsession with internal metrics, and a stubborn refusal to engage with innovation or the real world.

And nowhere is this failure more visible than in the slow suffocation of scientific disciplines like archaeology — now little more than a sandbox for ritual theories, self-referential papers, and tenure-chasing conformity. (How Academia Abandoned Society)


1. Academia’s Betrayal of Purpose

Referencing:
What Are We Good For? – Transforming Society

Academia was meant to be society’s think tank — a crucible for solving the great problems of our time. Instead, most modern academics:

  • Avoid the messy realities of policymaking or enterprise.
  • Prioritise journal metrics over practical outcomes.
  • Retreat into specialist silos, increasingly unreadable even to fellow academics.

Rather than challenge failing systems, they enable them through polite conformity and funding dependency.(How Academia Abandoned Society)

(How Academia Abandoned Society)

2. Universities as Debt Machines, Not Learning Institutions

Referencing:
University Crisis Demands a Complete Reboot – The Times

We were promised education as the golden ticket. What we got instead:

  • £50,000 debts for degrees that don’t deliver.
  • Admin-heavy institutions that divert funding from actual teaching.
  • Graduates pouring out with paper credentials but little practical skill — ending up underemployed, disillusioned, and still paying rent to the people who failed them.

Universities have become degree mills, selling “success” on credit, while absolving themselves of responsibility when reality knocks. (How Academia Abandoned Society)


3. Mismanagement Disguised as Meritocracy

Referencing:
How Management Academics Locked Themselves in an Iron Cage – Global Focus Magazine

The modern university is run less like an educational institution and more like a bloated consultancy firm, helmed by:

  • Academics turned administrators, with no real-world governance experience.
  • Part-educated managers obsessed with “strategy decks” and PowerPoints.
  • Cultures that reward safety and consensus over creativity or challenge.

Result? Conformity masquerading as scholarship, and regression disguised as tradition. (How Academia Abandoned Society)

(How Academia Abandoned Society)

4. The Economic Slump They Didn’t See Coming

Referencing:
Pull Britain Out of the Normie Doom Spiral – The Times

Let’s be blunt — the academics didn’t save us from economic stagnation. Many championed the very policies that contributed to it:

  • Over-credentialisation (degree inflation),
  • Downplaying vocational training,
  • Obsession with theory over innovation.

The truth? Most universities are no longer producing inventors, thinkers, or leaders — but clerks of a broken system. (How Academia Abandoned Society)


5. Archaeology: From Scientific Discipline to Storytelling Seminar

Referencing:

  • [Langdon, R.J. – The Post-Glacial Flooding Hypothesis]
  • OSL/LiDAR studies, EH oversight, unpublished hydrological data.

In no field is the rot more obvious than in archaeology, once a pioneering blend of earth sciences, hydrology, radiocarbon dating, geochemistry, and comparative anthropology. Today?

  • It has devolved into a storytelling discipline — more interested in interpretive dance around “ritual” than in hard evidence.
  • The scientific method has been displaced by literary analysis, with subjective speculation passed off as theory.
  • Worse still, new evidence is actively resisted — especially when it threatens comfortable narratives, tenured positions, or decades-old publications still on university reading lists.

Take LiDAR, for example. You’d think a tool that reveals thousands of previously undocumented prehistoric features across Britain would be welcomed. But no — because it wasn’t unearthed with a trowel by someone with the right initials, it’s often ignored or dismissed outright.

Even more absurd is the continued fetishisation of antler picks, “causewayed enclosures,” and Mesolithic postholes, used to prop up linear, outdated models of Neolithic development that crumble under scrutiny from:

  • OSL (Optically Stimulated Luminescence) dating,
  • Isotopic sourcing,
  • Floodplain regression models,
  • And maritime trade route simulations.

But don’t expect peer review to fix that. The academic gatekeeping system:

  • Relies on old-guard referees with vested interests,
  • Dismisses independent researchers (however well evidenced),
  • And blacklists journals or presses that break ranks.

This is not science. This is career maintenance disguised as scholarship. And it’s strangling progress.

(How Academia Abandoned Society)

🔍 Langdon’s Law:

“If a theory requires ignoring LiDAR, hydrology, carbon dating, and maritime logistics — it’s not archaeology. It’s fan fiction with soil samples.”


Conclusion: From Lighthouse to Lifeboat

The modern university should have been a lighthouse for society. Instead, it’s become a leaking lifeboat, captained by out-of-touch theorists and failed bureaucrats, waving credentials while steering into the iceberg.

We don’t need more qualifications. We need qualified people — trained to think clearly, build boldly, and challenge systems. That won’t come from within academia as it stands. It must come from outside, with real-world thinkers, innovators, and independent researchers willing to challenge the polite silence of decline.

(How Academia Abandoned Society)

Exploring Prehistoric Britain: A Journey Through Time

My blog delves into the fascinating mysteries of prehistoric Britain, challenging conventional narratives and offering fresh perspectives based on cutting-edge research, particularly using LiDAR technology. I invite you to explore some key areas of my research. For example, the Wansdyke, often cited as a defensive structure, is re-examined in light of new evidence. I’ve presented my findings in my blog post Wansdyke: A British Frontier Wall – ‘Debunked’, and a Wansdyke LiDAR Flyover video further visualizes my conclusions.

My work also often challenges established archaeological dogma. I argue that many sites, such as Hambledon Hill, commonly identified as Iron Age hillforts are not what they seem. My posts Lidar Investigation Hambledon Hill – NOT an ‘Iron Age Fort’ and Unmasking the “Iron Age Hillfort” Myth explore these ideas in detail and offer an alternative view. Similarly, sites like Cissbury Ring and White Sheet Camp, also receive a re-evaluation based on LiDAR analysis in my posts Lidar Investigation Cissbury Ring through time and Lidar Investigation White Sheet Camp, revealing fascinating insights into their true purpose. I have also examined South Cadbury Castle, often linked to the mythical Camelot56.

My research also extends to the topic of ancient water management, including the role of canals and other linear earthworks. I have discussed the true origins of Car Dyke in multiple posts including Car Dyke – ABC News PodCast and Lidar Investigation Car Dyke – North Section, suggesting a Mesolithic origin2357. I also explore the misidentification of Roman aqueducts, as seen in my posts on the Great Chesters (Roman) Aqueduct. My research has also been greatly informed by my post-glacial flooding hypothesis which has helped to inform the landscape transformations over time. I have discussed this hypothesis in several posts including AI now supports my Post-Glacial Flooding Hypothesis and Exploring Britain’s Flooded Past: A Personal Journey

Finally, my blog also investigates prehistoric burial practices, as seen in Prehistoric Burial Practices of Britain and explores the mystery of Pillow Mounds, often mistaken for medieval rabbit warrens, but with a potential link to Bronze Age cremation in my posts: Pillow Mounds: A Bronze Age Legacy of Cremation? and The Mystery of Pillow Mounds: Are They Really Medieval Rabbit Warrens?. My research also includes the astronomical insights of ancient sites, for example, in Rediscovering the Winter Solstice: The Original Winter Festival. I also review new information about the construction of Stonehenge in The Stonehenge Enigma. (Rhône to Wansdyke).

Further Reading

For those interested in British Prehistory, visit www.prehistoric-britain.co.uk, a comprehensive resource featuring an extensive collection of archaeology articles, modern LiDAR investigations, and groundbreaking research. The site also includes insights and extracts from the acclaimed Robert John Langdon Trilogy, a series of books exploring Britain during the Prehistoric period. Titles in the trilogy include The Stonehenge Enigma, Dawn of the Lost Civilisation, and The Post Glacial Flooding Hypothesis, offering compelling evidence about ancient landscapes shaped by post-glacial flooding.

To further explore these topics, Robert John Langdon has developed a dedicated YouTube channel featuring over 100 video documentaries and investigations that complement the trilogy. Notable discoveries and studies showcased on the channel include 13 Things that Don’t Make Sense in History and the revelation of Silbury Avenue – The Lost Stone Avenue, a rediscovered prehistoric feature at Avebury, Wiltshire. (Rhône to Wansdyke).

In addition to his main works, Langdon has released a series of shorter, accessible publications, ideal for readers delving into specific topics. These include:

For active discussions and updates on the trilogy’s findings and recent LiDAR investigations, join our vibrant community on Facebook. Engage with like-minded enthusiasts by leaving a message or contributing to debates in our Facebook Group.

Whether through the books, the website, or interactive videos, we aim to provide a deeper understanding of Britain’s fascinating prehistoric past. We encourage you to explore these resources and uncover the mysteries of ancient landscapes through the lens of modern archaeology.

For more information, including chapter extracts and related publications, visit the Robert John Langdon Author Page. Dive into works such as The Stonehenge Enigma or Dawn of the Lost Civilisation, and explore cutting-edge theories that challenge traditional historical narratives. (Rhône to Wansdyke).

Other Blogs

s

t

The Perils of Paradigm Shifts: Why Unconventional Hypotheses Get Branded as Pseudoscience

Introduction

The pursuit of knowledge is often portrayed as a straight line—one discovery neatly building upon another, all validated by peer-reviewed research. But the real history of science tells a more chaotic story. Many of the most transformative discoveries didn’t come from within academia, but from individuals who dared to question what everyone else accepted as truth. Their reward? Accusations of pseudoscience, conspiracy thinking, or outright nonsense.(The Perils of Paradigm Shifts)

.(The Perils of Paradigm Shifts)
Science is often imagined as a straight path of progress—but reality is far messier.. (The Perils of Paradigm Shifts)

Academic Gatekeeping and Intellectual Inertia

At the heart of this resistance lies the structure of academia itself. Scholars are trained within narrow theoretical frameworks, and the peer-review system—meant to filter out weak or unsupported work—often ends up protecting the status quo instead. New ideas that don’t fit the accepted narrative aren’t just inconvenient—they’re seen as dangerous to careers, reputations, and long-standing institutions.

It’s easier to ignore a challenging idea than to risk overturning an entire body of accepted knowledge. And when the person presenting that idea isn’t part of the academic club? Their work is often dismissed without real engagement.

.(The Perils of Paradigm Shifts)
Academic structures are designed to uphold standards—but can also guard against change(The Perils of Paradigm Shifts)

History Repeats Itself: From Galileo to Wegener

This isn’t a new phenomenon. Galileo was forced to recant his heliocentric model under pressure from the Church and his scientific peers. Alfred Wegener’s theory of continental drift was mocked for decades until it was finally recognised as the foundation of plate tectonics. These examples reveal a persistent flaw in how we handle innovation: we often attack the idea before we understand it, simply because it makes us uncomfortable.

.(The Perils of Paradigm Shifts)
Wegener’s once-dismissed theory is now geology 101. (The Perils of Paradigm Shifts)

Archaeology: A Discipline Bound by Tradition

Nowhere is this resistance more pronounced than in archaeology. The field often deals with incomplete data, open interpretation, and entrenched cultural narratives. Yet despite the uncertainties, mainstream archaeology can be surprisingly inflexible.

When alternative thinkers propose that ancient structures like Stonehenge served different purposes or that dykes might have been prehistoric canals instead of military boundaries, they’re frequently labelled pseudoscientists—regardless of how carefully they present their evidence.

.(The Perils of Paradigm Shifts)
Archaeological theory is often slow to evolve—especially when challenged from the outside..(The Perils of Paradigm Shifts)

Clement Reid and the Lost Land of Doggerland

Consider Clement Reid. In 1913, the same year he retired from the Geological Survey, he published Submerged Forests, a book proposing that a vast prehistoric landscape—what we now call Doggerland—once connected Britain to continental Europe. His hypothesis was quietly ignored by the academic community. The book wasn’t peer-reviewed, and his ideas didn’t fit the prevailing archaeological framework.

But decades later, sonar mapping confirmed the existence of submerged river valleys and coastlines beneath the North Sea—exactly the kind of landscape Reid had described. He had been right all along. His work wasn’t pseudoscience; it was simply science ahead of its time.

.(The Perils of Paradigm Shifts)
Clement Reid proposed Doggerland long before science could prove it..(The Perils of Paradigm Shifts)

Science Should Be About Testing, Not Silencing

The core principle of science is to test ideas against evidence. But when new hypotheses are dismissed outright—especially by virtue of who proposes them—we lose sight of that principle. Dismissing unconventional thinkers, especially when they back up their claims with data and logical reasoning, contradicts everything science is supposed to stand for.

The Perils of Paradigm Shifts
The scientific method demands all ideas be tested—regardless of origin..(The Perils of Paradigm Shifts)

The Role of Imagination and Intellectual Courage

Many of the greatest scientific leaps have come from those willing to imagine realities no one else could yet see. Einstein, Bohr, Planck—all of them thought beyond the limits of their time. The real barrier to progress often isn’t the lack of evidence—it’s the lack of imagination. And the courage to entertain uncomfortable possibilities.

(The Perils of Paradigm Shifts)
Many revolutionary thinkers succeeded by imagining what others couldn’t.(The Perils of Paradigm Shifts)

Moving Forward: Embrace the Margins

Robert John Langdon, among others, has repeatedly shown that alternative hypotheses deserve fair consideration. Whether it’s the reimagining of Stonehenge’s purpose, or the reinterpretation of earthworks using modern technologies like LiDAR, these ideas challenge stale narratives and encourage fresh inquiry. Yet they’re often dismissed, not because they lack merit, but because they don’t come from within the academic mainstream.

That’s a problem.

(The Perils of Paradigm Shifts)

Conclusion: Rethinking Scientific Rigidity

The tendency to label new ideas as pseudoscience reflects a deeper flaw in how we protect consensus over curiosity. In archaeology especially, where evidence is open to interpretation, the scientific community must do better. The true spirit of science demands open-mindedness, critical thinking, and the willingness to follow the evidence—wherever it leads, and whoever it comes from.

Because history shows us that real breakthroughs often come from the edges—not the centre.

(The Perils of Paradigm Shifts)

Audio Blog Post

(The Perils of Paradigm Shifts)

Further Reading

For those interested in British Prehistory, visit www.prehistoric-britain.co.uk, a comprehensive resource featuring an extensive collection of archaeology articles, modern LiDAR investigations, and groundbreaking research. The site also includes insights and extracts from the acclaimed Robert John Langdon Trilogy, a series of books exploring Britain during the Prehistoric period. Titles in the trilogy include The Stonehenge Enigma, Dawn of the Lost Civilisation, and The Post Glacial Flooding Hypothesis, offering compelling evidence about ancient landscapes shaped by post-glacial flooding.

To further explore these topics, Robert John Langdon has developed a dedicated YouTube channel featuring over 100 video documentaries and investigations that complement the trilogy. Notable discoveries and studies showcased on the channel include 13 Things that Don’t Make Sense in History and the revelation of Silbury Avenue – The Lost Stone Avenue, a rediscovered prehistoric feature at Avebury, Wiltshire.

In addition to his main works, Langdon has released a series of shorter, accessible publications, ideal for readers delving into specific topics. These include:

For active discussions and updates on the trilogy’s findings and recent LiDAR investigations, join our vibrant community on Facebook. Engage with like-minded enthusiasts by leaving a message or contributing to debates in our Facebook Group.

Whether through the books, the website, or interactive videos, we aim to provide a deeper understanding of Britain’s fascinating prehistoric past. We encourage you to explore these resources and uncover the mysteries of ancient landscapes through the lens of modern archaeology.

For more information, including chapter extracts and related publications, visit the Robert John Langdon Author Page. Dive into works such as The Stonehenge Enigma or Dawn of the Lost Civilisation, and explore cutting-edge theories that challenge traditional historical narratives.


Other Blogs

s

t