Stonehenge’s The Lost Circle Revealed – DEBUNKED

13 things that don’t make sense about Waun Mawn (Stonehenge’s The Lost Circle Revealed)

Introduction

According to the BBC documentary, the discovery of the bluestone quarry in Wales was presented as a major breakthrough in understanding Stonehenge. At face value, that seems fair enough. Identifying a potential source for the stones is important.

But this is where the problem begins.

Because from that point onward, the investigation appears to shift away from asking what the evidence actually shows… and toward trying to make the evidence fit an already established timeline.

Instead of examining the quarry independently and comparing it objectively with Stonehenge, the focus becomes finding dates that support a pre-existing conclusion. That is not how science works. When you start with the answer and work backwards, you are no longer testing a hypothesis — you are trying to confirm one.

Craig Rhos-y-Felin is a good example of this.
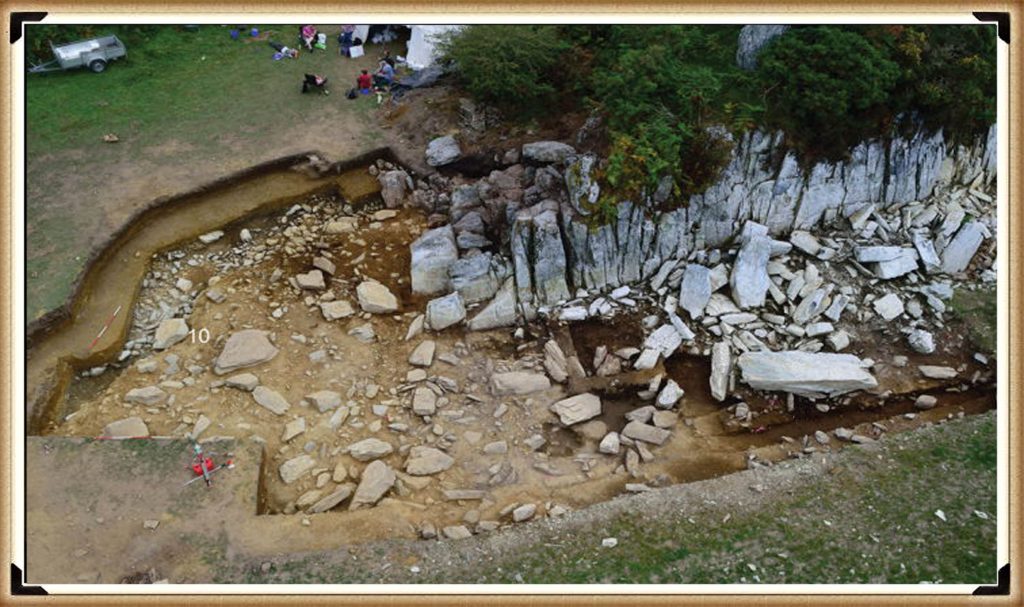
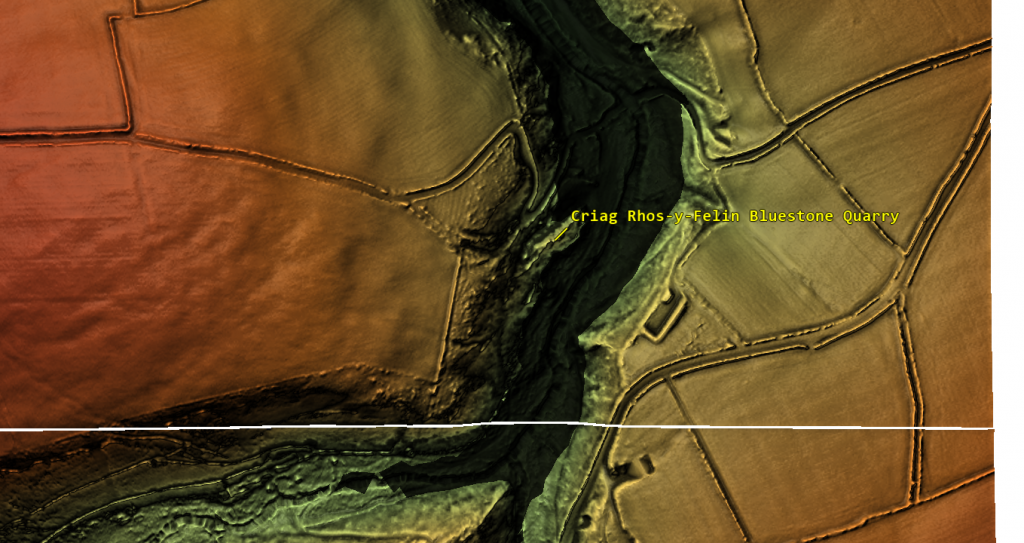
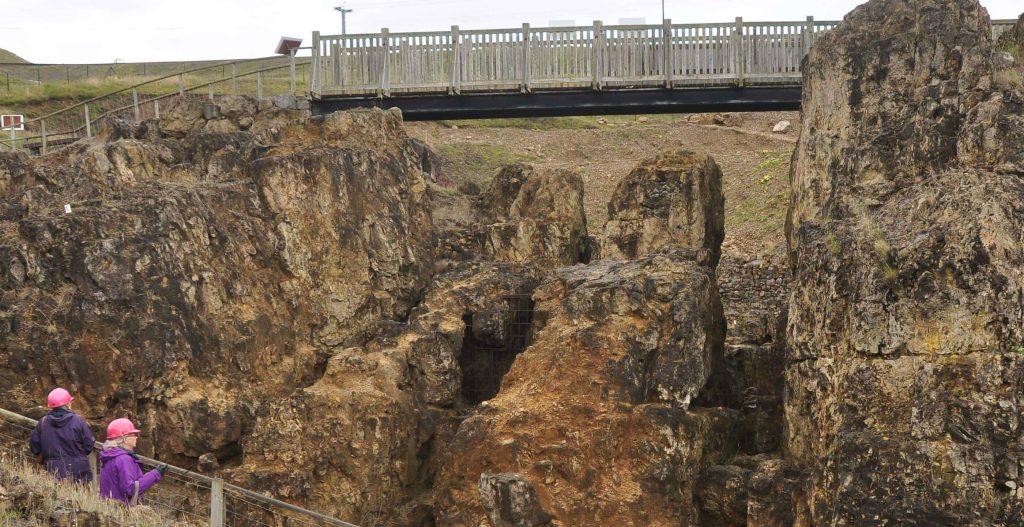
Craig Rhos-Y-Felin from Stonehenge: The Lost Circle Revealed - Stonehenge's the lost circle
Craig Rhos-Y-Felin: Stonehenge: The Lost Circle Revealed

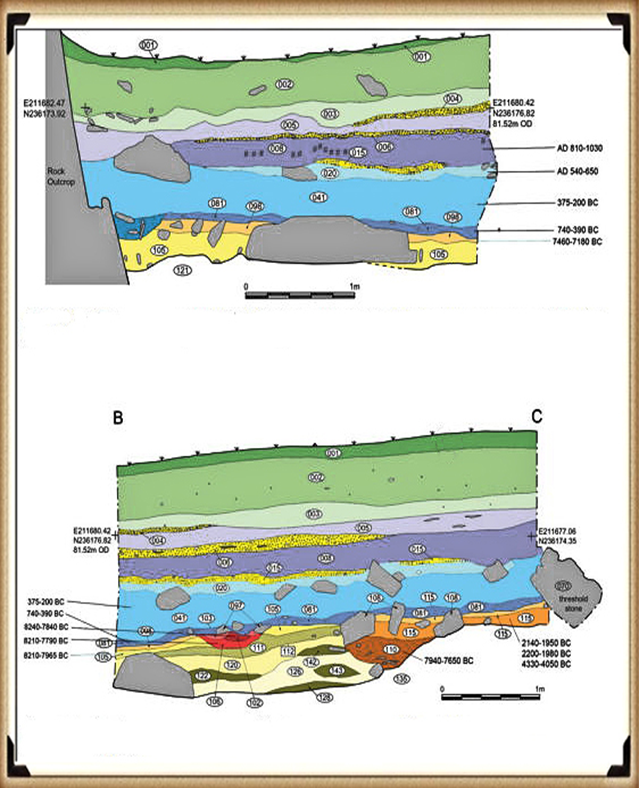
The site contains clear evidence of Mesolithic activity, particularly in the form of man-made hearths. That should be the starting point for interpretation. Yet the emphasis is instead placed on a small number of later samples that fall closer to the desired Neolithic timeframe.

When those dates still don’t quite align, the solution is not to question the model — it is to introduce another one. A “prototype” stone circle in Wales was later moved to Stonehenge. A theory designed not from evidence, but from necessity.

And so begins a decade-long search for that missing link.

Sites are proposed… then quietly dropped when the dates don’t match. New locations are suggested… then abandoned for the same reason. The pattern repeats. The goal is no longer discovery — it is validation.

Eventually, everything converges on Waun Mawn.
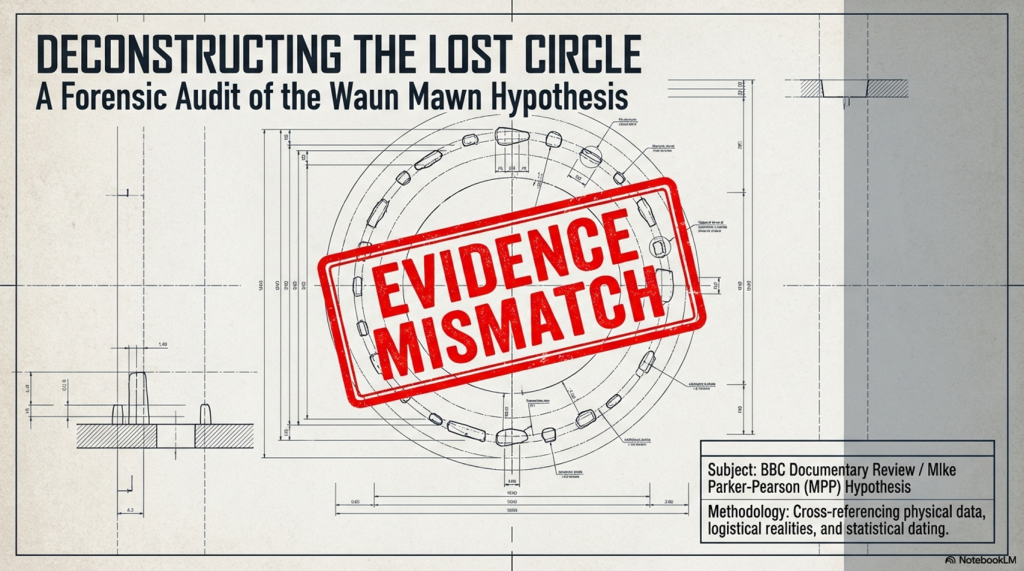
(Stonehenge's The Lost Circle Revealed)
(Stonehenge’s The Lost Circle Revealed)

This is presented as the long-awaited solution. But when you strip it back, the physical evidence is extremely limited. A handful of stones. A small number of possible stone holes. Nowhere near enough to replicate what exists at Stonehenge.

So the gaps are filled in.

Estimates are extended beyond what is actually present. Missing stones are assumed. Layouts are reconstructed from partial data. And suddenly, a fragment becomes a full circle.

Then we come to the dating.

Among a broad range of results spanning several millennia, one sample is highlighted as aligning with the proposed timeline. The rest — which do not support the theory — receive far less attention.

This is the core issue. You cannot treat a single favourable result as definitive while ignoring the wider dataset. That is not strengthening an argument — it is narrowing it.

The same pattern appears in other parts of the interpretation.
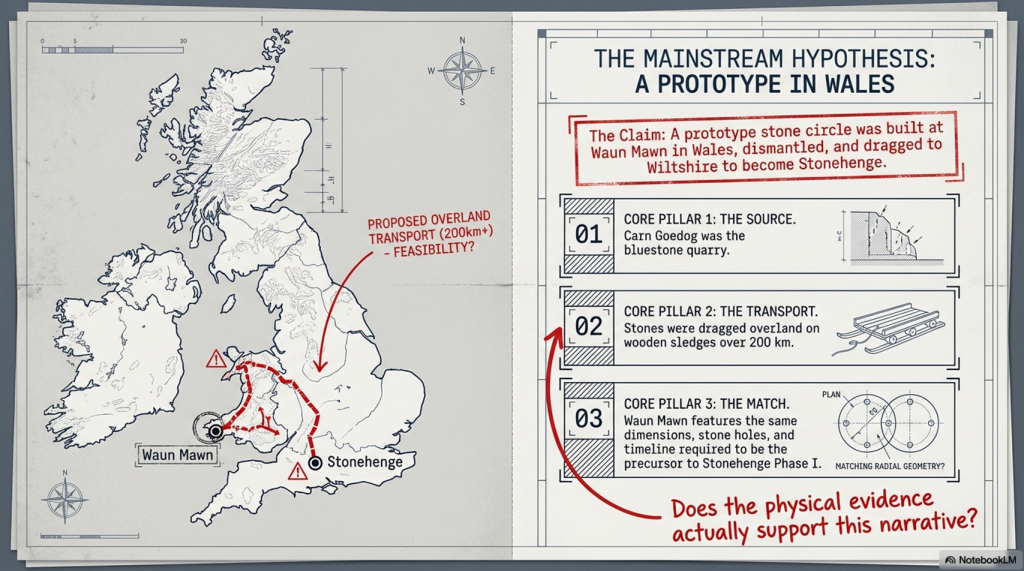
(Stonehenge's The Lost Circle Revealed)
(Stonehenge’s The Lost Circle Revealed)

Large stones at the quarry are presented as the source of Stonehenge’s bluestones, despite clear differences in size and shape. No explanation is provided for how they were reduced or reworked.

Transport by water is dismissed, despite experimental demonstrations showing it is entirely possible. Instead, overland transport through heavily forested and waterlogged terrain is presented as the more feasible option — a claim that raises more questions than it answers.

Even the more technical aspects, such as photogrammetry, are used in ways that assume ideal conditions. A stone is said to match a socket, without addressing the simple fact that removing a stone alters the shape of that socket. Basic mechanical realities are overlooked.

And then, towards the end, the programme drifts into broader speculation — cultural movements, symbolic alignments, and generalised astronomical claims. These are presented confidently, but without the level of supporting evidence required to justify them.

Meanwhile, key inconsistencies remain unresolved.

Stonehenge contains 56 bluestone positions. Waun Mawn does not. The construction methods differ. The depth of the stone holes differs. The overall structure is not the same.

These are not small details. There are fundamental differences.
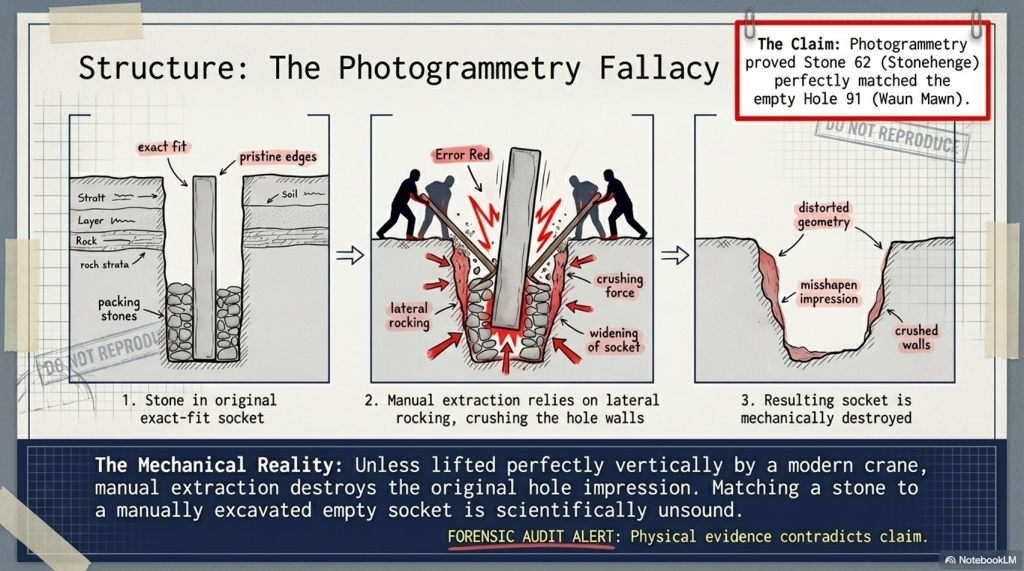
(Stonehenge's The Lost Circle Revealed)
(Stonehenge’s The Lost Circle Revealed)

So what are we left with?

Not a clear, evidence-led conclusion — but a narrative built around selective interpretation. Certain data points are emphasised. Others are downplayed. Gaps are filled with theory rather than evidence.

The result is compelling television.

But it is not robust science.

Because real scientific analysis does not depend on finding the right answer.

It depends on being willing to accept when the evidence points somewhere else entirely.
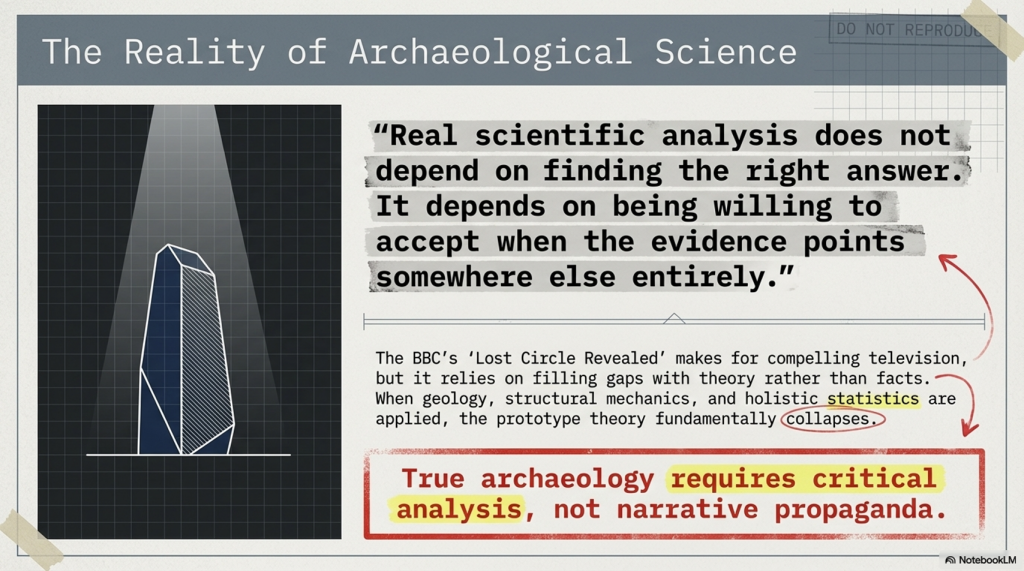
(Stonehenge's The Lost Circle Revealed)
(Stonehenge’s The Lost Circle Revealed)

The Documentary

Therefore, the last hope for MPP’s reputation and his ’10-year search’ fell upon Waun Mawn, culminating in the BBC documentary “Stonehenge: The Lost Circle Revealed”, shown on the 12th February 2021. In it, he claimed many so-called ‘facts’ which I shall now highlight as ‘not making sense’, with the reasons why.

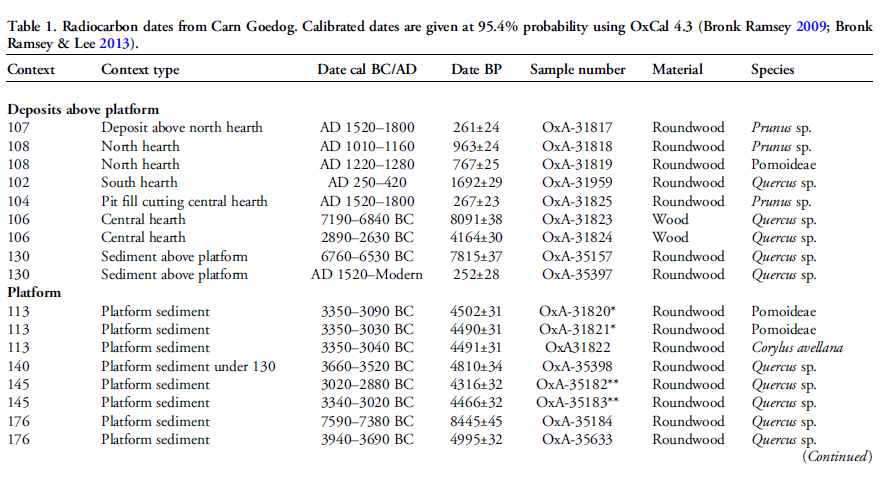
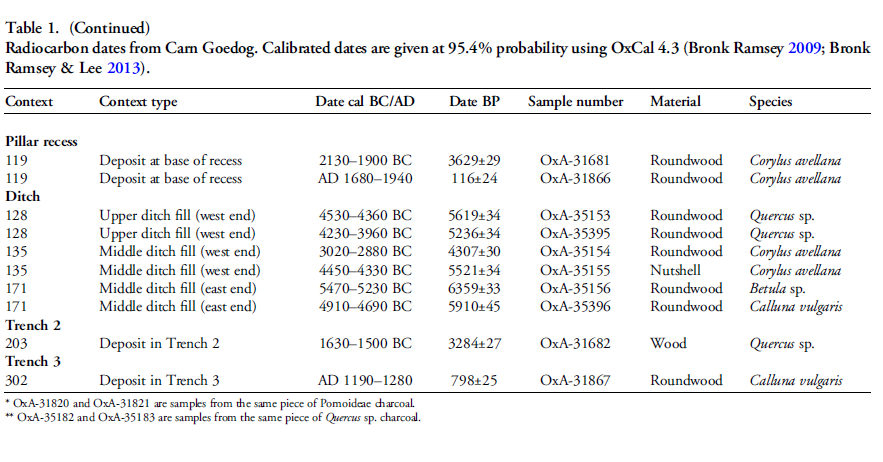
1. At (13:20) MPP shows signs of human-made quarrying and splitting of Bluestones at Carn Goedog in Wales – unfortunately, there are no extensive excavation reports on this site, just a published review showing that of the 31 carbon dates, only three random samples support his theory and none of the man-made hearths which are Mesolithic (like Craig Rhos-Y-Felin) or late Neolithic.

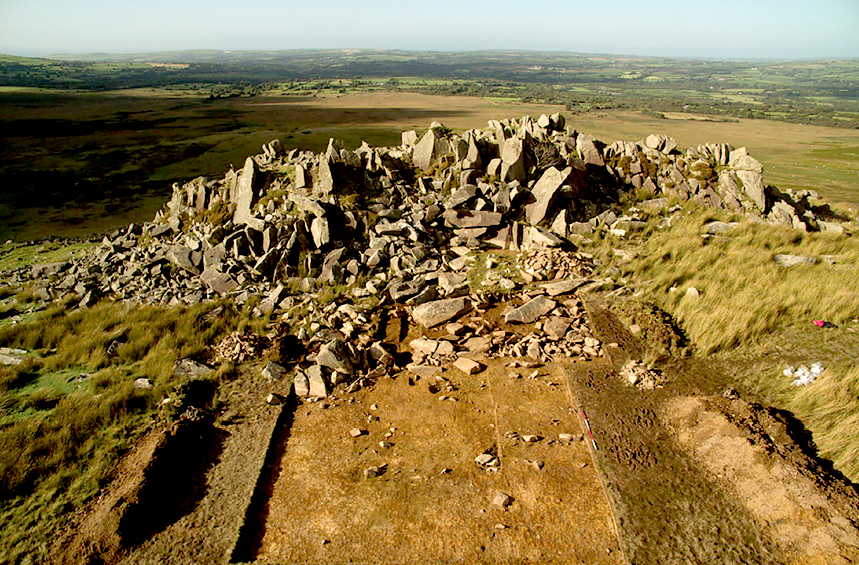
2. The program showed the suggested quarried stones at Carn Goedog, which are over 12 feet long and 5 feet wide, weighing therefore around 20+ tonnes. The Stonehenge bluestones are, on average, less than six feet high and about 18–24 inches wide, weighing 1-3 tonnes. The review on the site offered no evidence that the stones were cut down and reshaped for the journey to Stonehenge or elsewhere. (Stonehenge’s The Lost Circle Revealed)
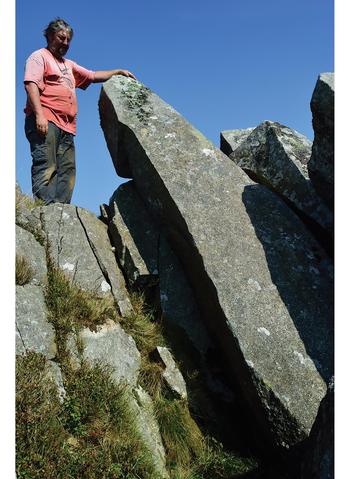
Carn Goedog from Stonehenge: The Lost Circle Revealed (Stonehenge's The Lost Circle Revealed)
Carn Goedog – Stonehenge: The Lost Circle Revealed

3. MPP claims that the boat transport method (14.50) was infeasible as they did not have sturdy enough boats to carry the stones on such a journey – Sadly, you do not need a ‘boat’ to transport stones in a river as shown by Atkinson in the 1960’s who employed just four school kids to punt a raft with a 3 tonne stone attached down the Avon. Moreover, he has failed to recognise that the oldest boatyard in the world, located in the Solent (at the end of the Avon), was found with planked wood (and associated wheat grain from Turkey), indicating that substantial seafaring boats were available by the 7th Millennium BCE.

Punting Bluestone down the Avon from Stonehenge: The Lost Circle Revealed (Stonehenge's The Lost Circle Revealed)
Clearly MPP was too young to see this punt down the Avon?

4. Mike Parker-Pearson also suggested that an ‘ox-cart’ route that followed the current A40 was the most feasible way of transporting these stones to Stonehenge. He believed that they dragged these stones over 200 km on wooden sledges – unfortunately, the example shown on the program shows schoolboys dragging a small stone over flat grassland, which would not be available for another 4000+ years and after Stonehenge’s initial construction. At the time of Phase I construction, the environment (as indicated by pollen analysis) shows that 70% of the terrain was woodland and forest, and the remaining 30% was mostly rivers and swampland, making such an endeavour impossible.

5. The Discovery (21:15) of ‘random’ hazel nuts at Craig Rhos-Y-Felin provides MPP’s required date for Stonehenge of 3300 BCE (which is still 500 years before MPP’s supposed construction date) – This clear ‘cherry picking’ of the archaeological evidence is ‘Bad Science’. To take just two carbon dates from over 40 at the Craig-Rhos-Y-Felin site and ignoring the more solid man-made hearth dates, which are Mesolithic and moreover, compatible with 26 carbon dates found at Stonehenge, is plainly a falsehood.

6. When they eventually found their target site (36:15), Waun Mawn (after many claims that other sites were “the one we have been looking for” to eventually find that the carbon dating on these sites did not match the required date), they found just four bluestones, and so went on a stone hunt and found 10 further stone HOLES! – This is clearly a sad attempt to fit a square peg into a round hole. The excavation was flawed as it only identified 14 possible stone locations and the remainder of the estimated 15 – 25 stones was a ‘guesstimation’ based on the known 14 holes – two of which had non-bluestone stones in situ.

Waun Maun from Stonehenge: The Lost Circle Revealed (Stonehenge's The Lost Circle Revealed)
Nowhere near the 56 stones needed to create Stonehenge Phase I

7. The BBC reconstruction shows just 28 stones (38:05) of the 56 Bluestones required for the Aubrey holes to be filled at Stonehenge, and MPP goes on to suggest, that the stone circle is of equal size and dimensions as Stonehenge, quote “the chances of the two sites having the EXACT dimensions are very slim”- This sadly, is another falsehood, the Moat/Ditch at Stonehenge is approximately 110 metres in diameter, NOT the Aubrey holes which are 90 metres in diameter. Moreover, Stonehenge has a ditch/moat surrounding the stones (for a good reason) Waun Mawn does not!!

8. MPPs then used a new, unused tool in archaeology to prove their hypothesis, ‘photogrammetry’, and suggested that Stone 62 at Stonehenge fitted the stone hole 91 at Waun Mawn. The reason this method is not used is somewhat obvious to even non-academics. You would need a crane to lift the stone vertically out of the hole to get an exact imprint. If you are taking out a stone by hand and/or with levers, you will rock it from side to side, destroying the stone hole impression, as we have seen with post holes in numerous excavations.

9. The program fails to report that the 40 carbon dates from wood found on the site did not come up with MPP’s magic date, and so he employed another form of Dating OSL (40:17) to find this single piece of evidence he desperately required. – Sadly, watching Dr Kim Kinnaird’s efforts to get a light, uncontaminated sample from over a fallen Stone summed up the state of archaeology as a science for me. Armed with a black weed blocker and a bicycle light on his head, he set forth to get a sample to prove MPP’s hypothesis. Anyone who considers this an effective way of obtaining an OSL sample is beyond scientific redemption, as logic would suggest; doing it at night would perhaps be more suitable. This was finally compounded when we saw him transporting the sample in his hand into the detector in daylight, which was pure icing on that flawed cake.

10. Roberts indicated (quite rightly) that ALL the dates were “way out” and all hopes were put on this one sample, MPP then claimed (42:20) “we had dated the thing, and it just before Stonehenge’s construction” (3300 BCE) – Sadly, and not report in the program, but within the Waun Mawn excavation report, there was not one OSL samples taken but 18, which gave results in the range of 6980+/- 2120 BCE to AD 1900 +/- 20. So the 17 dating sample did not verify MPP’s hypothesis, only a single one, which was dated 3530 +/- 330 (with that date range, the probability it’s 3300 BCE is slim!!).In fact, the OSL data in the review document suggested “removal of the stones” in 2120 +/- 520 BCE, long after the Stonehenge phase I.

11. The program then went onto a flight of fantasy for 15 minutes (25% OF AIR TIME) with unscientific mythology and astroarchaeology (which proved MORE that astroarchaeology doesn’t have any significance as the ‘expert’ suggested that the stones were ‘in the general direction’ of an alignment  – which by the very nature of a stone circle of 360 degrees – every stone circle in the world is in the general direction of all astrological alignments!! Even more ludicrous came an idea that the Welsh culturally invaded England in 3300 BCE and took the stones of Waun Mawn with them –Sadly, at no point did the experts attempt to justify why Stonehenge had 56 Bluestones and the site at Waun Mawn had less than 30 at the most. Even if this idea were remotely true, why would you leave four stones behind when you are already going to be 30 stones short and need to go back and get some more from the quarry site?

12. The program never went into any detail of the OTHER carbon dates found at Waun Mawn, which would have allowed a balanced scientific program, allowing the viewer to decide whether MPP’s hypothesis was actually feasible. It presented speculation as fact, with a number of site workers and the presenter agreeing on MPP’s ideas without question or qualification – this is commonly known as ‘propaganda’ rather than scientific methodology.  Moreover, the REAL evidence can be found in the report and shows that of the carbon dating evidence at Waun Mawn (the OSL data was excluded from the report accept a small paragraph without all data!) shows that of the 42 samples taken:

  • 1 – sample were of 9th Millennium BCE
  • 3 – samples were of the 8th Millennium BCE
  • 8 – samples were of the 7th Millennium BCE
  • 4 – samples were of the 6th Millennium BCE
  • 10 – samples were of the 5th Millennium BCE
  • 6 – samples were of the 4th Millennium BCE
  • 11- samples from the 4th Millennium BCE to 17 AD.

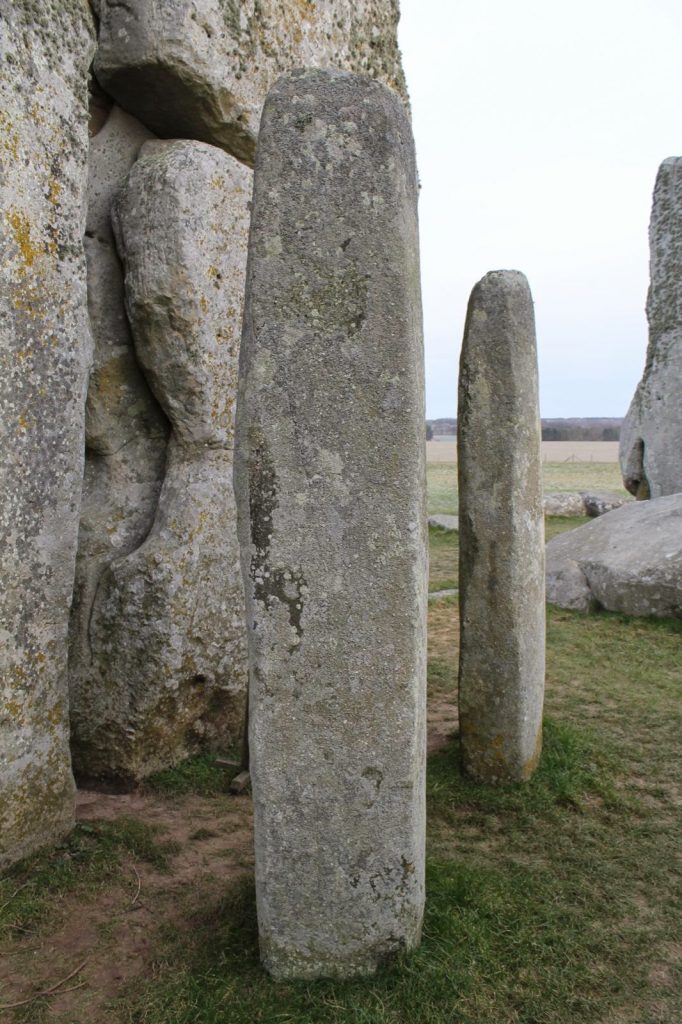
13. The report on Waun Mawn contains other questionable evidence, which was excluded from the program. This includes the fact that the Aubrey holes at Stonehenge are ALL two to three times deeper than at Waun Mawn.  This indicates that the Stonehenge Bluestones were made from larger bluestones than those at Waun Mawn (Stonehenge Bluestone hole 69 is over 1.5m deep, as it is long and thin). It looks as if the original stone circle at Waun Mawn was made up of stones similar in shape to the existing recumbent stone 13, which is 6– 7 feet tall and surrounded by a moat. The shape of recumbent 13 indicates that rather than the long thin bluestones as at Stonehenge, Waun Mawn had ‘fat bottomed’ domed ends and hence the need for only shallow ditches.
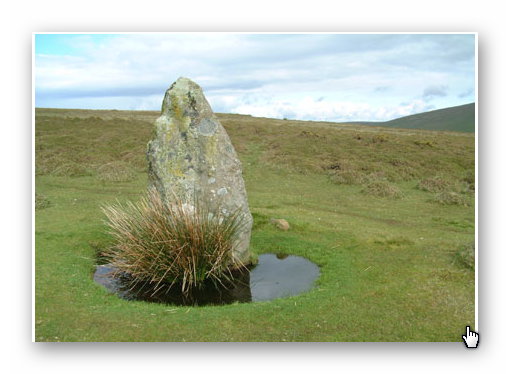
Recumbent Stone 13 Waun Mawn from Stonehenge: The Lost Circle Revealed
recumbent stone 13; Stonehenge: The Lost Circle Revealed
Stonehenge Bluestone 69 from Stonehenge: The Lost Circle Revealed
Stonehenge Bluestone 69 – a third is underground. Stonehenge: The Lost Circle Revealed

Conclusion

In conclusion, it seems that the BBC has produced a nice piece of archaeological propaganda that supports the current false ‘archaeological narrative’ of mythology and speculation, rather than tested and qualified scientific fact. This lack of ‘critical analysis’ is a clear indication of why the ‘science’ of archaeology has not progressed much over the last 50 years, even with modern technology, which it has incorporated to very limited success.
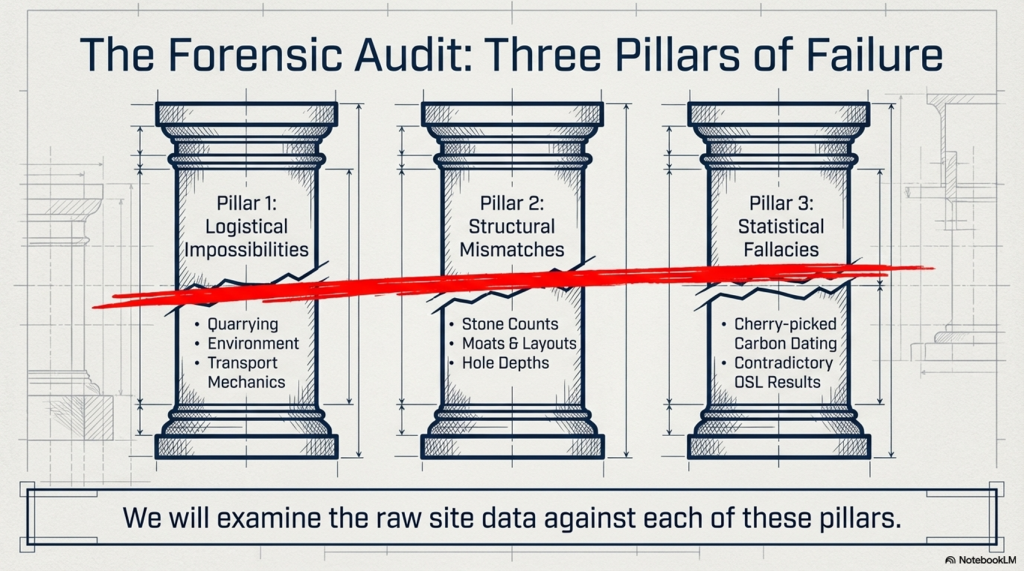
(Stonehenge's The Lost Circle Revealed)
(Stonehenge’s The Lost Circle Revealed)

Memoir

I first met MPP on his excavation dig on the Avon in 2009, where he was preparing to announce his bluestone site, ‘Bluestonehenge’. At the time, we had a discussion about the date of the site, as he was convinced that (at that time) he believed it predated Stonehenge Phase I (we now know this was the first of many claims of a predated Stonehenge bluestone circle). I did point out that at the meeting that I thought this date would be incorrect as according to my research (of the surrounding 50 sites around Stonehenge) which was included in my published book and post-glacial flooded environment hypothesis ‘The Stonehenge Enigma’ in 2013 – that this site would have been below water as the River Avon would remain flooded throughout the Neolithic period. At this point, he ended the meeting and disappeared at such a rapid speed – it looked as if he thought I was clearly mad.

Later carbon dating proved my point and supported my hypothesis, as it is now accepted that Bluehenge was constructed between 2840 and 2230 BCE, in the Early Bronze Age.

PODCAST

Author’s Biography

Robert John Langdon, a polymathic luminary, emerges as a writer, historian, and eminent specialist in LiDAR Landscape Archaeology.

His intellectual voyage has been interwoven with stints as an astute scrutineer in government and grand corporate bastions, a tapestry spanning British Telecommunications, Cable and Wireless, British Gas, and the esteemed University of London.

A decade hence, Robert’s transition into retirement unfurled a chapter of insatiable curiosity. This phase saw him immerse himself in Politics, Archaeology, Philosophy, and the enigmatic realm of Quantum Mechanics. His academic odyssey traversed the venerable corridors of knowledge hubs such as the Museum of London, University College London, Birkbeck College, The City Literature Institute, and Chichester University.

In the symphony of his life, Robert is a custodian of three progeny and a pair of cherished grandchildren. His sanctuary lies ensconced in the embrace of West Wales, where he inhabits an isolated cottage, its windows framing a vista of the boundless sea – a retreat from the scrutinising gaze of Her Majesty’s Revenue and Customs, an amiable clandestinity in the lap of nature.

Exploring Prehistoric Britain: A Journey Through Time

My blog delves into the fascinating mysteries of prehistoric Britain, challenging conventional narratives and offering fresh perspectives grounded in cutting-edge research, particularly LiDAR technology. I invite you to explore some key areas of my research. For example, the Wansdyke, often cited as a defensive structure, is re-examined in light of new evidence. I’ve presented my findings in my blog post Wansdyke: A British Frontier Wall – ‘Debunked’, and a Wansdyke LiDAR Flyover video further visualises my conclusions.

My work also often challenges established archaeological dogma. I argue that many sites, such as Hambledon Hill, commonly identified as Iron Age hillforts, are not what they seem. My posts Lidar Investigation Hambledon Hill – NOT an ‘Iron Age Fort’ and Unmasking the “Iron Age Hillfort” Myth explore these ideas in detail and offer an alternative view. Similarly, sites like Cissbury Ring and White Sheet Camp receive re-evaluations based on LiDAR analysis in my posts “Lidar Investigation Cissbury Ring through time” and “Lidar Investigation White Sheet Camp, revealing fascinating insights into their true purpose. I have also examined South Cadbury Castle, often linked to the mythical Camelot56.

My research also extends to ancient water management, including the role of canals and other linear earthworks. I have discussed the true origins of Car Dyke in multiple posts, including Car Dyke – ABC News Podcast and Lidar Investigation Car Dyke – North Section, which suggest a Mesolithic origin 2357. I also explore the misidentification of Roman aqueducts, as seen in my posts on the Great Chesters (Roman) Aqueduct. My research has also been greatly informed by my post-glacial flooding hypothesis, which has helped explain landscape transformations over time. I have discussed this hypothesis in several posts, including AI now supports my Post-Glacial Flooding Hypothesis and Exploring Britain’s Flooded Past: A Personal Journey

Finally, my blog also investigates prehistoric burial practices, as seen in Prehistoric Burial Practices of Britain and explores the mystery of Pillow Mounds, often mistaken for medieval rabbit warrens, but with a potential link to Bronze Age cremation in my posts: Pillow Mounds: A Bronze Age Legacy of Cremation? and The Mystery of Pillow Mounds: Are They Really Medieval Rabbit Warrens?. My research also includes astronomical insights into ancient sites, for example, in Rediscovering the Winter Solstice: The Original Winter Festival. I also review new information about the construction of Stonehenge in The Stonehenge Enigma.

Further Reading

For those interested in British Prehistory, visit www.prehistoric-britain.co.uk, a comprehensive resource featuring an extensive collection of archaeology articles, modern LiDAR investigations, and groundbreaking research. The site also includes insights and excerpts from the acclaimed Robert John Langdon Trilogy, a series of books that explore Britain during the Prehistoric period. Titles in the trilogy include The Stonehenge Enigma, Dawn of the Lost Civilisation, and The Post-Glacial Flooding Hypothesis, which offer compelling evidence of ancient landscapes shaped by post-glacial flooding.

To further explore these topics, Robert John Langdon has developed a dedicated YouTube channel featuring over 100 video documentaries and investigations that complement the trilogy. Notable discoveries and studies showcased on the channel include 13 Things that Don’t Make Sense in History and the revelation of Silbury Avenue – The Lost Stone Avenue, a rediscovered prehistoric feature at Avebury, Wiltshire.

In addition to his main works, Langdon has released a series of shorter, accessible publications, ideal for readers delving into specific topics. These include:

For active discussions and updates on the trilogy’s findings and recent LiDAR investigations, join our vibrant community on Facebook. Engage with like-minded enthusiasts by leaving a message or contributing to debates in our Facebook Group.

Whether through the books, the website, or interactive videos, we aim to provide a deeper understanding of Britain’s fascinating prehistoric past. We encourage you to explore these resources and uncover the mysteries of ancient landscapes through the lens of modern archaeology.

For more information, including chapter extracts and related publications, visit the Robert John Langdon Author Page. Dive into works such as The Stonehenge Enigma or Dawn of the Lost Civilisation, and explore cutting-edge theories that challenge traditional historical narratives.

Other Blogs

s

t

The Bluestone Enigma

Introduction

The Bluestone quarry sites give us compelling evidence of the Mesolithic construction dates of Stonehenge (The Bluestone Enigma)

The papers published by researchers from the University of London, Southampton, and Manchester, including Mike Parker-Pearson and his team, regarding the discovery of the quarries at Craig Rhos-y-Felin and the bluestone megaliths at Carn Goedog have been a significant contribution to our understanding of Stonehenge’s origins. This research brought to light the fascinating theory that Stonehenge was originally built in Wales and later transported to Salisbury Plain around 500 years later.

This groundbreaking discovery not only captured the attention of archaeologists worldwide but also challenged previous assumptions about the methods and motivations behind Stonehenge’s construction. The idea that these bluestones were quarried and shaped in Wales before making their journey to Salisbury Plain adds a new dimension to our understanding of prehistoric peoples’ capabilities and social organisation.

This revelation suggests a remarkable level of dedication and coordination among ancient communities. The logistical feat of transporting these massive stones over such a distance, and the decision to do so centuries after their initial quarrying, hints at the profound significance these stones—and the monument they came to form—held for the people of the time.

As someone deeply interested in the mysteries of ancient civilisations, I find the implications of this research thrilling. It deepens our appreciation for the ingenuity and spiritual dedication of our ancestors and opens up new avenues for exploring the cultural and religious ties that connected different regions of prehistoric Britain.

The Bluestone Enigma
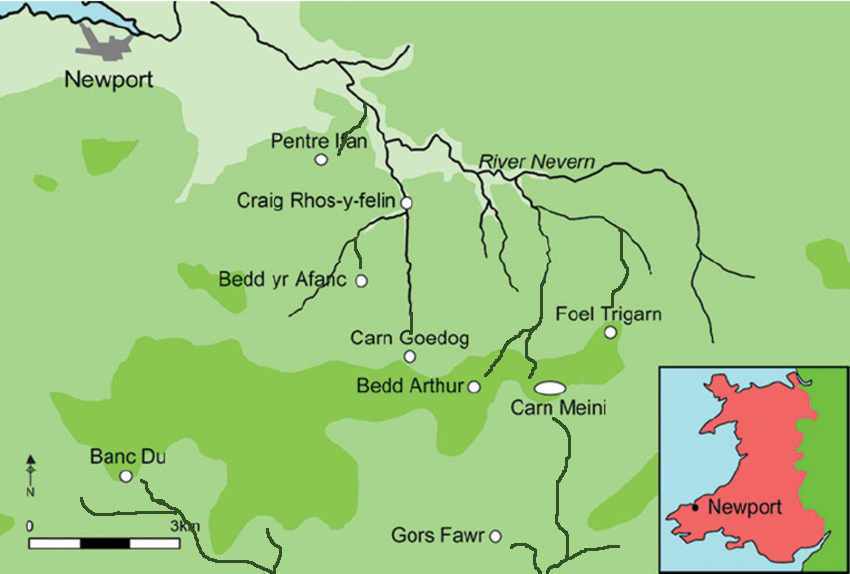
Prescilli Mountains in Wales – The Bluestone Enigma

Craig Rhos-Y-Felin

The publication of the report “Craig Rhos-y-Felin: a Welsh bluestone megalith quarry for Stonehenge” in the December 2016 edition of Antiquity Magazine unveiled intriguing findings about the origins of the bluestones used in Stonehenge. This study, which identified a 4m long monolith at Craig Rhos-y-Felin as microscopically identical to the bluestones at Stonehenge, has sparked significant debate and speculation within the archaeological community and beyond.

Despite the excitement generated by these findings, the report’s focus on two radiocarbon dates that align with the authors’ hypothesis on Stonehenge’s construction date has raised questions about the completeness of the narrative presented to the public. The discrepancy between these dates and the hoped-for evidence led to the speculative suggestion that Stonehenge was originally constructed in Wales and later relocated to Salisbury Plain. This narrative, while intriguing, illustrates the complexities and challenges of interpreting archaeological data, as well as the temptation to fit new evidence into pre-existing hypotheses.

However, a more detailed analysis of the report reveals a wealth of Mesolithic carbon dates obtained from human-made hearths, suggesting a much earlier period of human activity at the site than the two Neolithic dates highlighted. These Mesolithic dates, which significantly predate the construction of Stonehenge as currently understood, were largely overlooked in the public dissemination of the research findings.

The Bluestone Enigma
Quarry Site at Craig Rhos-Y-Felin – The Bluestone Enigma

This oversight raises essential questions about the narrative surrounding Stonehenge’s origins and the methodologies used in archaeological dating. The presence of Mesolithic hearths at Craig Rhos-y-Felin suggests that the site was of importance to human communities thousands of years before the Neolithic period. This evidence challenges the conventional timeline of Stonehenge’s construction and suggests a longer, more complex history of human interaction with the landscape and the bluestones.

Furthermore, the report inadvertently highlights the ongoing debate within archaeology about how best to interpret and present findings to the public. The focus on headline-grabbing narratives, such as the relocation of Stonehenge from Wales, can sometimes overshadow equally significant but less sensational discoveries, such as the evidence of Mesolithic activity at the quarry site.

An Inconvenient TRUTH (Craig Rhos Y Felin)
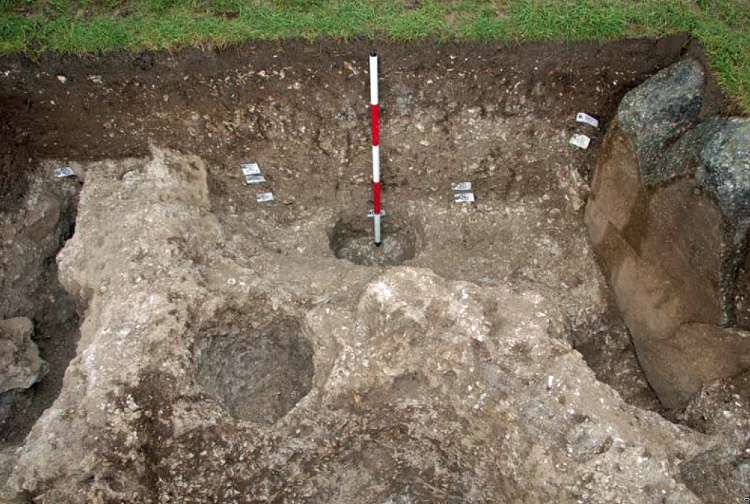
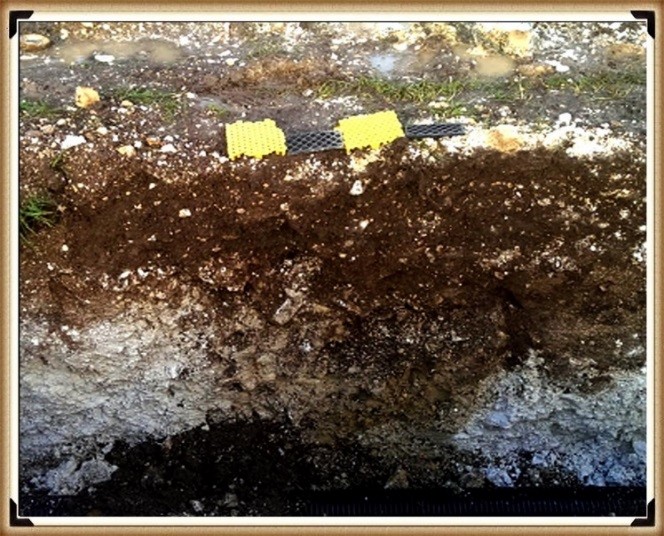
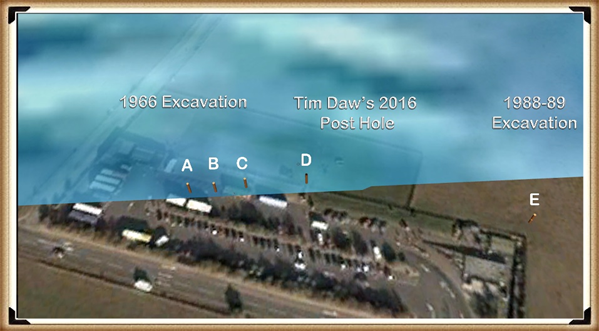
Mesolithic Post Holes at the Old Car Park at Stonehenge – The Bluestone Enigma

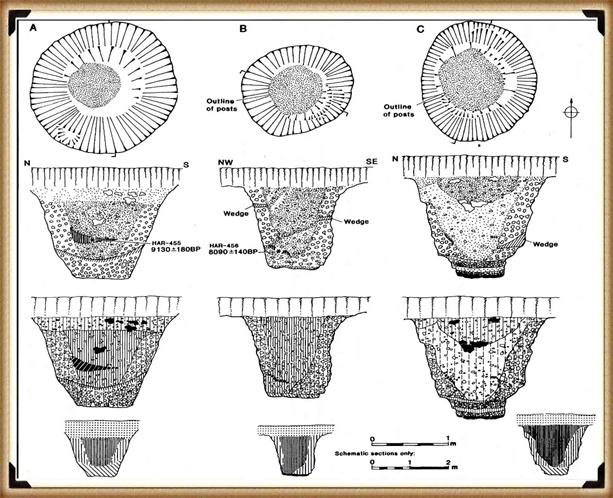
The excavation in 1966 and subsequent discoveries surrounding Stonehenge offer a fascinating and somewhat contentious glimpse into the complex task of accurately dating ancient sites. The initial observations by Lance and Faith Vatcher highlighted the Neolithic character of three holes excavated near Stonehenge, with no datable pottery found. Yet, the characteristics of the holes suggested a Neolithic origin. This assumption was later questioned when a PhD student discovered that the charcoal deposits from these holes, surprisingly composed mostly of pine, could not be Neolithic as initially thought. Pine was believed to be ‘extinct’ in the area by the time of Stonehenge’s supposed construction, according to pollen analysis.

This revelation was startling, especially to the officials of the Historic Buildings and Monuments Commission, later known as English Heritage. The carbon dating of these pine samples placed them squarely in the Mesolithic era, specifically between 8860 to 6590 BCE, challenging the previously accepted timeline for Stonehenge’s construction. Furthermore, the report mentions pine samples from Woodhenge, which, if also Mesolithic, would radically alter our understanding of that site’s age.

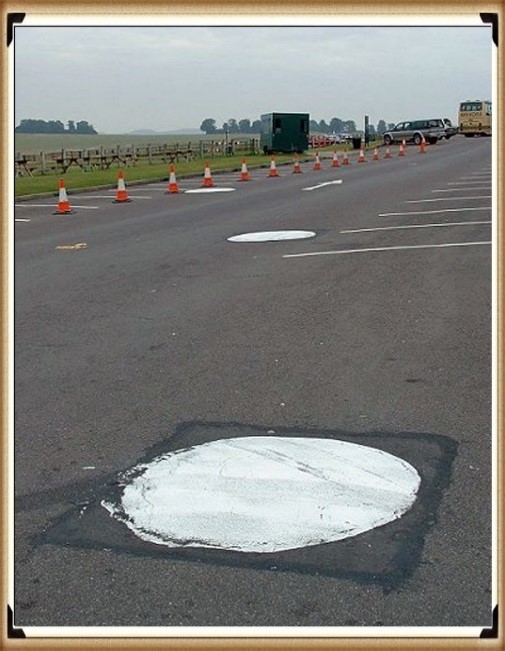
Stonehenge Car Park

Mesolithic Post Holes in Old Car Park – The Bluehenge Enigma

Instead of seizing this opportunity to delve deeper into these findings, a narrative was constructed that dismissed these posts as totem poles from wandering hunter-gatherers, unrelated to Stonehenge. This decision to sideline potentially groundbreaking evidence highlights a reluctance within some parts of the archaeological community to reconsider established narratives, even in the face of new evidence.

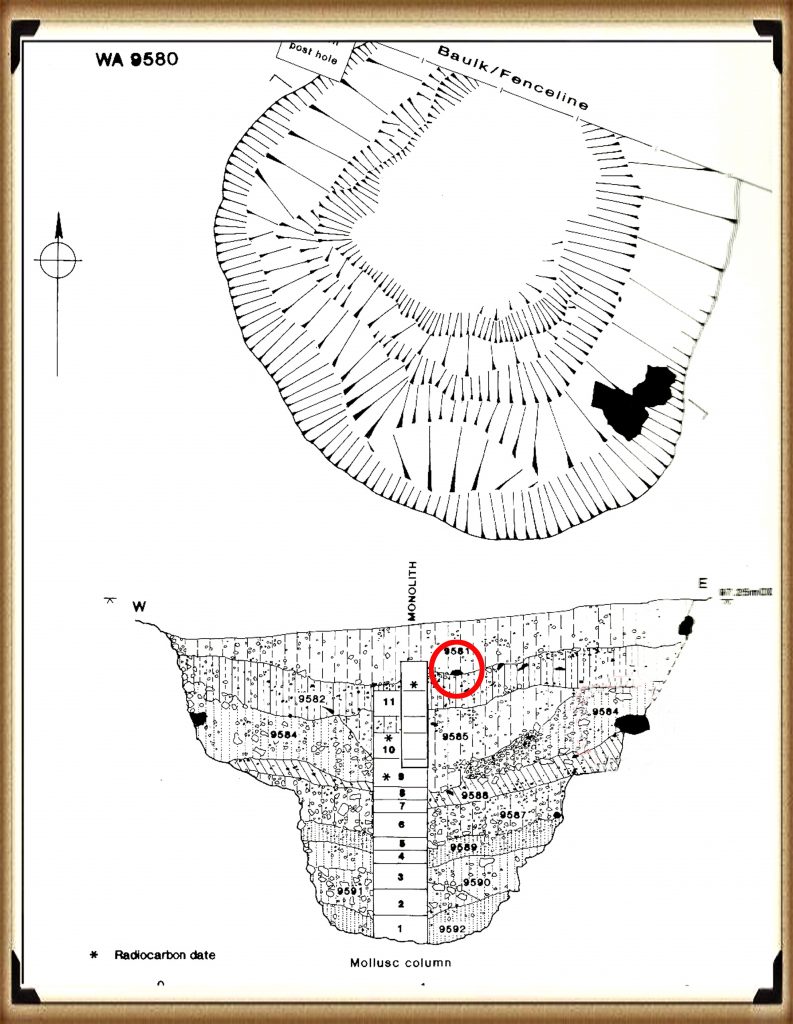
The discovery in 1988-89 by Wessex Archaeology of another Mesolithic post hole, along with a piece of rhyolite dated to 7737 – 7454 BCE, further complicates the timeline for Stonehenge and the surrounding area. This finding should have prompted a reevaluation of the site’s dating. However, attempts to fit this new evidence into the existing narrative of Stonehenge’s construction timeline illustrate the challenges and controversies inherent in archaeological interpretation.

These instances underscore the necessity for openness, curiosity, and a willingness to revise our understanding of history in light of new evidence. They remind us that the story of human history is complex and continually evolving, and our interpretations must adapt as we uncover more about our past.

The Bluestone Enigma
Stone Hole WA9580 shows a piece of Bluestone 5,000 years before they arrived. – The Bluestone Enigma

Discoveries at Stonehenge, including charcoal (OxA-18655) found in the Hole socket of Stone 10, dating to 7330 – 7060 BCE, match the dates of the Mesolithic post holes, with significant implications for our understanding of the site’s history. This evidence, dating to the Mesolithic post holes, suggests that the activities at Stonehenge and its surroundings span much earlier than previously believed. However, the apparent suppression of this news from widespread media coverage raises questions about the narrative presented to the public and in educational materials.

The excavation at Blick Mead, less than a mile from Stonehenge, by the Open University, which uncovered evidence of Mesolithic-period habitation and feasting, further challenges the entrenched views held by some about prehistoric life around Stonehenge. These findings suggest a continuous and significant presence of people in this area during the Mesolithic period, contradicting the simplistic ‘totem pole’ myth still perpetuated in some narratives by English Heritage (EH) through their exhibitions and guidebooks.

Moreover, the recent transformation of the Stonehenge site, including the closure of the B-road past the stones and the relocation of the visitors’ car park to a new, multi-million-pound visitor centre, represents a significant shift in how the site is accessed and experienced by the public. The removal of the old tarmac and the reversion of the land to grass aim to restore a more authentic prehistoric ambience to Stonehenge. This effort to make the site appear more as it did at the time of its construction is commendable, but also highlights the ongoing tension between modern interpretations of the site and the emerging evidence of its ancient past.

These developments at Stonehenge and Blick Mead exemplify the dynamic nature of archaeological research and the complexities involved in interpreting and presenting the past. As new evidence continues to emerge, the narrative of prehistoric Britain needs to evolve accordingly, ensuring a more accurate and nuanced understanding of these ancient landscapes and their significance to human history.

The Bluestone Enigma
In 2008, Stone 10 – Tim Darvill and Geoffrey Wainwright found charcoal dating back to 7330 to 7060 – The Bluestone Enigma

You would indeed think that removing the tarmac from the old visitor car park at Stonehenge, especially given the significant previous findings beneath it, would prompt a comprehensive excavation to unearth more evidence of the site’s Mesolithic history. Such an excavation could potentially transform our understanding of Stonehenge and its origins, providing invaluable insights into its early history and the people who frequented the site during the Mesolithic period.

Tim Daw’s role as a warden at Stonehenge, combined with his proactive approach to documenting changes and features of the site through photography, exemplifies the kind of engaged observation that can lead to important discoveries. His finding of patch marks by the central upright stones, indicating the possible positions of missing stones from the Inner Circle, is a testament to the contributions individuals can make to the ongoing investigation of Stonehenge. Daw’s work underscores the value of continuous and attentive observation of archaeological sites, even by those not formally conducting research.

The Bluestone Enigma
Tim Daw’s evidence of yet another Pit in the Old Car Park not investigated! – The Bluehenge Enigma

The discovery of such features and the potential for further findings beneath the former car park area highlights the need for a thorough and systematic archaeological examination whenever opportunities arise. These efforts not only enrich our knowledge of Stonehenge’s past but also contribute to the broader understanding of prehistoric human activity in the region. As we continue to peel back the layers of Stonehenge’s history, each finding adds a piece to the puzzle of this enigmatic monument’s story, emphasising the importance of preserving and exploring our archaeological heritage.

The Bluestone Enigma
The Post Holes would have been on the shoreline of the River Avon in Mesolithic period – The Bluestone Enigma

Tim Daw’s experiences and observations as a warden at Stonehenge, particularly his discovery of additional post holes beneath the old visitor’s car park, highlight the ongoing potential for new findings that can challenge and enrich our understanding of Stonehenge’s history. Despite being warned against publishing his conclusions due to unauthorised blog activity, Daw chose to resign and continue his work, revealing, through ‘unofficial’ pictures, the existence of even more post holes under the car park, aligned with those discovered in 1966.

Bluestone Quarries

These findings, including the newly discovered post hole that aligns with the four others from 1966, support the hypothesis that these structures are situated on what was once the shoreline of the River Avon around 8000 BCE. This suggests that during the Mesolithic period, the stones quarried in Wales could have been transported by boat directly to Stonehenge, navigating along enlarged rivers rather than taking the longer sea route proposed by some archaeologists.

Further complicating the narrative are my analyses of the bluestone structures from other Preseli sites like Carn Goedog and Craig Talfynyydd, which are connected by streams and rivers to the River Nevern. Unfortunately, archaeologists have interpreted this network of waterways primarily through a religious lens rather than considering its practical functionality as a transportation network.

The persistence of the ‘ox-cart’ route theory, which posits a land route along the modern A40, overlooks the logistical challenges posed by the period’s dense woods, swamps, and forests. Such conditions would have made the construction and use of a road system highly impractical, if not impossible.

My critique extends to the inconsistencies and logical inaccuracies in the archaeological narrative, particularly regarding the site layout and geological evidence at Craig Rhos-y-Felin. The assumption that floodwaters in the area were solely the result of ice melt, quickly draining into the sea post-Ice Age, ignores the broader implications of such flooding for the landscape and its inhabitants.

The Bluestone Enigma
Craig Rhos-Y-Felin is on the edge of a gigantic river of the past – The Bluestone Enigma.

We confirm in the report that an old river ran around this quarry as long ago as 5620 – 5460 BCE and possibly as late as 1030 – 910 BCE.

“Most of the site was then covered by a layer of yellow colluvium (035), dated by oak charcoal to 1030–910 cal BC (combine SUERC-46199; 2799±30 BP and SUERC-46203; 2841±28 BP). This deposit is contemporary with the uppermost fill of a palaeochannel of the Brynberian stream that flowed past the northern tip of the outcrop. Charcoal of Corylus and Tilia from the basal fill of this palaeochannel dates to 5800–5640 cal BC (OxA- 32021; 6833±40 BP) and 5620–5460 cal BC (OxA-32022; 6543±37 BP), both at 95.4% probability.”

An Inconvenient TRUTH (Craig Rhos Y Felin)
The only RED hearths in the site are Mesolithic so they must be quarrying at that time – The Bluestone Enigma


The report’s insights suggest that during the Mesolithic Period, an enlarged stream that fed into the River Nevern reached the quarry outcrop rocks. Notably, it was positioned just a few meters away, even as late as 1000 BCE. This geographical configuration suggests that boats were likely the primary means of transporting the large, newly quarried stones to their final destination at Stonehenge, mirroring stone transport methods in other ancient civilisations, such as Egypt.

The site layout at the quarry provides crucial clues about the timing of the stone quarrying. Notably, a single monolith is positioned near the river on the site’s east side, ready for transportation. Nearby, to the south of this monolith, are human-made hearths, precisely where one would expect them to be. However, the challenge arises in dating these hearths as Mesolithic, with three distinct periods identified: 8550 – 8330 BCE; 8220 – 7790 BCE; and 7490 – 7190 BCE. Despite this, the report asserts that there is no evidence of Mesolithic quarrying or working of rhyolite at this site.

This claim overlooks the practical use of tools across different periods. If Mesolithic and Neolithic communities utilised similar tools, distinguishing tool marks from these different periods might be more challenging than the report suggests. Moreover, the presence of these communities at the quarry for over a millennium raises questions about their activities if not quarrying the stones.

The connection between the quarry site and Stonehenge is strengthened by over twenty Carbon-14 dates that align with my hypothesis, in contrast to the mere two samples currently highlighted by experts, which are dated 300 – 500 years older than existing estimates. By analysing these overlapping dates against the latest carbon-dating curve (IntCal20), we can refine the construction date of Stonehenge’s Phase I (the placement of bluestones in the Aubrey holes). By calculating the mean of these probable dates, we aim to obtain a more accurate estimate of when this monumental task was undertaken, potentially rewriting the timeline of one of the world’s most enigmatic prehistoric monuments.

Carbon Dating

StonehengeOld Car Park (Ref. and Date)Craig Rhos-Y-Felin RefCraig Rhos-Y-Felin DatesCarn Goedog Ref & Dates
Post Hole AHAR-455 (8825 – 7742)SUERC-50761
OxA-30507
OxA- 305481
SUERC-51164
SUERC-50760
OxA-30549
SUERC-51165
OxA-30506
OxA-305482
OxA-305062
OxA-30547
OxA-30504
8550 –  8330
8471 – 8285
8286 – 8163
8289 –  8169
8211 – 7955
8238 – 7941
8216 – 7785
8021 – 7792
8122 – 7962
8207 –  8030
8012 – 7711
8281 –  8166
Post Hole BHAR–456 (7377 – 6651)OxA-3050327232 – 7188OxA31823 – 7190 to 6840
WA 9580GU-5109 (8259 – 7742)OxA- 30548
SUERC-51164
SUERC-50760
OxA-30549
SUERC-51165
OxA-30506
OxA-305482
OxA-305062
OxA-30547
OxA-30504
8286 – 8163
8289 – 8169
8211 – 7955
8238 – 7941
8216 – 7785
8021 – 7792
8122 – 7962
8207 –  8030
8012 – 7711
8281 –  8166
WA 9580QxA-4219 (7737 – 7454)Beta-392850
OxA-30547
7944 – 7648
8012 – 7711
OxA-35184 – 7590 to 7380
WA 9580QxA-4220 (7595 – 7178)SUERC-51163
OxA-30523
OxA-3050311
7539 – 7308
7472 – 7182
7485 – 7248
Carbon Dates comparison – note that the sites are linked to different mooring posts, indicating activity dates

Table 1– Matching Carbon Dates

The calculations indicate that work at the quarry began around 8300 BCE, with its main phase of activity around 8000 BCE, and continued for at least a millennium, challenging the conventional narrative about Stonehenge and its Bluestones. This timeline suggests a far more ancient and enduring connection between the quarry site and Stonehenge than previously acknowledged.

Carn Goedog

Initially, Carn Menyn in the Preseli Hills was believed to be the source of Stonehenge’s spotted dolerite, but later analysis pinpointed Carn Goedog as a closer chemical match. Recent geochemical studies have divided the Stonehenge spotted dolerite into two main groups, with one group closely matching the Carn Goedog outcrop. The origin of the second group remains uncertain, potentially deriving from Carn Goedog or nearby outcrops.

Further geological investigations at Stonehenge have identified additional sources for its bluestones. Unspotted dolerite matches with outcrops at Cerrigmarchogion and Craig Talfynydd on the Preseli ridge. Another bluestone variety, “rhyolite with fabric,” traces back to Craig Rhos-y-Felin, while a source of Lower Palaeozoic sandstone has been identified north of the Preseli hills. The origin of volcanic tuffs found at Stonehenge also likely lies in the Preseli area.

Preseli Mountains and Quarry Sites are ALL by rivers – The Bluestone Enigma

Surface indications of post-medieval Quarrying, particularly on its south side, have evidenced Carn Goedog’s accessibility. This historical quarrying, distinguishable by cylindrical drill holes on some quarried blocks at the outcrop’s base, was performed using the ‘plug-and-feather’ technique with metal wedges. The discovery of a worn trade token beneath one of these blocks helps date this activity to around 1800.

In 2014, test trenching along the southern edge of Carn Goedog revealed layers of human activity spanning various periods, from the recent centuries in trench 3 to deeper prehistorical layers in trench 2. Trench 1, strategically positioned at the outcrop’s base and just beyond the eastern limit of the early modern quarry debris, was particularly significant. It was seen as offering a unique opportunity to uncover evidence of prehistoric quarrying that hadn’t been disturbed by later activities.

This layered historical context at Carn Goedog is crucial for understanding the complex human interactions with the site over millennia. The evidence for prehistoric quarrying, undisturbed by later post-medieval activity, provides invaluable insights into the methods and technologies used by ancient peoples to extract and transport the stones that contributed to the construction of monumental structures like Stonehenge.

The Bluestone Enigma
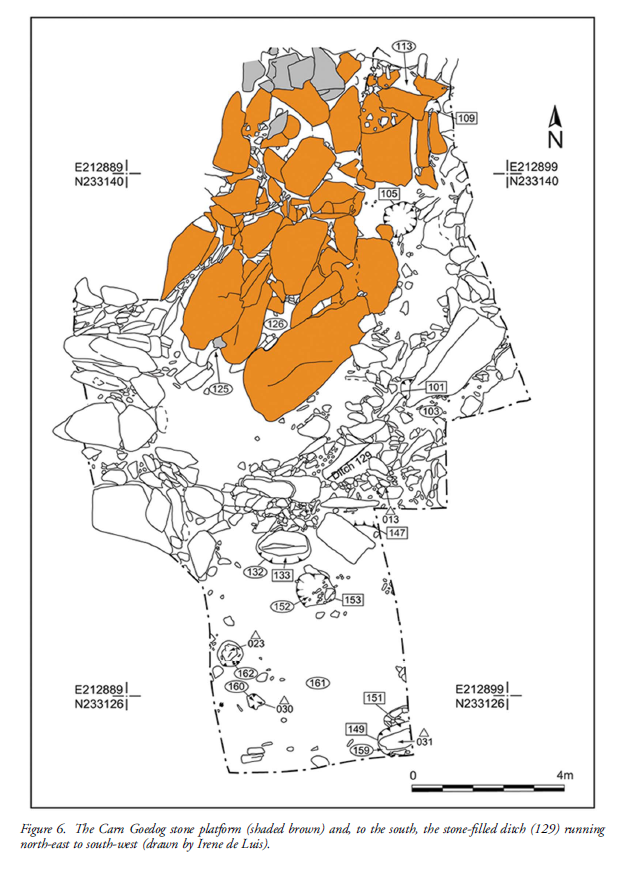
Plan of Excavation 106 is the hearth – The Bluestone Enigma.

Trench 1 was enlarged in 2015 and 2016 to reveal features that may relate to prehistoric quarrying activity. At the southern foot of the outcrop, excavation revealed an artificial platform of flat slabs—many of them split—laid (with the split faces upwards) in a tongue-shaped formation 10m north–south by at least 8m east–west (Figure 6).

Those slabs lying against the face of the outcrop had been pressed into the underlying sediments, presumably by the weight of pillars lowered onto the platform. The platform terminates from the outcrop with a vertical drop of 0.9m to the ground surface beyond. This platform is stratigraphically earlier than a series of deposits that included early modern quarrying debris and hearths of the Roman and medieval periods. One hearth (Figure 6: 105) set within a gap in the platform where a slab had been removed produced charcoal dating to 7190–6840 cal BC (8091±38 BP) and 2890–2630 cal BC (4164±30 BP) (Table 1).

Bluestone Enigma
Bluestone Enigma


The findings across the quarry sites, including Carn Goedog and Craig Rhos-y-Felin, point to a nuanced understanding of how the bluestones were utilised and replenished at Stonehenge. The hearths discovered at these sites, particularly those dating to the Mesolithic and Neolithic periods, suggest ongoing human activity and potentially organised efforts to quarry and transport bluestones over extended periods. This insight challenges the conventional explanation that the transportation of Bluestones to Stonehenge was a singular event.

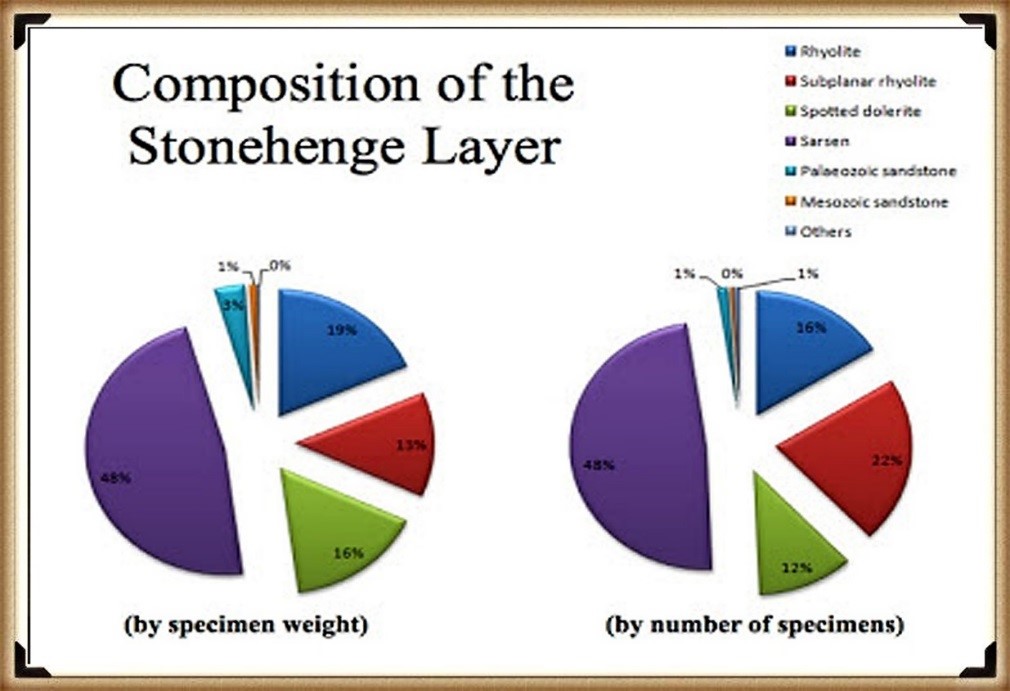
The Stonehenge Layer

The evidence of modern quarrying at both the northern and southern ends of these sites and the dates from central hearths align with observations made at Craig Rhos-y-felin. Our research, as outlined in published books, supports the theory that ancestors chipped bluestones at Stonehenge for healing, utilising the water in the ditch to bathe their sickness away, as evidenced by the ‘Stonehenge Layer’ discovered by Dervill and Wainwright in 2008. This practice would naturally lead to the depletion of bluestones over time, necessitating periodic replenishment from the quarries.

The conventional narrative, which posits that the bluestones were transported to Stonehenge in a one-off event, needs to account for the scientific data emerging from these quarry sites and the Stonehenge site. The evidence suggests a more complex interaction with these stones, involving repeated quarrying and transportation activities that likely spanned centuries. This ongoing relationship with the bluestones reflects a deeper functional connection to them, underscoring the importance of revisiting and revising our understanding of Stonehenge’s construction and the role of the bluestones within this prehistoric monument.

English Heritage’s significant investment in the Stonehenge Visitors Centre, including the creation of exhibitions that present established theories about the monument’s origins and functions, raises questions about the implications of discoveries that contradict these narratives. If foundational assumptions about Stonehenge are proven incorrect, it could have financial repercussions, particularly if the narrative presented to the public through expensive exhibitions becomes outdated or inaccurate. This situation underscores the complex relationship between archaeological research, public interpretation, and financial investments in heritage sites.

PodCast

Author’s Biography

Robert John Langdon, a polymathic luminary, emerges as a writer, historian, and eminent specialist in LiDAR Landscape Archaeology.

His intellectual voyage has been interwoven with stints as an astute scrutineer in government and grand corporate bastions, a tapestry spanning British Telecommunications, Cable and Wireless, British Gas, and the esteemed University of London.

A decade hence, Robert’s transition into retirement unfurled a chapter of insatiable curiosity. This phase saw him immerse himself in Politics, Archaeology, Philosophy, and the enigmatic realm of Quantum Mechanics. His academic odyssey traversed the venerable corridors of knowledge hubs such as the Museum of London, University College London, Birkbeck College, The City Literature Institute, and Chichester University.

In the symphony of his life, Robert is a custodian of three progeny and a pair of cherished grandchildren. His sanctuary lies ensconced in the embrace of West Wales, where he inhabits an isolated cottage, its windows framing a vista of the boundless sea – a retreat from the scrutinising gaze of Her Majesty’s Revenue and Customs, an amiable clandestinity in the lap of nature.

Exploring Prehistoric Britain: A Journey Through Time

My blog delves into the fascinating mysteries of prehistoric Britain, challenging conventional narratives and offering fresh perspectives grounded in cutting-edge research, particularly LiDAR technology. I invite you to explore some key areas of my research. For example, the Wansdyke, often cited as a defensive structure, is re-examined in light of new evidence. I’ve presented my findings in my blog post Wansdyke: A British Frontier Wall – ‘Debunked’, and a Wansdyke LiDAR Flyover video further visualises my conclusions.

My work also often challenges established archaeological dogma. I argue that many sites, such as Hambledon Hill, commonly identified as Iron Age hillforts, are not what they seem. My posts Lidar Investigation Hambledon Hill – NOT an ‘Iron Age Fort’ and Unmasking the “Iron Age Hillfort” Myth explore these ideas in detail and offer an alternative view. Similarly, sites like Cissbury Ring and White Sheet Camp receive re-evaluations based on LiDAR analysis in my posts “Lidar Investigation Cissbury Ring through time” and “Lidar Investigation White Sheet Camp, revealing fascinating insights into their true purpose. I have also examined South Cadbury Castle, often linked to the mythical Camelot56.

My research also extends to ancient water management, including the role of canals and other linear earthworks. I have discussed the true origins of Car Dyke in multiple posts, including Car Dyke – ABC News Podcast and Lidar Investigation Car Dyke – North Section, which suggest a Mesolithic origin 2357. I also explore the misidentification of Roman aqueducts, as seen in my posts on the Great Chesters (Roman) Aqueduct. My research has also been greatly informed by my post-glacial flooding hypothesis, which has helped explain landscape transformations over time. I have discussed this hypothesis in several posts, including AI now supports my Post-Glacial Flooding Hypothesis and Exploring Britain’s Flooded Past: A Personal Journey

Finally, my blog also investigates prehistoric burial practices, as seen in Prehistoric Burial Practices of Britain and explores the mystery of Pillow Mounds, often mistaken for medieval rabbit warrens, but with a potential link to Bronze Age cremation in my posts: Pillow Mounds: A Bronze Age Legacy of Cremation? and The Mystery of Pillow Mounds: Are They Really Medieval Rabbit Warrens?. My research also includes astronomical insights into ancient sites, for example, in Rediscovering the Winter Solstice: The Original Winter Festival. I also review new information about the construction of Stonehenge in The Stonehenge Enigma.

Further Reading

For those interested in British Prehistory, visit www.prehistoric-britain.co.uk, a comprehensive resource featuring an extensive collection of archaeology articles, modern LiDAR investigations, and groundbreaking research. The site also includes insights and excerpts from the acclaimed Robert John Langdon Trilogy, a series of books that explore Britain during the Prehistoric period. Titles in the trilogy include The Stonehenge Enigma, Dawn of the Lost Civilisation, and The Post-Glacial Flooding Hypothesis, which offer compelling evidence of ancient landscapes shaped by post-glacial flooding.

To further explore these topics, Robert John Langdon has developed a dedicated YouTube channel featuring over 100 video documentaries and investigations that complement the trilogy. Notable discoveries and studies showcased on the channel include 13 Things that Don’t Make Sense in History and the revelation of Silbury Avenue – The Lost Stone Avenue, a rediscovered prehistoric feature at Avebury, Wiltshire.

In addition to his main works, Langdon has released a series of shorter, accessible publications, ideal for readers delving into specific topics. These include:

For active discussions and updates on the trilogy’s findings and recent LiDAR investigations, join our vibrant community on Facebook. Engage with like-minded enthusiasts by leaving a message or contributing to debates in our Facebook Group.

Whether through the books, the website, or interactive videos, we aim to provide a deeper understanding of Britain’s fascinating prehistoric past. We encourage you to explore these resources and uncover the mysteries of ancient landscapes through the lens of modern archaeology.

For more information, including chapter extracts and related publications, visit the Robert John Langdon Author Page. Dive into works such as The Stonehenge Enigma or Dawn of the Lost Civilisation, and explore cutting-edge theories that challenge traditional historical narratives.

Other Blogs

s

t

First Hillforts, Then Mottes — Now Roman Forts? A Century of Misidentification

Chapter 1 — The Problem with the Story

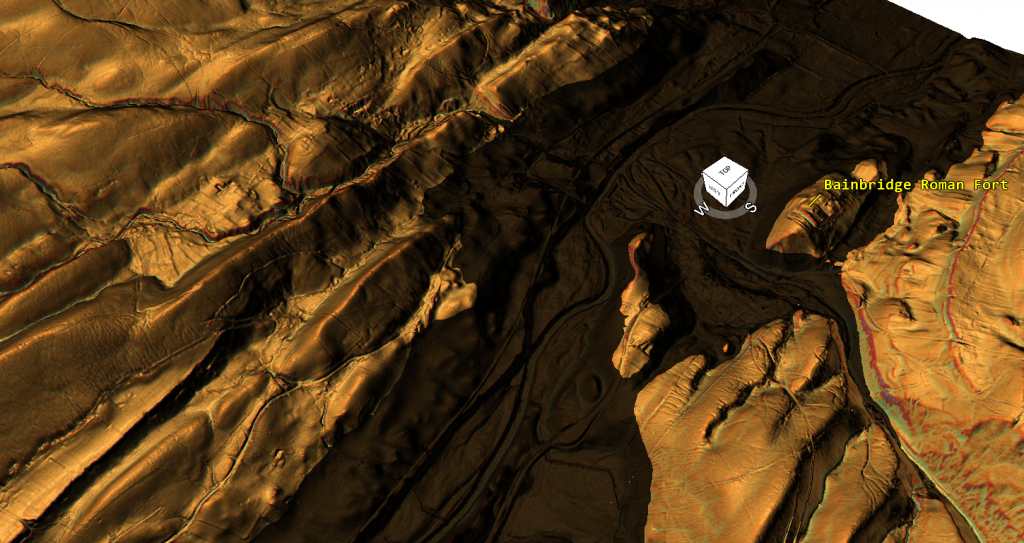
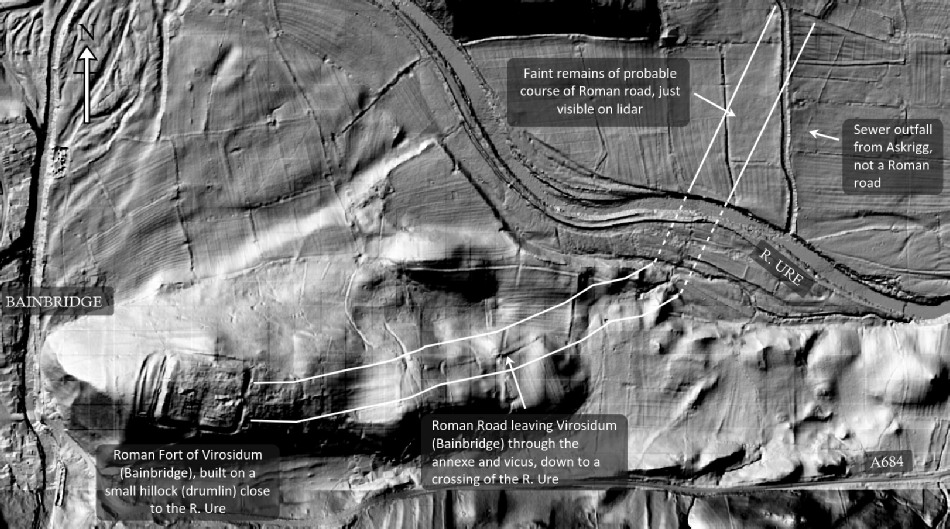
Bainbridge, known in the Roman period as Virosidum, is almost universally described as a standard Roman auxiliary fort. The explanation usually follows a familiar pattern: the fort controlled movement through Wensleydale, was supplied by Roman roads, and functioned as a military garrison in an otherwise quiet upland landscape. This narrative appears in guidebooks, gazetteers, official records, and popular archaeology alike. It is repeated so often that it has become a fact. (Bainbridge Roman Fort)

But repetition is not evidence.

The central problem with the Bainbridge story is not that it is impossible, but that it has rarely been tested against the physical landscape. Interpretation has tended to move in one direction only. Once Roman occupation is identified, roads are assumed, defences are supposed to behave conventionally, and surrounding earthworks are absorbed into a military narrative whether or not their form, scale, or placement actually supports that role. The questions that should come first — what the terrain shows, what was excavated, and what functions the measured features support — have largely been left unasked.

This matters because Roman military installations were not symbolic structures. They were functional systems, engineered to solve specific problems: defence, logistics, production, and control. Roman ditches, ramparts, roads, and drains were designed according to purpose, not tradition. If a feature cannot plausibly perform its supposed function when examined geometrically and physically, then the interpretation attached to it deserves re-examination, regardless of how long it has been accepted.

Recent decades have provided archaeology with a powerful corrective tool: high-resolution LiDAR, combined with satellite measurement and improved landscape modelling. These technologies allow entire sites to be examined without the distortion introduced by vegetation, later land use, or selective trenching. When excavation records are re-examined alongside these datasets, interpretation can finally be tested against scale, depth, and behaviour, rather than inferred from labels.

At Bainbridge, this immediately creates tension. The site is isolated. It does not clearly defend a town, a frontier, a pass, or a demonstrable engineered route. The surrounding earthworks do not behave like textbook Roman military defences when measured. And perhaps most significantly, the excavation evidence from within the site points not to a quiet garrison but to organised, specialist industrial activity, including ironworking, copper-alloy casting, and silver assaying.

These are not marginal details. They go to the heart of what the site was for.

There is also a deeper assumption that requires scrutiny: the idea that Roman-period occupation automatically implies Roman origin. Across Britain, Roman forts, temples, and administrative buildings frequently sit on earlier places of importance. The presence of a Roman temple at Maiden Castle, for example, does not make the hillfort Roman in origin; it demonstrates Roman reuse of an existing landscape. Roman material culture has a habit of dominating interpretation once it appears, pulling earlier phases into its orbit even when the evidence does not demand it.

The excavation reports at Bainbridge do not rule out earlier activity, nor do they claim that the site was founded on a blank landscape. They record complexity, phased development, and features whose function is not fully resolved. What has tended to happen since is that Roman occupation has been allowed to define the entire story, rather than being treated as one phase within a longer sequence.

This blog does not claim that Bainbridge must be pre-Roman. It makes a more cautious and defensible point: Roman presence does not, by itself, explain why this place mattered. Given the site’s hydrological position, landscape-scale earthworks, and industrial function, it is entirely plausible that the Romans formalised, enclosed, and secured a place that already had economic or strategic significance.

That distinction matters. It changes the central question from “why did the Romans build a fort here?” to “why was this place important long before a fort existed?”

What follows is not speculation, but a step-by-step examination of excavation data, ditch geometry, LiDAR profiles, satellite measurements accurate to within half a metre, and basic principles of Roman engineering. When these strands are allowed to speak together, the traditional garrison-fort narrative begins to fail — not dramatically, but decisively.

The landscape has been telling us a different story all along.
We are finally in a position to listen.

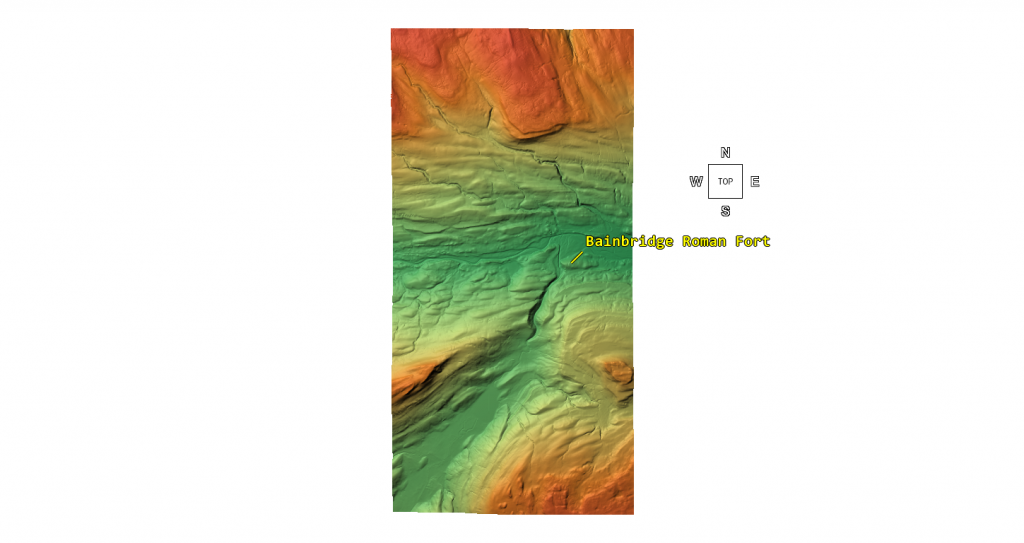
(Bainbridge Roman Fort)
The Fort’s position in the middle of a Paleochannel is a clue that this was a water-based site. – (Bainbridge Roman Fort)

Chapter 2 — What Roman Defensive Ditches Are Supposed to Do

Roman military engineering was not symbolic, stylistic, or vague. It was functional, standardised, and purpose-built. Every component of a Roman fort — ramparts, ditches, gates, roads, drains — existed to solve a clearly defined problem. If a feature does not perform its supposed function when examined physically, then its interpretation deserves scrutiny, regardless of how often it has been repeated in the literature.

The defensive ditch (fossa) is a good place to start, because its purpose is unambiguous. A Roman defensive ditch is not merely a boundary marker; it is an active obstacle designed to slow, destabilise, injure, and expose attackers to missile fire from the rampart. This function dictates its geometry.

Across Roman Britain, the defensive ditch typically exhibits three consistent characteristics:

First, depth. A functional Roman leg-breaker ditch is usually between 1.8 and 3.0 metres deep. Depth matters more than width. A shallow ditch may inconvenience movement, but it does not seriously impede a determined attacker. Roman engineers understood this perfectly.

Second, profile. Defensive ditches are usually steep-sided and V-shaped, sometimes with an additional ankle-breaker slot or drainage channel cut into the base. The steep sides make footing difficult, while the narrow base concentrates weight and increases the risk of injury. These profiles are hostile by design.

Third, placement. Roman defensive ditches sit immediately in front of ramparts, creating a combined system: ditch, rampart, and palisade or wall working together. The ditch is not an isolated feature; it is part of an integrated defensive machine.

When these conditions are met, the ditch works. When they are not, it doesn’t.

Importantly, Roman engineers did not waste labour. Digging earth was expensive in terms of human resources, and unnecessary excavation was avoided. A ditch that is wide but shallow, gently sloped, or easily crossed represents poor return on effort if its purpose is defence. Such features may look impressive on a plan, but they do not function as military obstacles.

This distinction is critical because archaeological descriptions often rely on shorthand. A ditch may be described as “V-shaped” in text, but without reference to depth, angle, or context, that label alone tells us very little about function. A shallow V-shaped channel can serve drainage just as easily as defence — sometimes more so.

Roman sites also contain many ditches that are not defensive at all: drains, construction cuttings, boundary markers, water-management features, industrial channels, and temporary works. These are frequently narrower, shallower, and more responsive to local topography than true defensive fossae. Function cannot be inferred from shape alone.

This is why geometry matters. Width, depth, slope angle, placement, and relationship to other features determine what a ditch does, not what it is called. Any interpretation that ignores these variables in favour of typological labels is vulnerable to error.

The purpose of this chapter is not to deny the existence of Roman defensive ditches — they are well documented and unmistakable when present. It is to establish a clear, testable baseline: if a ditch cannot plausibly function as a defensive obstacle, then it should not be interpreted as one without further evidence.

With that baseline in place, we can now return to Bainbridge and ask a simple, unavoidable question: do the ditches recorded there behave like Roman military defences — or do they act like something else entirely?

(Bainbridge Roman Fort)

Chapter 3 — What the Excavations Actually Recorded

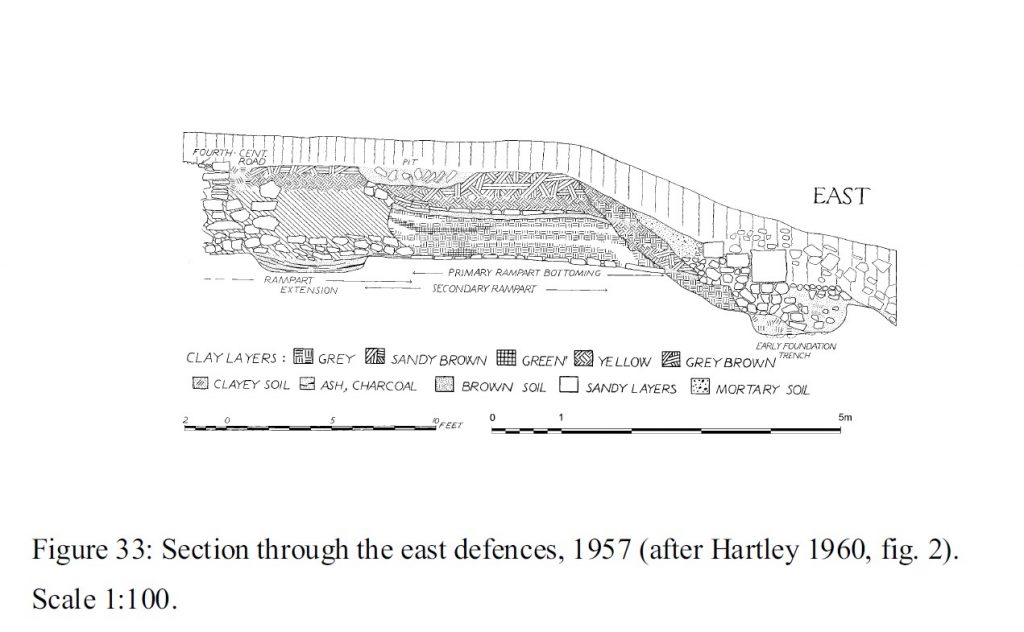
Any serious reassessment of Bainbridge must begin with the excavation record, not with later summaries, gazetteers, or interpretive maps. The primary excavations at Bainbridge — carried out by Collingwood, Wade, and later synthesised by Hartley — were careful, methodical, and largely limited in scope. They did not attempt a landscape-scale investigation. What they recorded, and what they did not, matters.

One of the most important points to establish immediately is that the excavators did not describe a single, uniform defensive system. Instead, they recorded ditches of different types in different positions, with markedly different dimensions and characteristics. Later interpretations have tended to collapse these distinctions into a single “Roman defensive ditch” narrative, but the original data does not support that simplification.

The excavations clearly identify an inner ditch, closely associated with the rampart. This ditch conforms broadly to expectations for Roman military engineering. It is relatively narrow, steep-sided, and, in places, V-shaped, sometimes with a square-cut drainage slot at the base. Its depth is significantly greater than the outer features, and its position immediately in front of the rampart makes defensive sense. There is no controversy here: this inner ditch behaves like a Roman military fossa.

However, beyond this inner ditch, the excavators encountered additional outer ditches, particularly on the western side of the site. These are the features that matter for the present discussion—and they are fundamentally different.

The published reports describe these outer ditches as broad and shallow, with recorded depths typically ranging from 0.4 to 1.0 metres. Widths are substantially greater than those of the inner ditch, reaching up to roughly 8 metres in some excavated sections. Spoil from these cuts was often thrown outward to form low, wide scarps, rather than steep rampart faces. These are not incidental details; they define how the features function.

Crucially, the excavators themselves note that these outer ditches were relatively short-lived, often deliberately backfilled rather than allowed to silt naturally. This behaviour is difficult to reconcile with long-term defensive use, but entirely consistent with features that were functional, temporary, or periodically reconfigured.

Although some of these outer ditches are described in the text using shorthand terms such as “V-shaped”, the accompanying measurements and section drawings tell a more nuanced story. A shallow cut with gently sloping sides can technically be V-shaped without functioning as a leg-breaker. Geometry, not vocabulary, determines function.

It is also important to note what the excavations did not do. They did not systematically section the broader landscape features now visible on LiDAR. They did not attempt to trace these ditches beyond the immediate vicinity of the fort. They did not integrate hydrology, slope behaviour, or wider landscape management into their interpretation. These omissions are understandable given the period in which the excavations were conducted, but they limit what can legitimately be concluded.

What the excavation record therefore gives us is not a simple answer, but a set of constraints. It shows that Bainbridge had at least one conventional Roman defensive ditch near the rampart. It also shows that it possessed additional, much broader and shallower ditches whose form, depth, and treatment differ markedly from standard military defences.

The mistake comes later, when these distinct features are treated as if they belong to a single defensive logic. Once the inner and outer ditches are merged, the site can be described as a typical fort with unusually large defences. But when they are kept separate — as the excavators themselves recorded them — a different picture begins to emerge.

The excavation evidence does not demand that all ditches at Bainbridge were defensive. On the contrary, it quietly suggests that they were not all doing the same job.

With this distinction firmly in place, we can now turn to the critical question that follows naturally from the data: if the outer ditches were not functioning as leg-breaker defences, what were they actually for?

That question leads directly to the cross-sections—and to the point where the traditional narrative begins to fail.

(Bainbridge Roman Fort)
Cross-Section – (Bainbridge Roman Fort)

Chapter 4 — The Cross-Sections No One Talks About

Archaeological interpretation often leans heavily on labels: “defensive ditch”, “V-shaped”, “Roman military”. But labels only have meaning if the geometry behind them actually works. At Bainbridge, the cross-sections recorded during excavation — and now independently confirmed through LiDAR and satellite measurement — quietly undermine the defensive interpretation that has been attached to the outer ditches for decades.

The critical issue is not whether a ditch can be described as “V-shaped” in plan or section. The question is whether that ditch can function as a Roman military obstacle. When the excavated cross-sections of the outer ditches are adequately examined, the answer is clear: they cannot.

The excavated outer ditches at Bainbridge are consistently recorded as very shallow, typically in the range of 0.4 to 1.0 metres deep, and relatively broad, with widths approaching 8 metres. The section drawings show gently sloping sides and a flattened or rounded base. Even where the profile converges toward a point, the angles are shallow, and the overall depth is minimal. This is not a leg-breaker. It is not even close.

A Roman defensive ditch is designed to destabilise, injure, and delay an attacker. A ditch less than a metre deep fails all three tests. An adult can step into and out of it with little loss of balance. A group can cross it rapidly. There is no meaningful exposure time beneath the rampart, and no realistic risk of injury. Calling such a feature “defensive” relies entirely on terminology, not on function.

Depth is decisive here. Roman engineers did not rely solely on width. A wide but shallow ditch is inefficient: it requires substantial labour to excavate but delivers little defensive benefit. Roman military practice favoured depth and steepness, not broad shallow cuts. This is why classic Roman fossae are narrow, steep, and often augmented with ankle-breaker slots. The Bainbridge outer ditches exhibit none of these characteristics.

Context makes the defensive interpretation even weaker. Some of these shallow ditches lie inside the broader defensive system, not immediately in front of the rampart where a leg-breaker would be effective. A shallow obstacle placed internally makes no military sense at all. You do not defend a fort by creating trip hazards within your own circulation space, particularly in a site that shows long-term occupation, movement of materials, and industrial activity.

Once defence is removed from the equation, the geometry starts to make sense. Shallow, broad ditches are extremely effective for water management. They collect runoff from ramparts and slopes, control drainage across the site, and prevent waterlogging of working areas. In an industrial context — especially one involving metalworking — this is not incidental infrastructure. It is essential.

The excavation reports themselves hint at this functional reality, even if they stop short of stating it explicitly. The outer ditches are described as short-lived, deliberately backfilled, and lacking evidence of long-term silting. These are not the characteristics of permanent military defences. They are the characteristics of managed features, which are altered or replaced as needs change.

When these cross-sections are compared with modern LiDAR profiles and satellite measurements — accurate to within approximately ±0.5 metres — the match is striking. The shallow depths and broad profiles seen in excavation align closely with what is visible across the wider landscape today. There is no contradiction between excavation and remote sensing. The contradiction lies between the data and the interpretation.

This is the point at which the traditional narrative breaks. A ditch that cannot function as a defensive obstacle should not be interpreted as one simply because a fort exists nearby. Geometry does not lie, and physics does not bend to narrative convenience.

The cross-sections at Bainbridge do not describe a fortress bristling with hostile obstacles. They describe a site where water, movement, and activity were being managed, not where attackers were being repelled.

Once this is recognised, the question is no longer “why are these defences so odd?”
It becomes “why was water management so important here?”

And that question leads directly to industry.

(Bainbridge Roman Fort)
LiDAR Moat measurement – (Bainbridge Roman Fort)

Chapter 5 — LiDAR, Satellite Measurement, and Ground Truth

One of the strengths of modern archaeology is that excavation no longer stands alone. Features recorded decades ago in narrow trenches can now be tested against whole-landscape datasets that reveal form, scale, and context with far greater clarity. At Bainbridge, high-resolution LiDAR and satellite measurements do not contradict the excavation evidence—they confirm it and, in doing so, expose the weakness of the traditional interpretation.

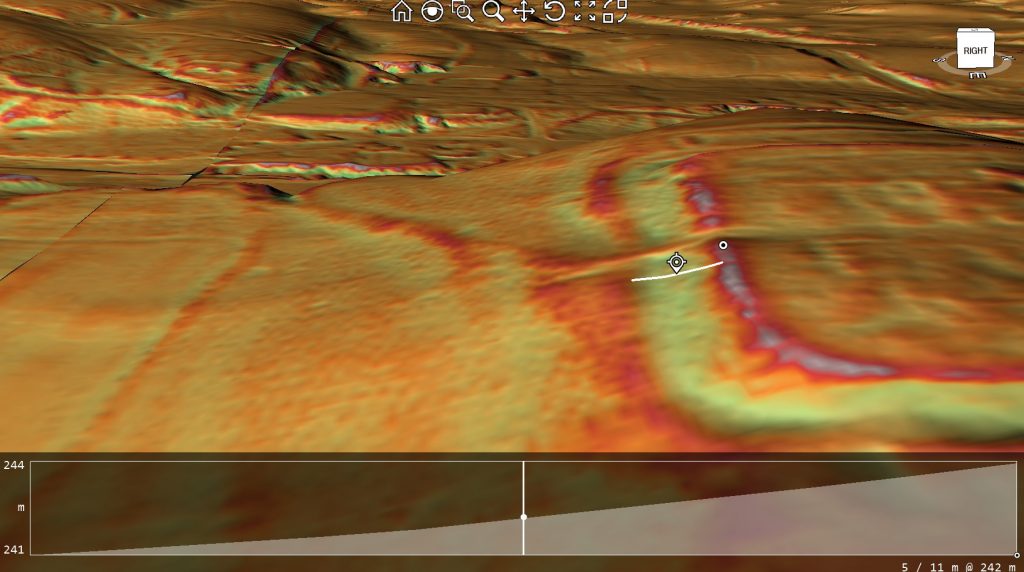
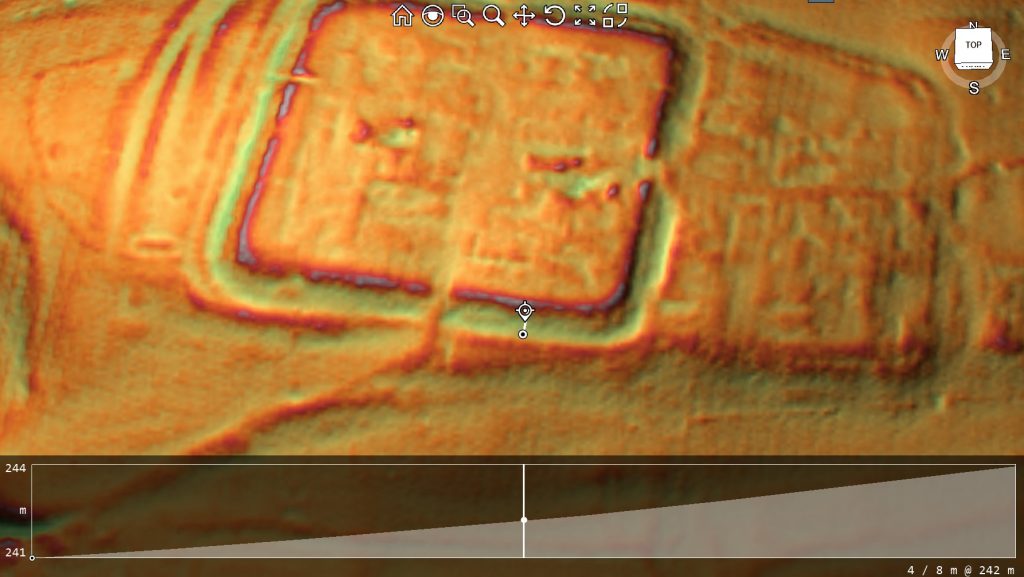
LiDAR has a particular advantage in that it removes vegetation and modern land use from the equation. When examined using multiple hillshades, colour relief, and oblique or horizontal views, features that are genuinely engineered behave very differently from those produced by drainage, erosion, or long-term landscape management. Roman military works, when present, tend to stand out clearly: aggers persist, ditch lines remain crisp, and geometry resists topography. At Bainbridge, that behaviour is notably absent outside the inner defensive zone.

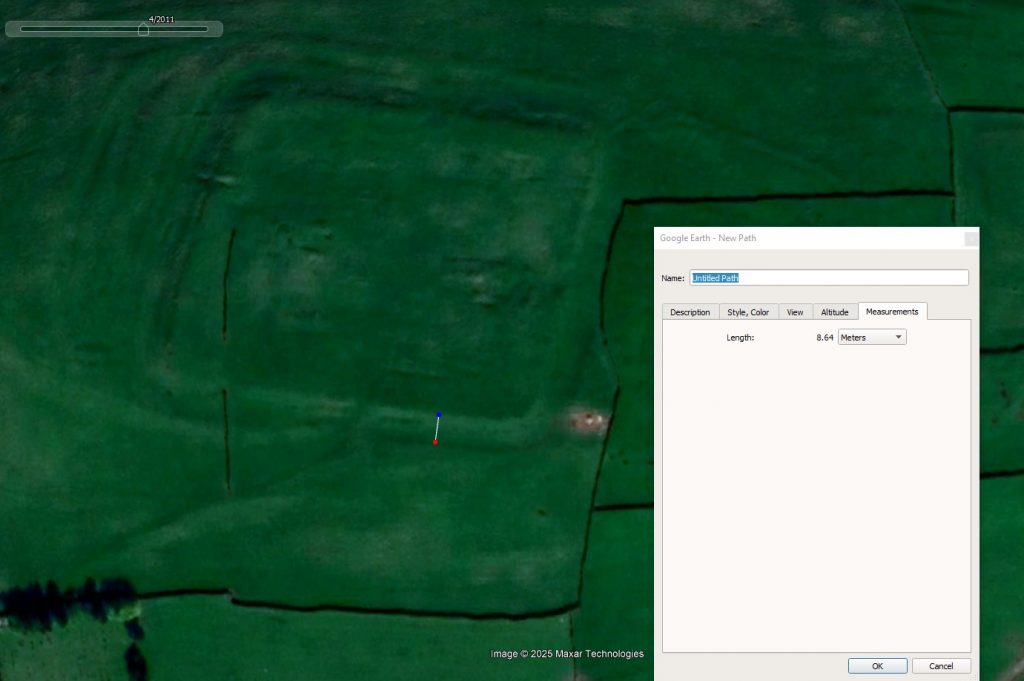
Using LiDAR profiles and Google Earth measurement tools, the principal outer ditch surrounding the site can now be measured with reasonable confidence. Across multiple transects, the ditch consistently falls within a width range of approximately 8.0–8.6 metres, with measurement accuracy to around ±0.5 metres. This result is not derived from a single section or favourable angle; it repeats across the landscape wherever the feature is visible.

Just as important as width is profile. The LiDAR cross-sections show a broad, shallow cut with gently sloping sides and no sharply incised base. There is no indication of a steep V-profile, no ankle-breaker slot, and no abrupt edge that would signal a deliberately hostile obstacle. Instead, the ditch blends smoothly into the surrounding slope, exactly as described in the excavation sections of the outer ditches.

This correspondence matters. It means the excavated sections were not anomalies or local quirks; they were representative of a much larger, coherent landscape feature. LiDAR does not reveal a hidden deeper ditch waiting to be found. It reveals continuity—the same shallow geometry repeated beyond the excavation trenches.

Equally telling is what LiDAR does not show. There is no evidence of large-scale rampart construction associated with these broad ditches. There is no agger-like build-up of material, no sharp counterscarp, and no consistent defensive frontage. The spoil appears dispersed or levelled rather than piled into a formidable barrier. This is consistent with features designed to manage space or water, not to resist assault.

Satellite imagery reinforces the same picture. Measurements taken independently of LiDAR produce comparable widths and confirm that the feature is not the result of modern agricultural activity or mapping artefact. The ditch respects natural slope and drainage patterns rather than imposing a rigid, engineered geometry across them. That behaviour is fundamentally non-military.

What is especially significant is that these measurements now remove uncertainty. Debate no longer hinges on impressionistic descriptions such as “large” or “substantial”. We are dealing with quantified geometry. An outer ditch approximately 8–8.6 metres wide and less than a metre deep simply does not behave like a Roman defensive work, regardless of how it has been labelled in the past.

This also resolves a long-standing interpretive tension. Excavation reports described shallow, broad ditches that did not sit comfortably within a defensive model, while later summaries continued to treat them as such. LiDAR bridges that gap by showing that the excavators were accurately recording the feature—and that the problem lies in how those records were later interpreted.

At this point, the question shifts again. If excavation sections and modern landscape data tell the same story, and that story is incompatible with defence, then the interpretation must change. The outer ditches at Bainbridge were doing something, but that something was not stopping attackers.

Measured against the ground itself, the evidence is no longer ambiguous.
The outer ditches are real, coherent, and deliberate — but they are not military defences.

Understanding what they were for requires us to stop thinking like soldiers and start thinking like engineers.

(Bainbridge Roman Fort)

Chapter 6 — Why These Ditches Cannot Be Defensive

By the time geometry, depth, and landscape context are considered together, the defensive interpretation of Bainbridge’s outer ditches becomes increasingly difficult to sustain. This is not a matter of alternative opinion; it is a matter of function. A feature that cannot physically perform the task assigned to it should not continue to be interpreted as if it does.

A Roman defensive ditch works because it creates risk and delay. Its purpose is to force attackers to descend into a confined space, lose balance, and expose themselves to missiles while struggling to climb out. This requires depth, steep sides, and placement directly in front of a rampart. A ditch that is shallow, broad, and gently sloped fails on every count.

At Bainbridge, the outer ditches are consistently less than a metre deep. Even allowing for erosion, backfilling, or truncation, their present profiles do not approach the depth required for a leg-breaker. An able-bodied adult can step into and out of such a ditch with little difficulty. Groups could cross it rapidly, carts could be manhandled across it, and animals would not be seriously impeded. As a military obstacle, it is ineffective.

Placement further weakens the defensive argument. Some of these ditches lie well beyond the immediate rampart zone, while others sit in positions that would place them inside the broader circulation space of the site. Roman forts were busy environments. Soldiers, pack animals, carts, and supplies moved constantly. Introducing shallow obstacles within or immediately adjacent to internal working areas would hinder daily operation far more than it would hinder an attacker. Roman military design avoids this.

The labour logic is also wrong for defence. Digging an eight-metre-wide ditch requires significant effort. Roman engineers did not expend manpower on features that offered poor defensive return. If defence were the aim, the same labour could have produced a far deeper, steeper, and more effective obstacle. The fact that it did not strongly suggests that defence was not the priority.

Once the defensive explanation is removed, the geometry starts to make sense in a different way. Broad, shallow ditches are highly effective at controlling water. They intercept runoff from ramparts and slopes, channel excess water away from working areas, and reduce erosion. In valley-side locations like Bainbridge, managing water is not optional — it is essential to keeping a site functional.

This is particularly relevant given what the excavations reveal about activity within the site. Metalworking requires water at multiple stages: cooling and quenching hot metal, washing ores, managing ash and waste, and preventing working surfaces from becoming waterlogged. Shallow, wide ditches allow water to move predictably and safely through a site without cutting deep scars or destabilising structures.

The excavation reports themselves support this functional reading, even if they stop short of stating it outright. The outer ditches are described as short-lived, deliberately backfilled, and frequently reworked. Defensive ditches are normally maintained; water-management features are altered as needs change. The behaviour recorded in the ground fits the latter pattern far better than the former.

There is also a conceptual issue at play. Archaeology has a tendency to treat all ditches associated with a fort as “defensive” by default. Yet Roman sites are full of non-defensive cut features that serve practical purposes. Drainage, construction, zoning, and industrial processes all generate ditches that can superficially resemble defences when stripped of context.

At Bainbridge, the evidence points consistently in one direction. The outer ditches lack the depth, profile, placement, and permanence required for military defence. They possess exactly the characteristics expected of managed infrastructure in a working, industrially active site.

If these ditches were not built to stop enemies, then the key question changes again. It is no longer “why is this fort so strangely defended?”
It becomes “why was water management so critical to the operation of this site?”

Answering that question takes us directly to industry.

(Bainbridge Roman Fort)
The Area is covered with Quarries, and there is no footpath into the fort; it is recent -(Bainbridge Roman Fort)

Chapter 7 — Water, Industry, and the Infrastructure Everyone Ignored

Once the defensive interpretation of the outer ditches is set aside, the question is no longer why Bainbridge’s defences look wrong, but why water management appears to have been such a priority. At this point, the excavation evidence and the landscape data begin to reinforce one another in a way that is difficult to ignore.

Bainbridge sits on a valley-side position above the River Bain, close to its confluence with the Ure. This is a hydrologically active setting. Runoff from higher ground, seasonal saturation, and fluctuating water tables would all have affected the site. Any long-term occupation here — military or otherwise — would have required deliberate control of surface and subsurface water.

The geometry of the outer ditches fits this requirement precisely. Broad, shallow channels are highly effective at intercepting runoff, slowing flow, and directing water away from key working areas without destabilising buildings or ramparts. Their gentle slopes reduce erosion, while their width allows them to function even during periods of heavy rainfall. This is infrastructure designed for management, not obstruction.

This matters because Bainbridge was not a quiet administrative outpost. The excavations demonstrate repeated and sustained industrial activity within the site, including iron smithing, copper-alloy casting, and silver assaying. These are water-dependent processes. Metalworking generates heat, waste, slag, ash, and residues that must be cooled, quenched, washed, and removed. Without reliable drainage, such activity quickly becomes impractical.

In this context, water is not an afterthought — it is a requirement. Controlled drainage protects furnaces and working floors, prevents contamination of materials, and allows waste to be managed rather than dispersed randomly across the site. Shallow ditches that can be altered, backfilled, or re-cut as production needs change are exactly what one would expect in a working industrial environment.

The excavation reports quietly support this interpretation. The outer ditches are repeatedly described as short-lived and deliberately backfilled. This behaviour makes little sense for defensive features, which are normally maintained and periodically re-cut. It makes perfect sense for functional infrastructure that is modified as layouts change, activities expand or contract, or new working zones are established.

The presence of coal as a fuel source strengthens this picture further. Coal use implies sustained, high-temperature operations rather than occasional repair work. It also implies smoke, waste, and heat management challenges — all of which benefit from controlled airflow and drainage. Water management and industrial activity are inseparable in such settings.

Seen in this light, the outer ditches are not anomalous at all. They are part of a managed operational landscape, designed to keep a busy, productive site functioning over a long period. Their scale reflects the scale of activity, not the scale of threat.

This also explains why these features do not conform to textbook Roman military design. They were not built to meet a standard defensive template; they were built to meet local, practical needs. Roman engineers were pragmatic. They adapted form to function, especially in economically important sites.

Once water management is recognised as a central concern, Bainbridge stops looking like a strangely defended fort and starts looking like a place of work — a site where control, organisation, and infrastructure mattered more than spectacle.

And that leads directly to the next question: if Bainbridge was an industrial site first and a military site second, what was the military actually there to do?

That question takes us straight to security, control, and the real role of the garrison.

(Bainbridge Roman Fort)
Mineral Extraction has happened since the Mesolithic Period in Britain – (Bainbridge Roman Fort)

Chapter 8 — Why This Was Not a Garrison, but a Controlled Production Site

Chapter 8 – The Metalworking Evidence and the Question of Origin

One of the strongest pieces of evidence at Bainbridge has always been the scale and diversity of metalworking debris recovered during excavation. This includes ironworking waste, copper-alloy residues, silver-processing material, coal, and lead-based by-products. Such an assemblage immediately distinguishes the site from a routine military garrison, where limited repair and small-scale production would normally be expected. Instead, the material points to sustained industrial activity.

The published analysis usefully presents the metalworking debris by chronological phase, expressed by weight. When examined closely, however, this distribution raises a critical question that has not been fully explored in previous interpretations.

Of the total metalworking assemblage, approximately 79% is recorded as “unphased” — meaning it cannot be securely attributed to Roman stratigraphic contexts. Only around 21% of the material can be confidently assigned to Roman-period phases. This imbalance is not a minor statistical detail; it is the dominant signal in the dataset.

Importantly, “unphased” does not mean “Roman by default.” It indicates that the material lies outside tightly controlled Roman horizons, either because it predates the fort, postdates it, or derives from long-lived or repeatedly disturbed industrial deposits. In a site where metalworking was primarily driven by a Roman garrison, we would expect the opposite pattern: strong clustering within Roman phases, clear association with military structures, and a comparatively small residual component.

That is not what the data show.

This does not, on its own, prove a pre-Roman origin for metalworking at Bainbridge. However, it does undermine the assumption that metalworking activity was primarily generated by Roman military occupation. At the very least, it requires the possibility that the Romans encountered, formalised, or expanded an already active industrial landscape.

This interpretation aligns closely with other lines of evidence discussed earlier in this study: shallow non-defensive ditches consistent with drainage or water management, the absence of Roman road engineering approaching the site, and the site’s strong hydrological advantages. Together, these factors point toward an industrial function that is not dependent on Roman military logistics for its explanation.

Comparable patterns are well documented elsewhere in Britain, where Roman structures were imposed on pre-existing productive or ritual landscapes. Roman presence in such cases represents control, regulation, or enhancement — not necessarily origin. Bainbridge fits this model far more comfortably than that of an isolated fort built solely to house troops in a marginal location.

The key issue, therefore, is not that previous excavators were wrong to identify Roman-period activity. It is that the dominance of unphased industrial material was not interrogated as a question of origin, longevity, or pre-existing function. That omission matters, because it directly affects how the site is understood.

The metalworking evidence does not demand a pre-Roman interpretation. But it also does not support a purely Roman one. Any robust account of Bainbridge must therefore treat Roman occupation as part of a longer industrial sequence, rather than its beginning.

(Bainbridge Roman Fort)
How Bainbridge would have looked initially in the Mesolithic – (Bainbridge Roman Fort)

Chapter 9 — Why Roads Fail, and Rivers Don’t

If Bainbridge were a conventional garrison fort, its logistics would be straightforward: roads in, roads out, carts supplying men and equipment. Yet this is precisely where the traditional model collapses. Once examined against the physical landscape, the assumption of a road-based supply system becomes increasingly implausible, while a river-based system explains the site with remarkable efficiency.

Roman roads are not subtle features. Even when badly eroded or ploughed, they tend to leave persistent traces: aggers, flanking ditches, straight alignments that ignore minor topography, and engineered river crossings. At Bainbridge, none of these elements can be demonstrated beyond the immediate interior of the fort. Proposed road lines exist largely as cartographic expectations rather than as engineered realities. When tested against LiDAR and satellite imagery, they dissolve into slope-following tracks, later hollow-ways, or nothing at all.

The absence of convincing road infrastructure is not a minor gap; it is a structural problem for the garrison narrative. A permanently occupied fort engaged in specialist production would require the regular movement of heavy materials: fuel, ore, semi-processed metal, and finished goods. Moving such loads repeatedly by cart over upland terrain without engineered roads would be slow, expensive, and inefficient. Roman administrators were many things, but inefficient logisticians they were not.

Rivers, by contrast, solve the problem immediately. Bainbridge sits above the River Bain, close to its confluence with the Ure, which in turn feeds into the Ouse and Humber system. This places the site within a navigable network that connects inland production zones to lowland distribution routes and coastal access. Water transport allows heavy materials to be moved in bulk with a fraction of the effort required on land.

This logistical logic aligns perfectly with the industrial evidence. Metalworking produces weight: slag, ingots, finished objects, and fuel residues. Coal, in particular, is bulky and inefficient to transport by cart in quantity. Rivers are the natural solution, and Roman industry elsewhere repeatedly demonstrates a preference for water-based logistics wherever possible.

Hydrology also explains the site’s location far better than any road-based model. The fort is not perched to command a route; it is positioned to access and control a water system. Its relationship to the river valley is functional, not incidental. The broad, shallow ditches discussed in earlier chapters then make sense as part of an integrated system managing water flow, access, and movement within this hydrological context.

The river model also resolves the question of isolation. Bainbridge looks remote only if one thinks in terms of roads and towns. In river terms, it is connected. The apparent remoteness is an artefact of later transport priorities, not of Roman ones. What seems peripheral today may have been central within a water-based economic network.

This perspective also reframes the military presence. Soldiers were not stationed here to police roads that barely existed; they were there to secure a nodal point within a riverine supply system, protecting valuable production as it moved through controlled channels. Roads, where they existed, were secondary connectors, not the backbone of the site’s operation.

The failure of the road model is therefore not an absence of evidence waiting to be filled, but a misapplication of expectation. Once roads are assumed, every faint linear feature becomes a candidate. Once rivers are recognised as primary infrastructure, the landscape begins to behave logically again.

By the end of this process, the contrast is stark. The road-based interpretation struggles to explain the site’s location, infrastructure, industry, and longevity. The river-based model explains all of them with fewer assumptions and greater consistency.

With roads removed from the centre of the story, and rivers restored to their proper role, Bainbridge emerges not as a misplaced fort, but as a deliberately positioned industrial and logistical hub within a managed hydrological network.

That realisation brings us to the final question: how did the traditional narrative survive for so long — and what does its failure at Bainbridge tell us about Roman Britain more broadly?

That is the subject of the final chapter.

 (Bainbridge Roman Fort)
The so-called Cam High Road -Preist Bank – Roman Road – (Bainbridge Roman Fort)

Chapter 10 — When Assumption Replaces Science

The failure of the traditional interpretation at Bainbridge is not the result of missing data, poor excavation, or bad faith. It is the result of something more subtle and far more common: assumption hardening into orthodoxy. Once a site is labelled a “Roman fort”, every feature around it is quietly recruited into that story, whether it actually behaves like Roman military infrastructure or not.

At Bainbridge, the process is easy to trace. A fort was identified. From that point onward, roads were assumed to exist even when they could not be demonstrated. Ditches were assumed to be defensive even when their depth, profile, and placement made that function implausible. Industrial evidence was treated as incidental rather than central, because it did not fit the garrison template. Over time, the narrative became self-reinforcing, and the landscape itself stopped being interrogated.

What breaks that cycle here is not reinterpretation but measurement. Excavated cross-sections show shallow, broad ditches that cannot function as leg-breakers. LiDAR and satellite data confirm those dimensions across the wider landscape with sub-metre accuracy. Hydrology explains the form and placement of the features far better than defence ever could. And the industrial evidence — iron working, copper-alloy casting, and silver assaying — demands a model based on production, control, and logistics rather than patrol and warfare.

None of these strands are controversial in isolation. Roman industry is well documented. Roman use of river transport is well documented. Roman reuse of earlier landscapes is well documented. What is unusual is allowing all of those strands to override the comfort of a familiar label.

This is where Bainbridge becomes important beyond its own valley. If a site this well studied, excavated, and published can still be mischaracterised because interpretation was allowed to outrun function, then the same problem is likely repeated elsewhere. How many other “forts” are actually production sites? How many “defences” are actually infrastructure? How often has Roman presence been mistaken for Roman origin?

The excavation reports at Bainbridge never claimed final answers. They recorded what was found, within the limits of the methods available at the time. The error crept in later, when interpretation stopped being provisional. Modern tools now allow us to revisit those records, not to contradict them, but to finish the job they began.

Seen this way, Bainbridge is not an embarrassment to archaeology. It is a correction. It shows what happens when geometry, physics, hydrology, and excavation data are allowed to speak together, without forcing them into a predetermined story. The result is not a weakened history, but a stronger and more interesting one.

Bainbridge was not a misplaced garrison guarding nothing. It was a fortified manufacturing and logistics centre, embedded in a managed river landscape, probably formalising and securing a place that already mattered before the Romans arrived. The military presence was there to protect value, not to repel enemies. The ditches managed water, not attackers. The river moved goods where roads never did.

This conclusion does not diminish Roman Britain. It reveals it as more complex, more pragmatic, and more economically driven than the cartoon version we often repeat. And it reminds us of a basic rule that archaeology — like all sciences — ignores at its peril:

If the story does not match the ground, it is the story that must change.

The Romans did not create the industrial activity at Bainbridge; they encountered it.

Case Study: Testing the “Roman Road” Claim Against the Ground

(Bainbridge Roman Fort)
A catalogue of false assumptions easily dismissed as wishful thinking, not science -(Bainbridge Roman Fort)
(Bainbridge Roman Fort)
Revere view to the Fort shows nothing in the Lndscape to support such a pathway – (Bainbridge Roman Fort)

The LiDAR relief image above shows the southern approach to Bainbridge (Virosidum), viewed obliquely to expose slope behaviour, surface form, and constructional signatures. This image is the evidence.

At first glance, a linear feature appears to traverse the hillside and descend toward the valley. This line has been interpreted as the approach of Cam High Road to the fort. The key question is not whether a line exists, but whether the feature visible here behaves like a Roman-engineered road.

When examined carefully, the answer is no.

1. There is no agger visible in this image.
Roman primary roads are built on a raised embankment to provide drainage and structural stability. In oblique LiDAR views, aggers normally appear as continuous, slightly elevated ribbons that persist even under ploughing. In this image, no such raised platform exists. The surface remains flush with the slope, thinning and dissolving rather than standing proud. Where gradient increases — precisely where an agger should be most obvious — it disappears entirely.

2. There are no paired roadside ditches.
Roman roads are typically flanked by drainage ditches that define and protect the carriageway. These ditches often survive better than the road surface itself. In the LiDAR image, no parallel ditch system can be traced along the line of the supposed road. Instead, the feature merges into general slope wash and irregular cuttings, with no consistent boundaries.

3. The width is unstable and inconsistent.
Roman roads maintain a consistent carriageway width, typically around 5–7 metres. The feature visible here narrows, broadens, and fades unpredictably. In places it becomes a narrow hollow; elsewhere it fragments or vanishes. This behaviour is incompatible with engineered construction but entirely typical of routes formed gradually by repeated later movement.

(Bainbridge Roman Fort)
Traditional Model
 (Bainbridge Roman Fort)
Modern Hi-Res LiDAR looking for these roads from the Fort – (Bainbridge Roman Fort)

4. The feature follows the contour rather than resisting it.
Roman engineers minimised gradient change by cutting through minor undulations rather than obediently tracing hillsides. In this image, the line hugs the slope, curving gently to accommodate terrain. That is the behaviour of a path chosen for ease of passage, not one imposed by survey and construction.

5. There is no engineered river approach or crossing.
The line descends toward the valley floor and reaches the river without any visible bridge abutments, causeway, revetment, or stabilised approach. Roman roads do not simply arrive at rivers and stop. Where crossings existed, structural traces normally persist in LiDAR and topography. None are present here.

What is visible in this image is entirely consistent with a hollow-way or slope-cut access route — a feature created by prolonged movement along the easiest available line. Such routes naturally align on entrances or landmarks, creating the illusion of deliberate planning when viewed from above. Alignment, however, is not evidence of Roman engineering.

 (Bainbridge Roman Fort)
Footpath to the side of the fort – not only too small to be a road – it’s recent as it was not there 100 years ago – (Bainbridge Roman Fort)
 (Bainbridge Roman Fort)

Crucially, this interpretation does not rely on denying Roman presence at Bainbridge. It relies on recognising that Roman occupation does not automatically generate Roman roads, and that later and post-Roman movement can overwrite the landscape far more visibly than short-lived engineered surfaces.

The conclusion drawn directly from this image is therefore straightforward:
this is not a degraded Roman road. It is a slope-following access route that lacks every defining constructional characteristic of Roman primary road engineering.

This case study demonstrates a wider methodological issue explored throughout the blog. Once a site is labelled a fort, linear features nearby are often interpreted as roads by default. When those features are tested against constructional behaviour rather than visual alignment, the interpretation fails.

Here, the LiDAR does not show a Roman road in poor condition.
It shows the absence of one.

📌 What the Roads of Roman Britain (RR73) entry actually indicates

The Roads of Roman Britain entry acknowledges that:

the road heading south-west from Virosidum (Bainbridge) — often called Cam High Road — is treated as an exception among Roman road routes in the region. roadsofromanbritain.org

That wording is already significant: “exception” in this context means that it does not have the same evidential certainty as other documented routes.

The only formal source routinely cited for a Roman road connecting Bainbridge to the south-west is the Roads of Roman Britain gazetteer entry RR73. This entry is often treated as confirmation that Cam High Road reached the fort. A close reading shows that this confidence is not warranted.

RR73 does not present an excavated road, a confirmed road body, or any demonstrated Roman engineering on the ground. Instead, it catalogues a proposed route, assembled from alignments, historical references, and inferred continuity between better-attested road sections elsewhere. Crucially, the gazetteer itself treats RR73 as an exception rather than as a securely evidenced Roman road.

This distinction matters. In the Roads of Roman Britain project, well-attested roads are supported by one or more of the following: excavated metalling, identifiable aggers, paired roadside ditches, engineered river crossings, or consistent construction signatures traceable across the landscape. None of these are recorded for the supposed approach to Bainbridge.

There is no published excavation demonstrating a Roman road body on this alignment. There is no section showing metalling or agger construction. There is no evidence of an engineered crossing of the River Bain. The “road” exists only as a mapped hypothesis, not as an archaeological structure.

Even if RR73 represents a genuine Roman route elsewhere in Yorkshire, that does not demonstrate that it physically connected to the fort at Bainbridge. Roman roads do not terminate invisibly, nor do they abandon engineering precisely at valley descents and river crossings. Where roads entered forts, the connection is normally unmistakable in both excavation and topography. At Bainbridge, that connection is absent.

The significance of RR73, therefore, is not that it proves a Roman road reached Bainbridge, but that it exposes how easily inferred routes harden into assumed facts. The gazetteer records a possibility, not a demonstrated reality. Treating that possibility as evidence reverses the burden of proof.

Taken together with the LiDAR analysis presented above — the absence of an agger, lack of roadside ditches, unstable width, contour-hugging behaviour, and missing river engineering — the RR73 entry does not rescue the road hypothesis. It confirms that the connection between Cam High Road and Bainbridge is interpretive, not archaeological.

If a Roman road had genuinely approached the fort, a single excavation trench would have resolved the question decades ago. The fact that none exists is telling.

Smoking Gun: The Priests Bank Junction and the End of Cam High Road

The junction at Priests Bank provides the clearest and most decisive evidence yet that the feature traditionally labelled Cam High Road did not function as the Roman road serving Bainbridge, and may not be Roman in origin at this point at all. Unlike alignment-based arguments, this conclusion is derived from physical interaction between earthworks, which allows relative dating and functional priority to be established directly from the ground.

As shown in the accompanying LiDAR relief graphic, the route identified as Cam High Road is physically cut by the Countersett road. The bank associated with Cam High Road continues on either side of the junction but is breached and truncated where the Countersett route passes through it. This relationship is unambiguous: the feature that is cut must be earlier, and the feature that cuts must be later. On morphological grounds alone, Cam High Road predates the Countersett road at this location.

From this junction onward, Cam High Road loses coherence and functional priority. One branch turns upslope and peters out into the hills; the other becomes increasingly indistinct. It no longer behaves as a through-route with a clear destination. By contrast, the Countersett road maintains continuity, direction, and purpose, forming the only route that demonstrably carries movement toward Bainbridge.

This geometry matters. If Cam High Road were the Roman arterial route serving a fort at Bainbridge, it would retain priority through the junction, with subsidiary routes branching away from it. What is observed is the opposite. Cam High Road becomes secondary and residual, while the Countersett route assumes the primary role in accessing the site. Bainbridge is therefore not the destination of Cam High Road.

The implications are decisive. Even if Cam High Road represents a genuine Roman route elsewhere, the junction at Priests Bank shows that it terminates functionally before reaching Bainbridge. The road that actually connects to Bainbridge is a different route altogether, one that intersects Cam High Road rather than extending from it. This finding aligns precisely with the absence of Roman road engineering on the approach to the site: no agger, no roadside ditches, no consistent carriageway, and no engineered river crossing.

This junction analysis resolves a long-standing assumption. The supposed Roman road serving Bainbridge has never been excavated, never been demonstrated as an engineered structure, and now can be shown not to connect to the site in functional terms. The idea that Cam High Road served the fort rests entirely on expectation rather than evidence.

In methodological terms, this is the critical point. Alignment can mislead; names can mislead; maps can mislead. Cutting relationships do not. At Priests Bank, the landscape itself records the sequence, and that sequence shows that Cam High Road is earlier, secondary, and irrelevant to access at Bainbridge.

 (Bainbridge Roman Fort)
Smoking Gun – The so-called Roman road comes to an end in the middle of nowhere – its no doubt a medieval drovers track and not a Roman Road (Bainbridge Roman Fort)

This is the smoking gun.
Cam High Road does not serve Bainbridge.
And without a Roman road, the fort narrative collapses into something far more interesting: a site whose importance lies not in military logistics, but in landscape, hydrology, and long-term industrial use.

Podcast

Author’s Biography

Robert John Langdon, a polymathic luminary, emerges as a writer, historian, and eminent specialist in LiDAR Landscape Archaeology.

His intellectual voyage has interwoven with stints as an astute scrutineer for governmental realms and grand corporate bastions, a tapestry spanning British Telecommunications, Cable and Wireless, British Gas, and the esteemed University of London.

A decade hence, Robert’s transition into retirement unfurled a chapter of insatiable curiosity. This phase saw him immerse himself in Politics, Archaeology, Philosophy, and the enigmatic realm of Quantum Mechanics. His academic odyssey traversed the venerable corridors of knowledge hubs such as the Museum of London, University College London, Birkbeck College, The City Literature Institute, and Chichester University.

In the symphony of his life, Robert is a custodian of three progeny and a pair of cherished grandchildren. His sanctuary lies ensconced in the embrace of West Wales, where he inhabits an isolated cottage, its windows framing a vista of the boundless sea – a retreat from the scrutinous gaze of the Her Majesty’s Revenue and Customs, an amiable clandestinity in the lap of nature’s embrace.

Exploring Prehistoric Britain: A Journey Through Time

My blog delves into the fascinating mysteries of prehistoric Britain, challenging conventional narratives and offering fresh perspectives based on cutting-edge research, particularly using LiDAR technology. I invite you to explore some key areas of my research. For example, the Wansdyke, often cited as a defensive structure, is re-examined in light of new evidence. I’ve presented my findings in my blog post Wansdyke: A British Frontier Wall – ‘Debunked’, and a Wansdyke LiDAR Flyover video further visualizes my conclusions.

My work also often challenges established archaeological dogma. I argue that many sites, such as Hambledon Hill, commonly identified as Iron Age hillforts are not what they seem. My posts Lidar Investigation Hambledon Hill – NOT an ‘Iron Age Fort’ and Unmasking the “Iron Age Hillfort” Myth explore these ideas in detail and offer an alternative view. Similarly, sites like Cissbury Ring and White Sheet Camp, also receive a re-evaluation based on LiDAR analysis in my posts Lidar Investigation Cissbury Ring through time and Lidar Investigation White Sheet Camp, revealing fascinating insights into their true purpose. I have also examined South Cadbury Castle, often linked to the mythical Camelot56.

My research also extends to the topic of ancient water management, including the role of canals and other linear earthworks. I have discussed the true origins of Car Dyke in multiple posts including Car Dyke – ABC News PodCast and Lidar Investigation Car Dyke – North Section, suggesting a Mesolithic origin2357. I also explore the misidentification of Roman aqueducts, as seen in my posts on the Great Chesters (Roman) Aqueduct. My research has also been greatly informed by my post-glacial flooding hypothesis which has helped to inform the landscape transformations over time. I have discussed this hypothesis in several posts including AI now supports my Post-Glacial Flooding Hypothesis and Exploring Britain’s Flooded Past: A Personal Journey

Finally, my blog also investigates prehistoric burial practices, as seen in Prehistoric Burial Practices of Britain and explores the mystery of Pillow Mounds, often mistaken for medieval rabbit warrens, but with a potential link to Bronze Age cremation in my posts: Pillow Mounds: A Bronze Age Legacy of Cremation? and The Mystery of Pillow Mounds: Are They Really Medieval Rabbit Warrens?. My research also includes the astronomical insights of ancient sites, for example, in Rediscovering the Winter Solstice: The Original Winter Festival. I also review new information about the construction of Stonehenge in The Stonehenge Enigma.

Further Reading

For those interested in British Prehistory, visit www.prehistoric-britain.co.uk, a comprehensive resource featuring an extensive collection of archaeology articles, modern LiDAR investigations, and groundbreaking research. The site also includes insights and extracts from the acclaimed Robert John Langdon Trilogy, a series of books exploring Britain during the Prehistoric period. Titles in the trilogy include The Stonehenge Enigma, Dawn of the Lost Civilisation, and The Post Glacial Flooding Hypothesis, offering compelling evidence about ancient landscapes shaped by post-glacial flooding.

To further explore these topics, Robert John Langdon has developed a dedicated YouTube channel featuring over 100 video documentaries and investigations that complement the trilogy. Notable discoveries and studies showcased on the channel include 13 Things that Don’t Make Sense in History and the revelation of Silbury Avenue – The Lost Stone Avenue, a rediscovered prehistoric feature at Avebury, Wiltshire.

In addition to his main works, Langdon has released a series of shorter, accessible publications, ideal for readers delving into specific topics. These include:

For active discussions and updates on the trilogy’s findings and recent LiDAR investigations, join our vibrant community on Facebook. Engage with like-minded enthusiasts by leaving a message or contributing to debates in our Facebook Group.

Whether through the books, the website, or interactive videos, we aim to provide a deeper understanding of Britain’s fascinating prehistoric past. We encourage you to explore these resources and uncover the mysteries of ancient landscapes through the lens of modern archaeology.

For more information, including chapter extracts and related publications, visit the Robert John Langdon Author Page. Dive into works such as The Stonehenge Enigma or Dawn of the Lost Civilisation, and explore cutting-edge theories that challenge traditional historical narratives.

Other Blogs

s

t

Twigs, Charcoal, and the Death of the Saxon Dyke Myth


Introduction

For over a century, British archaeology has repeated the same tale: Offa’s Dyke and Wat’s Dyke were built by Saxon kings to define borders and display royal power. But each time we peel back another layer—literally and figuratively—the data tells a radically different story. This is no longer about interpretation or fringe theory. The scientific evidence, especially from radiocarbon dating, blows the Saxon myth apart.(Twigs, Charcoal, and the Death of the Saxon Dyke Myth)


1. The Mesolithic Nuts Beneath the Bank

At Gobowen, Shropshire, archaeologists uncovered pits beneath Wat’s Dyke filled with charred hazelnut shells and twigs. Radiocarbon dating placed these at 5210–4840 BC—deep into the Mesolithic. This is not “background noise.” It proves the site was in use—and likely managed—thousands of years before any so-called Saxon activity. (Twigs, Charcoal, and the Death of the Saxon Dyke Myth)

(Twigs, Charcoal, and the Death of the Saxon Dyke Myth)
Gobowen Side where they found the Mesolithic Hearths – (Twigs, Charcoal, and the Death of the Saxon Dyke Myth)

2. The “Twigs” and the Bronze Age Pattern

Here’s where things get explosive. Two different digs—at Gobowen and Maes-y-Clawdd—each pulled a charred twig from the primary fill of the dyke’s ditch. Both were sent to modern AMS labs for dating. These were sent to independent AMS labs for testing:

  • Gobowen: 2825 ± 40 BP, calibrated to 1120–890 BC
  • Maes-y-Clawdd: 2855 ± 40 BP, calibrated to 1120–890 BC

Different labs, different sites, nearly identical dates: Late Bronze Age.
Some might claim “residuality” or accident, but when the same date keeps showing up in primary contexts at different sites, the odds of pure coincidence plummet.(Twigs, Charcoal, and the Death of the Saxon Dyke Myth)

(Twigs, Charcoal, and the Death of the Saxon Dyke Myth)
Maes-Y-Clawdd site (Twigs, Charcoal, and the Death of the Saxon Dyke Myth)

3. Erddig and Chirk: More Prehistoric Dates

The new gold standard in the debate is the peer-reviewed Archaeologia Cambrensis study (Malim et al. 2021), which returned:

  • Erddig: Alder charcoal under the bank, 1414–1258 BC (Bronze Age)
  • Chirk: Charcoal at base of bank, 776–543 BC (Iron Age)

These aren’t rogue samples. They are part of a systematic pattern. (Twigs, Charcoal, and the Death of the Saxon Dyke Myth)

(Twigs, Charcoal, and the Death of the Saxon Dyke Myth)
Wats Dyke Excavation – (Twigs, Charcoal, and the Death of the Saxon Dyke Myth)

4. The Car Dyke and Wansdyke Parallels

Our recent research on Car Dyke—summarised in my book, Car Dyke: The Lost Waterways of Prehistoric Britain—shows exactly the same pattern. LiDAR analysis, gradient modeling, and dated artefacts reveal this “Roman” canal sits atop a much older, prehistoric water-management system, later adapted by the Romans. The same sequence—prehistoric construction, Roman enhancement, and later reuse—emerges at other great linear earthworks.

Wansdyke: More than Just a Saxon Bank and Ditch

  • Roman Water System at the Summit:
    Topographic and archaeological evidence shows that a Roman water-management system, likely an aqueduct or channel, was constructed along sections of Wansdyke near Cliffe Pypard and Cherhill. The Roman works appear to incorporate the line and gradient of the existing dyke, indicating that the dyke was already present and subsequently adapted for Roman infrastructure needs. This reuse implies that the dyke is pre-Roman in origin, forming part of an older, possibly prehistoric, water-management landscape. Rather than constructing a new route, the Romans modified what was already there—strong evidence that Wansdyke was not their creation, but an earlier engineering feature they found valuable enough to repurpose.
  • Roman Road Laid On the Dyke:
    To the north of Morgan’s Hill, a documented Roman road is physically laid on top of the Wansdyke bank. The logical sequence? The dyke had to exist before the road. (For detail and field evidence, see: prehistoric-britain.co.uk/prehistoric-canals-dykes-wansdyke4)
  • The Implication:
    These features make it impossible to honestly claim that Wansdyke is purely a Saxon or sub-Roman structure. Instead, we’re seeing a prehistoric engineering work—possibly a canal or water-management feature—repurposed by the Romans, and then again in later centuries.

(Twigs, Charcoal, and the Death of the Saxon Dyke Myth)

(Twigs, Charcoal, and the Death of the Saxon Dyke Myth)
Car Dyke Parrellels – (Twigs, Charcoal, and the Death of the Saxon Dyke Myth)
A Consistent Prehistoric Pattern

The parallels between Car Dyke, Wansdyke, Offa’s Dyke, and Wat’s Dyke are now undeniable:

  • All show prehistoric (Mesolithic, Bronze Age, or Iron Age) dates or structural evidence in primary contexts.
  • All were reused, enlarged, or recut by later societies—be it the Romans, Saxons, or Medievals.
  • All have been misunderstood because traditional narratives refuse to follow the evidence.

(Twigs, Charcoal, and the Death of the Saxon Dyke Myth)
Roman Canal Boat as found at Car Dyke – (Twigs, Charcoal, and the Death of the Saxon Dyke Myth)

(Twigs, Charcoal, and the Death of the Saxon Dyke Myth)

5. Why the Saxon Narrative No Longer Holds

Traditional archaeology claims these dykes were built in the Dark Ages because it’s “what’s always been said” and because a handful of OSL dates cluster in the early medieval period. But with so many radiocarbon dates from secure, primary contexts returning Bronze Age and Iron Age results, the only scientific response is to question the narrative—not the data.

This shift isn’t limited to a few isolated studies. In 2019, Historic England (formerly English Heritage) published a national overview of linear earthworks, concluding that most of the dykes they had investigated dated to the prehistoric period, not the early medieval one. Their guidance document, Prehistoric Linear Boundary Earthworks, situates these features firmly in the Late Neolithic through to the Iron Age, aligning with the growing body of radiocarbon evidence and undermining the traditional Dark Age attribution.

Rather than reinforcing the Saxon story, modern research now supports a much older, more complex landscape—one that was later reused and reinterpreted by the Romans and Saxons alike.

(Twigs, Charcoal, and the Death of the Saxon Dyke Myth)
From the Book by HE – (Twigs, Charcoal, and the Death of the Saxon Dyke Myth)

(Twigs, Charcoal, and the Death of the Saxon Dyke Myth)


6. AI and Modern Method: The Death of Peer-Reviewed Dogma

For years, peer review has failed to challenge inherited assumptions. “Authority” was all that mattered—a single, dramatic radiocarbon date (like the infamous 6.25 kg of charcoal at Maes-y-Clawdd) could define an entire monument’s chronology, regardless of context or contradictory data from other sites.

But now? AI is revolutionising how we check and interpret archaeological evidence.

Take our recent FB post, where we used AI to reassess the Maes-y-Clawdd excavation:

  • Myth: The excavation report’s headline date (c. 400 AD) from the charcoal was endlessly repeated as proof of a “Roman” or “sub-Roman” dyke.
  • AI’s Role:
    • Pulled together site photos, original reports, ditch profiles, and stratigraphy from multiple digs.
    • Flagged the ditch’s V-shape (classic recut) and the heavy truncation of the bank (over half missing)—which undermined the idea that the charcoal was securely “sealed” and contemporary with construction.
    • Cross-referenced other sites (Gobowen, Erddig, Chirk), showing that Bronze Age and Iron Age dates in similar primary contexts kept reappearing—not as random “residuals,” but as a systematic pattern.
  • Outcome:
    • Instead of blindly accepting published “facts,” AI let us validate or reject past interpretations using all the available primary evidence.
    • The “Roman” story now stands exposed as an artefact of interpretation, not of data.

This is not “pseudoscience”—it’s the very definition of the scientific method:

  • Gather all the evidence.
  • Challenge every conclusion.
  • Rebuild the narrative when the facts demand it.

Just as AI is transforming genetics, climate science, and engineering, it’s now arming archaeology with the ability to see through myths, correct errors, and put our past on a solid, evidence-based footing. If you want real history, let the data—and AI—lead the way. (Twigs, Charcoal, and the Death of the Saxon Dyke Myth)

 (Twigs, Charcoal, and the Death of the Saxon Dyke Myth)
Twigs, Charcoal, and the Death of the Saxon Dyke Myth

Conclusion: Follow the Data, Not the Doctrine

The parallels between Offa’s Dyke, Wat’s Dyke, Car Dyke, and Wansdyke are now undeniable:

  • All show prehistoric (Mesolithic, Bronze Age, or Iron Age) evidence in primary contexts
  • All were reused, recut, or adapted by Romans, Saxons, and Medieval societies
  • All have been misunderstood because inherited narratives resisted revision

The story we’ve been told—that Saxon kings built these monuments as borders—is no longer sustainable.

The data demands a paradigm shift. (Twigs, Charcoal, and the Death of the Saxon Dyke Myth)


References

  • Hannaford, H.R. (1997), SCCAS Report no. 111, An Interim Report on Archaeological Excavations on Wat’s Dyke at Maes-y-Clawdd, Oswestry.
  • Malim, T. & Hayes, L. (2008), The Date and Nature of Wat’s Dyke: a reassessment in the light of recent investigations at Gobowen, Shropshire, ASSAH 15.
  • Malim, T., Hoggard, C., et al. (2021). “Offa’s Dyke and Wat’s Dyke: Scientific Dating at Chirk and Erddig, North Wales.” Archaeologia Cambrensis, 170, pp. 93–117.
  • Langdon, R.J. (2024), Car Dyke: The Lost Waterways of Prehistoric Britain.
  • For Wansdyke Roman features and road evidence: prehistoric-britain.co.uk/prehistoric-canals-dykes-wansdyke4

Twigs, Charcoal, and the Death of the Saxon Dyke Myth

Annex: The “Twig” Radiocarbon Dates—Technical Details

For those who want the technical data, here are the exact C14 results from the two most cited Bronze Age “twig” samples:

SiteSample TypeLab CodeRadiocarbon Age (BP)ErrorCalibrated Range (2σ)Context
GobowenCharred twigGU-148662825±401120–890 BCPrimary ditch fill
Maes-y-ClawddCharred twig(various)2855±401120–890 BCLower ditch fill
  • Both dates are from independent, high-quality AMS labs, and ±40 years is standard error for these samples.
  • The calibration uses the most up-to-date IntCal curve.
  • Their remarkable similarity is not a flaw, but evidence for a real prehistoric episode.

Further Reading

For information about British Prehistory, visit www.prehistoric-britain.co.uk for the most extensive archaeology blogs and investigations collection, including modern LiDAR reports.  This site also includes extracts and articles from the Robert John Langdon Trilogy about Britain in the Prehistoric period, including titles such as The Stonehenge Enigma, Dawn of the Lost Civilisation and the ultimate proof of Post Glacial Flooding and the landscape we see today.

Robert John Langdon has also created a YouTube web channel with over 100 investigations and video documentaries to support his classic trilogy (Prehistoric Britain). He has also released a collection of strange coincidences that he calls ‘13 Things that Don’t Make Sense in History’ and his recent discovery of a lost Stone Avenue at Avebury in Wiltshire called ‘Silbury Avenue – the Lost Stone Avenue’.

(Maritime Diffusion Model for Megaliths in Europe)

Langdon has also produced a series of ‘shorts’, which are extracts from his main body of books:

The Ancient Mariners

Stonehenge Built 8300 BCE

Old Sarum

Prehistoric Rivers

Dykes ditches and Earthworks

Echoes of Atlantis

Homo Superior

(Maritime Diffusion Model for Megaliths in Europe)

Other Blogs

s

t

(Twigs, Charcoal, and the Death of the Saxon Dyke Myth)

The Great Dorchester Aqueduct Hoax

Introduction

The feature long attributed to the Dorchester Roman aqueduct presents a fascinating but contentious case within archaeology. Its winding route, peculiar design, and unsubstantiated functional claims challenge conventional interpretations of Roman engineering in Britain. In this blog, we delve into key aspects of the feature, including its gradient, design, and capacity to deliver water, to uncover whether it truly served as an aqueduct or had a different purpose entirely. By critically examining the evidence and incorporating modern methodologies like LiDAR, we aim to provide a fresh perspective on this enigmatic structure. (The Great Dorchester Aqueduct Hoax)

The first question we address is the gradient of the watercourse, a critical factor for any functioning aqueduct. The report claims a 1:2700 gradient ratio, yet an elevation analysis reveals inconsistencies, with over 14 peaks along the route that would obstruct continuous water flow. Without evidence of additional water sources, such as springs or siphons, the practicality of this gradient as a reliable mechanism for water transport is highly questionable. Understanding whether these claims hold up under scrutiny is essential to reassessing the feature’s functionality.

Next, we investigate the watercourse design, which deviates significantly from typical Roman aqueducts. Rather than following a direct route, it hugs the hillsides in a winding path, much like Linear Earthworks or dykes. This design raises questions about whether it was intended for water transport or repurposed from an earlier feature. Comparing its structure to other earthworks, such as the Car Dyke, may offer insights into its original purpose and whether it truly served the Roman settlement at Dorchester.

We also examine the capacity of the aqueduct to deliver water to its destination. The report provides dimensions for a one-meter-wide section of the channel but fails to calculate flow rates or compare this with the water supply from the River Frome or wells. This omission highlights a recurring issue in archaeological reporting: the lack of practical, critical analysis of large-scale constructions’ economic and logistical considerations. Understanding the volume and practicality of water delivery is essential to determine whether this feature justified the investment in labour and resources.

Finally, we explore an alternative interpretation of the feature, informed by comparisons to other earthworks like Offa’s Dyke and Wansdyke. Often assumed to have continuous, singular functions, these structures have been reinterpreted as fragmented constructions with economic purposes, such as transporting minerals or resources. The proximity of quarry pits and the feature’s connection to Poundbury suggest it may have played a role in trade or resource transport rather than as a water conduit. This broader context challenges the long-held assumption of its Roman origins and function.

Through this analysis, we aim to uncover the realities behind the Dorchester watercourse, questioning assumptions and presenting evidence-based interpretations. By applying modern methods and critical thinking, we seek to highlight the complexities of such archaeological features and the potential for misattribution in historical narratives. (The Great Dorchester Aqueduct Hoax)

A Source of Confusion: New Archaeological Evidence for the Dorchester Aqueduct

This research paper re-examines the Dorchester Roman aqueduct, a famous but incompletely understood water system in Britain. Utilizing new geophysical surveys, LiDAR data, and GIS analysis, the authors reassess previously proposed aqueduct routes and water sources. They challenge earlier interpretations, particularly those of Bill Putnam, by presenting evidence that extends the aqueduct’s known length and suggests a different origin point near Notton on the River Frome. This work integrates a century’s worth of archaeological research with modern technology for a more comprehensive understanding. A trial excavation supports these findings.

Briefing Document: Dorchester Aqueduct Re-evaluation

1. Introduction

This document summarizes the key findings of a recent study re-examining the Dorchester Aqueduct, a well-known Roman watercourse in Britain. The study, conducted by Harry Manley, Paul Cheetham, Dave Stewart, and Miles Russell, utilizes new geophysical and topographic data, along with a reappraisal of past excavations, to challenge previous assumptions about the aqueduct’s route and water source. The document highlights the study’s methodology, findings, and their implications.

 (The Great Dorchester Aqueduct Hoax)
(The Great Dorchester Aqueduct Hoax)

2. Background: The Dorchester Aqueduct & Previous Investigations

  • Significance: The Dorchester Aqueduct is described as “arguably the most famous and well-examined Roman watercourse in Britain,” though it’s also noted that Roman aqueducts in Britain are generally “a comparatively poorly understood element of the provincial civilian infrastructure.”
  • Purpose of Aqueducts: Roman aqueducts were essential for supplying water to towns and forts, especially bathhouses. These systems operated by gravity, channeling water from a source to its destination. While less grand than those in Gaul and Spain, British aqueducts were a point of civic pride.
  • Past Investigations: Investigations have occurred sporadically over the last 100 years, particularly in the 1990s with Bill Putnam’s work. However, the upper reaches and the water source(s) of the aqueduct have remained a source of debate.
  • Conflicting Theories on Water Source: Several sources have been proposed, including:
  • Foxlease Withybed (Coates)
  • Notton Mill (Foster)
  • Stream at Steppes Farm (Farrar)
  • Spring at Nunnery Mead (Sparey-Green)
  • Artificial lake near Steppes Farm (Putnam) – Note: This was Putnam’s conclusion after extensive work, including his suggestion of a dam.

3. New Research Approach & Methodology

  • New Research Project: In 2020, a research project was initiated by Bournemouth University to clarify the aqueduct’s route in its upper section and determine the water source.
  • Integrated Approach: This project used a combination of:
  • GIS-based landscape modeling
  • Airborne Laser Scanning (ALS/LiDAR) data
  • Geophysical surveys (magnetometry and Ground Penetrating Radar – GPR)
  • Targeted excavation
  • Integration with existing historical and archaeological evidence.
  • GIS for Data Management: A GIS (Geographic Information System) was created to manage spatial datasets, allowing the synthesis and viewing of different data layers (LiDAR, geophysical survey data, aerial photographs, excavation records, etc.).
  • Hydrological Modeling: High-resolution LiDAR data was used to create detailed ground surface contours, allowing for accurate hydrological modeling. This model enabled a more precise analysis of potential aqueduct routes by examining slope gradients.
  • They created a model that assumed a constant gradient, based on a 7.2m elevation change over a 20km distance, resulting in a 0.1m vertical change every 270m horizontally.
  • This hydrological model allowed the research team to compare the theorized routes of previous researchers and understand the validity of their suggested routes.
(The Great Dorchester Aqueduct Hoax)

4. Key Findings & Analysis

  • Re-evaluation of Previous Routes: The hydrological model was used to evaluate the routes proposed by Coates, Foster/Farrar, Sparey-Green, and Putnam.
  • Problems with Previous Interpretations:Coates, Foster/Farrar: Their routes diverge from the hydrological model in Steppes Bottom, particularly their trajectory up the eastern flank of the coombe before returning to Steppes Bottom.
  • Sparey-Green: His suggested source at Nunnery Mead doesn’t fit the hydrological model, dropping too quickly in elevation to be a viable source for the aqueduct.
  • Putnam: The study challenges Putnam’s conclusions by showing that his 1992 excavation trench in Steppes Bottom was located ~250m too far upslope, based on the current hydrological model. This meant that he never encountered the actual aqueduct route, leading to his conclusion that the aqueduct did not extend beyond the bottom of the valley. Additionally, an earthwork interpreted by Putnam as a medieval water channel is now seen as potentially part of the Roman aqueduct. The hydrological model suggests this earthwork was actually part of the aqueduct, based on its close alignment.
  • Geophysical Survey & Excavation at Nunnery Mead:Magnetometry: Revealed a linear anomaly (Anomaly A) consistent with a buried structure running along a contour line on the hillside and not a boundary marker.
  • GPR: Confirmed Anomaly A as a cut feature with terrace deposits and a clay lining.
  • Excavation (Trench 1): The evaluation trench exposed a terraced cut feature containing clay layers surrounding a soil core with evidence of decayed wooden planks, indicating a constructed channel. This feature aligned with the magnetic and GPR anomalies.
  • Aqueduct Construction at Nunnery Mead:The aqueduct at Nunnery Mead is consistent with Putnam’s ‘Phase 1b’ typology and thus Roman in origin.
  • The channel is approximately 1.0m wide and 0.35m deep.
  • Wooden planks formed a box-shaped conduit.
  • Clay was used for lining and bedding layers.
  • Constructed on a terraced platform cut into the hillside to aid construction.
  • Implications for Water Source: The excavation at Nunnery Mead extends the aqueduct’s route further upstream than previously established. It also challenges the theory that the source was at Steppes Bottom. The authors suggest that the aqueduct may have continued to Notton on the River Frome.

5. Key Quotes

  • “Although the locations of the lower sections of the aqueduct as it approaches Dorchester are well known, the upper reaches… are less visible in the landscape and can only be inferred using elevation data and archaeological excavation.”
  • “Each of these suggested sources will be reviewed here in the light of current research by the authors.”
  • “The availability of elevation data through ALS using LiDAR has allowed archaeologists to investigate ground surface microtopography in greater detail than traditional survey methods and over larger spatial extents.”
  • “The hydrological model derived from airborne laser scanning has produced a theoretical route of the aqueduct based upon an assumed gradient. This model has, for the first time, provided a basis for a critical evaluation of each of the different conjectured aqueduct routes…”
  • “Not finding the aqueduct where it was expected to be in Barrow Plantation cemented in Putnam’s mind the idea that the aqueduct did not continue west of Steppes Bottom to a source at Notton, and therefore influenced his fieldwork strategy and interpretations for the rest of his research project.”
  • “The archaeological evidence found in Trench 1 suggests that the Dorchester Aqueduct continues up the Frome valley to at least Nunnery Mead.”
  • “The location of the aqueduct at Nunnery Mead demonstrates that Putnam’s assertion that the source of the water was further downstream at Steppes Bottom must now be questioned.”
(The Great Dorchester Aqueduct Hoax)

6. Conclusions and Further Work

  • Challenging Established Ideas: The study demonstrates that previous interpretations, particularly those by Bill Putnam, were likely based on incomplete data and potentially mislocated excavations.
  • New Route: The study has extended the known route of the aqueduct to at least Nunnery Mead and suggests a source further upstream at Notton on the River Frome.
  • Importance of Integrated Approach: The study shows the value of combining GIS, LiDAR, geophysical surveys, and excavation data for accurate analysis.
  • Future Research:Integration of Putnam’s original excavation archive into their research.
  • Further geophysical and topographic surveys west of Nunnery Mead and at Notton are planned.
  • Reassessment of the construction phases and chronology of the aqueduct.

7. Implications

This research significantly revises our understanding of the Dorchester Aqueduct, providing a more accurate route and questioning the previously held theory of a source at Steppes Bottom. This has implications for the understanding of Roman engineering capabilities and civic infrastructure, demonstrating the importance of re-examining past research with new data and technologies.

This briefing document provides a comprehensive overview of the key findings and implications of the research. It emphasizes the value of the new research methods employed and challenges previous interpretations of the Dorchester Aqueduct, setting the stage for future research. (The Great Dorchester Aqueduct Hoax)

Our analysis

When you first examine the suspected “Roman Aqueduct” route, the most striking feature is its winding, irregular path that follows the elevated land of the flooded River Terrace. It hardly resembles the precise, straight lines we associate with Roman civil engineering, especially considering the presence of a few straight Roman roads running parallel to sections of this feature.

Reading through the accompanying document only deepens this scepticism. Much of the information presented is speculative, despite their commendable efforts to correct earlier, flawed conclusions that failed to meet the standards of modern archaeology. Ironically, the report falls short in some fundamental aspects, omitting key details you would expect in a thorough, contemporary archaeological study.

The authors emphasise using modern methods like LiDAR to investigate the site. However, the quality of their LiDAR data raises questions. The report’s illustrations, which should provide clarity and enhance understanding, fail to leverage the full potential of high-resolution LiDAR. This is a significant oversight, as high-resolution data is crucial for precise analysis. Using such tools to critique their findings, it becomes apparent that there are substantial gaps in their critical analysis of the site and their conclusions. (The Great Dorchester Aqueduct Hoax)

Elevation Map

When examining a water feature like an aqueduct, the key consideration is its ability to transport water effectively from a higher altitude to its intended destination. This requires a steep gradient to ensure a consistent flow while avoiding issues like blockages, leaks, or the need to overcome uphill sections, which would require additional force to move the water.

However, the information provided is surprisingly sparse when we look for detailed calculations on the gradient and flow dynamics used in this case. Here’s how AI interpreted the document and its explanation of the gradient:(The Great Dorchester Aqueduct Hoax)

The researchers calculated the gradient of the Dorchester aqueduct using a combination of LiDAR-derived topographic data, hydrological modelling, and GIS analysis. Here’s the process they followed, as described in the PDF:


1. LiDAR Data for High-Resolution Topography

  • They used Airborne Laser Scanning (LiDAR) to produce a detailed Digital Terrain Model (DTM) of the landscape. The LiDAR data provided a spatial resolution of 1 meter horizontally and allowed for precise identification of ground surface contours.
  • These contours revealed the microtopography of the Frome Valley and areas through which the aqueduct passed, even where surface traces of the aqueduct were no longer visible.

2. Defining Elevation Ranges

  • They determined the approximate elevation range of the aqueduct by analyzing its known locations and projecting where it likely ran.
  • The aqueduct’s inferred elevation ranged from 76.2 meters to 83.4 meters above Ordnance Datum (OD) over its course.

3. Hydrological Modeling with GIS

  • The researchers used GIS software to model a theoretical route for the aqueduct. They calculated a constant gradient by dividing the total elevation drop (about 7.2 meters) by the horizontal length of the aqueduct (approximately 20 kilometers).
  • This yielded a gradient of 0.1 meters drop per 270 meters of horizontal distance (1:2700), which aligns with standard Roman aqueduct construction principles.

4. Contour Line Tracing

  • Starting at the presumed water source near Notton, they traced the 83.4-meter contour line for 270 meters before stepping down by 0.1 meters to the next contour.
  • This process was repeated until they reached the aqueduct’s end at Dorchester, allowing them to project the likely course while respecting the calculated gradient.

5. Comparison with Conjectured Routes

  • The calculated gradient was compared to previous conjectured routes proposed by earlier researchers. Where the gradient of older routes diverged significantly, these were flagged as incorrect or improbable.

Summary of Method

This method ensured a scientifically consistent approach to mapping the aqueduct’s route, balancing the need for a manageable slope with the constraints of the landscape. However, the document acknowledges that earlier calculations and trench placements by researchers like Bill Putnam were misaligned with the actual gradient, leading to some erroneous conclusions in the past.

According to the PDF, the estimated gradient of the Dorchester aqueduct is approximately 0.1 meters of elevation drop per 270 meters of horizontal distance (1:2700). This gentle slope was carefully designed to ensure a steady flow of water while minimizing erosion and loss of water due to overflow. (The Great Dorchester Aqueduct Hoax)

Implications of This Gradient

  • Sustainability: A gradient this shallow is typical for Roman aqueducts, as it balances maintaining water flow with the need to manage the terrain.
  • Engineering Precision: Achieving such a consistent gradient over a long distance (approximately 20 km) would have required precise surveying and construction techniques.

Flow Rate: While gentle, this gradient was sufficient to provide a continuous supply of water, assuming proper maintenance and minimal interruptions in the channel.

Conclusion

So what we have is that – Starting at the presumed water source near Notton, they traced the 83.4-meter contour line for 270 meters before stepping down by 0.1 meters to the next contour – This yielded a gradient of 0.1 meters drop per 270 meters of horizontal distance (1:2700), which aligns with standard Roman aqueduct construction principles. The problem is that the Route is not 270m long it’s 18,482m long. To see how this would have looked, we traced the path of the supposed Aqueduct in our LiDAR mapping facility and created an elevation map to see if this conclusion was accurate. (The Great Dorchester Aqueduct Hoax)

(The Great Dorchester Aqueduct Hoax)
Path of the Dorchester Aqueduct – (The Great Dorchester Aqueduct Hoax)
(The Great Dorchester Aqueduct Hoax)
Elevation map of the Aqueduct – (The Great Dorchester Aqueduct Hoax)

The elevation map reveals that the aqueduct’s route does not maintain the claimed 1:2700 gradient ratio throughout its course. Contrary to the report’s assertions, the aqueduct would not be capable of carrying water unaided, as there are over 14 elevation peaks along the route that would obstruct the flow. The report fails to address these inconsistencies or explain how these obstacles could have been overcome.

Volume of Water Obtained

The next crucial aspect to examine is whether the gradient issues could have been mitigated by another, unmentioned source of additional water, such as siphons or natural springs, and whether the volume of water to be delivered justified the aqueduct’s construction over existing sources like wells or the nearby River Frome. The PDF outlines the duct dimensions used but provides no flow rate calculations that could be compared to the natural water supply already available at the site. This omission raises significant concerns. It reflects a broader issue in archaeology, where critical thinking about large-scale constructions’ practicalities and economic feasibility is often overlooked.

Societies, even ones reliant on slave labour like the Romans, did not build such infrastructure without weighing the costs in workforce and resources. Every project required justification, whether financial, logistical, or functional. Ignoring these commercial and societal factors limits our understanding of why specific constructions were prioritised over alternatives, such as using existing water sources or repurposing other features. For instance, if the aqueduct were not primarily for drinking water but for transporting minerals or other resources to the fort, this would fundamentally alter its interpretation. Historians and archaeologists must factor in these considerations to better understand the motivations and economics behind such constructions.

The Reoprt suggests (according to AI)

Dimensions of the Aqueduct

  • Channel Dimensions: The aqueduct had a wooden, box-shaped conduit approximately 1 meter wide and 0.35 meters deep. This size would have determined the volume of water that could flow through it at any given time.
  • Terracing and Gradient: The aqueduct followed a gentle gradient of approximately 1:2700, which would influence the velocity and flow rate of water.

Implications for Volume and Flow Rate

  • Using the channel dimensions (1 m x 0.35 m) and assuming a steady flow, the cross-sectional area of the channel would be approximately 0.35 square meters.
  • The flow rate would depend on the gradient and the channel’s condition (e.g., smoothness of the lining and obstructions), but the document does not provide detailed hydrological calculations or estimates.

Missing Data in the Report

The PDF does not include:

  • Any calculations of the discharge rate (e.g., cubic meters per second) based on the gradient and channel dimensions.
  • An estimate of how much water would be available at the terminal point in Dorchester, or any adjustment for water loss due to evaporation, leakage, or seepage along the 20 km route.

Conclusion

Unfortunately, the report fails to address the fundamental aspects required for a thorough analysis, focusing only on a small section to calculate the flow rate (as we saw ith the gradient calculations). This limited approach is inadequate for a modern study, especially one likely to be used as a foundation for future analysis and citations.

By applying LiDAR to the existing sections of the feature, we can gain a more accurate understanding of the true size of these water ducts along the entire route. This broader analysis will provide better insights than relying on a single segment, which may have been altered over time and might not reflect the original structure. This is yet another critical consideration that archaeologists often overlook in their assessments.

(The Great Dorchester Aqueduct Hoax)
Measurement Points on the Map Route – (The Great Dorchester Aqueduct Hoax)

We have chosen the most observable points that still exist to get an idea of the size of this watercourse. (The Great Dorchester Aqueduct Hoax)

(The Great Dorchester Aqueduct Hoax)
MP 1 – The Aqueduct seems to meet with the Prehistoric Hillfort – (The Great Dorchester Aqueduct Hoax)
(The Great Dorchester Aqueduct Hoax)
MP 1 – The Duct seems to be 16m wide at this point – 15m larger than the report – (The Great Dorchester Aqueduct Hoax)

It should be noted that there is no existing channel to the Roman town of Durnovaria – it has always been summised. Yet we do know it went to the Prehistoric Site of Poundbury and was connected to one of it’s ditches. (The Great Dorchester Aqueduct Hoax)

(The Great Dorchester Aqueduct Hoax)
MP 2 and MP 3 is around a Paleochannel – the question is was it filled with water so they had to go around? – (The Great Dorchester Aqueduct Hoax)
(The Great Dorchester Aqueduct Hoax)
MP 2 is 15m about the same size as MP 1 – (The Great Dorchester Aqueduct Hoax)
(The Great Dorchester Aqueduct Hoax)
Mp 3 is 13m about the same size as MP 3 -(The Great Dorchester Aqueduct Hoax)
(The Great Dorchester Aqueduct Hoax)
MP 4 is 11m again slightly smaller bout a lot bigger than the 1m in the report – (The Great Dorchester Aqueduct Hoax)
(The Great Dorchester Aqueduct Hoax)
MP 5 is the largest we have found at 23m and twice the size of the others further down the river – (The Great Dorchester Aqueduct Hoax)

There is no signs of the Aqueduct past this point although the report goes on for another 6 km down the river. What we have found in the LiDAR map is that the watercourse may have gone around the other side of this hill and has gone undiscovered. (The Great Dorchester Aqueduct Hoax)

(The Great Dorchester Aqueduct Hoax)
The watercurse seems to go around this hillock and has been missed in the report. – (The Great Dorchester Aqueduct Hoax)

The report’s focus on a single excavated section of the watercourse severely limits its relevance, especially compared to the extensive ditches on 19th-century OS maps. Additionally, the lack of investigation into the waterway beyond the prehistoric monument of Poundbury is a glaring oversight. This is a critical area to examine, as confirming whether the watercourse connected to the Roman site would make many assumptions moot if it did not serve the Romans.

Another significant issue is the reliance on calculations based solely on a one-meter-wide section of the aqueduct. This approach is problematic, as much larger sections of the watercourse—ranging from 15 to 23 times wider—exist. A more comprehensive analysis is essential to understand how the system functions practically. Without this broader perspective, the entire structure appears highly dysfunctional if interpreted as a single, unified construction. (The Great Dorchester Aqueduct Hoax)

Design

The report does not explicitly reference the aqueduct’s design in terms of its unusual alignment hugging the hillside rather than following the straight paths characteristic of Roman roads. It primarily focuses on the aqueduct’s dimensions, gradient, and some inferred routes but does not critically address this apparent deviation from typical Roman engineering practices. If we look at other Roman Aqueducts for information (via AI) we find that:

Typical Roman Aqueduct Design

  1. Straight Alignments:
    • Roman aqueducts often followed straight alignments where possible, reflecting their preference for efficient, direct routes, similar to their roads.
    • Deviations usually occurred due to natural obstacles like mountains, valleys, or other terrain challenges.
  2. Bridging and Tunneling:
    • When confronted with significant elevation changes or natural obstacles, the Romans frequently used impressive bridging (e.g., the Pont du Gard) or tunneled through hills to maintain a direct route.
  3. Standard Gradient:
    • Aqueducts maintained a consistent, gentle gradient (typically around 1:500 to 1:3000) to ensure a steady flow of water without stagnation or overflow.

Dorchester Aqueduct’s Unusual Features

  1. Hugging the Hillside:
    • The winding path of the Dorchester aqueduct, following the contours of the hillside, is atypical compared to the more direct routes commonly seen in Roman engineering.
    • This design suggests the engineers were constrained by local geography or aimed to minimize construction effort and costs by avoiding the need for extensive tunneling or bridging.
  2. Deviation from Roman Norms:
    • Unlike roads, which prioritized straightness to reduce travel time, aqueducts could afford to be more adaptive to the terrain, especially in less resource-rich provinces like Britannia.
    • The Dorchester design may reflect a more pragmatic approach, prioritizing ease of construction over traditional Roman aesthetics or norms.

Similar Examples in Roman Engineering

  1. Zaghouan Aqueduct (Tunisia):
    • While relatively straight, it includes winding sections to avoid rugged terrain.
  2. Ephesus Aqueducts (Turkey):
    • Some sections wind along hillsides to follow natural contours, likely reducing the need for costly engineering solutions.

Why Might the Dorchester Aqueduct Hug the Hillside?

  1. Geological Constraints:
    • The hillside path may have been the most practical route due to the geology of the Frome Valley, avoiding unstable terrain or areas prone to flooding.
  2. Cost Efficiency:
    • Building along the hillside might have minimized the need for elaborate structures like bridges or retaining walls.
  3. Non-Roman Influence:
    • If the aqueduct was adapted from a pre-Roman feature (e.g., a prehistoric water management system), this design might reflect earlier practices rather than Roman engineering principles.

Looking at the way the aqueduct is influenced by the prehistoric Paleochannels we may get an indication to the origins and function of the Watercourse. AI suggested that it maybe something inherited in history by the Romans and recently we have found an almost exact feature on a once thought to be a roman feature but through mathematics we now know id prehistoric in date but used by the romans for their own use – Car Dyke.

Look at the comparisons of the two sites and see the almost identical use of the shorelines of the prehistoric waters for a watercourse. (The Great Dorchester Aqueduct Hoax)

(The Great Dorchester Aqueduct Hoax)
Dorchester Aqueduct – (The Great Dorchester Aqueduct Hoax)
Car Dyke
Car Dyke – (The Great Dorchester Aqueduct Hoax)
(The Great Dorchester Aqueduct Hoax)
If we now Flood the location to the water levels of Prehistry we see the obviuos – (The Great Dorchester Aqueduct Hoax)

Conclusion

Having examined the gradient, size, and design of the watercourse, we can confidently reinterpret this feature, traditionally attributed to a Roman aqueduct, for what it likely represents.

The gradient of the watercourse would require replenishment at intervals to maintain continuous flow. This could only be achieved through springs located at the base of the ditches, a characteristic commonly found in Linear Earthworks (Dykes). A similar phenomenon was identified during our research on Offa’s Dyke, where we discovered it is not a continuous structure but rather a series of more minor dykes that were mistakenly joined into a single monument. Using LiDAR, we demonstrated that this assumption was incorrect.

Likewise, this construction is unlikely to be a continuous aqueduct but rather a collection of separate Dykes. The width and design closely resemble those of other earthworks across Britain, particularly the Car Dyke, which shares similarities in ditch size, design, and water management strategies.

Adding to this theory is the fact that the feature terminates at the prehistoric monument of Poundbury, suggesting a connection to the Mesolithic or Neolithic period, similar to Car Dyke. Notably absent from the report is the observation that the surrounding area is rich with quarry pits, which may be critical to understanding its original purpose. (The Great Dorchester Aqueduct Hoax)

(The Great Dorchester Aqueduct Hoax)
Notice the quarry pits on this hill alone – these holes are over 100ft wide – this is industrial scale mining and could have been contunued in the Roman Period – (The Great Dorchester Aqueduct Hoax)

Our investigations into Offa’s Dyke, Wansdyke, and Hadrian’s Wall’s Vallum have led us to theorize that such earthworks were constructed to transport minerals to ports or harbours for trade, processing, or sale. By this logic, Poundbury may have been a hub for these goods, with the dyke connecting to ditches that functioned as mooring sites for boats to offload materials. This reinterpretation challenges the assumption that these features were purely defensive or infrastructural and suggests a deeper, more economic purpose tied to trade and resource management. (The Great Dorchester Aqueduct Hoax)

Chesters Roman Aqueduct

Like so many others, I, too, took for granted the story of Hadrian’s Wall. Its origins, its purpose, and the architects behind its construction had seemed well-established. It was, after all, a topic I had explored in my days as an aspiring archaeologist, back in the 1990s when I was pursuing my certificate in this discipline. Those days required us to delve deep into the annals of history, to scrutinise the facts, and to offer up our findings in carefully written essays. In those moments, there was no reason to cast doubt upon the authenticity of the information handed down to us through so-called ‘peer-reviewed’ publications.

The eminent archaeologists and historians who authored these works were seen as torchbearers of truth and custodians of knowledge. But, as is often the case in our intellectual journey, a disconcerting revelation lay ahead. It was in my pursuit of understanding a lesser-known segment of Hadrian’s Wall, a portion known as ‘The Vallum,’ that the foundation of my beliefs began to tremble. What I uncovered was a stark departure from what had been suggested by the established sources. It wasn’t just a matter of minor discrepancies; it was a revelation that shattered the very foundation of what I thought I knew. The accepted history of The Vallum was, to my astonishment, flawed, and the implications were profound. Intriguingly, this wasn’t the end of my scholarly quest for truth.

My journey into questioning the accepted narratives of ancient linear earthworks led me to another fascinating discovery – Offa’s Dyke. Much like Hadrian’s Wall, a certain authority on the subject, Fox, had long been regarded as the definitive source. Yet, as I delved deeper, the picture that emerged was one of imagination rather than accurate observation. The truths I sought to uncover lay in meticulous measurements and scientific precision, not mere conjecture. And so, the Vallum, like Offa’s Dyke, emerged as a complex tapestry of subjective fabrications. Not only the Vallum but also its associated features such as Stanegate Road, Military Way, and Great Chesters Viaduct came under scrutiny. The layers of history peeled back to reveal a more intricate, and often enigmatic, narrative. As we journey through the ever-evolving landscape of our understanding, it becomes evident that the past is not a static entity but a dynamic tapestry woven together by our collective pursuit of truth and knowledge.

Robert John Langdon (2023) – Great Chesters Roman Aqueduct

Langdon’s journey was marked by meticulous mapping and years of research, culminating in a hypothesis that would reshape our understanding of prehistoric Britain. He proposed that much of the British Isles had once been submerged in the aftermath of the last ice age, with these ancient sites strategically positioned along the ancient shorelines. His groundbreaking maps offered a fresh perspective, suggesting that Avebury had functioned as a bustling trading hub for our ancient ancestors. This audacious theory challenged the prevailing notion that prehistoric societies were isolated and disconnected, instead highlighting their sophistication in trade and commerce.

In the realm of historical discovery, it is often the audacious thinkers, the mavericks who dare to question established narratives, who propel our understanding forward. Robert John Langdon is undeniably one of these thinkers. With a deep passion for history and an unyielding commitment to his research, he has unearthed a hidden chapter in the story of Avebury—one that transcends the boundaries of time and offers fresh insights into our shared human history.

As Langdon’s trilogy, ‘The Stonehenge Enigma,’ continues to explore these groundbreaking theories, it beckons us to embark on a journey of discovery, to challenge our assumptions, and to embrace the possibility that the past is far more complex and interconnected than we ever imagined. Avebury, with its ancient stones and enigmatic avenues, continues to whisper its secrets to those who dare to listen, inviting us to see history through a new lens—one illuminated by the audacious vision of Robert John Langdon. (Great Chesters Roman Aqueduct)

Great Chesters Roman Aqueduct - Hoax
Great Chesters Roman Aqueduct – Hoax

Further Reading

For information about British Prehistory, visit www.prehistoric-britain.co.uk for the most extensive archaeology blogs and investigations collection, including modern LiDAR reports.  This site also includes extracts and articles from the Robert John Langdon Trilogy about Britain in the Prehistoric period, including titles such as The Stonehenge EnigmaDawn of the Lost Civilisation and the ultimate proof of Post Glacial Flooding and the landscape we see today. (Free Stonehenge LiDAR Maps)

Robert John Langdon has also created a YouTube web channel with over 100 investigations and video documentaries to support his classic trilogy (Prehistoric Britain). He has also released a collection of strange coincidences that he calls ‘13 Things that Don’t Make Sense in History’ and his recent discovery of a lost Stone Avenue at Avebury in Wiltshire called ‘Silbury Avenue – the Lost Stone Avenue’. (Free Stonehenge LiDAR Maps)

Langdon has also produced a series of ‘shorts’, which are extracts from his main body of books:

The Ancient Mariners

Stonehenge Built 8300 BCE

Old Sarum

Prehistoric Rivers

Dykes ditches and Earthworks

Echoes of Atlantis

Homo Superior

For active discussions on the findings of the TRILOGY and recent LiDAR investigations that are published on our WEBSITE, you can join our and leave a message or join the debate on our Facebook Group.

For in-depth information about British Prehistory, we invite you to explore www.prehistoric-britain.co.uk, an extensive resource featuring archaeology blogs and investigations. This collection includes modern LiDAR reports that shed light on ancient landscapes. Additionally, you will find extracts and articles from the Robert John Langdon Trilogy, offering fascinating insights into Britain during the Prehistoric period. Some notable titles from the trilogy include “The Stonehenge Enigma,” “Dawn of the Lost Civilisation,” and groundbreaking evidence of Post Glacial Flooding and its impact on the landscape we see today.(Free Stonehenge LiDAR Maps)
Robert John Langdon has further enriched the exploration of Prehistoric Britain through his YouTube web channel, boasting over 100 investigations and video documentaries that complement his classic trilogy. In addition to his extensive work, Langdon has unveiled a compilation of intriguing coincidences titled “13 Things that Don’t Make Sense in History.” He has also brought to light his recent discovery of a forgotten Stone Avenue in Avebury, Wiltshire, aptly named ‘Silbury Avenue – the Lost Stone Avenue.’ (Free Stonehenge LiDAR Maps)

For those who wish to actively engage in discussions about the findings from the TRILOGY and recent LiDAR investigations, we invite you to join our community. You can participate by leaving messages and joining our dedicated Facebook Group debates. We encourage open dialogue and exchanging ideas to foster a deeper understanding of Prehistoric Britain and its fascinating mysteries.(Free Stonehenge LiDAR Maps)

As you embark on your journey through British Prehistory, we hope these resources provide valuable insights and inspire further exploration of this captivating field of study.

For more information about British Prehistory and other articles/books, go to our BLOG WEBSITE for daily updates or our VIDEO CHANNEL for interactive media and documentaries. The TRILOGY of books that ‘changed history’ can be found with chapter extracts at DAWN OF THE LOST CIVILISATIONTHE STONEHENGE ENIGMA and THE POST-GLACIAL FLOODING HYPOTHESIS. (The Stonehenge Hoax)

Other associated books are also available such as 13 THINGS THAT DON’T MAKE SENSE IN HISTORY and other ‘short’ budget priced books can be found on our AUTHOR SITE. For active discussion on the findings of the TRILOGY and recent LiDAR investigations that is published on our WEBSITE you can join our FACEBOOK GROUP.

(Great Chesters Roman Aqueduct)

Other Blogs

s

t

Mathematics Meets Archaeology: Discovering the Mesolithic Origins of Car Dyke

Introduction

In archaeology, theories about ancient structures and sites have traditionally been shaped by subjective interpretations, often constrained by the limited evidence.  The lack of precise data, historical bias, and conflicting narratives have left the field somewhat speculative.  However, recent advancements in mathematical modelling have introduced new ways to derive data-driven conclusions.  We can dig deeper into the ancient past by applying Bayesian and Spatial Analysis, extracting valuable insights with greater certainty.  One particularly compelling case study is the re-evaluation of Car Dyke, a linear earthwork historically associated with Roman engineering.  Through these combined mathematical approaches, we have uncovered evidence that suggests Car Dyke may have been constructed much earlier than previously thought, potentially dating back to the Mesolithic period. (Mathematics Meets Archaeology: Discovering the Mesolithic Origins of Car Dyke)

Bayesian Analysis

Bayesian analysis, a statistical method for updating the probability of a hypothesis as new evidence is introduced, has become a powerful tool in archaeology.  Rather than concluding solely on static data, Bayesian analysis allows researchers to adjust their assumptions and probabilities as more evidence becomes available.  For example, when archaeologists find artefacts from a particular period, Bayesian analysis helps calculate the likelihood that the site was occupied or used during that time.  This method is precious for refining timelines and revising outdated interpretations, as it constantly evolves based on the influx of new data.  In archaeology, it has traditionally been applied to analyse when sites were in use rather than when they were constructed.

 (Mathematics Meets Archaeology: Discovering the Mesolithic Origins of Car Dyke)

However, focusing solely on the usage of a site can leave gaps in understanding its origins.  This is where Spatial Analysis comes into play.  Spatial Analysis examines the geographic distribution of artefacts and features, revealing patterns that might indicate when and how the site was built.  By analysing the concentration of artefacts across a landscape, Spatial Analysis can help pinpoint periods of significant activity and uncover the construction date of ancient structures.  When combined with Bayesian analysis, this approach offers a more comprehensive understanding of a site’s construction and use, leading to data-driven and contextually rich conclusions. (Mathematics Meets Archaeology: Discovering the Mesolithic Origins of Car Dyke)

Car Dyke

Car Dyke is an ideal case study for demonstrating the power of this dual approach.  The Dyke stretches across Lincolnshire and Cambridgeshire, and for years, it has been a topic of debate among archaeologists.  Traditionally, scholars have attributed its construction to Roman engineering, primarily due to the presence of Roman artefacts in the broader region.  However, our research applied Bayesian and Spatial Analysis to challenge this assumption.  By focusing on the distribution of artefacts found specifically along the Dyke, we uncovered evidence suggesting that its origins might be much older, potentially tracing back to the Mesolithic or Neolithic periods.

 (Mathematics Meets Archaeology: Discovering the Mesolithic Origins of Car Dyke)

We began our investigation by applying Bayesian analysis to calculate the likelihood of different periods being associated with the construction of Car Dyke.  This required gathering data on all artefacts found across Lincolnshire and using it to calculate the prior probabilities for each period.  Given the abundance of Roman artefacts in the region, our initial Bayesian model favoured a Roman construction date.  However, as we incorporated new evidence from the area surrounding Car Dyke, a different pattern began to emerge.  Spatial Analysis revealed that a significant number of Mesolithic and Neolithic artefacts were clustered in proximity to the Dyke, suggesting that it might have been constructed much earlier than previously believed. (Mathematics Meets Archaeology: Discovering the Mesolithic Origins of Car Dyke)

Spatial Analysis

Spatial Analysis allowed us to go beyond the surface-level examination of artefacts.  By mapping the geographic distribution of Mesolithic and Neolithic finds, we could see that these early artefacts were concentrated in key areas along Car Dyke, particularly where it intersects with ancient landscapes like river valleys and elevated terrain.  This pattern indicated that the Dyke was more than just a Roman infrastructure project—it may have been a significant site for earlier peoples as well.  The concentration of Mesolithic artefacts along the Dyke strongly suggests that the site was either constructed or heavily used during that period.

(Mathematics Meets Archaeology: Discovering the Mesolithic Origins of Car Dyke)

The integration of Bayesian and Spatial Analysis was essential in refining our understanding of Car Dyke’s history.  While Bayesian analysis initially supported the Roman origin theory due to the larger body of Roman artefacts across Lincolnshire, the localised data revealed by Spatial Analysis shifted the probabilities significantly.  This combination of methods allowed us to challenge the traditional narrative and propose a new hypothesis: Car Dyke may have been constructed during the Mesolithic period and later used or modified by the Romans.  This shift in focus—from usage to construction—helped us uncover a deeper history of the site that would not have been apparent through Bayesian analysis alone. (Mathematics Meets Archaeology: Discovering the Mesolithic Origins of Car Dyke)

Data-Driven Methos of Identification

This dual approach also highlights a broader shift in archaeology toward more data-driven methods.  Traditionally, archaeology has relied on subjective interpretations, with researchers filling in the gaps when evidence was sparse.  While this has yielded valuable insights, it has also introduced biases and inconsistencies.  By incorporating mathematical models like Bayesian and Spatial Analysis, we reduce the subjectivity inherent in archaeological interpretation and increase the accuracy of our conclusions.  These methods offer a more transparent and repeatable framework for analysing archaeological data, allowing researchers to refine their hypotheses as new evidence is discovered.

The benefits of this approach extend beyond just Car Dyke.  By applying Spatial Analysis alongside Bayesian calculations, archaeologists can uncover hidden patterns that might go unnoticed.  For example, Spatial Analysis considers the broader context of artefacts within the landscape, revealing relationships between artefact concentrations and natural features such as rivers, hills, and valleys.  This level of analysis helps archaeologists understand not just when a site was used but also why it was built in a specific location.  In the case of Car Dyke, Spatial Analysis allowed us to see that the site’s significance extended far beyond the Roman period, providing a more complete picture of its history and purpose.

Our Revaluation of Car Dyke

The re-evaluation of Car Dyke’s construction date demonstrates the power of combining Bayesian and Spatial Analysis in archaeology.  Bayesian analysis is invaluable for updating our understanding of site usage, but Spatial Analysis provides critical insights into ancient structures’ construction and broader significance.  These methods allow archaeologists to move beyond speculation and embrace a more scientific approach to uncovering the past.  Integrating mathematics into archaeology marks a crucial step forward, helping researchers develop more accurate and evidence-based conclusions.

(Mathematics Meets Archaeology: Discovering the Mesolithic Origins of Car Dyke)
Car Dyke North Section – (Mathematics Meets Archaeology: Discovering the Mesolithic Origins of Car Dyke)

As we refine these techniques and apply them to other sites, the potential for discoveries grows exponentially.  The case of Car Dyke is just one example of how mathematical analysis can reshape our understanding of ancient history.  By embracing data-driven methods like Bayesian and Spatial Analysis, archaeology is evolving into a discipline that is less reliant on conjecture and more focused on scientific rigour.  The future of archaeology lies in this marriage of mathematics and empirical evidence.  As we continue to push the boundaries of what we know, we can expect to uncover even more of history’s mysteries with confidence and clarity.

Conclusion

The combination of Bayesian and Spatial Analysis has revolutionised our understanding of Car Dyke’s construction date, suggesting that it may have been built during the Mesolithic period rather than the Roman era.  This new approach has reduced the subjectivity in archaeological interpretation and allowed us to develop more accurate, data-driven conclusions.  As these mathematical models continue to be refined and applied to other archaeological sites, they will undoubtedly pave the way for even more significant discoveries and a deeper understanding of our ancient past.

The calculations

Bayesian Analysis

To calculate the prior probabilities for each period based on the total number of finds in Lincoln, we first calculate the total number of finds across all periods:

Step 1: Total Number of Finds

Total Finds=13,723(Roman)+8,994(Medieval)+5,619(Post Medieval)+1,680(Early Medieval)+2,451(Iron Age)+2,091(Neolithic)+634(Mesolithic)+980(Bronze Age)=36,172\text{Total Finds} = 13,723 (\text{Roman}) + 8,994 (\text{Medieval}) + 5,619 (\text{Post Medieval}) + 1,680 (\text{Early Medieval}) + 2,451 (\text{Iron Age}) + 2,091 (\text{Neolithic}) + 634 (\text{Mesolithic}) + 980 (\text{Bronze Age}) = 36,172Total Finds=13,723(Roman)+8,994(Medieval)+5,619(Post Medieval)+1,680(Early Medieval)+2,451(Iron Age)+2,091(Neolithic)+634(Mesolithic)+980(Bronze Age)=36,172

Step 2: Calculate Prior Probabilities

Divide the number of finds for each period by the total number of finds:

P(Roman)=13,72336,172≈0.3794P(\text{Roman}) = \frac{13,723}{36,172} \approx 0.3794P(Roman)=36,17213,723​≈0.3794 P(Medieval)=8,99436,172≈0.2487P(\text{Medieval}) = \frac{8,994}{36,172} \approx 0.2487P(Medieval)=36,1728,994​≈0.2487 P(Post Medieval)=5,61936,172≈0.1554P(\text{Post Medieval}) = \frac{5,619}{36,172} \approx 0.1554P(Post Medieval)=36,1725,619​≈0.1554 P(Early Medieval)=1,68036,172≈0.0465P(\text{Early Medieval}) = \frac{1,680}{36,172} \approx 0.0465P(Early Medieval)=36,1721,680​≈0.0465 P(Iron Age)=2,45136,172≈0.0678P(\text{Iron Age}) = \frac{2,451}{36,172} \approx 0.0678P(Iron Age)=36,1722,451​≈0.0678 P(Neolithic)=2,09136,172≈0.0578P(\text{Neolithic}) = \frac{2,091}{36,172} \approx 0.0578P(Neolithic)=36,1722,091​≈0.0578 P(Mesolithic)=63436,172≈0.0175P(\text{Mesolithic}) = \frac{634}{36,172} \approx 0.0175P(Mesolithic)=36,172634​≈0.0175 P(Bronze Age)=98036,172≈0.0271P(\text{Bronze Age}) = \frac{980}{36,172} \approx 0.0271P(Bronze Age)=36,172980​≈0.0271

Summary of Prior Probabilities:

  • Roman: 0.3794
  • Medieval: 0.2487
  • Post Medieval: 0.1554
  • Early Medieval: 0.0465
  • Iron Age: 0.0678
  • Neolithic: 0.0578
  • Mesolithic: 0.0175
  • Bronze Age: 0.0271

Step 1: Define Prior Probabilities

Using the prior probabilities:

  • Roman: P(HRoman)=0.3794P(H_{\text{Roman}}) = 0.3794P(HRoman​)=0.3794
  • Bronze Age: P(HBronze Age)=0.0271P(H_{\text{Bronze Age}}) = 0.0271P(HBronze Age​)=0.0271
  • Neolithic/Mesolithic: P(HNeolithic/Mesolithic)=0.0753P(H_{\text{Neolithic/Mesolithic}}) = 0.0753P(HNeolithic/Mesolithic​)=0.0753

Step 2: Evidence Likelihoods Based on Local Data

Given the distribution of finds:

  • Roman: P(ERoman∣HRoman)=24132≈0.1818P(E_{\text{Roman}}|H_{\text{Roman}}) = \frac{24}{132} \approx 0.1818P(ERoman​∣HRoman​)=13224​≈0.1818
  • Bronze Age: P(EBronze Age∣HBronze Age)=47132≈0.3561P(E_{\text{Bronze Age}}|H_{\text{Bronze Age}}) = \frac{47}{132} \approx 0.3561P(EBronze Age​∣HBronze Age​)=13247​≈0.3561
  • Neolithic/Mesolithic: P(ENeolithic/Mesolithic∣HNeolithic/Mesolithic)=61132≈0.4621P(E_{\text{Neolithic/Mesolithic}}|H_{\text{Neolithic/Mesolithic}}) = \frac{61}{132} \approx 0.4621P(ENeolithic/Mesolithic​∣HNeolithic/Mesolithic​)=13261​≈0.4621

Step 3: Apply Bayes’ Theorem

Posterior Probability for Roman:

P(HRoman∣E)=0.1818×0.3794P(E)=0.0689P(E)P(H_{\text{Roman}}|E) = \frac{0.1818 \times 0.3794}{P(E)} = \frac{0.0689}{P(E)}P(HRoman​∣E)=P(E)0.1818×0.3794​=P(E)0.0689​

Posterior Probability for Bronze Age:

P(HBronze Age∣E)=0.3561×0.0271P(E)=0.0097P(E)P(H_{\text{Bronze Age}}|E) = \frac{0.3561 \times 0.0271}{P(E)} = \frac{0.0097}{P(E)}P(HBronze Age​∣E)=P(E)0.3561×0.0271​=P(E)0.0097​

Posterior Probability for Neolithic/Mesolithic:

P(HNeolithic/Mesolithic∣E)=0.4621×0.0753P(E)=0.0348P(E)P(H_{\text{Neolithic/Mesolithic}}|E) = \frac{0.4621 \times 0.0753}{P(E)} = \frac{0.0348}{P(E)}P(HNeolithic/Mesolithic​∣E)=P(E)0.4621×0.0753​=P(E)0.0348​

Step 4: Normalise the Posterior Probabilities

Sum of the calculated values for normalisation:

P(E)=0.0689+0.0097+0.0348≈0.1134P(E) = 0.0689 + 0.0097 + 0.0348 \approx 0.1134P(E)=0.0689+0.0097+0.0348≈0.1134

Now, calculate the normalised posterior probabilities:

  • Roman:

P(HRoman∣E)=0.06890.1134≈0.6074P(H_{\text{Roman}}|E) = \frac{0.0689}{0.1134} \approx 0.6074P(HRoman​∣E)=0.11340.0689​≈0.6074

  • Bronze Age:

P(HBronze Age∣E)=0.00970.1134≈0.0855P(H_{\text{Bronze Age}}|E) = \frac{0.0097}{0.1134} \approx 0.0855P(HBronze Age​∣E)=0.11340.0097​≈0.0855

  • Neolithic/Mesolithic:

P(HNeolithic/Mesolithic∣E)=0.03480.1134≈0.3069P(H_{\text{Neolithic/Mesolithic}}|E) = \frac{0.0348}{0.1134} \approx 0.3069P(HNeolithic/Mesolithic​∣E)=0.11340.0348​≈0.3069

Analysis and Interpretation:

  • Neolithic/Mesolithic: The higher frequency of finds in this period significantly increases its posterior probability to approximately 30.69%, which is quite substantial.
  • Roman: Despite having fewer finds in this area, the Roman period still has a high posterior probability due to its higher prior, but it is now only about 60.74%.
  • Bronze Age: The probability for the Bronze Age period remains lower at approximately 8.55%.

Conclusion:

The calculated probabilities show a more balanced view, with the Roman period still favoured but with a much stronger case for the Mesolithic/Neolithic period.  This suggests that while Roman use of the Dyke is still likely, the Mesolithic/Neolithic period also holds significant importance, potentially indicating earlier use or occupation before the Romans.

Langdon Mathematics

While Bayesian theory often yields definitive results, its accuracy can be compromised due to its dependence on subjective prior assumptions, which may only sometimes reflect reality.  If these priors are not well-chosen or are based on incomplete or biased information, the resulting analysis might be misleading.

Therefore, relying solely on Bayesian methods without considering the variability and complexity of archaeological data could lead to conclusions that only partially capture the nuances of the actual distribution of artefacts.  My method, which focuses on Spatial Analysis and empirical data, addresses these limitations.

My approach to calculating finds would differ significantly.  First, I would define the area where artefacts could be discovered—using Lincolnshire as a reference due to its comprehensive archaeological data.  By doing so, we can estimate the expected number of artefacts per square meter of Lincolnshire land, offering a more objective and spatially grounded method for understanding artefact distribution.

As IA reports:

To calculate the percentage likelihood of finding an artefact from each period in a single square meter of Lincolnshire, we can follow these steps:

Step 1: Determine the Area of Lincolnshire

  • Area of Lincolnshire: Approximately 6,959 square kilometres (6,959,000,000 square meters).

Step 2: Calculate the Find Density

For each period, calculate the density of finds per square meter by dividing the total number of finds by the area of Lincolnshire.

Step 3: Calculate the Likelihood for Each Period

  1. Roman:

Likelihood: 0.000156%

  • Neolithic:


Likelihood: 0.000011%

  • Mesolithic:

Likelihood: 0.000004%

  • Bronze Age:

Likelihood: 0.000003%

Summary of Likelihoods in order of expectation:

  • Roman: 0.000156%
  • Medieval: 0.000129%
  • Post Medieval: 0.000081%
  • Early Medieval: 0.000024%
  • Iron Age: 0.000021%
  • Neolithic: 0.000011%
  • Mesolithic: 0.000004%
  • Bronze Age: 0.000003%

These percentages represent the likelihood of finding an artefact from each period in a square meter of Lincolnshire.  Given the extensive activity during that time, the highest is for the Roman period, just marginally ahead of the Medieval period.

We now need to look at the search area (63 miles of the Northern End of Car Dyke) as listing on the LiDAR maps in the previous section of the book.  We must first calculate the total search area in square metres, count the number of finding within this area, and then compare against the expected number.

Summary of Expected Finds:

  • Roman: 15.83 artefacts
  • Medieval: 13.07 artefacts
  • Post Medieval: 8.19 artefacts
  • Early Medieval: 2.44 artefacts
  • Iron Age: 2.17 artefacts
  • Neolithic: 1.07 artefacts
  • Unknown: 0.59 artefacts
  • Modern: 0.50 artefacts
  • Mesolithic: 0.36 artefacts
  • Bronze Age: 0.34 artefacts

Summary of Items Found:

  • Mesolithic/Neolithic: 61 finds
  • Bronze Age: 47 finds
  • Roman: 24 finds

Calculate the Odds of This Kind of Find

For each period, the odds ratio of finding this many artefacts compared to the expected finds:

Step 4: Interpret the Results

  • Mesolithic/Neolithic: A massive 5589.72% increase and an odds ratio of 57.01 suggest significant activity during this period, far beyond what was expected.
  • Bronze Age: An even higher increase of 13723.53% and an odds ratio of 138.24 indicate the area was very important during the Bronze Age.
  • Roman: A modest 51.60% increase with an odds ratio of 1.52 suggests Roman activity, but not as dominant as the earlier periods.

Conclusion

The very high percentage increases and odds ratios for the Mesolithic/Neolithic and Bronze Age periods strongly suggest that the Car Dyke area was occupied and actively used during these times, with significant archaeological activity that exceeds what would be expected based on general Lincolnshire data.  While still represented, the Roman period is less prominent in this area compared to the earlier periods.

This confirms other Dyke surveys such as Offa’s and Wansdyke that also show design (wibbly-wobbly) in construction attributed to the builders seeking natural springs rather than a direct line of route to maintain water levels which were achieved at a later date in history by locks.

Further Reading

For information about British Prehistory, visit www.prehistoric-britain.co.uk for the most extensive archaeology blogs and investigations collection, including modern LiDAR reports.  This site also includes extracts and articles from the Robert John Langdon Trilogy about Britain in the Prehistoric period, including titles such as The Stonehenge Enigma, Dawn of the Lost Civilisation and the ultimate proof of Post Glacial Flooding and the landscape we see today.

Robert John Langdon has also created a YouTube web channel with over 100 investigations and video documentaries to support his classic trilogy (Prehistoric Britain). He has also released a collection of strange coincidences that he calls ‘13 Things that Don’t Make Sense in History’ and his recent discovery of a lost Stone Avenue at Avebury in Wiltshire called ‘Silbury Avenue – the Lost Stone Avenue’.

Langdon has also produced a series of ‘shorts’, which are extracts from his main body of books:

The Ancient Mariners

Stonehenge Built 8300 BCE

Old Sarum

Prehistoric Rivers

Dykes ditches and Earthworks

Echoes of Atlantis

Homo Superior

Other Blogs

s

t