Car Dyke Atlas – Prehistoric Canals – FREE Flipbook

Introduction

Step into a new era of historical exploration where cutting-edge technology meets centuries-old mysteries. Our latest publication not only redefines the story of one of Britain’s most enigmatic earthworks but also transforms the way you experience a book. Welcome to the launch of the groundbreaking Car Dyke Atlas and the innovative FusionBook 360 concept—a fusion of traditional scholarship and next-generation multimedia interactivity.


Unmasking the True Origins of Car Dyke

For centuries, Car Dyke was regarded as a relic of Roman engineering—a mere canal or drainage system that facilitated military logistics and agricultural management. However, our first-ever comprehensive LiDAR investigation has completely rewritten that narrative. By employing state-of-the-art laser scanning, we have penetrated the dense vegetation and hidden soil layers to reveal a much more complex story. The data, bolstered by advanced mathematical dating methods and AI-assisted analysis, demonstrate that Car Dyke is not Roman but prehistoric in origin, with roots dating to the Mesolithic and Neolithic periods.

Inside the Investigation

  • LiDAR Mapping: Our high-resolution scans provide unprecedented detail, capturing the full 103-mile span of Car Dyke. The imagery reveals intricate construction details and natural variations that traditional methods have overlooked.
  • Mathematical Dating: Utilising a novel approach that integrates archaeological finds with advanced algorithms, our team has applied mathematical theorems to establish a definitive timeline. This breakthrough challenges centuries of conventional wisdom and suggests a multi-phased construction history long before the Roman era.
  • Archaeological Integration: The Atlas includes comprehensive data from archaeological excavations—pottery shards, tools, and other artefacts—that further support the prehistoric origin of the Dyke.

LiDAR mapping reveals Car Dyke’s hidden prehistoric layers, challenging the Roman narrative.”
LiDAR mapping reveals Car Dyke’s hidden prehistoric layers, challenging the Roman narrative

The Car Dyke Atlas: A Deep Dive into History

Car Dyke Atlas is not merely a book—it is a complete digital and print repository of our groundbreaking research. With over 140 meticulously crafted illustrations, 58 audio files, 22 360° interactive maps, and 120 flyover video clips, the Atlas offers a multidimensional view of this ancient earthwork.

Key Sections of the Atlas

  • Preamble & Introduction: Sets the stage by summarising decades of archaeological debate and introducing our revolutionary LiDAR findings.
  • Methodology: Explains the innovative techniques, including advanced AI and mathematical models, that enabled us to accurately map and date Car Dyke.
  • Detailed Mapping & Analysis: Interactive maps and flyover videos allow readers to explore Car Dyke in minute detail—from its northern, central, and southern sections to the subtle variations in its elevation and course.
  • Comparative Archaeology: Chapters that juxtapose traditional interpretations with our new findings, offering a compelling case for re-evaluating Britain’s ancient landscape.
  • Multimedia Content: Beyond static images, the Atlas integrates audio narrations, expert discussions, and interactive elements that provide context and bring the research to life.
The Car Dyke Atlas offers a panoramic view of history—where detailed maps meet immersive multimedia.”
The Car Dyke Atlas offers a panoramic view of history—where detailed maps meet immersive multimedia.

FusionBook 360: A New Paradigm in Storytelling

In today’s fast-paced digital age, traditional books are evolving. FusionBook 360 represents the future of reading—a concept that reimagines the boundaries between print and digital media. This revolutionary format brings historical scholarship into the 21st century by seamlessly integrating interactive and multimedia elements into the reading experience.

What Makes FusionBook 360 Unique?

  • Dual Format Availability: Choose between a digital edition loaded with interactive features and a beautifully designed printed edition enhanced with QR codes that unlock a wealth of supplementary content.
  • Realistic Page-Turning Effects: Experience the nostalgic feel of flipping pages, complete with authentic sound effects, yet enjoy the benefits of digital enhancements.
  • Embedded Interactive Content: Access video introductions, expert panels, detailed audio narrations, and 360° maps—all within the book’s pages. Each chapter invites readers to engage more deeply with the content.
  • Cloud-Based Updates: Stay current with ongoing research. As new discoveries emerge, the book updates automatically, ensuring that your copy remains at the cutting edge of historical scholarship.
  • Smart Chatbot Integration: Have a question while reading? Our integrated chatbot provides instant answers and additional context, making your exploration seamless and interactive.
FusionBook 360 transforms your reading experience, merging the tactile pleasure of print with the limitless possibilities of digital interactivity.”

Bridging the Past and Future: The Impact of Our Research

The implications of our findings extend far beyond Car Dyke itself. By challenging the long-held view of Car Dyke as a Roman construct, we open up new avenues of research into prehistoric engineering and land management. Our work sets a new standard for historical inquiry, combining rigorous scientific analysis with the creative potential of modern multimedia technology.

Why This Matters

  • Rewriting History: Our research forces historians, archaeologists, and the public to reconsider the origins of Car Dyke and, by extension, the broader narrative of Britain’s ancient past.
  • Innovative Methodologies: The integration of LiDAR technology, AI, and mathematical analysis provides a blueprint for future studies in archaeology.
  • Enhanced Engagement: FusionBook 360 invites a wider audience—from academic experts to curious enthusiasts—to engage with history in a more dynamic, interactive way.
The Car Dyke Atlas
Where ancient mysteries meet modern innovation—redefining our understanding of the past.


Join Us on This Journey

Be part of a transformative moment in historical research and digital publishing. Whether you are a scholar, a technology enthusiast, or simply passionate about uncovering the secrets of our past, the Car Dyke Atlas and FusionBook 360 offer an unparalleled journey into history.


By merging rigorous scientific inquiry with immersive multimedia technology, we’re not just telling history—we’re experiencing it. Step into a world where every page turns into a window to the past, and where the future of historical research is unfolding right before your eyes.

For more exclusive content, behind-the-scenes insights, and regular updates, visit our website and follow us on social media.


Car Dyke – ABC News Podcast

Summary

The book ‘The Car Dyke LiDAR Atlas’ presents a thorough investigation of the Car Dyke, a large ancient waterway in Britain. Using LiDAR technology, the author argues that the Dyke is much older than previously thought, dating back to the Mesolithic/Neolithic periods, and was likely used for transportation and water management rather than simply as a Roman drainage channel or defensive barrier. The book features detailed maps and analysis of the Dyke’s construction and course, including insights into the surrounding landscape and archaeological finds, to support the author’s conclusions.


Car Dyke Audio Book

Britain’s first-ever LiDAR investigation and mapping project of Car Dyke.

Downloadable audio file: https://drive.google.com/file/d/1z17XHVqzTVc8mrtk7Wkx7d-5uI_8tQuD/view

Unveiling the Truth: The Real History of Britain’s Dykes

For over a century, conventional archaeology has promoted the idea that Britain’s great Dykes—such as Offa’s Dyke and Wansdyke—were built by the Saxons as defensive barriers. These theories, based on limited fieldwalking evidence and subjective interpretation, have gone largely unchallenged. But what if this widely accepted narrative is completely wrong?

Car Dyke: The Key to a Forgotten Past

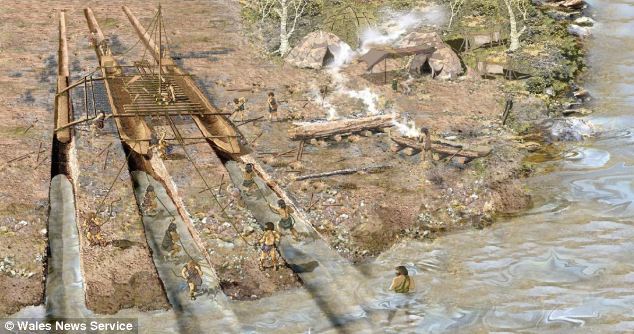
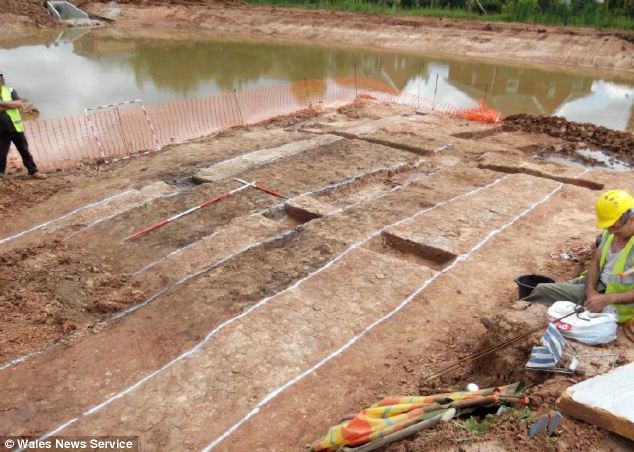
Car Dyke has long stood apart, defying the traditional explanations of Saxon territorial defence. When a boat laden with goods was discovered at the bottom of Car Dyke—dating back hundreds of years before the Saxons arrived in Britain—it should have rewritten history. Yet, mainstream archaeology dismissed this evidence, continuing to support outdated theories.

Revolutionary New Findings with LiDAR Technology

Using cutting-edge LiDAR mapping, our research has uncovered undeniable proof that Car Dyke and similar Dykes are not Saxon or even Roman constructions. Instead, they are intricately linked to ancient paleochannels, suggesting an advanced transportation and water management system that predates recorded history. Our new maps have corrected the estimated length of Car Dyke from 85 miles to 103 miles, aligning with the theories proposed by William Stukeley nearly 300 years ago. His claim that the Dyke supported the Roman occupation of Lincolnshire by facilitating troop and resource movements has now been scientifically validated.

Redefining Britain’s Longest Dyke

This research now positions Car Dyke as Britain’s longest Dyke, surpassing Offa’s Dyke, previously believed to be 177 miles long. Our survey reveals that Offa’s Dyke is, in fact, a series of smaller Dykes, totalling just 59.2 miles. Like Car Dyke, these ancient waterways were repurposed by the Romans for transportation and resource extraction, fundamentally shifting our understanding of Britain’s infrastructure.

A Groundbreaking Discovery: The Mesolithic and Neolithic Origins of the Dykes

Our mathematical analysis reveals that Car Dyke, Offa’s Dyke, and Wansdyke predate both the Romans and Saxons, tracing their origins back to the Mesolithic and Neolithic periods. This breakthrough challenges the established archaeological timeline and presents a compelling case for an advanced prehistoric civilisation. Could these ancient canals have been used to transport the massive stones of Britain’s megalithic structures? Our findings suggest they very well could have.

Rewriting the History of Britain’s Past. This book uncovers the real purpose and origins of Britain’s enigmatic Dykes, using cutting-edge technology and rigorous analysis to challenge centuries of academic assumptions. If you’re ready to explore the truth behind Britain’s forgotten past, this book will change everything you thought you knew about history.

NB. The tile references relate to their site’s FREE DEFRA LiDAR surveys, which are available on their site: .https://environment.data.gov.uk/survey


Car Dyke LiDAR Flyover


Softback B/W Edition for Amazon – with QR codes to the interactive website links

The Car Dyke Atlas
The Car Dyke Atlas

Softback Colour Edition for Amazon – with QR codes to the interactive website links

The Car Dyke Atlas
The Car Dyke Atlas

Further Reading

For those interested in British Prehistory, visit www.prehistoric-britain.co.uk, a comprehensive resource featuring an extensive collection of archaeology articles, modern LiDAR investigations, and groundbreaking research. The site also includes insights and extracts from the acclaimed Robert John Langdon Trilogy, a series of books exploring Britain during the Prehistoric period. Titles in the trilogy include The Stonehenge Enigma, Dawn of the Lost Civilisation, and The Post Glacial Flooding Hypothesis, offering compelling evidence about ancient landscapes shaped by post-glacial flooding.

To further explore these topics, Robert John Langdon has developed a dedicated YouTube channel featuring over 100 video documentaries and investigations that complement the trilogy. Notable discoveries and studies showcased on the channel include 13 Things that Don’t Make Sense in History and the revelation of Silbury Avenue – The Lost Stone Avenue, a rediscovered prehistoric feature at Avebury, Wiltshire. (The Great Farming Hoax – Einkorn Wheat)

In addition to his main works, Langdon has released a series of shorter, accessible publications, ideal for readers delving into specific topics. These include:

For active discussions and updates on the trilogy’s findings and recent LiDAR investigations, join our vibrant community on Facebook. Engage with like-minded enthusiasts by leaving a message or contributing to debates in our Facebook Group.

Whether through the books, the website, or interactive videos, we aim to provide a deeper understanding of Britain’s fascinating prehistoric past. We encourage you to explore these resources and uncover the mysteries of ancient landscapes through the lens of modern archaeology.

For more information, including chapter extracts and related publications, visit the Robert John Langdon Author Page. Dive into works such as The Stonehenge Enigma or Dawn of the Lost Civilisation, and explore cutting-edge theories that challenge traditional historical narratives. (The Great Farming Hoax – Einkorn Wheat)


Other Blogs

s

t

Unmasking the “Iron Age Hillfort” Myth

Introduction

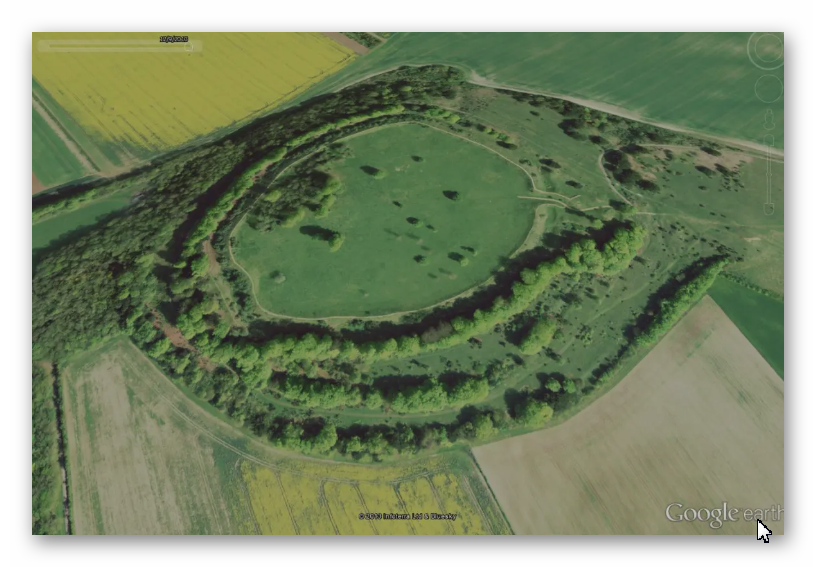
I’m challenging the long-held belief that many sites across Britain, traditionally labeled as “Iron Age Hillforts,” were built primarily for defence. Instead, I argue these sites, rather than being fortresses meant for warfare, were vibrant centres of trade and commerce, with unique features that connect them to waterborne transport and economic activity. By meticulously examining archaeological findings and employing the latest LiDAR technology, I aim to deconstruct the conventional narrative surrounding these sites, focusing on three prominent examples: Danebury, Maiden Castle, and Old Sarum.

At the heart of this reassessment is a fundamental question: were these sites indeed conceived as fortifications, or have modern interpretations mistakenly imposed a militaristic lens onto structures with potentially diverse purposes? While these sites might have been repurposed for defence in later periods, I propose that their original function was far removed from warfare. This theory gains strength by thoroughly examining the three case studies, each offering compelling evidence to support this new perspective.

Unmasking the "Iron Age Hillfort" Myth
Stone Tools found from the Neolithic Period – Unmasking the “Iron Age Hillfort” Myth

Starting with Danebury, located in Hampshire, England, it exemplifies the limits of current archaeological classifications. Often cited as a quintessential Iron Age Hillfort, Danebury’s true origins, as I see it, lie further back in history. Carbon dating of artefacts within the site suggests a history stretching into the Bronze Age, possibly even as far back as the Neolithic, undermining the “Iron Age” label.

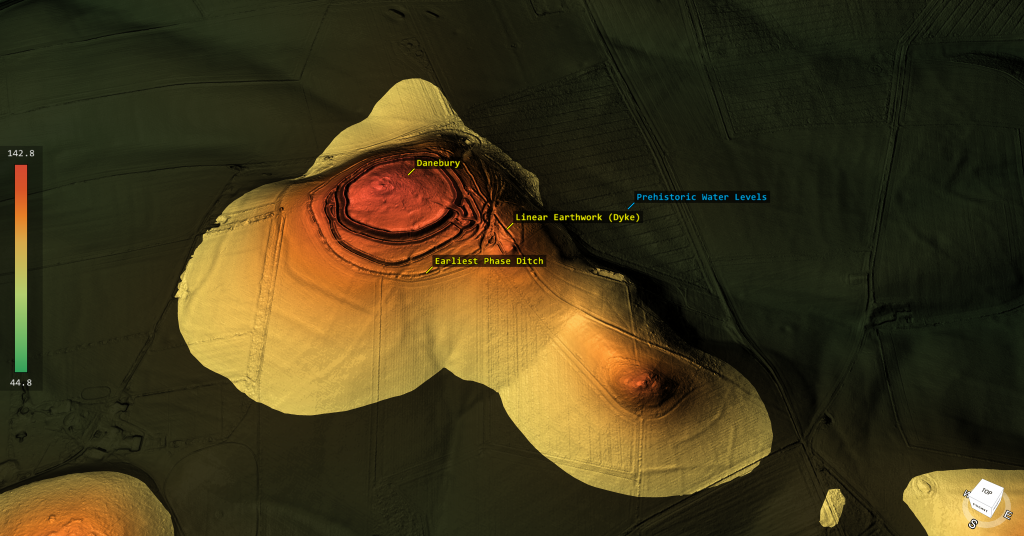
I point to the design of Danebury’s ditches as a clue to its original purpose. The fact that more earthwork material is deposited on the outer side of the ditch, unlike a typical defensive design, raises doubts about its purely defensive role. Further, LiDAR analysis reveals a linear earthwork or dyke that connects to the outer ditch, hinting at a possible connection to an ancient river system. I believe this suggests that Danebury may have served as a vital access point to a navigable waterway, facilitating trade and movement along the river.

Unmasking the "Iron Age Hillfort" Myth
A Dyke connects to the Ditches of the site Unmasking the “Iron Age Hillfort” Myth

Then there’s Maiden Castle, Britain’s largest hillfort in Dorset. Its sheer size and strategic location seemingly support the traditional idea of a fortress, yet I highlight the logistical hurdles inherent in defending such a vast space. Maintaining a defensive stance at Maiden Castle would have required an immense workforce and a supporting infrastructure of water sources, food supplies, and facilities for weapon and armour production. However, despite extensive archaeological surveys and detailed LiDAR scans, evidence of such infrastructure is notably absent. This lack of essential defensive elements doubts the idea of Maiden Castle as a military stronghold.

In addition, the flat-bottomed ditches at Maiden Castle resemble those found at other prehistoric sites, like Avebury, Stonehenge, and Old Sarum. These unique ditches weaken the argument for a purely defensive function, hinting instead at a shared purpose across these sites.

Unmasking the "Iron Age Hillfort" Myth
Old Sarum – Unmasking the “Iron Age Hillfort” Myth

Old Sarum, a site in Wiltshire with a rich and layered history, further supports my argument against the simplistic “Iron Age Hillfort” label. Located in a floodplain on an island rather than a hill, as one would expect for a “hillfort,” Old Sarum’s placement raises immediate questions. LiDAR analysis shows that the spoil from its ditch was placed on the outside rather than inside—again, contradicting defensive design conventions. Examining the site’s water table and discovering a deep well suggest that the ditches may have once acted as moats. These moats, filled by a higher water table in the past, could have served as part of a waterborne trade system, allowing boats to navigate to the site.

Another aspect that supports my theory is the logistical impracticality of maintaining multiple “hillforts” close to each other. Given the likely limited population in prehistoric Britain, building and sustaining numerous large-scale defensive structures in a relatively small area would have strained resources and human resources. This suggests these sites may have served purposes that fostered cooperation and economic exchange rather than conflict.

Unmasking the "Iron Age Hillfort" Myth
Shows that the Ditch contents were placed on the outside, NOT inside – Unmasking the “Iron Age Hillfort” Myth

Finally, a compelling “smoking gun” for this theory is the complete absence of human remains within the ditches of these so-called “Iron Age Hillforts.” If battles had occurred at these sites, we would expect to find evidence of casualties within the defensive perimeter. The lack of such evidence is significant, prompting a reconsideration of their true nature.

Drawing on archaeological evidence and insights from LiDAR technology, I present a strong case for a paradigm shift in our understanding of these enigmatic sites. The traditional interpretation of “Iron Age Hillforts” as primarily defensive structures doesn’t hold up under scrutiny, paving the way for a new perspective. Instead, I believe these sites were bustling centres of trade and commerce, intricately connected by waterways and essential hubs for economic activity in prehistoric Britain.

Other Information

Debunking the Iron Age Hill Fort: A Review of Robert John Langdon’s Claims

This briefing document reviews the main themes and arguments presented by independent researcher Robert John Langdon on his website Prehistoric Britain. Langdon challenges the traditional interpretation of numerous archaeological sites in Britain, specifically those categorized as “Iron Age Hill Forts.” He posits that these sites, based on his analysis of LiDAR data and reinterpretations of existing archaeological evidence, pre-date the Iron Age, served purposes other than defense, and are often misclassified. (Unmasking the “Iron Age Hillfort” Myth)

Main Themes:

  • Misclassified as “Iron Age”: Langdon argues that many sites labeled as Iron Age hill forts contain evidence (primarily flint artifacts) pointing to significantly earlier occupation, potentially dating back to the Neolithic or even Mesolithic periods. He uses Danebury and Maiden Castle as primary examples. He states, “a significant proportion of these hillforts, often exceeding a staggering 95%, have unveiled themselves to be significantly more ancient than the Iron Age.”
  • Not Primarily Defensive Structures: Langdon challenges the defensive interpretation of these sites, citing the lack of skeletal remains indicative of warfare found within their ditches. He argues that the shape and size of ditches at some sites, such as Maiden Castle and Old Sarum, are more consistent with moats, suggesting alternative functions like water management, trade, or symbolic boundaries. He emphatically states, “Not a solitary remains of a life extinguished in conflict has ever been unearthed within the confines of the ditches encircling any of the two thousand so-called ‘Iron Age Forts’ that punctuate history.”
  • LiDAR Reveals a Different Story: Langdon heavily relies on LiDAR technology to support his claims. He argues that LiDAR reveals features missed by traditional archaeological methods, such as the true extent of linear earthworks at Danebury and the absence of wells at Maiden Castle, which would have been essential for sustaining a large defending population. He also uses LiDAR to dispute the existence of Roman roads at Old Sarum, challenging established narratives.
  • Logistical Impossibility of Defense: Using Maiden Castle as an example, Langdon argues that defending such a large site would have required an enormous and unsustainable logistical effort in terms of manpower, food, water, and weaponry. He contrasts this with the lack of archaeological evidence for such infrastructure, concluding that the traditional narrative of a heavily defended fortress is untenable.

Important Ideas/Facts:

  • Danebury: While traditionally classified as an Iron Age site, Langdon highlights radiocarbon dating results placing its origins in the Bronze Age. He emphasizes the discovery of Neolithic and early Bronze Age flints and questions the defensive nature of the site’s ditches based on their construction.
  • Maiden Castle: Langdon disputes its Iron Age designation based on the presence of Neolithic artifacts. He argues that the scale of the site would have necessitated a massive logistical network to sustain a large population, which is unsupported by archaeological findings. He also questions the defensive purpose of the ditches based on their shape and the lack of evidence for essential infrastructure like wells.
  • Old Sarum: Langdon challenges its categorization as a hill fort due to its location in a floodplain. He uses LiDAR data to refute the existence of Roman roads through the site and suggests that the ditches might have been moats, potentially used for water management or trade.

(Unmasking the “Iron Age Hillfort” Myth)

Critical Analysis:

While Langdon raises thought-provoking points and emphasizes the potential of LiDAR technology, several aspects of his argument require careful consideration:

  • Overreliance on Absence of Evidence: The lack of skeletal remains within ditches doesn’t definitively rule out the possibility of conflict. Warfare might have occurred elsewhere, bodies could have been removed, or preservation conditions might be unfavorable.
  • Selective Interpretation: While emphasizing inconsistencies in traditional narratives, Langdon’s interpretations of LiDAR data and archaeological evidence may also be subjective. Alternative explanations for the observed features might exist.
  • Lack of Peer Review: As an independent researcher, Langdon’s work hasn’t undergone the rigorous scrutiny of academic peer review, which is essential for validating his claims and interpretations.

Conclusion:

Langdon’s work serves as a reminder that archaeological interpretations are constantly evolving with new discoveries and technologies. His challenges to established narratives, while requiring further scrutiny, highlight the importance of reassessing assumptions and integrating new data into our understanding of the past.

(Unmasking the “Iron Age Hillfort” Myth)

Briefing Doc: Rethinking Prehistoric Britain

Source: Excerpts from “Old Sarum Lidar Map – Prehistoric Britain” and “The Great Iron Age Hill Fort Hoax – Prehistoric Britain” on prehistoric-britain.co.uk

Author: Robert John Langdon

Main Themes:

  • Challenging Conventional Archaeological Narratives: Langdon questions long-held assumptions about prominent prehistoric sites in Britain, particularly the classification and function of “Iron Age Hill Forts.” He utilizes LiDAR technology to re-examine these sites, proposing alternative interpretations based on new evidence.
  • The Post-Glacial Flooding Hypothesis: This hypothesis, central to Langdon’s work, suggests that rising sea levels after the last Ice Age significantly impacted the British landscape and the lives of its inhabitants. He posits that many sites currently categorized as defensive structures may have served different purposes, potentially related to a maritime civilization.
  • The Importance of LiDAR in Archaeological Research: Langdon emphasizes the transformative power of LiDAR technology in revealing hidden landscape features and challenging traditional interpretations. He argues that LiDAR data compels a reevaluation of many archaeological assumptions.

Key Ideas/Facts:

  • Reinterpreting “Iron Age Hill Forts”:Location: Langdon challenges the assumption that these sites were exclusively hilltop fortifications. He cites Old Sarum, located in a floodplain, as an example.
  • Ditch Construction: The construction of ditches at sites like Danebury and Maiden Castle, with more material deposited on the outer side and flat-bottomed profiles, raises questions about their defensive purpose. This construction style resembles Norman castle moats, which were filled with water.
  • Lack of Battle Evidence: The absence of any human remains found within the ditches of these “hill forts” casts doubt on their role in warfare.
  • Alternative Function: Langdon suggests that these sites may have served as centers for trade and transportation, possibly linked by a network of canals and navigable waterways.
  • The Impact of Post-Glacial Flooding:Elevated Water Tables: Higher water tables in prehistoric times would have made the ditches at these sites readily floodable, creating moats.
  • Maritime Civilization: Langdon proposes the existence of a sophisticated maritime civilization in prehistoric Britain, capable of constructing and utilizing these sites for navigation and trade.
  • LiDAR as an Archaeological Tool:Revealing Hidden Features: LiDAR helps uncover previously unknown landscape features, such as the “Dyke” at Danebury, providing new insights into the connections between sites and their potential functions.
  • Challenging Assumptions: LiDAR data forces archaeologists to reconsider traditional interpretations and develop new hypotheses based on a more comprehensive understanding of the landscape.

Supporting Quotes:

  • “In archaeology, I believe honesty is paramount. Categorising sites under broad labels like “Iron Age Forts” oversimplifies their complexities.”
  • “This new understanding of the water table also opens up the possibility that the outer ditch was also moated up to the Norman conquest and moreover, during the Roman period – this is something that needs urgent explanation and further study.”
  • “Might we be gazing upon prehistoric moats, which, in the bygone era of elevated water tables, would have readily filled to assume the characteristics of a moat?”
  • “Not a solitary remains of a life extinguished in conflict has ever been unearthed within the confines of the ditches encircling any of the two thousand so-called ‘Iron Age Forts’ that punctuate history.”

Significance:

Langdon’s work presents a provocative challenge to traditional archaeological interpretations of prehistoric Britain. By utilizing new technologies like LiDAR and questioning long-held assumptions, he opens up new avenues of research and encourages a more nuanced understanding of the past. His work has implications for how we view the capabilities and complexities of prehistoric societies and the forces that shaped the British landscape.

(Unmasking the “Iron Age Hillfort” Myth)

Further Reading

For information about British Prehistory, visit www.prehistoric-britain.co.uk for the most extensive archaeology blogs and investigations collection, including modern LiDAR reports.  This site also includes extracts and articles from the Robert John Langdon Trilogy about Britain in the Prehistoric period, including titles such as The Stonehenge Enigma, Dawn of the Lost Civilisation and the ultimate proof of Post Glacial Flooding and the landscape we see today.

Robert John Langdon has also created a YouTube web channel with over 100 investigations and video documentaries to support his classic trilogy (Prehistoric Britain). He has also released a collection of strange coincidences that he calls ‘13 Things that Don’t Make Sense in History’ and his recent discovery of a lost Stone Avenue at Avebury in Wiltshire called ‘Silbury Avenue – the Lost Stone Avenue’.

(Unmasking the “Iron Age Hillfort” Myth)

Langdon has also produced a series of ‘shorts’, which are extracts from his main body of books:

The Ancient Mariners

Stonehenge Built 8300 BCE

Old Sarum

Prehistoric Rivers

Dykes ditches and Earthworks

Echoes of Atlantis

Homo Superior

(Unmasking the “Iron Age Hillfort” Myth)

For active discussions on the findings of the TRILOGY and recent LiDAR investigations that are published on our WEBSITE, you can join our and leave a message or join the debate on our Facebook Group.

Unlocking the Mysteries of British Prehistory

Delve into the depths of time, as we embark on a captivating voyage into the enigmatic world of British prehistory. www.prehistoric-britain.co.uk is your portal to a treasure trove of archaeological wonders, modern LiDAR reports, and fascinating insights from the Robert John Langdon Trilogy. This immersive digital hub is your key to unlocking the secrets of Britain’s ancient past.

(Unmasking the “Iron Age Hillfort” Myth)

A Glimpse into the Robert John Langdon Trilogy

Step into the shoes of Robert John Langdon, a dedicated explorer of Britain’s prehistoric mysteries. His trilogy, comprising “The Stonehenge Enigma,” “Dawn of the Lost Civilization,” and “The Post-Glacial Flooding Hypothesis,” is a literary marvel that unravels the untold tales of our ancestors. These books take you on an exhilarating journey through time, meticulously researched and backed by over 125 references from esteemed scientists, archaeological experts, and geological researchers.

(Unmasking the “Iron Age Hillfort” Myth)

Dive into the World of LiDAR

At www.prehistoric-britain.co.uk, we harness the power of LiDAR technology to unearth hidden landscapes and archaeological marvels. Our LiDAR reports offer a modern lens through which you can peer into ancient history. Explore the effects of flooding on the British environment after the great ice age melt, a phenomenon that has shaped the landscape we see today. Join us in decoding the mysteries of our past using cutting-edge technology.

(Unmasking the “Iron Age Hillfort” Myth)

A Multimedia Experience

Our commitment to storytelling extends beyond the written word. Robert John Langdon has curated a rich multimedia experience, including a YouTube web channel featuring over 100 investigations and video documentaries. These visual journeys complement his classic trilogy, providing a multi-dimensional understanding of prehistoric Britain. From Stonehenge’s construction in 8300 BCE to the lost Stone Avenue at Avebury in Wiltshire known as ‘Silbury Avenue,’ these documentaries offer an immersive experience that brings history to life.

(Unmasking the “Iron Age Hillfort” Myth)

Explore the ’13 Things that Don’t Make Sense in Ancient History’

History is replete with anomalies and enigmas that defy explanation. Robert John Langdon has curated a collection of such historical curiosities in ’13 Things that Don’t Make Sense in History.’ These peculiar occurrences and unanswered questions will leave you pondering the mysteries of the past, inviting you to join the debate on their possible interpretations.

(Unmasking the “Iron Age Hillfort” Myth)

More Blogs

s

t

(Unmasking the “Iron Age Hillfort” Myth)

Car Dyke – ABC News PodCast

Summary

The book ‘The Car Dyke LiDAR Atlas’ presents a thorough investigation of the Car Dyke, a large ancient waterway in Britain. Using LiDAR technology, the author argues that the Dyke is much older than previously thought, dating back to the Mesolithic/Neolithic periods, and was likely used for transportation and water management rather than simply as a Roman drainage channel or defensive barrier. The book features detailed maps and analysis of the Dyke’s construction and course, including insights into the surrounding landscape and archaeological finds, to support the author’s conclusions.

Car Dyke Transcript

Welcome in deep divers ready to get our hands dirty.

Always up for a challenge, especially if it involves rewriting history.

Today we’re diving headfirst into the heart of eastern England.

Sounds intriguing. What’s on the agenda? Roman ruins, hidden treasure.

Even better, we’re tackling a seemingly unassuming ditch known as Car Dyke

A ditch. You’ve piqued my curiosity. There’s got to be more to it than meets the eye.

Oh, absolutely. This isn’t just any ditch car. Dyke has been hiding in plain sight for centuries, mislabeled as just another Roman canal.

I’m sensing a butt coming,

But thanks to some seriously cool tech. Lidar, our car dyke secrets are finally coming to light

Lidar for our listeners who aren’t familiar, it’s like giving archaeologist X-ray vision, right? Seeing beneath the surface without even lifting a shovel.

You got it. And that’s where Robert John Langdon’s work comes in his Car Dyke Atlas uses lidar to paint a whole new picture of this ancient waterway.

Okay. I’m hooked. We’ve got cutting edge technology and a fresh perspective on what we thought we knew. Let’s dive in.

Let’s start with the biggest bombshell car Dyke’s actual length. We used to think it was around 85 miles long. Not too shabby, right?

Impressive for sure.

Hold on to your hats, because LiDAR revealed it’s actually a whopping 103 miles long.

Well, that’s longer than any other known dyke in Britain. Talk about a game changer.

Yeah,

Suddenly we’re not talking about a local project. This suggests a level of planning and coordination that makes you rethink everything.

And that’s just the beginning. Remember those assumptions about car dyke being Roman? Well, LiDAR revealed something interesting. Instead of those ruler straight lines. The Romans loved some sections. Let’s just say they get a little. Wiggly. Not exactly the precision engineering we associate with Rome.

So not just longer, but potentially much older. This is where things get really interesting.

These wiggly sections, what makes them so special?

They often line up perfectly with ancient shorelines and natural springs. Features you wouldn’t know about without Lidar’s ability to see underground. It suggests construction happened when the Fens were a much wetter, wilder place.

So instead of battling the landscape like the Romans might have, these early builders worked with nature using their knowledge of water flow and natural springs to their advantage. Talk about ingenuity. It really highlights their adaptability and deep understanding of the environment.

It’s like comparing two completely different engineering philosophies, reflecting not just changing needs, but how technology evolved over thousands of years.

Absolutely. And that contrast is crystal clear when you look at Langdon’s maps, the early sections hugging the high ground, ensuring that natural flow from the springs,

And then the later Roman sections just slicing straight through.

It’s like they said, we’re the Romans, we build in straight lines.

But what’s amazing is how those early sections might have worked, just like modern canals, but without using locks, they relied on those natural gradients and carefully chosen routes to manage the flow of water.

Now that’s some clever engineering. Speaking of which, how did LiDAR help uncover these subtle differences in construction?

Imagine looking at an aerial photo of a dense forest. You see trees, right? But not what’s below. LiDAR strips away that canopy. It revealed subtle changes in elevation and vegetation that hinted at these different construction phases.

So it’s like they left us a hidden message written in the very landscape itself, and we finally have the tools to decipher it.

We’ve got this massive waterway, potentially pre-Roman, showing a deep understanding of water management. This can’t just be about irrigation, right? What was its purpose?

That’s the million dollar question. And it forces us to rethink our assumptions about life in prehistoric Britain. If these early sections of Car Dyke really do predate the Romans,

Which the lidar suggests they do.

Exactly. Then we’re talking about a society far more advanced and interconnected than we ever imagined.

This wasn’t just a weekend project. It was a mammoth undertaking requiring incredible coordination and collaboration, and that just wasn’t thought possible for people of that era.

It really flips the script on how we view them, doesn’t it? They weren’t just surviving, they were thriving. And Car Dyke, that just might be the key to understanding how.

############################ (Car Dyke – ABC News PodCast)

Car Dyke - ABC News PodCast
(Car Dyke – ABC News PodCast)

We’re back. Deep divers. Did you catch your breath yet? After that last revelation?

Honestly, I’m still wrapping my head around it. It really makes you wonder what else we’ve missed when it comes to our ancient ancestors.

Right? And get this, the plot thickens. It turns out Car Dyke might challenge one of our biggest assumptions about ancient dykes in general.

Okay. I’m listening. What assumption are we shattering today?

Well, we usually think of these huge ditches as, you know, defensive barriers. Like drawing a line in the sand. You stay over there. We’ll stay over here.

Yeah, like a giant keep out sign. But Car Dyke doesn’t quite fit that mould, does it?

Not one bit. This network, especially with those older sections connecting to lost shorelines. And get this paleo channels, they’re basically ancient dried up riverbeds. Points to something way more interesting.

So instead of walls, we’re talking about prehistoric highways. Like a way to actually connect with other settlements.

Bingo. Think about it. Moving goods, sharing ideas, all made possible by an intricate network of waterways. Long before the Romans ever marched in with their straight roads, the Britons were cruising along these waterways. And speaking of moving things,

You’re thinking about Stonehenge, aren’t you?

Busted. But seriously, those massive stones, Avebury, all of that moving them has always been a logistical head scratcher. Could Car Dyke hold the answer?

It’s a mind blowing thought, isn’t it? Imagine, instead of back breakingly dragging those stones over land, they were floating them along this intricate waterway system. So much more efficient and less disruptive. Picture a flotilla of prehistoric boats navigating these channels, those iconic stones on board not just cargo, but symbols of shared beliefs, maybe even religious ideas. It’s a completely different picture of prehistoric Britain, isn’t it?

Completely. It makes you realise how much we may have underestimated them. But okay, before we get too carried away, let’s bring it back to the data. Langdon doesn’t just stop it, at Lidar. He goes full on detective, analysing the objects found along car dyke. What he find.

This is where the statistical analysis comes in. Langdon looked at how likely it was to find such a large cluster of artefacts from specific eras. The Mesolithic, Neolithic and Bronze Age all along the Dyke.

Don’t keep us in suspense.

Let’s just say the results were, statistically speaking, through the roof. Way too many artifacts to be some happy coincidence.

So not just a few random things people dropped, but evidence of something much bigger going on.

Precisely. It strongly indicates that stretches of car dyke were hives of activity long before the Romans showed up.

Okay, so now we have this picture. A huge ancient network of waterways possibly used for trade transportation. Who knows what else. Then enter the Romans, Masters of engineering and straight lines. What did they make of this already existing infrastructure?

That’s the fascinating part. As ingenious as the Romans were, they were also incredibly practical. They saw the brilliance in those wiggly, meandering waterways, how they follow the natural lay of the land. And they rolled with it.

So a bit of where the Romans, we do things our way, but also a touch of, hmm, these prehistoric folks were on to something.

Exactly. They incorporated the preexisting knowledge into their own plans. You can actually see this in Car Dyke today. Some sections are those laser street Roman roads bear hair waterways, while others wiggle and wind following those ancient, more organic roots.

Talk about a fusion of styles. It speaks to Roman ingenuity, but also a respect for the people who came before. But this begs the question why were the Romans so drawn to Car Dyke  in the first place? Was it just strategic, or was there more to it? Langdon suggests this waterway may have been a key factor in the economy back then. Could we go as far as to call it a prehistoric economic engine?

##############################(Car Dyke – ABC News PodCast)

(Car Dyke - ABC News PodCast)

So we’re back. Last we left off, we were trying to wrap our heads around car dyke being this, well, prehistoric economic powerhouse, a bit of a bold statement that you think maybe, but think about it. What are the key ingredients for a thriving economy? You need resources, sure, but also the means to move them around, to connect, to exchange. Not just goods, but ideas. And that’s where car dyke comes in.

So it wasn’t just about moving stuff from point A to point B, but actually creating a system for growth and innovation.

Exactly. Car Dyke wasn’t just a ditch. It was an artery, a network of waterways breathing life into these settlements that might have otherwise been isolated. Imagine the possibilities. Suddenly you have specialized skills. Trade routes, a breeding ground for new ideas. All thanks to this intricate water system.

Okay, I’m starting to see the bigger picture, but what evidence did Langdon find that really supports this prehistoric Silicon Valley theory?

Well, he points to the clusters of specific artifacts found along car dyke tools, pottery, remnants of early metalworking, all concentrated in ways that suggest something beyond just your average everyday life.

More like specialized workshops, right? Taking advantage of the waterway, both to get their raw materials and then ship out whatever they created.

Precisely. And it makes you look at those wiggly sections, those seemingly less efficient paths in a whole new light.

They weren’t just following the terrain, they were strategically connecting these hubs of activity.

Exactly. Plus, we can’t forget the sheer scale of this thing. Building and maintaining 103 mile waterway, even with prehistoric tools, would have taken massive coordination and organization.

We’re talking next level project management, leadership, planning, resource allocation. It boggles the mind, not to mention the exchange of knowledge that must have happened along the way.

Right? Think about all those different groups coming together, each with their own skills and knowledge. That kind of collaboration, that cross-pollination of ideas, it’s the perfect recipe for innovation.

So not just an economic engine, but a melting pot of ideas and innovation. It’s amazing to think that this simple ditch might hold the key to understanding how complex societies developed in prehistoric Britain.

It really makes you wonder what else is still out there, hidden just beneath the surface, waiting for us to uncover it,

And to think all it took was a fresh perspective, a healthy dose of curiosity, and of course, the magic of Lidar.

Who knows what other mysteries are waiting to be revealed

To all you deep divers tuning in. If this exploration of Car Dyke has taught us anything, it’s that history is full of surprises. So keep questioning, keep exploring. And who knows, maybe you’ll make the next big discovery. Until next time, happy digging.

Car Dyke the eBook with be available from www,prehistoric-britain.co.uk website from 1st November 2024 price £4.95.

(Car Dyke – ABC News PodCast)

Further Reading

For information about British Prehistory, visit www.prehistoric-britain.co.uk for the most extensive archaeology blogs and investigations collection, including modern LiDAR reports.  This site also includes extracts and articles from the Robert John Langdon Trilogy about Britain in the Prehistoric period, including titles such as The Stonehenge Enigma, Dawn of the Lost Civilisation and the ultimate proof of Post Glacial Flooding and the landscape we see today.

Robert John Langdon has also created a YouTube web channel with over 100 investigations and video documentaries to support his classic trilogy (Prehistoric Britain). He has also released a collection of strange coincidences that he calls ‘13 Things that Don’t Make Sense in History’ and his recent discovery of a lost Stone Avenue at Avebury in Wiltshire called ‘Silbury Avenue – the Lost Stone Avenue’.

Langdon has also produced a series of ‘shorts’, which are extracts from his main body of books:

The Ancient Mariners

Stonehenge Built 8300 BCE

Old Sarum

Prehistoric Rivers

Dykes ditches and Earthworks

Echoes of Atlantis

Homo Superior

Other Blogs

s

t

Mathematics Meets Archaeology: Discovering the Mesolithic Origins of Car Dyke

Introduction

In archaeology, theories about ancient structures and sites have traditionally been shaped by subjective interpretations, often constrained by the limited evidence.  The lack of precise data, historical bias, and conflicting narratives have left the field somewhat speculative.  However, recent advancements in mathematical modelling have introduced new ways to derive data-driven conclusions.  We can dig deeper into the ancient past by applying Bayesian and Spatial Analysis, extracting valuable insights with greater certainty.  One particularly compelling case study is the re-evaluation of Car Dyke, a linear earthwork historically associated with Roman engineering.  Through these combined mathematical approaches, we have uncovered evidence that suggests Car Dyke may have been constructed much earlier than previously thought, potentially dating back to the Mesolithic period. (Mathematics Meets Archaeology: Discovering the Mesolithic Origins of Car Dyke)

Bayesian Analysis

Bayesian analysis, a statistical method for updating the probability of a hypothesis as new evidence is introduced, has become a powerful tool in archaeology.  Rather than concluding solely on static data, Bayesian analysis allows researchers to adjust their assumptions and probabilities as more evidence becomes available.  For example, when archaeologists find artefacts from a particular period, Bayesian analysis helps calculate the likelihood that the site was occupied or used during that time.  This method is precious for refining timelines and revising outdated interpretations, as it constantly evolves based on the influx of new data.  In archaeology, it has traditionally been applied to analyse when sites were in use rather than when they were constructed.

 (Mathematics Meets Archaeology: Discovering the Mesolithic Origins of Car Dyke)

However, focusing solely on the usage of a site can leave gaps in understanding its origins.  This is where Spatial Analysis comes into play.  Spatial Analysis examines the geographic distribution of artefacts and features, revealing patterns that might indicate when and how the site was built.  By analysing the concentration of artefacts across a landscape, Spatial Analysis can help pinpoint periods of significant activity and uncover the construction date of ancient structures.  When combined with Bayesian analysis, this approach offers a more comprehensive understanding of a site’s construction and use, leading to data-driven and contextually rich conclusions. (Mathematics Meets Archaeology: Discovering the Mesolithic Origins of Car Dyke)

Car Dyke

Car Dyke is an ideal case study for demonstrating the power of this dual approach.  The Dyke stretches across Lincolnshire and Cambridgeshire, and for years, it has been a topic of debate among archaeologists.  Traditionally, scholars have attributed its construction to Roman engineering, primarily due to the presence of Roman artefacts in the broader region.  However, our research applied Bayesian and Spatial Analysis to challenge this assumption.  By focusing on the distribution of artefacts found specifically along the Dyke, we uncovered evidence suggesting that its origins might be much older, potentially tracing back to the Mesolithic or Neolithic periods.

 (Mathematics Meets Archaeology: Discovering the Mesolithic Origins of Car Dyke)

We began our investigation by applying Bayesian analysis to calculate the likelihood of different periods being associated with the construction of Car Dyke.  This required gathering data on all artefacts found across Lincolnshire and using it to calculate the prior probabilities for each period.  Given the abundance of Roman artefacts in the region, our initial Bayesian model favoured a Roman construction date.  However, as we incorporated new evidence from the area surrounding Car Dyke, a different pattern began to emerge.  Spatial Analysis revealed that a significant number of Mesolithic and Neolithic artefacts were clustered in proximity to the Dyke, suggesting that it might have been constructed much earlier than previously believed. (Mathematics Meets Archaeology: Discovering the Mesolithic Origins of Car Dyke)

Spatial Analysis

Spatial Analysis allowed us to go beyond the surface-level examination of artefacts.  By mapping the geographic distribution of Mesolithic and Neolithic finds, we could see that these early artefacts were concentrated in key areas along Car Dyke, particularly where it intersects with ancient landscapes like river valleys and elevated terrain.  This pattern indicated that the Dyke was more than just a Roman infrastructure project—it may have been a significant site for earlier peoples as well.  The concentration of Mesolithic artefacts along the Dyke strongly suggests that the site was either constructed or heavily used during that period.

(Mathematics Meets Archaeology: Discovering the Mesolithic Origins of Car Dyke)

The integration of Bayesian and Spatial Analysis was essential in refining our understanding of Car Dyke’s history.  While Bayesian analysis initially supported the Roman origin theory due to the larger body of Roman artefacts across Lincolnshire, the localised data revealed by Spatial Analysis shifted the probabilities significantly.  This combination of methods allowed us to challenge the traditional narrative and propose a new hypothesis: Car Dyke may have been constructed during the Mesolithic period and later used or modified by the Romans.  This shift in focus—from usage to construction—helped us uncover a deeper history of the site that would not have been apparent through Bayesian analysis alone. (Mathematics Meets Archaeology: Discovering the Mesolithic Origins of Car Dyke)

Data-Driven Methos of Identification

This dual approach also highlights a broader shift in archaeology toward more data-driven methods.  Traditionally, archaeology has relied on subjective interpretations, with researchers filling in the gaps when evidence was sparse.  While this has yielded valuable insights, it has also introduced biases and inconsistencies.  By incorporating mathematical models like Bayesian and Spatial Analysis, we reduce the subjectivity inherent in archaeological interpretation and increase the accuracy of our conclusions.  These methods offer a more transparent and repeatable framework for analysing archaeological data, allowing researchers to refine their hypotheses as new evidence is discovered.

The benefits of this approach extend beyond just Car Dyke.  By applying Spatial Analysis alongside Bayesian calculations, archaeologists can uncover hidden patterns that might go unnoticed.  For example, Spatial Analysis considers the broader context of artefacts within the landscape, revealing relationships between artefact concentrations and natural features such as rivers, hills, and valleys.  This level of analysis helps archaeologists understand not just when a site was used but also why it was built in a specific location.  In the case of Car Dyke, Spatial Analysis allowed us to see that the site’s significance extended far beyond the Roman period, providing a more complete picture of its history and purpose.

Our Revaluation of Car Dyke

The re-evaluation of Car Dyke’s construction date demonstrates the power of combining Bayesian and Spatial Analysis in archaeology.  Bayesian analysis is invaluable for updating our understanding of site usage, but Spatial Analysis provides critical insights into ancient structures’ construction and broader significance.  These methods allow archaeologists to move beyond speculation and embrace a more scientific approach to uncovering the past.  Integrating mathematics into archaeology marks a crucial step forward, helping researchers develop more accurate and evidence-based conclusions.

(Mathematics Meets Archaeology: Discovering the Mesolithic Origins of Car Dyke)
Car Dyke North Section – (Mathematics Meets Archaeology: Discovering the Mesolithic Origins of Car Dyke)

As we refine these techniques and apply them to other sites, the potential for discoveries grows exponentially.  The case of Car Dyke is just one example of how mathematical analysis can reshape our understanding of ancient history.  By embracing data-driven methods like Bayesian and Spatial Analysis, archaeology is evolving into a discipline that is less reliant on conjecture and more focused on scientific rigour.  The future of archaeology lies in this marriage of mathematics and empirical evidence.  As we continue to push the boundaries of what we know, we can expect to uncover even more of history’s mysteries with confidence and clarity.

Conclusion

The combination of Bayesian and Spatial Analysis has revolutionised our understanding of Car Dyke’s construction date, suggesting that it may have been built during the Mesolithic period rather than the Roman era.  This new approach has reduced the subjectivity in archaeological interpretation and allowed us to develop more accurate, data-driven conclusions.  As these mathematical models continue to be refined and applied to other archaeological sites, they will undoubtedly pave the way for even more significant discoveries and a deeper understanding of our ancient past.

The calculations

Bayesian Analysis

To calculate the prior probabilities for each period based on the total number of finds in Lincoln, we first calculate the total number of finds across all periods:

Step 1: Total Number of Finds

Total Finds=13,723(Roman)+8,994(Medieval)+5,619(Post Medieval)+1,680(Early Medieval)+2,451(Iron Age)+2,091(Neolithic)+634(Mesolithic)+980(Bronze Age)=36,172\text{Total Finds} = 13,723 (\text{Roman}) + 8,994 (\text{Medieval}) + 5,619 (\text{Post Medieval}) + 1,680 (\text{Early Medieval}) + 2,451 (\text{Iron Age}) + 2,091 (\text{Neolithic}) + 634 (\text{Mesolithic}) + 980 (\text{Bronze Age}) = 36,172Total Finds=13,723(Roman)+8,994(Medieval)+5,619(Post Medieval)+1,680(Early Medieval)+2,451(Iron Age)+2,091(Neolithic)+634(Mesolithic)+980(Bronze Age)=36,172

Step 2: Calculate Prior Probabilities

Divide the number of finds for each period by the total number of finds:

P(Roman)=13,72336,172≈0.3794P(\text{Roman}) = \frac{13,723}{36,172} \approx 0.3794P(Roman)=36,17213,723​≈0.3794 P(Medieval)=8,99436,172≈0.2487P(\text{Medieval}) = \frac{8,994}{36,172} \approx 0.2487P(Medieval)=36,1728,994​≈0.2487 P(Post Medieval)=5,61936,172≈0.1554P(\text{Post Medieval}) = \frac{5,619}{36,172} \approx 0.1554P(Post Medieval)=36,1725,619​≈0.1554 P(Early Medieval)=1,68036,172≈0.0465P(\text{Early Medieval}) = \frac{1,680}{36,172} \approx 0.0465P(Early Medieval)=36,1721,680​≈0.0465 P(Iron Age)=2,45136,172≈0.0678P(\text{Iron Age}) = \frac{2,451}{36,172} \approx 0.0678P(Iron Age)=36,1722,451​≈0.0678 P(Neolithic)=2,09136,172≈0.0578P(\text{Neolithic}) = \frac{2,091}{36,172} \approx 0.0578P(Neolithic)=36,1722,091​≈0.0578 P(Mesolithic)=63436,172≈0.0175P(\text{Mesolithic}) = \frac{634}{36,172} \approx 0.0175P(Mesolithic)=36,172634​≈0.0175 P(Bronze Age)=98036,172≈0.0271P(\text{Bronze Age}) = \frac{980}{36,172} \approx 0.0271P(Bronze Age)=36,172980​≈0.0271

Summary of Prior Probabilities:

  • Roman: 0.3794
  • Medieval: 0.2487
  • Post Medieval: 0.1554
  • Early Medieval: 0.0465
  • Iron Age: 0.0678
  • Neolithic: 0.0578
  • Mesolithic: 0.0175
  • Bronze Age: 0.0271

Step 1: Define Prior Probabilities

Using the prior probabilities:

  • Roman: P(HRoman)=0.3794P(H_{\text{Roman}}) = 0.3794P(HRoman​)=0.3794
  • Bronze Age: P(HBronze Age)=0.0271P(H_{\text{Bronze Age}}) = 0.0271P(HBronze Age​)=0.0271
  • Neolithic/Mesolithic: P(HNeolithic/Mesolithic)=0.0753P(H_{\text{Neolithic/Mesolithic}}) = 0.0753P(HNeolithic/Mesolithic​)=0.0753

Step 2: Evidence Likelihoods Based on Local Data

Given the distribution of finds:

  • Roman: P(ERoman∣HRoman)=24132≈0.1818P(E_{\text{Roman}}|H_{\text{Roman}}) = \frac{24}{132} \approx 0.1818P(ERoman​∣HRoman​)=13224​≈0.1818
  • Bronze Age: P(EBronze Age∣HBronze Age)=47132≈0.3561P(E_{\text{Bronze Age}}|H_{\text{Bronze Age}}) = \frac{47}{132} \approx 0.3561P(EBronze Age​∣HBronze Age​)=13247​≈0.3561
  • Neolithic/Mesolithic: P(ENeolithic/Mesolithic∣HNeolithic/Mesolithic)=61132≈0.4621P(E_{\text{Neolithic/Mesolithic}}|H_{\text{Neolithic/Mesolithic}}) = \frac{61}{132} \approx 0.4621P(ENeolithic/Mesolithic​∣HNeolithic/Mesolithic​)=13261​≈0.4621

Step 3: Apply Bayes’ Theorem

Posterior Probability for Roman:

P(HRoman∣E)=0.1818×0.3794P(E)=0.0689P(E)P(H_{\text{Roman}}|E) = \frac{0.1818 \times 0.3794}{P(E)} = \frac{0.0689}{P(E)}P(HRoman​∣E)=P(E)0.1818×0.3794​=P(E)0.0689​

Posterior Probability for Bronze Age:

P(HBronze Age∣E)=0.3561×0.0271P(E)=0.0097P(E)P(H_{\text{Bronze Age}}|E) = \frac{0.3561 \times 0.0271}{P(E)} = \frac{0.0097}{P(E)}P(HBronze Age​∣E)=P(E)0.3561×0.0271​=P(E)0.0097​

Posterior Probability for Neolithic/Mesolithic:

P(HNeolithic/Mesolithic∣E)=0.4621×0.0753P(E)=0.0348P(E)P(H_{\text{Neolithic/Mesolithic}}|E) = \frac{0.4621 \times 0.0753}{P(E)} = \frac{0.0348}{P(E)}P(HNeolithic/Mesolithic​∣E)=P(E)0.4621×0.0753​=P(E)0.0348​

Step 4: Normalise the Posterior Probabilities

Sum of the calculated values for normalisation:

P(E)=0.0689+0.0097+0.0348≈0.1134P(E) = 0.0689 + 0.0097 + 0.0348 \approx 0.1134P(E)=0.0689+0.0097+0.0348≈0.1134

Now, calculate the normalised posterior probabilities:

  • Roman:

P(HRoman∣E)=0.06890.1134≈0.6074P(H_{\text{Roman}}|E) = \frac{0.0689}{0.1134} \approx 0.6074P(HRoman​∣E)=0.11340.0689​≈0.6074

  • Bronze Age:

P(HBronze Age∣E)=0.00970.1134≈0.0855P(H_{\text{Bronze Age}}|E) = \frac{0.0097}{0.1134} \approx 0.0855P(HBronze Age​∣E)=0.11340.0097​≈0.0855

  • Neolithic/Mesolithic:

P(HNeolithic/Mesolithic∣E)=0.03480.1134≈0.3069P(H_{\text{Neolithic/Mesolithic}}|E) = \frac{0.0348}{0.1134} \approx 0.3069P(HNeolithic/Mesolithic​∣E)=0.11340.0348​≈0.3069

Analysis and Interpretation:

  • Neolithic/Mesolithic: The higher frequency of finds in this period significantly increases its posterior probability to approximately 30.69%, which is quite substantial.
  • Roman: Despite having fewer finds in this area, the Roman period still has a high posterior probability due to its higher prior, but it is now only about 60.74%.
  • Bronze Age: The probability for the Bronze Age period remains lower at approximately 8.55%.

Conclusion:

The calculated probabilities show a more balanced view, with the Roman period still favoured but with a much stronger case for the Mesolithic/Neolithic period.  This suggests that while Roman use of the Dyke is still likely, the Mesolithic/Neolithic period also holds significant importance, potentially indicating earlier use or occupation before the Romans.

Langdon Mathematics

While Bayesian theory often yields definitive results, its accuracy can be compromised due to its dependence on subjective prior assumptions, which may only sometimes reflect reality.  If these priors are not well-chosen or are based on incomplete or biased information, the resulting analysis might be misleading.

Therefore, relying solely on Bayesian methods without considering the variability and complexity of archaeological data could lead to conclusions that only partially capture the nuances of the actual distribution of artefacts.  My method, which focuses on Spatial Analysis and empirical data, addresses these limitations.

My approach to calculating finds would differ significantly.  First, I would define the area where artefacts could be discovered—using Lincolnshire as a reference due to its comprehensive archaeological data.  By doing so, we can estimate the expected number of artefacts per square meter of Lincolnshire land, offering a more objective and spatially grounded method for understanding artefact distribution.

As IA reports:

To calculate the percentage likelihood of finding an artefact from each period in a single square meter of Lincolnshire, we can follow these steps:

Step 1: Determine the Area of Lincolnshire

  • Area of Lincolnshire: Approximately 6,959 square kilometres (6,959,000,000 square meters).

Step 2: Calculate the Find Density

For each period, calculate the density of finds per square meter by dividing the total number of finds by the area of Lincolnshire.

Step 3: Calculate the Likelihood for Each Period

  1. Roman:

Likelihood: 0.000156%

  • Neolithic:


Likelihood: 0.000011%

  • Mesolithic:

Likelihood: 0.000004%

  • Bronze Age:

Likelihood: 0.000003%

Summary of Likelihoods in order of expectation:

  • Roman: 0.000156%
  • Medieval: 0.000129%
  • Post Medieval: 0.000081%
  • Early Medieval: 0.000024%
  • Iron Age: 0.000021%
  • Neolithic: 0.000011%
  • Mesolithic: 0.000004%
  • Bronze Age: 0.000003%

These percentages represent the likelihood of finding an artefact from each period in a square meter of Lincolnshire.  Given the extensive activity during that time, the highest is for the Roman period, just marginally ahead of the Medieval period.

We now need to look at the search area (63 miles of the Northern End of Car Dyke) as listing on the LiDAR maps in the previous section of the book.  We must first calculate the total search area in square metres, count the number of finding within this area, and then compare against the expected number.

Summary of Expected Finds:

  • Roman: 15.83 artefacts
  • Medieval: 13.07 artefacts
  • Post Medieval: 8.19 artefacts
  • Early Medieval: 2.44 artefacts
  • Iron Age: 2.17 artefacts
  • Neolithic: 1.07 artefacts
  • Unknown: 0.59 artefacts
  • Modern: 0.50 artefacts
  • Mesolithic: 0.36 artefacts
  • Bronze Age: 0.34 artefacts

Summary of Items Found:

  • Mesolithic/Neolithic: 61 finds
  • Bronze Age: 47 finds
  • Roman: 24 finds

Calculate the Odds of This Kind of Find

For each period, the odds ratio of finding this many artefacts compared to the expected finds:

Step 4: Interpret the Results

  • Mesolithic/Neolithic: A massive 5589.72% increase and an odds ratio of 57.01 suggest significant activity during this period, far beyond what was expected.
  • Bronze Age: An even higher increase of 13723.53% and an odds ratio of 138.24 indicate the area was very important during the Bronze Age.
  • Roman: A modest 51.60% increase with an odds ratio of 1.52 suggests Roman activity, but not as dominant as the earlier periods.

Conclusion

The very high percentage increases and odds ratios for the Mesolithic/Neolithic and Bronze Age periods strongly suggest that the Car Dyke area was occupied and actively used during these times, with significant archaeological activity that exceeds what would be expected based on general Lincolnshire data.  While still represented, the Roman period is less prominent in this area compared to the earlier periods.

This confirms other Dyke surveys such as Offa’s and Wansdyke that also show design (wibbly-wobbly) in construction attributed to the builders seeking natural springs rather than a direct line of route to maintain water levels which were achieved at a later date in history by locks.

Further Reading

For information about British Prehistory, visit www.prehistoric-britain.co.uk for the most extensive archaeology blogs and investigations collection, including modern LiDAR reports.  This site also includes extracts and articles from the Robert John Langdon Trilogy about Britain in the Prehistoric period, including titles such as The Stonehenge Enigma, Dawn of the Lost Civilisation and the ultimate proof of Post Glacial Flooding and the landscape we see today.

Robert John Langdon has also created a YouTube web channel with over 100 investigations and video documentaries to support his classic trilogy (Prehistoric Britain). He has also released a collection of strange coincidences that he calls ‘13 Things that Don’t Make Sense in History’ and his recent discovery of a lost Stone Avenue at Avebury in Wiltshire called ‘Silbury Avenue – the Lost Stone Avenue’.

Langdon has also produced a series of ‘shorts’, which are extracts from his main body of books:

The Ancient Mariners

Stonehenge Built 8300 BCE

Old Sarum

Prehistoric Rivers

Dykes ditches and Earthworks

Echoes of Atlantis

Homo Superior

Other Blogs

s

t

Car Dyke – North Section

This is a primary report of the first LiDAR mapping of Car Dyke in Lincolnshire

Introduction

Car Dyke is one of the most enigmatic and intriguing remnants of Roman engineering in Britain.  Stretching across the Fens of Eastern England, this ancient waterway has puzzled historians, archaeologists, and enthusiasts for centuries.  Theories about its purpose and origin are as varied as they are compelling, reflecting the complexities of interpreting ancient structures without definitive historical records.  This introduction aims to present a comprehensive overview of Car Dyke, encompassing both past and current theories regarding its use and origin.

Car Dyke: A Brief Description

Car Dyke runs for approximately 85 miles (137 kilometres) from Waterbeach in Cambridgeshire to the River Witham near Lincoln.  Its construction is attributed to the Roman period, specifically around the 1st or 2nd century AD.  The Dyke consists of a broad, shallow ditch with accompanying banks, a typical feature of Roman civil engineering, yet its exact function remains a matter of debate.

Early Theories: Navigational and Defensive Purposes

The earliest theories about Car Dyke’s purpose centred around its potential use as a navigational canal.  Some scholars suggested that the Romans constructed it to facilitate the movement of goods and troops across the Fenlands, which were notoriously difficult to traverse due to their marshy nature.  This theory aligns with the Romans’ known prowess in building canals and other hydraulic structures throughout their empire.

Another prevalent early theory posited that Car Dyke served a defensive purpose.  Given the strategic importance of controlling the Fenlands, it was speculated that the Dyke might have been part of a broader military defence network.  The presence of Roman forts and settlements along its route lends some credence to this idea, suggesting that the Dyke could have been a boundary or a means to control movement through the region.

(Car Dyke - North Section)

Our Research

We have now sucessfully mapped the northern section of Car Dyke and located all the findings from periods from Mesolithic Period to modern times. Our objective is to discover or confirm the construction date of the Dyke and its function.

(Car Dyke - North Section)
Fens

The first aspect of the maps show that Car Dyke ‘hugs’ the raised shorelines of the Fen Area. This is in contrast to the modern and some Roman drainage ditches.

(Car Dyke - North Section)
Car Dyke – Profile

Locks and Water Management

One of the most striking anomalies observed in the Car Dyke is the varying elevation profile along its course. Contrary to what might be expected from a Roman engineering project, the dyke does not maintain a flat or consistent gradient. In fact, in some sections, the elevation fluctuates by as much as 4 meters (14 feet) without the apparent use of locks to regulate water flow.

This irregularity raises intriguing questions about the design and function of the Car Dyke. Historically, Greek engineers were pioneers in using canal locks, employing them to manage water levels in the Ancient Suez Canal as early as the 3rd century BC. Similarly, under Emperor Trajan, the Romans utilised sluice gates to control water flow at the entrance to the Red Sea, extending the canal south to what is now Cairo to improve water inflow.

The possibility that the Romans might have used ancient pound locks to manage height differences in canals has been proposed by several scholars. These locks would have allowed for regulating water levels and bridging elevation gaps, much like modern lock systems. However, the absence of clear archaeological evidence for such structures in the Car Dyke—or elsewhere in Roman Britain—leaves this hypothesis unresolved.

Given the significant elevation changes along the Car Dyke, the lack of any visible lock mechanisms suggests alternative explanations must be considered. It’s possible that natural springs or other water sources were strategically utilised to maintain water levels or that the dyke served a different purpose altogether, one that did not require precise water level management.

The question of whether ancient pound locks were used in the Car Dyke remains one of the many mysteries surrounding this ancient structure. Without concrete archaeological evidence, the debate is likely to continue. However, the abnormal elevation profile is a critical factor that must be addressed in any comprehensive analysis of the Car Dyke’s construction and function. As we delve deeper into the investigation, understanding how these variations in height were managed will be crucial to unravelling the true nature of this enigmatic alleged Roman legacy.

(Car Dyke - North Section)
Wibbly-Wobbly pathway is not of Roman design

Dyke Design

In examining the northern section of the Car Dyke, we observe two markedly different design patterns, each suggesting a distinct approach to engineering. The first pattern, characterised by a “wibbly-wobbly” alignment, closely follows the contours of higher land formations and hugs the shoreline. In contrast, the second design, which traverses the low-lying marshlands (indicated in blue), features the straight, linear precision typically associated with Roman engineering.

This stark contrast in design raises the possibility of looking at two different techniques, potentially indicative of two separate historical periods and civilisations at work. The “wibbly-wobbly” design, with its organic, meandering course, suggests a construction that prioritised the natural landscape, possibly indicating a pre-Roman origin. This approach aligns with a more ancient engineering practice, where the path of the dyke would have been dictated by the topography and the need to follow natural water sources or higher ground to avoid flooding.

The more uniform and linear sections of the dyke, on the other hand, are characteristic of Roman engineering. The Romans emphasised straight lines and efficient, purposeful design, often cutting across landscapes with little regard for natural obstacles. This technique is evident in their roads, aqueducts, and canals, where functionality and directness were paramount.

Given these observations, it is logical to hypothesise that the Car Dyke in its “wibbly-wobbly” form may have been an earlier construction, later adapted or reused by the Romans. This scenario suggests a continuum of engineering efforts, where the Romans recognised the utility of an existing structure and modified or extended it according to their own methods and needs.

Roman Roads and car dyke
Car Dyke and Roman Roads that are Straight

This theory of two distinct periods of construction is supported by the duality in the dyke’s design: the original, meandering path possibly built by an earlier civilisation and the later, more systematic Roman modifications. The reuse of earlier infrastructure by the Romans was not uncommon; they often incorporated and improved upon existing works, blending local traditions with their engineering principles.

While this hypothesis offers a compelling narrative, it remains speculative without further archaeological evidence. The precise dating of the different sections and the identification of specific construction techniques and materials will be crucial in confirming whether the “wibbly-wobbly” sections indeed predate the Roman modifications.

If this interpretation holds, it would provide valuable insights into the history of the region, illustrating a timeline where the Car Dyke evolved from a local engineering solution to a component of the expansive Roman infrastructure network. This layered history would highlight the Romans’ pragmatic approach to utilising existing resources and underscore the continuity and adaptation of engineering practices across different civilisations in Britain.

In conclusion, the northern section of the Car Dyke, with its dual design characteristics, likely reflects two distinct historical phases. The “wibbly-wobbly” sections suggest an earlier, possibly pre-Roman origin, later integrated into the Roman landscape through their characteristic straight-line construction. This scenario offers a fascinating glimpse into the interaction between different cultures and the evolution of engineering practices over time. Further research and excavation will be essential to validate this theory and fully understand the complex history of the Car Dyke.

The Maths and Proof of Concept

End of The Northern Section

This is the end of the Northern section and the Lincolnshire database. It allows us to examine the number of artefacts found and the probability that they were in use during this period. This probability is calculated by understanding the frequency of finds on Average over the entire county.  Consequently, this is the collective number of artefacts found in Lincolnshire:

To calculate the prior probabilities for each period based on the total number of finds in Lincoln, we first calculate the total number of finds across all periods:

Step 1: Total Number of Finds

Total Finds=13,723(Roman)+8,994(Medieval)+5,619(Post Medieval)+1,680(Early Medieval)+2,451(Iron Age)+2,091(Neolithic)+634(Mesolithic)+980(Bronze Age)=36,172\text{Total Finds} = 13,723 (\text{Roman}) + 8,994 (\text{Medieval}) + 5,619 (\text{Post Medieval}) + 1,680 (\text{Early Medieval}) + 2,451 (\text{Iron Age}) + 2,091 (\text{Neolithic}) + 634 (\text{Mesolithic}) + 980 (\text{Bronze Age}) = 36,172Total Finds=13,723(Roman)+8,994(Medieval)+5,619(Post Medieval)+1,680(Early Medieval)+2,451(Iron Age)+2,091(Neolithic)+634(Mesolithic)+980(Bronze Age)=36,172

Step 2: Calculate Prior Probabilities

Divide the number of finds for each period by the total number of finds:

P(Roman)=13,72336,172≈0.3794P(\text{Roman}) = \frac{13,723}{36,172} \approx 0.3794P(Roman)=36,17213,723​≈0.3794 P(Medieval)=8,99436,172≈0.2487P(\text{Medieval}) = \frac{8,994}{36,172} \approx 0.2487P(Medieval)=36,1728,994​≈0.2487 P(Post Medieval)=5,61936,172≈0.1554P(\text{Post Medieval}) = \frac{5,619}{36,172} \approx 0.1554P(Post Medieval)=36,1725,619​≈0.1554 P(Early Medieval)=1,68036,172≈0.0465P(\text{Early Medieval}) = \frac{1,680}{36,172} \approx 0.0465P(Early Medieval)=36,1721,680​≈0.0465 P(Iron Age)=2,45136,172≈0.0678P(\text{Iron Age}) = \frac{2,451}{36,172} \approx 0.0678P(Iron Age)=36,1722,451​≈0.0678 P(Neolithic)=2,09136,172≈0.0578P(\text{Neolithic}) = \frac{2,091}{36,172} \approx 0.0578P(Neolithic)=36,1722,091​≈0.0578 P(Mesolithic)=63436,172≈0.0175P(\text{Mesolithic}) = \frac{634}{36,172} \approx 0.0175P(Mesolithic)=36,172634​≈0.0175 P(Bronze Age)=98036,172≈0.0271P(\text{Bronze Age}) = \frac{980}{36,172} \approx 0.0271P(Bronze Age)=36,172980​≈0.0271

Summary of Prior Probabilities:

  • Roman: 0.3794
  • Medieval: 0.2487
  • Post Medieval: 0.1554
  • Early Medieval: 0.0465
  • Iron Age: 0.0678
  • Neolithic: 0.0578
  • Mesolithic: 0.0175
  • Bronze Age: 0.0271

Step 1: Define Prior Probabilities

Using the prior probabilities:

  • Roman: P(HRoman)=0.3794P(H_{\text{Roman}}) = 0.3794P(HRoman​)=0.3794
  • Bronze Age: P(HBronze Age)=0.0271P(H_{\text{Bronze Age}}) = 0.0271P(HBronze Age​)=0.0271
  • Neolithic/Mesolithic: P(HNeolithic/Mesolithic)=0.0753P(H_{\text{Neolithic/Mesolithic}}) = 0.0753P(HNeolithic/Mesolithic​)=0.0753

Step 2: Evidence Likelihoods Based on Local Data

Given the distribution of finds:

  • Roman: P(ERoman∣HRoman)=24132≈0.1818P(E_{\text{Roman}}|H_{\text{Roman}}) = \frac{24}{132} \approx 0.1818P(ERoman​∣HRoman​)=13224​≈0.1818
  • Bronze Age: P(EBronze Age∣HBronze Age)=47132≈0.3561P(E_{\text{Bronze Age}}|H_{\text{Bronze Age}}) = \frac{47}{132} \approx 0.3561P(EBronze Age​∣HBronze Age​)=13247​≈0.3561
  • Neolithic/Mesolithic: P(ENeolithic/Mesolithic∣HNeolithic/Mesolithic)=61132≈0.4621P(E_{\text{Neolithic/Mesolithic}}|H_{\text{Neolithic/Mesolithic}}) = \frac{61}{132} \approx 0.4621P(ENeolithic/Mesolithic​∣HNeolithic/Mesolithic​)=13261​≈0.4621

Step 3: Apply Bayes’ Theorem

Posterior Probability for Roman:

P(HRoman∣E)=0.1818×0.3794P(E)=0.0689P(E)P(H_{\text{Roman}}|E) = \frac{0.1818 \times 0.3794}{P(E)} = \frac{0.0689}{P(E)}P(HRoman​∣E)=P(E)0.1818×0.3794​=P(E)0.0689​

Posterior Probability for Bronze Age:

P(HBronze Age∣E)=0.3561×0.0271P(E)=0.0097P(E)P(H_{\text{Bronze Age}}|E) = \frac{0.3561 \times 0.0271}{P(E)} = \frac{0.0097}{P(E)}P(HBronze Age​∣E)=P(E)0.3561×0.0271​=P(E)0.0097​

Posterior Probability for Neolithic/Mesolithic:

P(HNeolithic/Mesolithic∣E)=0.4621×0.0753P(E)=0.0348P(E)P(H_{\text{Neolithic/Mesolithic}}|E) = \frac{0.4621 \times 0.0753}{P(E)} = \frac{0.0348}{P(E)}P(HNeolithic/Mesolithic​∣E)=P(E)0.4621×0.0753​=P(E)0.0348​

Step 4: Normalize the Posterior Probabilities

Sum of the calculated values for normalisation:

P(E)=0.0689+0.0097+0.0348≈0.1134P(E) = 0.0689 + 0.0097 + 0.0348 \approx 0.1134P(E)=0.0689+0.0097+0.0348≈0.1134

Now, calculate the normalised posterior probabilities:

  • Roman:

P(HRoman∣E)=0.06890.1134≈0.6074P(H_{\text{Roman}}|E) = \frac{0.0689}{0.1134} \approx 0.6074P(HRoman​∣E)=0.11340.0689​≈0.6074

  • Bronze Age:

P(HBronze Age∣E)=0.00970.1134≈0.0855P(H_{\text{Bronze Age}}|E) = \frac{0.0097}{0.1134} \approx 0.0855P(HBronze Age​∣E)=0.11340.0097​≈0.0855

  • Neolithic/Mesolithic:

P(HNeolithic/Mesolithic∣E)=0.03480.1134≈0.3069P(H_{\text{Neolithic/Mesolithic}}|E) = \frac{0.0348}{0.1134} \approx 0.3069P(HNeolithic/Mesolithic​∣E)=0.11340.0348​≈0.3069

Analysis and Interpretation:

  • Neolithic/Mesolithic: The higher frequency of finds in this period significantly increases its posterior probability to approximately 30.69%, which is quite substantial.
  • Roman: Despite having fewer finds in this area, the Roman period still has a high posterior probability due to its higher prior, but it is now only about 60.74%.
  • Bronze Age: The probability for the Bronze Age period remains lower at approximately 8.55%.

Conclusion:

The calculated probabilities show a more balanced view, with the Roman period still favoured but with a much stronger case for the Mesolithic/Neolithic period. This suggests that while Roman use of the Dyke is still likely, the Mesolithic/Neolithic period also holds significant importance, potentially indicating earlier use or occupation before the Romans.

Langdon Mathematics

While Bayesian theory often yields definitive results, its accuracy can be compromised due to its dependence on subjective prior assumptions, which may only sometimes reflect reality. If these priors are not well-chosen or are based on incomplete or biased information, the resulting analysis might be misleading.

Therefore, relying solely on Bayesian methods without considering the variability and complexity of archaeological data could lead to conclusions that only partially capture the nuances of the actual distribution of artefacts. My method, which focuses on spatial analysis and empirical data, addresses these limitations.

My approach to calculating finds would differ significantly. First, I would define the area where artefacts could be discovered—using Lincolnshire as a reference due to its comprehensive archaeological data. By doing so, we can estimate the expected number of artefacts per square meter of Lincolnshire land, offering a more objective and spatially grounded method for understanding artefact distribution.

As IA reports:

To calculate the percentage likelihood of finding an artefact from each period in a single square meter of Lincolnshire, we can follow these steps:

Step 1: Determine the Area of Lincolnshire

  • Area of Lincolnshire: Approximately 6,959 square kilometres (6,959,000,000 square meters).

Step 2: Calculate the Find Density

For each period, calculate the density of finds per square meter by dividing the total number of finds by the area of Lincolnshire.

Step 3: Calculate the Likelihood for Each Period

  1. Roman:

Likelihood: 0.000156%

  • Neolithic:

Likelihood: 0.000011%

  • Mesolithic:

Likelihood: 0.000004%

  • Bronze Age:

Likelihood: 0.000003%

Summary of Likelihoods in order of expectation:

  • Roman: 0.000156%
  • Medieval: 0.000129%
  • Post Medieval: 0.000081%
  • Early Medieval: 0.000024%
  • Iron Age: 0.000021%
  • Neolithic: 0.000011%
  • Mesolithic: 0.000004%
  • Bronze Age: 0.000003%

These percentages represent the likelihood of finding an artefact from each period in a square meter of Lincolnshire. Given the extensive activity during that time, the highest is for the Roman period, just marginally ahead of the Medieval period.

We now need to look at the search area (63 miles of the Northern End of Car Dyke) as listing on the LiDAR maps in the previous section of the book.  We must first calculate the total search area in square metres, count the number of finding within this area, and then compare against the expected number.

Summary of Expected Finds:

  • Roman: 15.83 artefacts
  • Medieval: 13.07 artefacts
  • Post Medieval: 8.19 artefacts
  • Early Medieval: 2.44 artefacts
  • Iron Age: 2.17 artefacts
  • Neolithic: 1.07 artefacts
  • Unknown: 0.59 artefacts
  • Modern: 0.50 artefacts
  • Mesolithic: 0.36 artefacts
  • Bronze Age: 0.34 artefacts

Summary of Items Found:

  • Mesolithic/Neolithic: 61 finds
  • Bronze Age: 47 finds
  • Roman: 24 finds

Calculate the Odds of This Kind of Find

For each period, the odds ratio of finding this many artefacts compared to the expected finds:

Step 4: Interpret the Results

  • Mesolithic/Neolithic: A massive 5589.72% increase and an odds ratio of 57.01 suggest significant activity during this period, far beyond what was expected.
  • Bronze Age: An even higher increase of 13723.53% and an odds ratio of 138.24 indicate the area was very important during the Bronze Age.
  • Roman: A modest 51.60% increase with an odds ratio of 1.52 suggests Roman activity, but not as dominant as the earlier periods.

Conclusion

The very high percentage increases and odds ratios for the Mesolithic/Neolithic and Bronze Age periods strongly suggest that the Car Dyke area was occupied and actively used during these times, with significant archaeological activity that exceeds what would be expected based on general Lincolnshire data. While still represented, the Roman period is less prominent in this area compared to the earlier periods.

This confirms other Dyke surveys such as Offa’s and Wansdyke that also show design (wibbly-wobbly) in construction attributed to the builders seeking natural springs rather than a direct line of route to maintain water levels which were achieved at a later date in history by locks.

Further Reading

For information about British Prehistory, visit www.prehistoric-britain.co.uk for the most extensive archaeology blogs and investigations collection, including modern LiDAR reports.  This site also includes extracts and articles from the Robert John Langdon Trilogy about Britain in the Prehistoric period, including titles such as The Stonehenge Enigma, Dawn of the Lost Civilisation and the ultimate proof of Post Glacial Flooding and the landscape we see today.

Robert John Langdon has also created a YouTube web channel with over 100 investigations and video documentaries to support his classic trilogy (Prehistoric Britain). He has also released a collection of strange coincidences that he calls ‘13 Things that Don’t Make Sense in History’ and his recent discovery of a lost Stone Avenue at Avebury in Wiltshire called ‘Silbury Avenue – the Lost Stone Avenue’.

Langdon has also produced a series of ‘shorts’, which are extracts from his main body of books:

The Ancient Mariners

Stonehenge Built 8300 BCE

Old Sarum

Prehistoric Rivers

Dykes ditches and Earthworks

Echoes of Atlantis

Homo Superior

Other Blogs

s

t

Mysteries of the Oldest Boatyard Uncovered

I’ve always been fascinated by how archaeological discoveries can unravel threads of history. Still, they can also become entangled in webs of misinterpretation and incorrect dating, leading to significant findings being dismissed or misunderstood. A case in point occurred in a Welsh housing estate where ancient slipways were initially mistaken for longhouses. This confusion sparked a question: why would such elaborate structures be necessary for something as simple as a lightweight dugout canoe? (Mysteries of the Oldest Boatyard Uncovered)

Mysteries of the Oldest Boatyard Uncovered

This kind of oversight distorts our understanding and suggests that the site might harbour deeper, unexplored layers of history, possibly concealing more about our past than we currently understand. These errors serve as stark reminders of the necessity to maintain a critical perspective in archaeology. It underscores the importance of constantly questioning and reevaluating our findings with new information and methodologies. History isn’t just about discovering artifacts; it’s equally about interpreting them correctly and openly, and crucially, acknowledging when our initial theories might need revision. This constant potential for new discoveries should keep us all intrigued and engaged in the field of archaeology.

Mysteries of the Oldest Boatyard Uncovered
Three Channels of a Catamaran

A prime example is the site dubbed ‘The Oldest Boat Yard in the World’ in Wales. Archaeologists believed they had uncovered a boatyard dating back nearly 4,000 years, considered the world’s first prehistoric boat-building site. The discovery halted construction for six months as archaeologists unearthed what appeared to be channels shaped like the bottom of wooden canoes, interpreted as evidence that boats were built on the site. This interpretation, however, soon came under scrutiny.(Mysteries of the Oldest Boatyard Uncovered)

Mysteries of the Oldest Boatyard Uncovered
How the Catamarn would look

The dating of this boatyard presents a paradox. The original report suggested it was adjacent to an ‘ice glacier lake’—a theory based on the contours of local OS maps. Unfortunately, this scenario is flawed, as neither LiDAR maps, which show the landscape in more detailed relief, nor BGS maps, which display the area’s superficial gravel, supported this. These professional mapping resources confirm that it was not a lake but a river that the slipway linked into. If the BGS map was observed then the fact it had alluvium as a superfical soil whould prove that it was river not a lake as suggested.

This suggests (considering the rivers of the past were more extensive than today’s) that the slipway was much older than the original carbon dates suggested, likely dating back to the Mesolithic period around 8,000 BCE when the bluestones were transported to Stonehenge Phase 1. This makes more sense of the craft’s design, further illustrating that the ‘Oldest Boat Yard’ was making not just boats but catamarans, a significant engineering feat not recognised in the Western world until the 16th century. Yet, here it was, millennia before and miles from where similar technology was known to exist. (Mysteries of the Oldest Boatyard Uncovered)

Mysteries of the Oldest Boatyard Uncovered
Wood found in the ‘lake’ was from a crannog

These historical inaccuracies and the rush to conclusions that can bury the truth under layers of misinterpretation underline the necessity for a more thorough, unbiased research approach. It’s about accurately preserving and understanding our history, not just unearthing it. This scenario emphasises the ongoing struggle within archaeology to balance development, conservation, and the accurate interpretation of our past.

It shows that our true history might be lying underneath, waiting to be correctly interpreted and understood. We must approach archaeological findings with open-minded curiosity and rigour, ensuring that our interpretations do justice to the actual significance of these discoveries. Archaeologists and academics are often fixated on creating a narrative of linear progression, attempting to date artefacts by technology. This system fails, as shown by the ‘Oldest Boat Yard in the World,’ having a slipway for a catamaran which, according to this linear theory, should not have existed for another 6,000 years. This highlights that our understanding of history should be reconsidered and that evolution runs less in linear paths but more as a sine wave with peaks and troughs of invention and civilisation. This emphasis on questioning established narratives should empower and encourage us to challenge the status quo in our understanding of history. (Mysteries of the Oldest Boatyard Uncovered)

Mysteries of the Oldest Boatyard Uncovered
The site is on the edge of a large Mesolithic Waterway

An analogy can be drawn with other inventions, such as housing throughout history. According to academics, we first lived in caves, a claim that is quite impossible given the insufficient number of known cave dwellings compared to the estimated population in Stone Age Britain. Then, we supposedly all lived in round mud huts, like some African tribal dwellings. This, too, is highly questionable, as insufficient huts have been found, and evidence suggests these might have been animal pens since only a tiny number have hearths. These may also be misidentifications of other features, such as crannogs, which would have the same footprint but are made for a wet, flooded environment. Additionally, excavations at Star Carr, dated 12,000 years ago, show that woodworking skills to plank wood and use mortice and tenon joints (as seen at Stonehenge) were available. This begs the question of whether skilled workmen would live in mud huts with soiled flooring rather than using their skills to create wooden houses for greater comfort and lifestyle. This suggests a need to reevaluate how we interpret such findings, as our ancestors might have been more technologically advanced and lived differently than traditionally portrayed.

This critique calls for a rethinking of specific archaeological missteps and urges a broader reconsideration of how we understand the progression of human technology and society across history. The truth of our past is a complex tapestry that deserves our most diligent and unbiased efforts to be fully understood. As I delve deeper into these historical mysteries, I am continually reminded of the importance of viewing our discoveries through a lens of scepticism and a willingness to challenge established narratives, fostering a more accurate and comprehensive understanding of our shared heritage. This comprehensive understanding should make us all feel more connected and responsible for preserving and interpreting our history accurately. (Mysteries of the Oldest Boatyard Uncovered)

Further Reading

For information about British Prehistory, visit www.prehistoric-britain.co.uk for the most extensive archaeology blogs and investigations collection, including modern LiDAR reports.  This site also includes extracts and articles from the Robert John Langdon Trilogy about Britain in the Prehistoric period, including titles such as The Stonehenge Enigma, Dawn of the Lost Civilisation and the ultimate proof of Post Glacial Flooding and the landscape we see today.

Robert John Langdon has also created a YouTube web channel with over 100 investigations and video documentaries to support his classic trilogy (Prehistoric Britain). He has also released a collection of strange coincidences that he calls ‘13 Things that Don’t Make Sense in History’ and his recent discovery of a lost Stone Avenue at Avebury in Wiltshire called ‘Silbury Avenue – the Lost Stone Avenue’.

Langdon has also produced a series of ‘shorts’, which are extracts from his main body of books:

The Ancient Mariners

Stonehenge Built 8300 BCE

Old Sarum

Prehistoric Rivers

Dykes ditches and Earthworks

Echoes of Atlantis

Homo Superior

Mysteries of the Oldest Boatyard Uncovered

s

t