

Were the Constellations Originally a Navigational System?
A Long-Term Research Project for 2026/7
Introduction
For thousands of years, humanity has looked upward and seen stories written in the stars.
Ancient cultures named constellations after animals, heroes, gods, monsters, hunters and mythical creatures. Archaeologists and historians generally assume these star patterns were primarily symbolic, religious, or mythological in nature. (Sky Maps of Prehistoric Britain)
But there is a major problem.
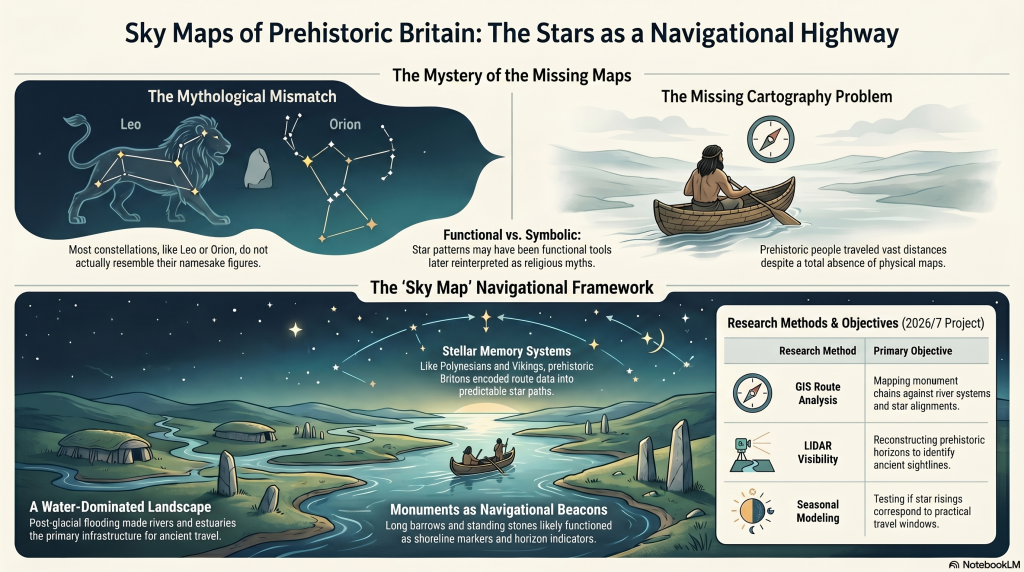
Most constellations do not actually resemble the creatures they supposedly represent.
The Great Bear resembles neither a bear nor a wagon.
Orion does not resemble a hunter.
Leo looks nothing like a lion.
Draco barely resembles a dragon.
In many cases, the supposed shapes appear forced, inconsistent, or entirely dependent on later artistic interpretation.
This raises an important question:
What if the original purpose of many stellar patterns was not mythology at all?
What if they were functional?
More specifically:
What if ancient star systems originally formed part of a navigational framework used by an early maritime civilisation operating across the flooded landscapes of post-glacial Europe?
This article outlines a new long-term research project planned for 2026, investigating whether the stars themselves may once have formed part of an integrated navigational system connected to prehistoric waterways, coastlines, monuments, and seasonal movement.
The purpose of this project is not to make unsupported claims, but to establish whether this idea can be scientifically investigated using measurable evidence.
The Foundation of the Hypothesis
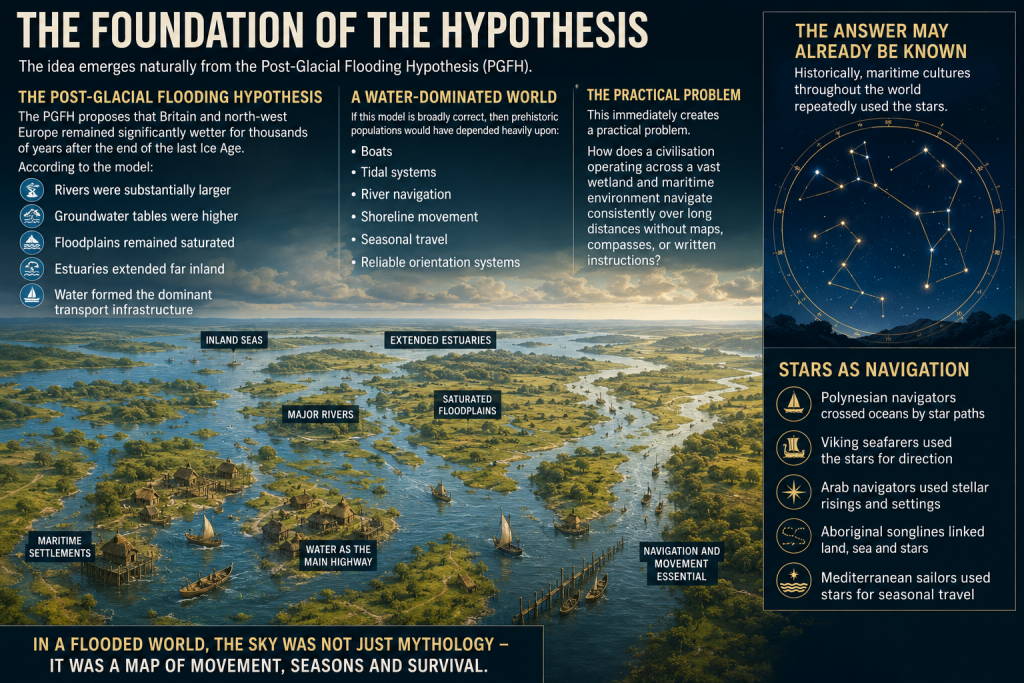
The idea emerges naturally from the Post-Glacial Flooding Hypothesis (PGFH).
The PGFH proposes that Britain and north-west Europe remained significantly wetter for thousands of years after the end of the last Ice Age.
According to the model:
- rivers were substantially larger,
- groundwater tables were higher,
- floodplains remained saturated,
- estuaries extended far inland,
- and water formed the dominant transport infrastructure.
If this model is broadly correct, then prehistoric populations would have depended heavily upon:
- boats,
- tidal systems,
- river navigation,
- shoreline movement,
- seasonal travel,
- and reliable orientation systems.
This immediately creates a practical problem.
How does a civilisation operating across a vast wetland and maritime environment navigate consistently over long distances without maps, compasses, or written instructions?
The answer may already be known.
Historically, maritime cultures throughout the world repeatedly used the stars.
The Stars as Navigation
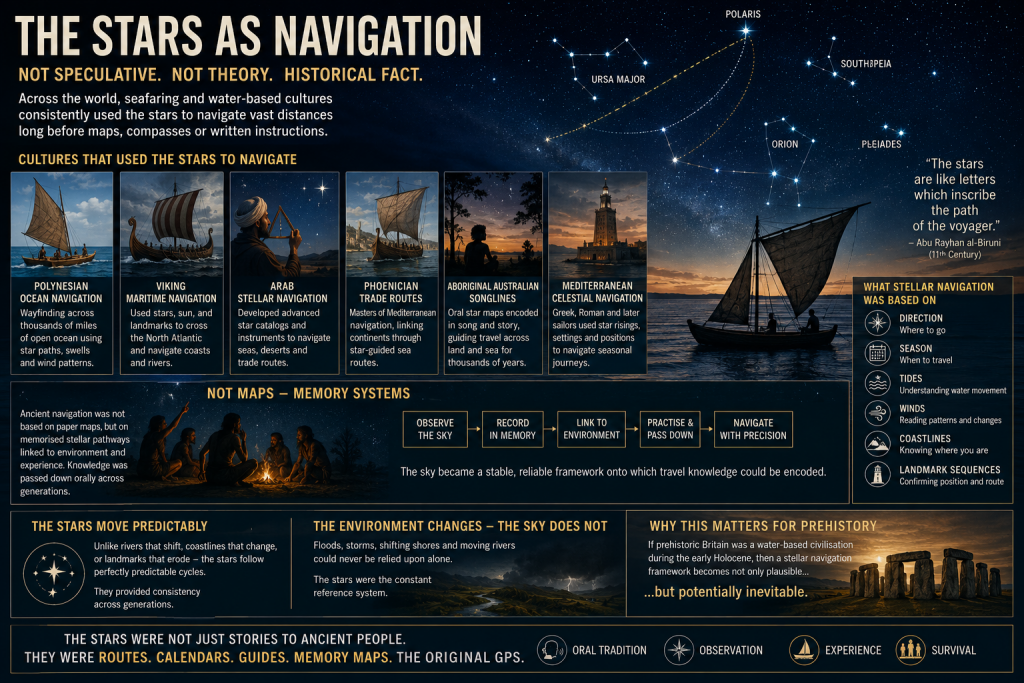
The use of stars for navigation is not speculative.
It is a historical fact.
Examples include:
- Polynesian ocean navigation
- Viking maritime navigation
- Arab stellar navigation
- Phoenician trade routes
- Aboriginal Australian songlines
- Mediterranean celestial navigation
In many cases, navigation was not based on maps in the modern sense, but on memorised stellar pathways tied to:
- direction,
- season,
- tides,
- winds,
- coastlines,
- and landmark sequences.
This is critical.
Ancient navigation often functioned as a memory system.
The sky became a stable framework onto which travel knowledge could be encoded.
Unlike coastlines or rivers, the stars moved predictably.
They provided consistency across generations.
If prehistoric Britain operated as a water-based civilisation during the early Holocene, then a stellar navigation framework becomes not only plausible, but potentially inevitable.
The Missing Maps Problem
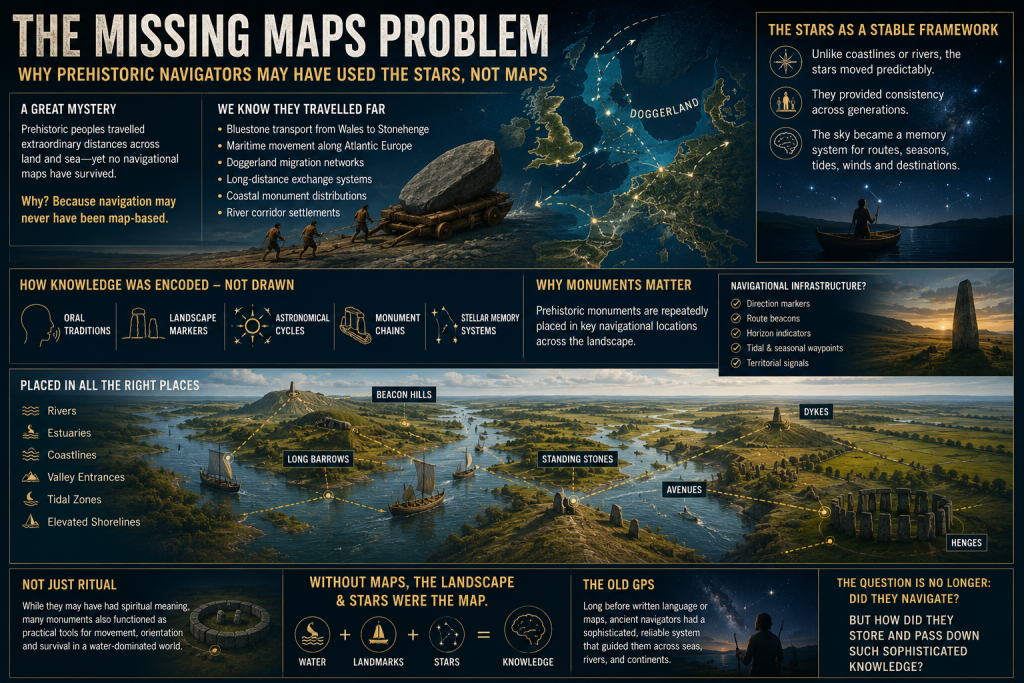
One of the great mysteries of prehistoric maritime movement is the apparent absence of navigational maps.
We know prehistoric populations travelled extraordinary distances.
Examples include:
- Bluestone transport from Wales to Stonehenge
- Maritime movement along Atlantic Europe
- Doggerland migration networks
- Long-distance exchange systems
- Coastal monument distributions
- River corridor settlements
Yet no conventional cartographic systems survive.
This may be because navigation itself was never primarily map-based.
Instead, route knowledge may have been embedded within:
- oral traditions,
- landscape markers,
- astronomical cycles,
- monument chains,
- and stellar memory systems.
This possibility becomes especially interesting when viewed alongside the repeated placement of prehistoric monuments near:
- rivers,
- estuaries,
- coastlines,
- valley entrances,
- tidal zones,
- and elevated shoreline positions.
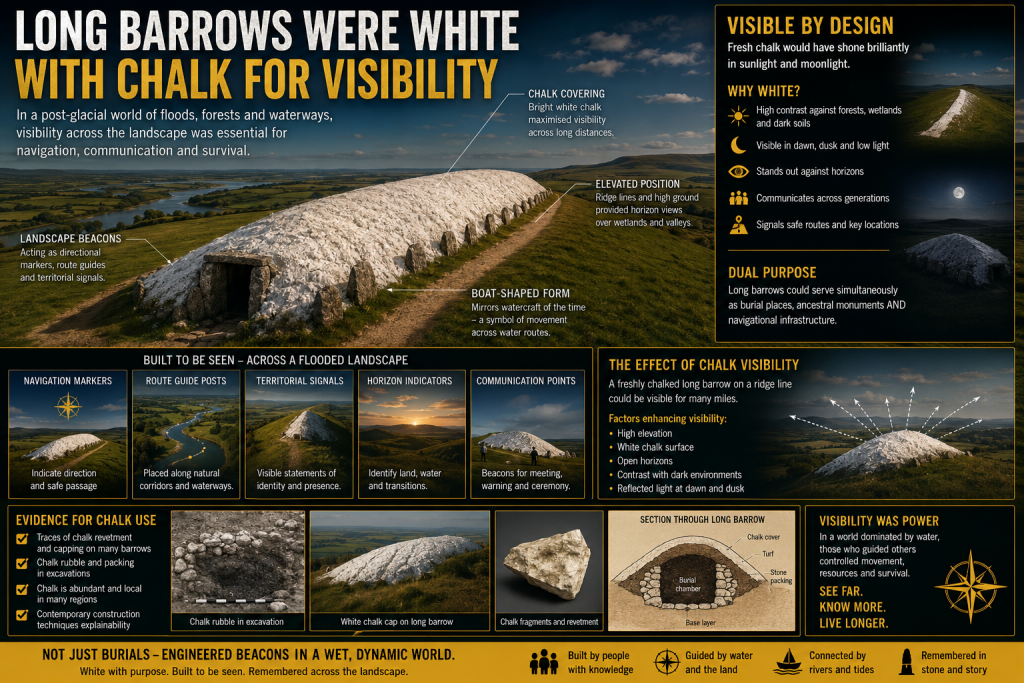
Long barrows, standing stones, beacon hills, avenues, dykes, and henges may not simply represent ritual locations.
Some may have functioned as navigational infrastructure.
Long Barrows and Landscape Markers
One of the most intriguing aspects of prehistoric Britain is the repeated positioning of monuments along visible movement corridors.
Long barrows in particular often occupy:
- ridge lines,
- valley edges,
- coastal approaches,
- elevated viewpoints,
- or route intersections.
Traditionally, these sites are interpreted almost exclusively through ritual or funerary frameworks.
But there is another possibility.
In a landscape dominated by wetlands and waterways, elevated monuments would naturally function as:
- directional markers,
- navigation points,
- horizon indicators,
- territorial signals,
- or route beacons.
This does not exclude symbolic meaning.
The same structure can serve both practical and cultural purposes simultaneously.
Indeed, this dual-function model is common throughout human history.
Church towers, lighthouses, harbour beacons, hill forts, and even modern skyscrapers operate as both symbols and navigational markers.
The same may have applied in prehistory.
Why the Constellations Matter
The more complex question is whether the constellations themselves formed part of this navigational architecture.
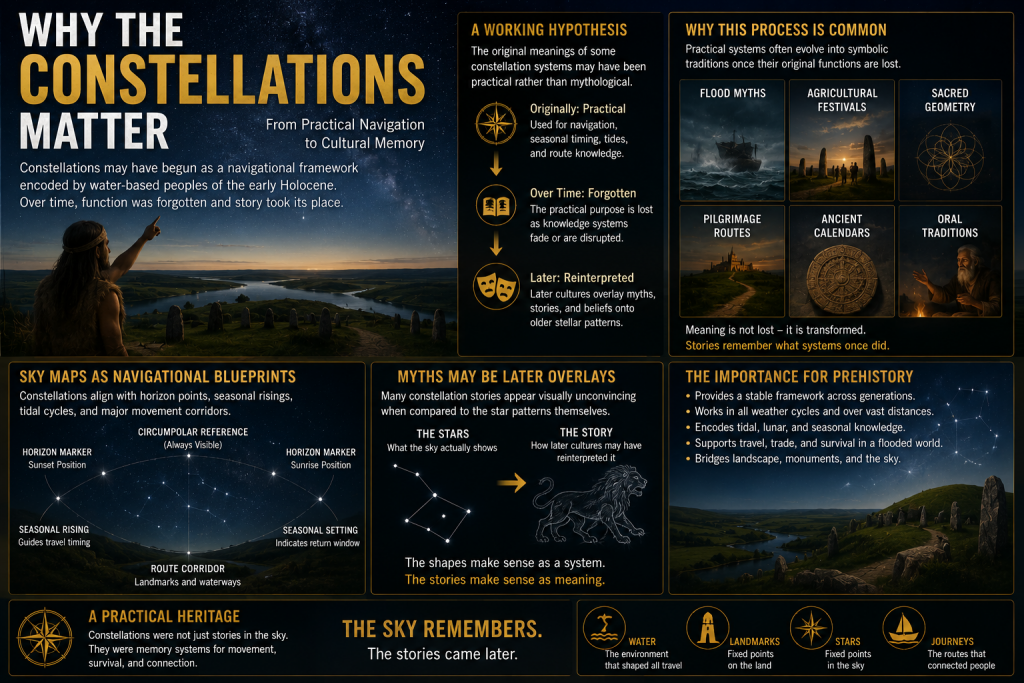
This project proposes a cautious working hypothesis:
The original meanings of some constellation systems may have been practical rather than mythological.
Over time, as the original navigational framework was forgotten, later cultures may have reinterpreted older stellar systems through:
- mythology,
- religion,
- folklore,
- and storytelling.
This process is not unusual.
Throughout history, practical systems often evolve into symbolic traditions once their original functions are lost.
Examples include:
- flood myths,
- agricultural festivals,
- sacred geometry,
- pilgrimage routes,
- and ancient calendrical systems.
The same process may explain why many modern constellation interpretations appear visually unconvincing.
The animals and heroes may represent later narrative overlays applied onto much older orientation frameworks.
Current Evidence Supporting the Idea
At present, there is no direct proof that constellations encoded prehistoric navigation routes.
However, several independent lines of evidence support the broader possibility.
1. Proven Stellar Navigation in Ancient Cultures
The use of stars for navigation is universally documented.
This establishes that:
- stars can encode movement systems,
- oral navigation is possible,
- and complex route memory can operate without maps.
2. Water-Dominated Early Holocene Landscapes
The PGFH and associated geological evidence suggest:
- extensive wetlands,
- enlarged river systems,
- inland tidal environments,
- and maritime dependency.
Such environments strongly favour navigation-based societies.
3. Monument Distribution Along Water Systems
Many prehistoric sites cluster around:
- rivers,
- floodplains,
- estuaries,
- coastal corridors,
- and elevated shoreline terrain.
This pattern is more consistent with movement infrastructure than isolated ritual placement.
4. Horizon Astronomy in Prehistory
Prehistoric societies demonstrably tracked:
- solar cycles,
- lunar cycles,
- solstices,
- equinoxes,
- and horizon alignments.
Once astronomical observation is accepted, the application to navigation becomes entirely plausible.
5. Seasonal Movement Systems
Maritime societies depend upon predictable seasonal timing.
Stars naturally provide:
- seasonal indicators,
- directional consistency,
- and long-distance orientation.
6. Ethnographic Parallels
Multiple indigenous cultures linked:
- landscape movement,
- memory systems,
- navigation,
- and stars.
This provides real-world functional parallels.
What This Project Will Attempt to Test
The 2026 project will focus on measurable and testable questions rather than speculation.
Key research areas include:
GIS Route Analysis
Testing whether:
- monument chains,
- river systems,
- long barrows,
- beacon hills,
- and prehistoric movement corridors
show statistically significant astronomical relationships.
Seasonal Navigation Modelling
Investigating whether:
- key stars,
- heliacal risings,
- lunar cycles,
- or stellar azimuths
correspond to practical travel windows within prehistoric water systems.
Horizon Visibility Studies
Using LiDAR and digital terrain models to reconstruct:
- prehistoric horizons,
- sightlines,
- beacon visibility,
- and navigational marker ranges.
Maritime Route Reconstruction
Reconstructing:
- post-glacial coastlines,
- flooded valleys,
- inland estuaries,
- and navigable river systems.
The aim is to determine whether major monuments occupy logical positions within ancient transport networks.
Statistical Testing
This is essential.
Any proposed alignment or pattern must be tested against random distributions.
Without statistical controls, pattern recognition rapidly becomes subjective.
The project, therefore, intends to:
- establish falsifiable criteria,
- use control datasets,
- compare against random models,
- and avoid arbitrary alignment selection.
What This Project Is NOT Claiming
This research does not claim:
- that every constellation is a map,
- that mythology is irrelevant,
- or that all prehistoric monuments were navigational.
Nor does it claim direct proof already exists.
Instead, the project asks a more careful scientific question:
Could an aquatic civilisation operating across flooded post-glacial landscapes have encoded navigational knowledge into stable stellar frameworks?
At present, the answer appears plausible.
Whether it is correct remains to be tested.
Why This Matters
If even part of this hypothesis proves correct, the implications would be profound.
It would suggest that:
- prehistoric Britain possessed far more advanced navigational systems than traditionally assumed,
- monuments may have functioned as infrastructure as well as symbolism,
- astronomy was practical rather than purely ceremonial,
- and early maritime societies may have operated sophisticated memory-based route systems long before formal cartography.
Most importantly, it would further support the emerging picture of a civilisation shaped not by isolated ritual sites, but by movement, water, navigation, and environmental adaptation.
In short:
The stars may not simply have inspired prehistoric civilisation.
They may have guided it.
Future Research Updates
This article represents the beginning of a long-term research project planned for 2026.
Future work will include:
- GIS modelling
- Hydrological reconstruction
- Stellar simulation analysis
- Monument alignment databases
- Statistical testing
- Maritime route reconstruction
- LiDAR visibility studies
- Ethnographic comparison
Updates will be published through:
Prehistoric Britain
and associated research publications.
Final Thought
Modern civilisation separates:
- astronomy,
- geography,
- navigation,
- religion,
- engineering,
- and landscape.
Prehistoric societies may not have.
For people living in a flooded world of rivers, marshes, estuaries, tides, and coastlines, the sky itself may have functioned as the oldest navigation system humanity ever created.
And perhaps, hidden within the stars, fragments of those ancient water routes still remain.
PODCAST

Author’s Biography

Robert John Langdon, a polymathic luminary, emerges as a writer, historian, and eminent specialist in LiDAR Landscape Archaeology.
His intellectual voyage has been interwoven with stints as an astute scrutineer in government and grand corporate bastions, a tapestry spanning British Telecommunications, Cable and Wireless, British Gas, and the esteemed University of London.
A decade hence, Robert’s transition into retirement unfurled a chapter of insatiable curiosity. This phase saw him immerse himself in Politics, Archaeology, Philosophy, and the enigmatic realm of Quantum Mechanics. His academic odyssey traversed the venerable corridors of knowledge hubs such as the Museum of London, University College London, Birkbeck College, The City Literature Institute, and Chichester University.
In the symphony of his life, Robert is a custodian of three progeny and a pair of cherished grandchildren. His sanctuary lies ensconced in the embrace of West Wales, where he inhabits an isolated cottage, its windows framing a vista of the boundless sea – a retreat from the scrutinising gaze of Her Majesty’s Revenue and Customs, an amiable clandestinity in the lap of nature.
Exploring Prehistoric Britain: A Journey Through Time
My blog delves into the fascinating mysteries of prehistoric Britain, challenging conventional narratives and offering fresh perspectives grounded in cutting-edge research, particularly LiDAR technology. I invite you to explore some key areas of my research. For example, the Wansdyke, often cited as a defensive structure, is re-examined in light of new evidence. I’ve presented my findings in my blog post Wansdyke: A British Frontier Wall – ‘Debunked’, and a Wansdyke LiDAR Flyover video further visualises my conclusions.
My work also often challenges established archaeological dogma. I argue that many sites, such as Hambledon Hill, commonly identified as Iron Age hillforts, are not what they seem. My posts Lidar Investigation Hambledon Hill – NOT an ‘Iron Age Fort’ and Unmasking the “Iron Age Hillfort” Myth explore these ideas in detail and offer an alternative view. Similarly, sites like Cissbury Ring and White Sheet Camp receive re-evaluations based on LiDAR analysis in my posts “Lidar Investigation Cissbury Ring through time” and “Lidar Investigation White Sheet Camp,“ revealing fascinating insights into their true purpose. I have also examined South Cadbury Castle, often linked to the mythical Camelot56.
My research also extends to ancient water management, including the role of canals and other linear earthworks. I have discussed the true origins of Car Dyke in multiple posts, including Car Dyke – ABC News Podcast and Lidar Investigation Car Dyke – North Section, which suggest a Mesolithic origin 2357. I also explore the misidentification of Roman aqueducts, as seen in my posts on the Great Chesters (Roman) Aqueduct. My research has also been greatly informed by my post-glacial flooding hypothesis, which has helped explain landscape transformations over time. I have discussed this hypothesis in several posts, including AI now supports my Post-Glacial Flooding Hypothesis and Exploring Britain’s Flooded Past: A Personal Journey
Finally, my blog also investigates prehistoric burial practices, as seen in Prehistoric Burial Practices of Britain and explores the mystery of Pillow Mounds, often mistaken for medieval rabbit warrens, but with a potential link to Bronze Age cremation in my posts: Pillow Mounds: A Bronze Age Legacy of Cremation? and The Mystery of Pillow Mounds: Are They Really Medieval Rabbit Warrens?. My research also includes astronomical insights into ancient sites, for example, in Rediscovering the Winter Solstice: The Original Winter Festival. I also review new information about the construction of Stonehenge in The Stonehenge Enigma.
Further Reading
For those interested in British Prehistory, visit www.prehistoric-britain.co.uk, a comprehensive resource featuring an extensive collection of archaeology articles, modern LiDAR investigations, and groundbreaking research. The site also includes insights and excerpts from the acclaimed Robert John Langdon Trilogy, a series of books that explore Britain during the Prehistoric period. Titles in the trilogy include The Stonehenge Enigma, Dawn of the Lost Civilisation, and The Post-Glacial Flooding Hypothesis, which offer compelling evidence of ancient landscapes shaped by post-glacial flooding.
To further explore these topics, Robert John Langdon has developed a dedicated YouTube channel featuring over 100 video documentaries and investigations that complement the trilogy. Notable discoveries and studies showcased on the channel include 13 Things that Don’t Make Sense in History and the revelation of Silbury Avenue – The Lost Stone Avenue, a rediscovered prehistoric feature at Avebury, Wiltshire.
In addition to his main works, Langdon has released a series of shorter, accessible publications, ideal for readers delving into specific topics. These include:
- The Ancient Mariners
- Stonehenge Built 8300 BCE
- Old Sarum
- Prehistoric Rivers
- Dykes, Ditches, and Earthworks
- Echoes of Atlantis
- Homo Superior
- 13 Things that Don’t Make Sense in History
- Silbury Avenue – The Lost Stone Avenue
- Offa’s Dyke
- The Stonehenge Enigma
- The Post-Glacial Flooding Hypothesis
- The Stonehenge Hoax
- Dawn of the Lost Civilisation
- Darwin’s Children
- Great Chester’s Roman Aqueduct
- Wansdyke
For active discussions and updates on the trilogy’s findings and recent LiDAR investigations, join our vibrant community on Facebook. Engage with like-minded enthusiasts by leaving a message or contributing to debates in our Facebook Group.
Whether through the books, the website, or interactive videos, we aim to provide a deeper understanding of Britain’s fascinating prehistoric past. We encourage you to explore these resources and uncover the mysteries of ancient landscapes through the lens of modern archaeology.
For more information, including chapter extracts and related publications, visit the Robert John Langdon Author Page. Dive into works such as The Stonehenge Enigma or Dawn of the Lost Civilisation, and explore cutting-edge theories that challenge traditional historical narratives.
Other Blogs
1
a
- AI now Supports – Homo Superior
- AI now supports my Post-Glacial Flooding Hypothesis
- Alexander the Great sailed into India – where no rivers exist today
- Ancient Secrets of Althorp – debunked
- Antler Picks built Ancient Monuments – yet there is no real evidence
- Antonine Wall – Prehistoric Canals (Dykes)
- Archaeological ‘pulp fiction’ – has archaeology turned from science?
- Archaeological Pseudoscience
- Archaeology in the Post-Truth Era
- Archaeology: A Bad Science?
- Archaeology: A Harbour for Fantasists?
- Archaeology: Fact or Fiction?
- Archaeology: The Flaws of Peer Review
- Archaeology’s Bayesian Mistake: Stop Averaging the Past
- Are Raised Beaches Archaeological Pseudoscience?
- Atlantis Found: The Mathematical Proof That Plato’s Lost City Was Doggerland
- ATLANTIS: Discovery with Dan Snow Debunked
- Avebury Ditch – Avebury Phase 2
- Avebury through time
- Avebury’s great mystery revealed
- Avebury’s Lost Stone Avenue – FREE Flipbook
b
- Battlesbury Hill – Wiltshire
- Beyond Stone and Bone: Rethinking the Megalithic Architects of Northern Europe
- BGS Prehistoric River Map
- Blackhenge: Debunking the Media misinterpretation of the Stonehenge Builders
- Brain capacity (Cro-Magnon Man)
- Britain’s First Road – Stonehenge Avenue
- Britain’s Giant Prehistoric Waterways
- British Roman Ports miles away from the coast
c
- Caerfai Promontory Fort – Archaeological Nonsense
- Car Dyke – ABC News PodCast
- Car Dyke – North Section
- Car Dyke Atlas – Prehistoric Canals – FREE Flipbook
- CASE STUDY – An Inconvenient TRUTH (Craig Rhos Y Felin)
- Case Study – River Avon
- Case Study – Woodhenge Reconstruction
- Chapter 2 – Craig Rhos-Y-Felin Debunked
- Chapter 2 – Stonehenge Phase I
- Chapter 2 – Variation of the Species
- Chapter 3 – Post Glacial Sea Levels
- Chapter 3 – Stonehenge Phase II
- Chapter 7 – Britain’s Post-Glacial Flooding
- Cissbury Ring through time
- Clement Reid, Doggerland, and the Archaeological Establishment
- Cro-Magnon Brain Capacity
- Cro-Magnon Megalithic Builders: Measurement, Biology, and the DNA
- Cro-Magnons – An Explainer
d
- Darwin’s Children – Flipbook
- Darwin’s Children – The Cro-Magnons
- Dawn of the Lost Civilisation – FREE Flipbook
- Dawn of the Lost Civilisation – Introduction
- Digging for Britain – Cerne Abbas
- Digging for Britain Debunked – Cerne Abbas 2
- Digging Up Britain’s Past – Debunked
- DLC Chapter 1 – The Ascent of Man
- Durrington Walls – Woodhenge through time
- Durrington Walls Revisited: Platforms, Fish Traps, and a Managed Mesolithic Landscape
- Dyke Construction – Hydrology 101
- Dykes Ditches and Earthworks
- DYKES of Britain
e
f
g
h
- Hadrian’s Wall – Military Way Hoax
- Hadrian’s Wall – the Stanegate Hoax
- Hadrian’s Wall LiDAR investigation
- Hambledon Hill – NOT an ‘Iron Age Fort’
- Hayling Island Lidar Maps
- Hidden Sources of Ancient Dykes: Tracing Underground Groundwater Fractals
- Historic River Avon
- Hollingsbury Camp Brighton – A Hillfort… or a Forgotten Harbour?
- Hollows, Sunken Lanes and Palaeochannels
- Homo Superior – Flipbook
- Homo Superior – History’s Giants
- How Lidar will change Archaeology
- Hydrology 101 Simplified: Why Britain’s Dykes Worked Without Rivers
i
l
m
- Maiden Castle through time
- Mathematics Meets Archaeology: Discovering the Mesolithic Origins of Car Dyke
- Mesolithic River Avon
- Mesolithic Stonehenge
- Minerals found in Prehistoric and Roman Quarries
- Mining in the Prehistoric to Roman Period
- Mount Caburn through time
- Mysteries of the Oldest Boatyard Uncovered
- Mythological Dragons – a non-existent animal that is shared by the World.
o
- Offa’s Dyke – FREE Flipbook
- Old Sarum Lidar Map
- Old Sarum Through Time…………….
- On Sunken Lands of the North Sea – Lived the World’s Greatest Civilisation.
- OSL Chronicles: Questioning Time in the Geological Tale of the Avon Valley
- Oswestry LiDAR Survey
- Oswestry through time
- Oysters in Archaeology: Nature’s Ancient Water Filters?
p
- Pillow Mounds: A Bronze Age Legacy of Cremation?
- Pinkery Canal
- Plato Was Right: The Archaeological Evidence the Academics Never Expected
- Post Glacial Flooding – Flipbook
- Prehistoric Burial Practices of Britain
- Prehistoric Canals – Wansdyke
- Prehistoric Canals – Wansdyke
- Prehistoric Canals (Dykes) – Great Chesters Aqueduct (The Vallum Pt. 4)
- Prehistoric Canals (Dykes) – Hadrian’s Wall Vallum (pt 1)
- Prehistoric Canals (Dykes) – Offa’s Dyke (Chepstow)
- Prehistoric Canals (Dykes) – Offa’s Dyke (LiDAR Survey)
- Prehistoric Canals (Dykes) – Offa’s Dyke Survey (End of Section A)
- Prehistoric Canals (Dykes) – Wansdyke (4)
- Prehistoric Canals Wansdyke 2
- Professor Bonkers and the mad, mad World of Archaeology
r
- Real-World Confirmation of Post-Glacial Flooding
- Rebirth in Stone: Decrypting the Winter Solstice Legacy of Stonehenge
- Rediscovering the Winter Solstice: The Original Winter Festival
- Rethinking Ancient Boundaries: The Vallum and Offa’s Dyke”
- Rethinking Ogham: Could Ireland’s Oldest Script Have Begun as a Tally System?
- Rethinking The Past: Mathematical Proof of Langdon’s Post-Glacial Flooding Hypothesis
- Rising Evidence, Falling Rivers: The Real Story of Europe’s First Farmers
- Rivers of the Past Were Higher: A Fresh Perspective on Prehistoric Hydrology
s
- Sea Level Changes
- Section A – NY26SW
- Section B – NY25NE & NY26SE
- Section C – NY35NW
- Section D – NY35NE
- Section E – NY46SW & NY45NW
- Section F – NY46SE & NY45NE
- Section G – NY56SW
- Section H – NY56NE & NY56SE
- Section I – NY66NW
- Section J – NY66NE
- Section K – NY76NW
- Section L – NY76NE
- Section M – NY87SW & NY86NW
- Section N – NY87SE
- Section O – NY97SW & NY96NW
- Section P – NY96NE
- Section Q – NZ06NW
- Section R – NZ06NE
- Section S – NZ16NW
- Section T – NZ16NE
- Section U – NZ26NW & NZ26SW
- Section V – NZ26NE & NZ26SE
- Silbury Avenue – Avebury’s First Stone Avenue
- Silbury Hill
- Silbury Hill / Sanctuary – Avebury Phase 3
- Sky Maps of Prehistoric Britain
- Somerset Plain – Signs of Post-Glacial Flooding
- South Cadbury Castle – Camelot
- Statonbury Camp near Bath – an example of West Wansdyke
- Stone me – the druids are looking the wrong way on Solstice day
- Stone Transportation and Dumb Censorship
- Stonehenge – Monument to the Dead
- Stonehenge Hoax – Dating the Monument
- Stonehenge Hoax – Round Monument?
- Stonehenge Hoax – Summer Solstice
- Stonehenge LiDAR tour
- Stonehenge Phase 1 – 8300 BCE Documentary
- Stonehenge Phase 1 — Britain’s First Monument
- Stonehenge Phase I (The Stonehenge Landscape)
- Stonehenge Solved – Pythagorean maths put to use 4,000 years before he was born
- Stonehenge Through Time
- Stonehenge, Doggerland and Atlantis connection
- Stonehenge: Borehole Evidence of Post-Glacial Flooding
- Stonehenge: Discovery with Dan Snow Debunked
- Stonehenge: The World’s First Computer – FREE Flipbook
- Stonehenge: The Worlds First Computer
- Stonehenge’s The Lost Circle Revealed – DEBUNKED
t
- Ten Reasons Why Car Dyke Blows Britain’s Earthwork Myths Out of the Water
- Ten Things You Didn’t Know About Britain’s Prehistoric Flooded Past
- Ten thousand year old boats found on Northern Europe’s Hillsides
- Ten thousand-year-old boats found on Northern Europe’s Hillsides
- Testing Plato’s Atlantis Against Reality
- The “Hunter-Gatherer” Myth: Why It’s Time to Bury This Outdated Term
- The Ancient Mariners – Flipbook
- The Ancient Mariners – Prehistoric seafarers of the Mesolithic
- The Ascent of Man — From Survival to Systems
- The Beringian Migration Myth: Why the Peopling of the Americas by Foot is Mathematically and Logistically Impossible
- The Bluestone Enigma
- The Bulford Hoax: The “Simpler, Older Stonehenge” That Wasn’t
- The Cheddar Man Hoax
- The Cro-Magnon Cover-Up: How DNA and PR Labels Erased Our Real Ancestry
- The Dolmen and Long Barrow Connection
- The Durrington Mega-Monument Hoax: What Lies Beneath? – Debunked
- The Durrington Walls Hoax – it’s not a henge?
- The Dyke Myth Collapses: Excavation and Dating Prove Britain’s Great Dykes Are Prehistoric Canals
- The First European Smelted Bronzes
- The Fury of the Past: Natural Disasters in Historical and Prehistoric Britain
- The Giant’s Graves of Cumbria
- The Giants of Prehistory: Cro-Magnon and the Ancient Monuments
- The Great Ancient DNA Illusion: How Statistical Models Became Archaeological “Facts”
- The Great Antler Pick Hoax
- The Great Bell Beaker Migration Myth
- The Great Chichester Hoax – A Bridge too far?
- The Great Dorchester Aqueduct Hoax
- The Great Farming Hoax – (Einkorn Wheat)
- The Great Farming Migration Hoax
- The Great Hadrian’s Wall Hoax
- The Great Iron Age Hill Fort Hoax
- The Great Offa’s Dyke Hoax
- The Great Prehistoric Migration Hoax
- The Great Stone Transportation Hoax
- The Great Stonehenge Hoax
- The Great Wansdyke Hoax
- The Henge and River Relationship
- The Logistical Impossibility of Defending Maiden Castle
- The Long Barrow and Dolmen Enigma
- The Long Barrow Mystery
- The Long Barrow Mystery: Unravelling Ancient Connections
- The Lost Island of Avalon – revealed
- The Maiden Way Hoax – A Closer Look at an Ancient Road’s Hidden History
- The Maths – LGM total ice volume
- The Mystery of Pillow Mounds: Are They Really Medieval Rabbit Warrens?
- THE ODYSSEY PROBLEM: WHY DID A WEEK-LONG VOYAGE BECOME A TEN-YEAR EPIC?
- The Old Sarum Hoax
- The Oldest Boat Yard in the World found in Wales
- The Perils of Paradigm Shifts: Why Unconventional Hypotheses Get Branded as Pseudoscience
- The Post-Glacial Flooding Hypothesis – 1/11
- The Post-Glacial Flooding Hypothesis – FREE Flipbook
- The Post-Glacial Flooding Theory
- The Problem with Hadrian’s Vallum
- The Rise of the Cro-Magnon (Homo Superior)
- The Roman Military Way Hoax
- The Silbury Hill Lighthouse?
- The Stone Money – Credit System
- The Stonehenge Avenue
- The Stonehenge Avenue
- The Stonehenge Code: Unveiling its 10,000-Year-Old Secret
- The Stonehenge Crescent: A Monument to a Lost World
- The Stonehenge Enigma – FREE Flipbook
- The Stonehenge Enigma: Part 1/6
- The Stonehenge Hoax – Bluestone Quarry Site
- The Stonehenge Hoax – FREE Flipbook
- The Stonehenge Hoax – FREE Flipbook
- The Stonehenge Hoax – Moving the Bluestones
- The Stonehenge Hoax – Periglacial Stripes
- The Stonehenge Hoax – Station Stones
- The Stonehenge Hoax – Stonehenge’s Location
- The Stonehenge Hoax – The Ditch
- The Stonehenge Hoax – The Slaughter Stone
- The Stonehenge Hoax – The Stonehenge Layer
- The Stonehenge Hoax – Totem Poles
- The Stonehenge Hoax – Woodhenge
- The Stonehenge Hospital
- The Stonehenge Transportation Mystery
- The Subtropical Britain Hoax
- The Troy, Hyperborea and Atlantis Connection
- The Vallum @ Hadrian’s Wall – it’s Prehistoric!
- The Vallum at Hadrian’s Wall Atlas – FREE Flipbook
- The Woodhenge Hoax
- Three Dykes – Kidland Forest
- Thurnam’s 137 Skulls: The Forgotten People Behind Britain’s Megaliths.
- Top Ten Misidentified Fire Beacons in British History
- Troy Debunked – Troy did not exist in Asia Minor, but in fact, the North Sea island of Doggerland
- TSE – DVD Barrows
- TSE DVD – An Inconvenient Truth
- TSE DVD – Antler Picks
- TSE DVD – Avebury
- TSE DVD – Durrington Walls & Woodhenge
- TSE DVD – Dykes
- TSE DVD – Epilogue
- TSE DVD – Stonehenge Phase I
- TSE DVD – Stonehenge Phase II
- TSE DVD – The Post-Glacial Hypothesis
- TSE DVD Introduction
- TSE DVD Old Sarum
- Twigs, Charcoal, and the Death of the Saxon Dyke Myth
w
- Wansdyke – Short Film
- Wansdyke Atlas – FREE Flipbook
- Wansdyke East – Prehistoric Canals
- Wansdyke LiDAR Flyover
- Wansdyke: A British Frontier Wall – ‘Debunked’
- Was Columbus the first European to reach America?
- What Archaeology Missed Beneath Stonehenge
- White Sheet Camp
- Why a Simple Fence Beats a Massive Dyke (and What That Means for History)
- Windmill Hill – Avebury Phase 1
- Winter Solstice – Science, Propaganda and Indoctrination
- Woodhenge – the World’s First Lighthouse?


