The Fury of the Past: Natural Disasters in Historical and Prehistoric Britain

Introduction

Over recent years, there’s been a growing tendency… to present images of climate in crisis.

Storms tearing through communities…
floods overwhelming towns…
weather described not just as severe… but as something almost theatrical in its intensity.

And alongside these images… comes a familiar language.

We hear about record-breaking rainfall…
unprecedented wind speeds…
and that now well-worn phrase… “since records began.”

It sounds authoritative.
It sounds definitive.
The Fury of the Past: Natural Disasters in Historical and Prehistoric Britain

But it’s worth pausing… just for a moment… to ask a simple question:

What records… exactly… are we talking about?

Because in many cases… those “records” begin surprisingly recently.
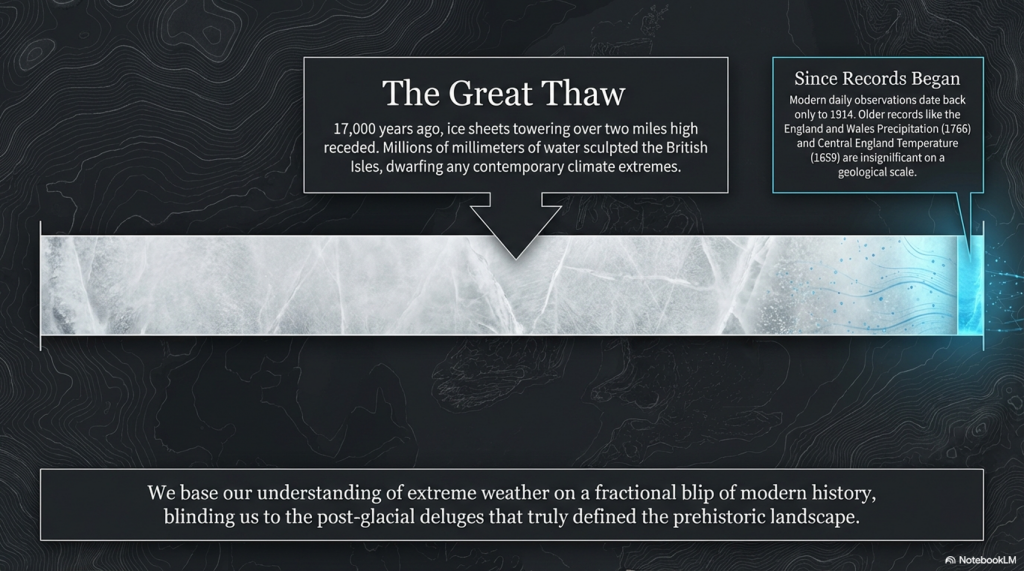
Daily observational data, in its most widely used form, only really starts in the early twentieth century — around 1914.

So when we describe a modern year… like 2023… as extreme or unprecedented… we are often comparing it to just over a century of detailed measurement.

And that… is a very narrow window… in the context of climate.

Because the story doesn’t begin there.

We have the England and Wales Precipitation series… stretching back to 1766.
We have the Central England Temperature record… reaching all the way back to 1659.

These are not trivial datasets.
They are the result of generations of careful observation… often by dedicated amateur meteorologists… people who simply watched the skies… and wrote it down.

Together, they offer something far more valuable than a snapshot.

They offer perspective.

A long, continuous conversation between humanity… and the weather.

And yet… paradoxically… these longer records are often pushed aside.
Quietly ignored… or treated as secondary… in favour of modern datasets that fit more neatly into contemporary narratives.

Which raises an important point.

If we are serious about understanding climate…
about understanding flooding…
about understanding extremes…

Then we cannot afford to work from fragments of the record.

We need the full canvas.

The Fury of the Past: Natural Disasters in Historical and Prehistoric Britain

Because without that depth… without that historical context…
we risk mistaking variability for anomaly…
and short-term patterns for long-term change.

Perhaps this is where a figure like Jacob Bronowski would urge caution.

Not to dismiss modern science… but to place it within the wider human story.

To recognise that knowledge is cumulative…
that understanding comes from continuity… not selectivity…

And that if we truly want to understand the forces shaping our world…
we must listen not just to the present…

…but to the long memory of the past.

Sky News Online:

“England and Wales have seen the wettest summer for 100 years, according to MeteoGroup. Rainfall for June, July and August was 362mm (14.25in), making it the wettest summer since 1912. The average summer rainfall across the UK is 226.9mm (8.9in).  MeteoGroup forecaster Nick Prebble said this summer is set to be the fourth wettest since records began in 1727. The record for the UK’s wettest summer is 1912, when 384.4mm (15.1in) of rain fell.” (The Fury of the Past: Natural Disasters in Historical and Prehistoric Britain)
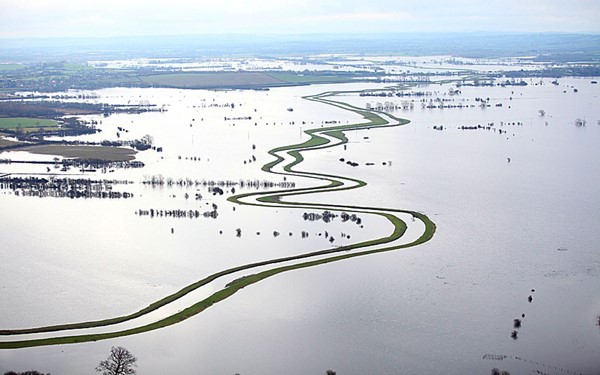
(The Fury of the Past: Natural Disasters in Historical and Prehistoric Britain)
Somerset Flooding – (The Fury of the Past: Natural Disasters in Historical and Prehistoric Britain)

Let us delve into the fabric of the British summer, as narrated by the Met Office, revealing a tapestry less illuminated by the sun’s grace than in years past. A summer, they tell us, that may be recorded in the annals as one of the dullest, with a mere 399 hours of sunshine until the twilight of August, shadowed only by the year 1980’s modest 396 hours. This narrative unfolds in the aftermath of a Bank Holiday painted in the hues of unsettled weather, where rain and flood alerts draped many parts of the UK.

Joanna Robinson, a sage of weather from Sky News, recounts a tale of a season that began with the wettest June recorded, followed by a July that, too, was cradled in wetness. Yet, as the days of summer waned, the weather found a semblance of calm, only to be disturbed once again as August drew to a close. She speaks of the jet stream, that ethereal conveyor of weather, which, in its wanderings, steered storms across the British Isles that might have otherwise passed us by.

The summer of 2007 looms large in recent memory, its rainfall second only to records dating back to 1912, yet August of this summer hints at being the driest and sunniest. Such observations provoke exclamations of dismay and declarations of the grip of climate change on our world. Yet, a closer scrutiny, a peering into the depths of our climatic past, reveals a narrative less singular in its direction. The year 2007, while remarkable for its summer deluge, does not rank among the highest in annual rainfall, settling instead into the seventeenth position over the last century.

Our engagement with the elements, marked by the ebb and flow of rainfall, stretches back over centuries, with periods of intense precipitation, such as the decade spanning 1870 to 1880, punctuating our history. And between the notable years of 2007 and 2012, 2010 emerged as the eleventh-driest, a reminder of the natural oscillations that characterise our climate.

Grote Mandrenke

Turning our gaze to the winds and gales that sculpt our coastlines, history offers us a lens through which to view these forces in a broader context. The ‘Grote Mandrenke’, a tempest from the annals of the fourteenth century, wrought unparalleled devastation, claiming thousands of lives and altering landscapes and architecture. This event, among others, serves as a testament to the dynamic and often turbulent relationship between humanity and the environment.

In this reflection, inspired by the thoughtful considerations, we are invited to contemplate the narratives of weather and climate not as isolated phenomena but as part of a complex interplay of natural forces, historical events, and human experiences. Through this lens, we gain a deeper appreciation for the intricacies of our world and the myriad ways in which the past informs our understanding of the present and the future.
(Extreme weather and Ancient Subterranean shelters)
Grote Mandrenke 1362 – Extreme weather


In the reflective prose, let us explore the further reaches of our historical and environmental saga, where the dance between humanity and nature continues its timeless rhythm. As the great storm of 1362 stretched its wrath into the North Sea, it conspired with the tides to birth a tempestuous offspring—the storm surge. This phenomenon, a marauder of the coasts, reshaped the contours of the European shore, leaving ports from England to Denmark in ruins, and forever altering the dialogue between land and sea.

Yet, this cataclysm, while monumental, is not an isolated whisper in the annals of our planet’s climatic history. It echoes a more ancient, more profound narrative that commenced with the first settlers in the Mesolithic period. These early denizens of the land faced the capricious moods of a world freshly emerged from the clutches of the last Ice Age—a time when the land itself was a protagonist in a story of transformation and survival.

The landscape, a silent historian, bears the scars and tales of these epochal changes. The retreat of the ice sheets some ten thousand years ago unleashed waters that dwarf our contemporary rainfall measurements, inundating the land with a deluge that would reshape its very skeleton. The annual rainfall pales in comparison to the volumes discharged during this great thaw, when millions of millimetres of water sculpted the British Isles into a new form, carving out riverbeds and creating the floodplains we know today.
The Fury of the Past: Natural Disasters in Historical and Prehistoric Britain

British Geological Society

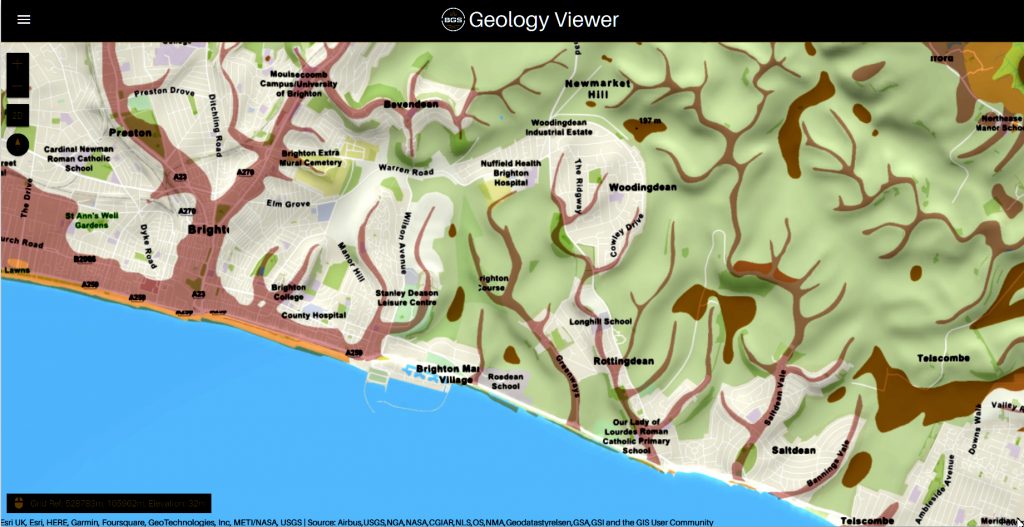
These ancient watercourses, now hidden beneath layers of sediment and time, are revealed to us through the meticulous cartography of the British Geological Society (BGS). Their maps unfurl a tapestry of geological memory, revealing the remnants of vast paleo-river systems that once cradled the waters of the past. The floodplains, marked by their unique sedimentary compositions, are not merely areas prone to contemporary flooding but are the fingerprints of ancient rivers that once dominated the landscape.

Our Mesolithic ancestors, attuned to the rhythm of this waterlogged world, chose the margins of these floodplains for their sacred sites and communal gatherings. Stonehenge, that enigmatic structure, stands as a testament to its profound connection with the land and its waterways. They navigated the flooded realms, moving from isle to isle, their lives intertwined with the ebb and flow of the waters.
The Fury of the Past: Natural Disasters in Historical and Prehistoric Britain

The evidence of these ancient flood plains and their impact on human settlement and activity is etched into the very bedrock of our island. A study of the BGS maps reveals a subterranean network of what were once mighty rivers and channels, especially in areas of chalk bedrock like Stonehenge. These geological whispers invite us to consider how our landscape has been shaped by water’s forceful hand, guiding our ancestors and shaping the course of our collective history.

In this contemplation, inspired by Bronowski’s reverence for the intertwining of science, history, and human endeavour, we are reminded of the enduring legacy of our planet’s natural forces. They beckon us to view our present and future through the lens of the deep past, understanding that the stories of storm surges, flooding, and climate are chapters in a much longer narrative of Earth and humanity.
(Extreme weather and Ancient Subterranean shelters)
Paleochannels – (The Fury of the Past: Natural Disasters in Historical and Prehistoric Britain)

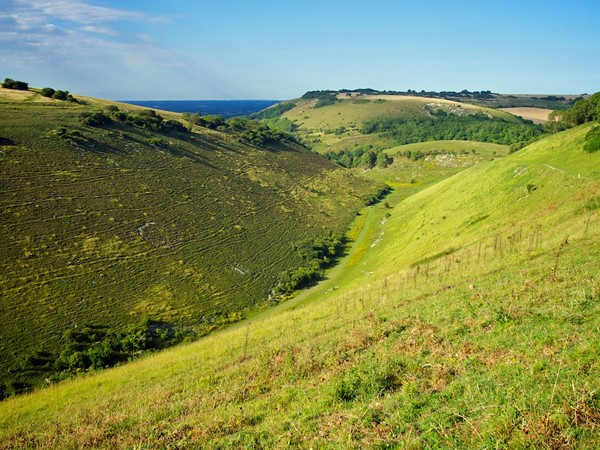
Embarking on a journey of inquiry and reflection, we delve into the enigma of Britain’s dry river valleys. These landscapes, now silent and devoid of flowing waters, serve as a testament to the dynamic and ever-changing canvas of our planet’s geological and climatic history. Known to archaeologists, geologists, and the curious layperson alike as ‘Dry River Valleys,’ these formations beckon us to ponder the forces that sculpted them and the epochs they have witnessed.

Conventional wisdom held that the distinctive contours of these valleys, nestled within the chalk hills, were the handiwork of the Periglacial Phase of the Quaternary Period—a vast expanse of time that began around 2.6 million years ago. Yet the precise moment of their birth remains shrouded in the mists of prehistory, with no concrete evidence to mark their genesis.

Geology, a discipline ever ripe with evolving theories and reinterpretations, suggests these dry valleys were carved by the relentless flow of water, eroding topsoil and smoothing the underlying chalk during the thaw that followed an ice age. Yet the Quaternary Period is marked by a succession of ice ages, each leaving an indelible mark on the land. This presents a quandary for those who seek to understand not just the creation of these valleys, but the epochs in which they thrummed with the lifeblood of flowing rivers.

Post-Glacial Flooding

For archaeologists and geologists, the puzzle lies in discerning which ice age’s thaw sculpted these valleys into the landscape. The challenge is not merely academic; it bears significant implications for understanding the human story intertwined with these natural features. The timing of water coursing through these valleys could illuminate periods of human activity, migration, and settlement, shedding light on the ancient peoples who once lived alongside these now-vanished rivers.

Geological maps and studies suggest the existence of great rivers that once traversed the British Isles, sculpted by the monumental release of water at the end of the ice ages. The last great thaw, occurring some 17,000 years ago as the ice sheets, towering over two miles high in places, receded, would have unleashed floods of epic proportions. This deluge, the most significant in recent geological history, would have transformed the landscape, including the Valleys of the South Downs, far from the ice sheet’s edge.

The intrigue of these dry river valleys lies not solely in their geological formation but in the stories they hold of a world dramatically different from our own. To understand when these valleys last echoed with the sound of flowing water is to peel back layers of time, revealing insights into the climatic shifts that have shaped the earth and influenced the course of human civilisation.
(Extreme weather and Ancient Subterranean shelters)
Dry River Valley – Extreme Weather

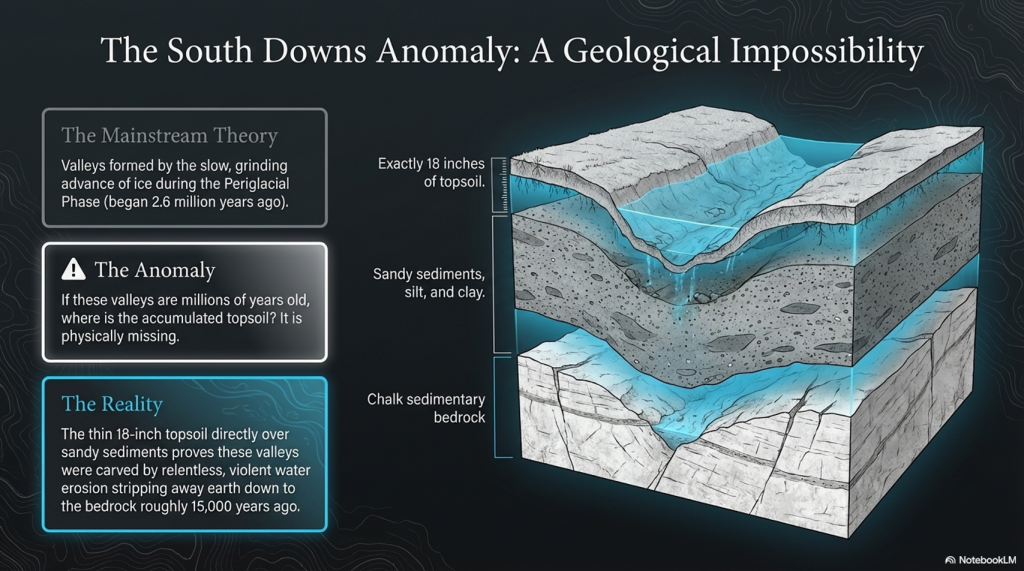
We are witnessing a paradigm shift in our understanding of Britain’s dry river valleys. Modern geological consensus now acknowledges that these features were carved not by the slow, grinding advance of ice but by the dynamic, erosive power of water. This revelation comes from observing the profound examples of soil erosion and the creation of valleys, where millions of gallons of water, moving with relentless force, stripped away layers of earth down to the bedrock.

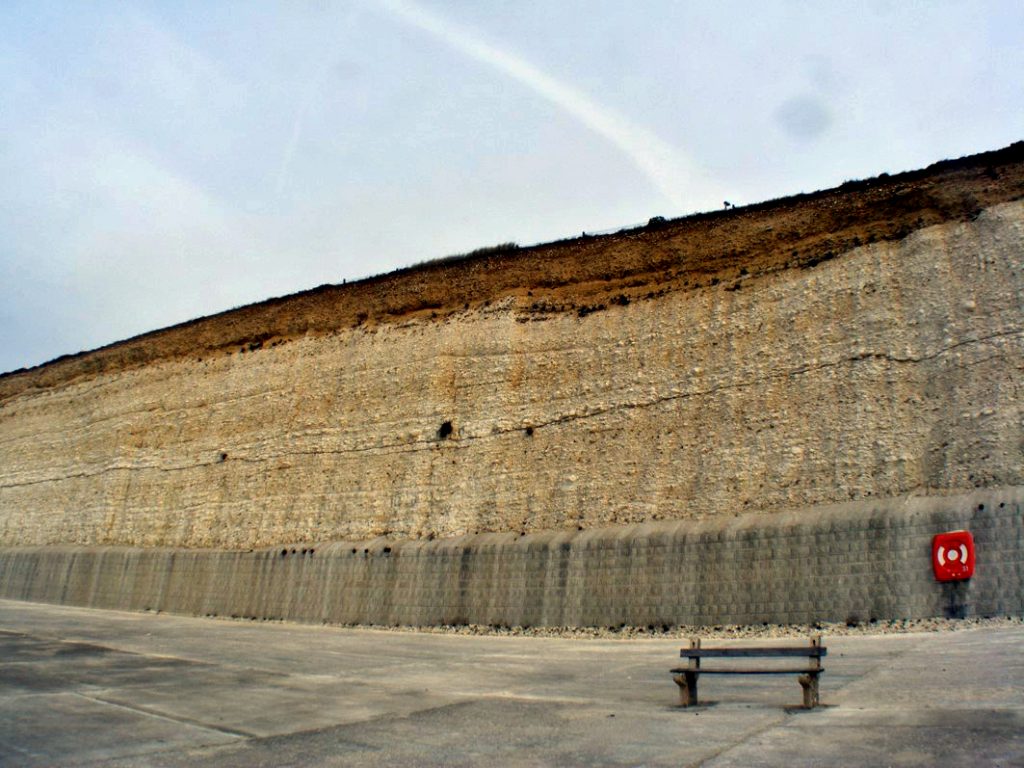
This narrative finds vivid illustration in the South Downs, where the cliffs and valleys bear silent testimony to ancient, post-glacial rivers. The region, much like the area surrounding Stonehenge, rests upon chalk sedimentary bedrock, shaped by the flows of yesteryear. The presence of these ancient watercourses is betrayed by the layers of sand, silt, and clay that comprise the subsoil, visible in the dales (valleys) of the South Downs and, most strikingly, on the faces of the chalky white cliffs. These cliffs, sculpted by the sea, offer a cross-sectional view into the past, revealing the sedimentary layers left by prehistoric rivers.

Contrary to earlier interpretations that attributed the formation of these geological features to windblown loess or wash from valley walls, the evidence suggests a different story. The discovery of sandy sediments, embedded within the chalk and lying in close proximity to the current topsoil, points to a more dramatic origin. These remnants of ancient rivers, dating back approximately 15,000 years to the aftermath of the last great melt, challenge the prevailing theories.

The puzzle for geologists and archaeologists alike lies in the thin veil of topsoil that covers these ancient sediments. If these valleys were as ancient as previously believed, the question arises: where has the expected accumulation of topsoil gone? Furthermore, if topsoil erosion occurs at the rate some experts claim, how do we account for the presence of 18 inches of topsoil atop the chalk in the present day?

These questions invite a reevaluation of our understanding of the landscape’s history, suggesting that erosion and sedimentation may not conform to the simplistic models previously proposed. The narrative of the South Downs and similar landscapes across Britain is not merely a tale of geological change but a reflection of the complex interplay between the earth’s natural forces and the passage of time.
(Extreme weather and Ancient Subterranean shelters)
Paleochannel on South Downs cliff – (The Fury of the Past: Natural Disasters in Historical and Prehistoric Britain)

We find ourselves at a crossroads of questions concerning the sedimentary timelines and the environmental narratives of our ancient landscapes. The enigma of the seemingly scant topsoil overlaying the remnants of prehistoric river beds in places like the South Downs raises profound questions about our understanding of climatic events and geological processes. Are we on the brink of uncovering evidence of a massive climatic upheaval yet to come, one that could dramatically alter the topsoil? Or, perhaps more intriguingly, have we misdated the dry river valleys and the prehistoric river beds that cradle the foundations of our ancient history?

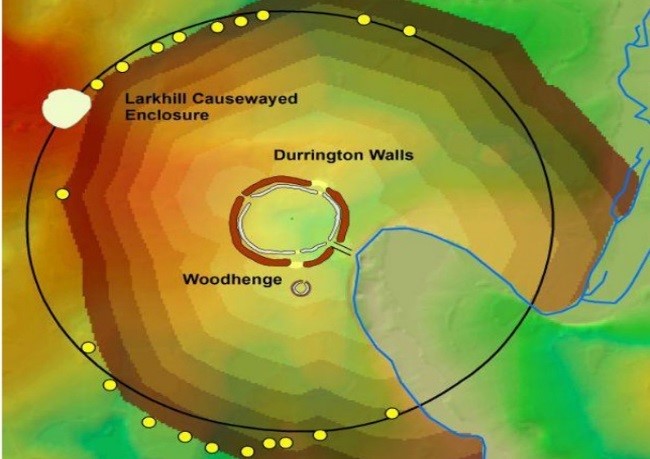
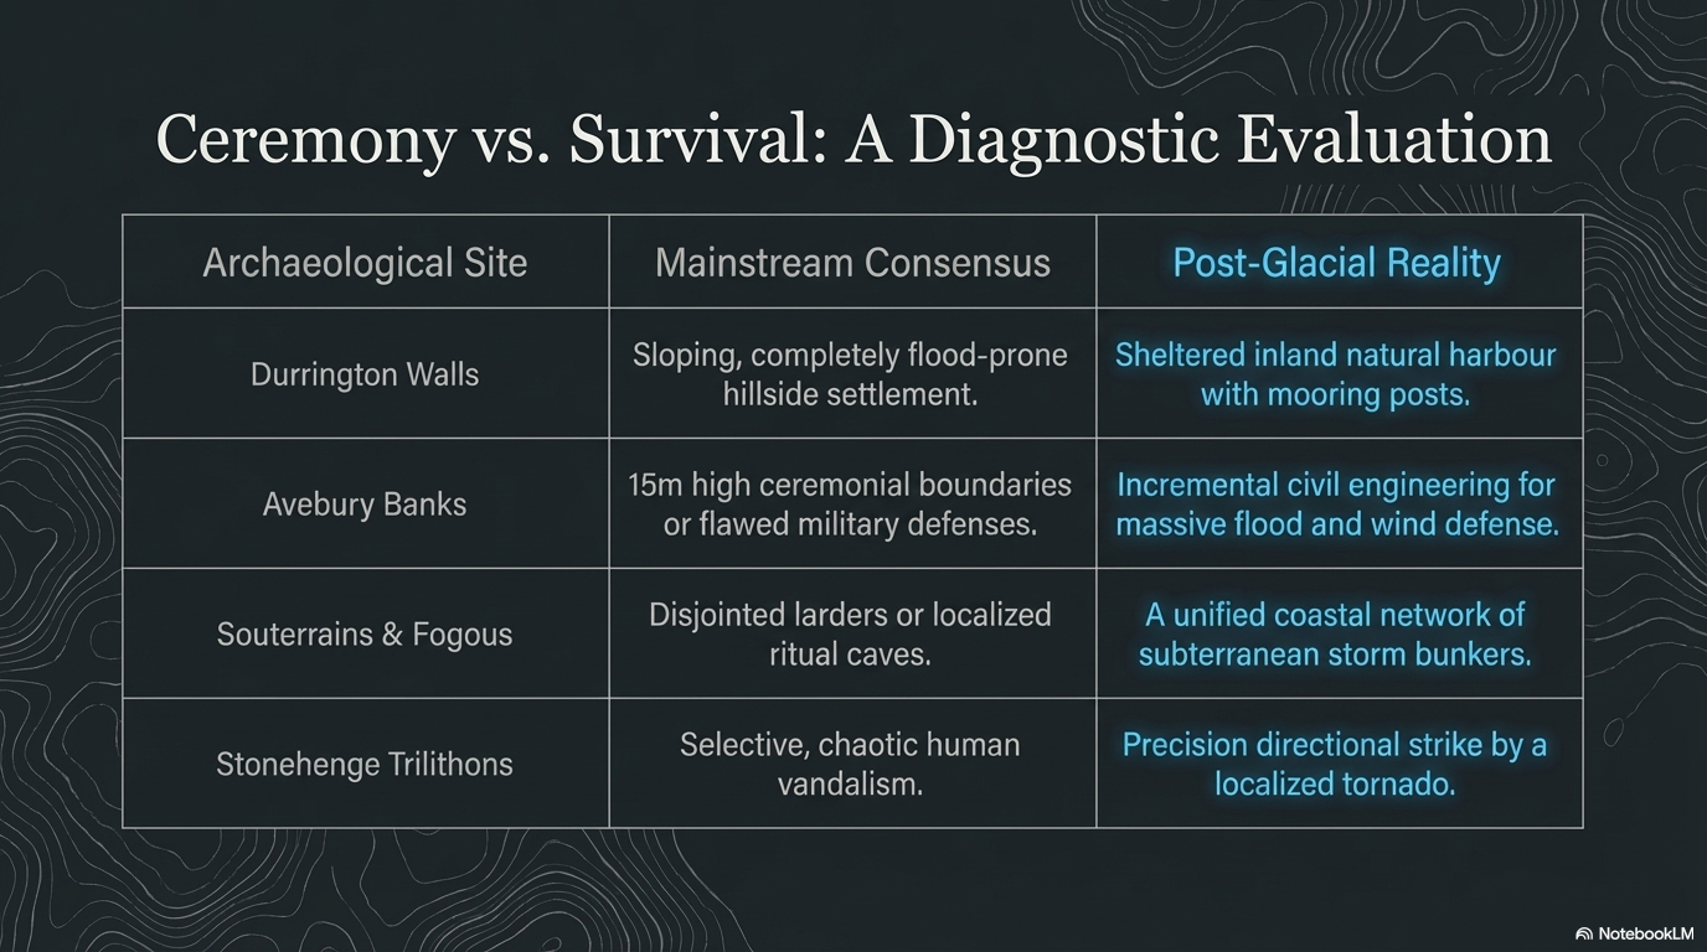
The puzzle deepens as we consider the architectural legacies of our ancestors, such as Woodhenge and the enigmatic site known as Durrington Walls. These ancient monuments, constructed with a profound understanding of their environmental context, may hold clues to the climatic and geological conditions of their time. The location and design of these structures, aligned with natural features and possibly informed by an awareness of floodplains and waterways, suggest a sophisticated interaction with the landscape that transcends mere habitation and ventures into the realm of reverence and ritual.

The construction of Woodhenge, positioned near the curious formation of Durrington Walls, invites speculation about the relationship between human society and the natural world in prehistoric times. Were these monuments erected in response to the environmental challenges faced by their builders, such as flooding or the need to navigate and control water resources? Or did they serve as markers of significant geological features, such as dry river valleys, embedding coded knowledge of the landscape’s history and cyclical transformations in their construction?

These questions compel us to reexamine our interpretations of the archaeological record, challenging us to integrate geological evidence with the cultural and spiritual dimensions of ancient constructions. The apparent discrepancy in the sedimentary record, marked by the proximity of ancient river sediments to the present-day topsoil, may not only point to gaps in our geological dating but also to a more complex understanding of how our ancestors interacted with and adapted to their environment.

Durrington Walls

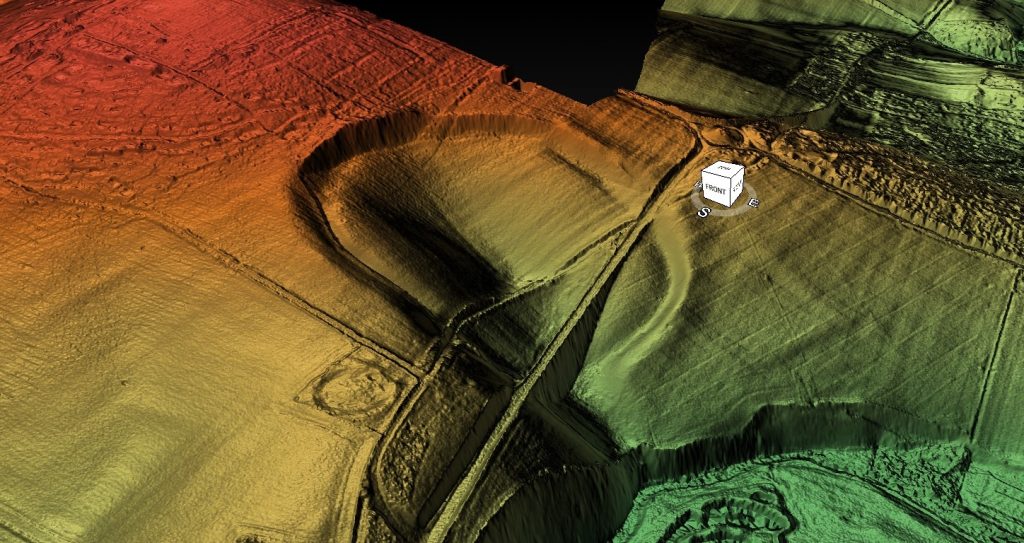
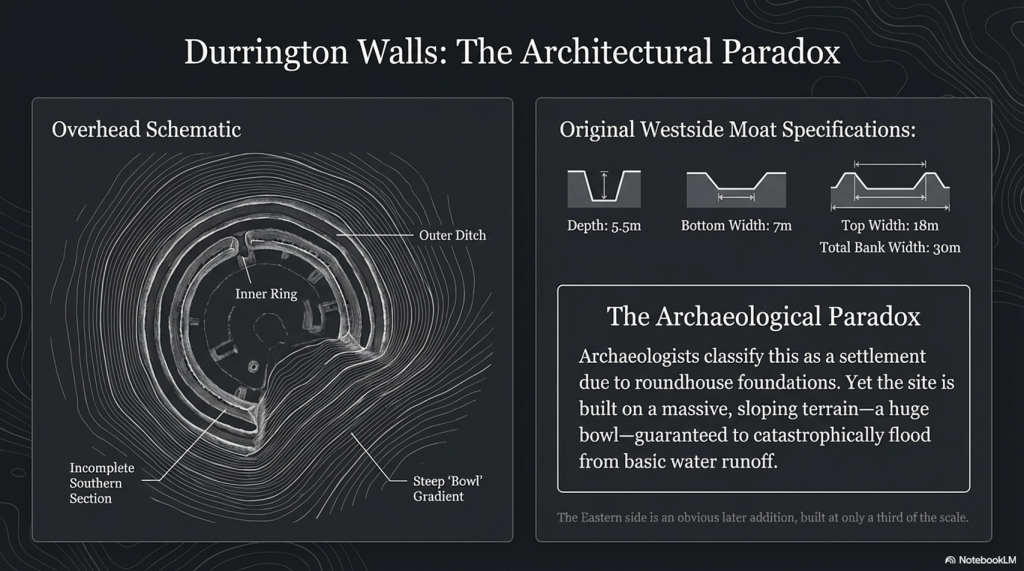
When you look at Durrington Walls, the first thing that strikes you is that it seems incomplete; it appears as a half-circle in aerial photographs, and from the ground, you get a sense that it is only half-finished. However, most illustrations include the easterly section because magnetometer surveys show more ditches beneath the surface, although you might question their purpose, as they are not apparent.  The easterly side of the site was clearly built much later than the original Westside. The East bank is smaller and does not match the initial ditch-and-moat specifications, which were roughly 5.5 m deep, 7 m wide at the bottom, and 18 m wide at the top. (The Fury of the Past: Natural Disasters in Historical and Prehistoric Britain)
(Extreme weather and Ancient Subterranean shelters)
Durrington Walls showing harbour in the dip – (The Fury of the Past: Natural Disasters in Historical and Prehistoric Britain)

The bank was 30 m wide in some areas. The bank and ditch indicated by the magnetometer surveys are less than half that depth; the bank is only about a third the size of the one on the Northern side.  The current theory and plan for Durrington Walls do not stand up to investigation, for clearly the Eastern side of the camp was added later, when the prehistoric groundwater had begun to recede.

So what was its original use?

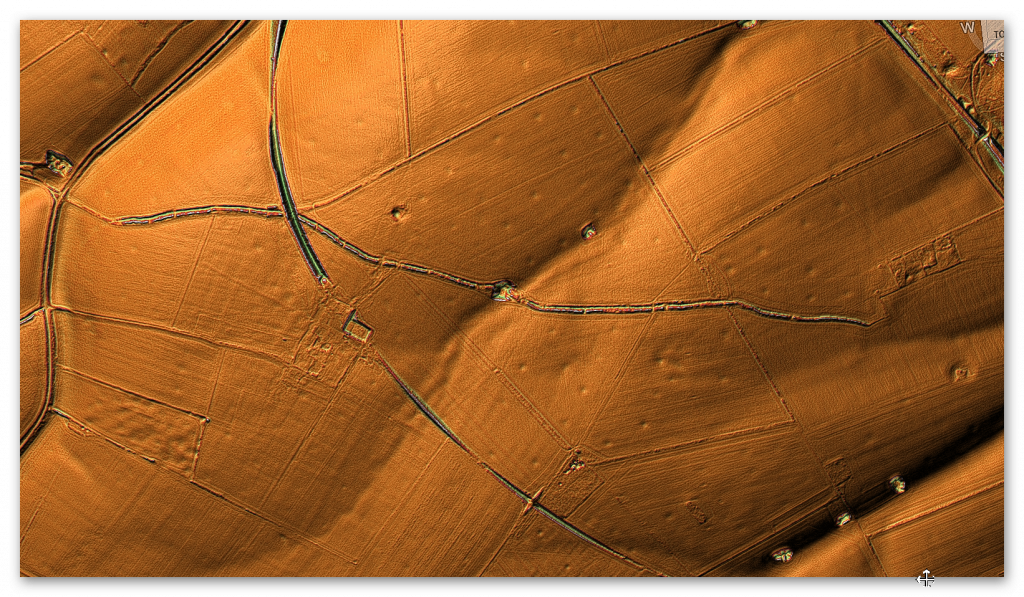
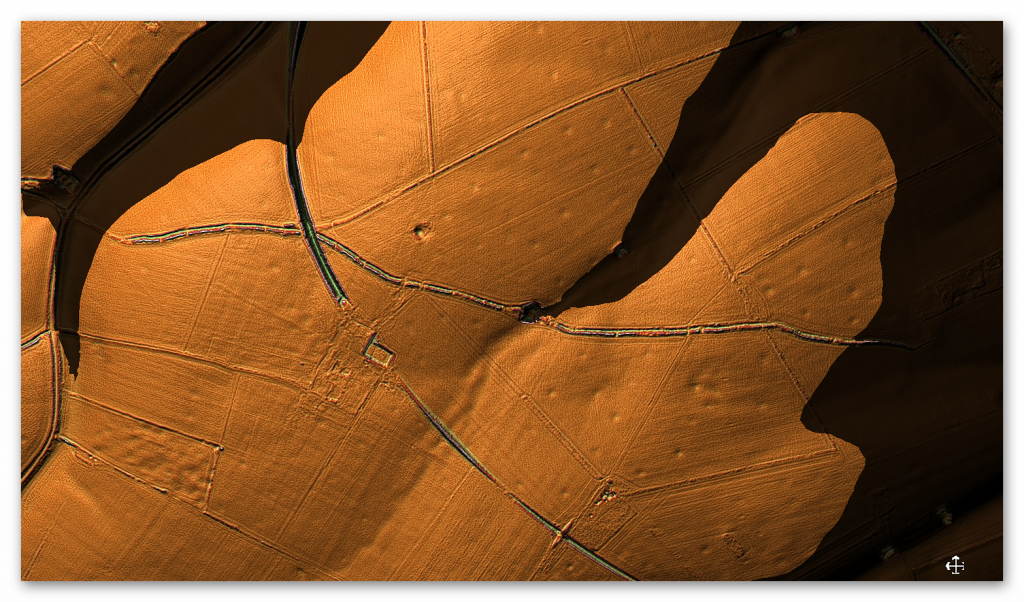
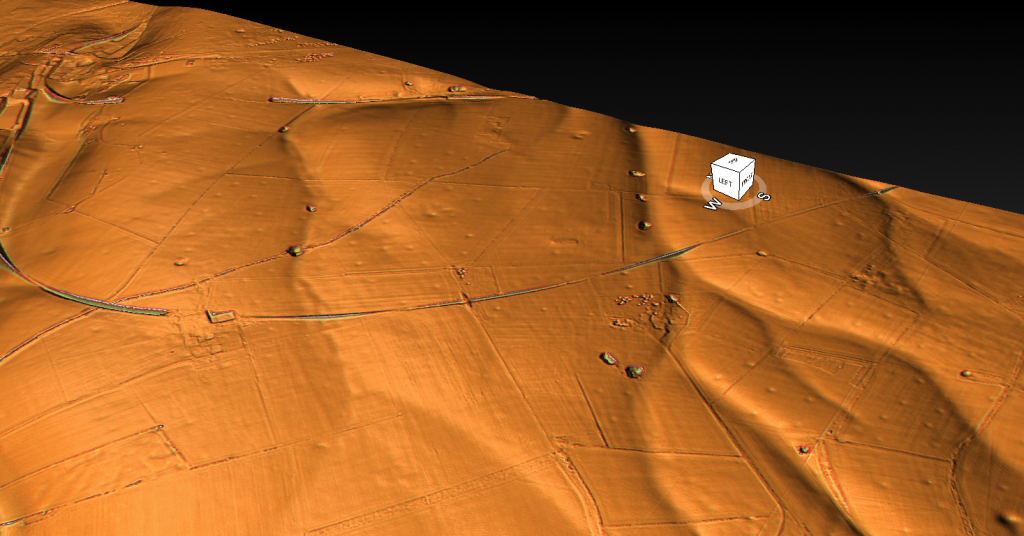
 To answer that question, you must look at the site’s terrain, position and layout. The first thing that hits you is that the site is not flat! In fact, it’s a huge bowl.
The Fury of the Past: Natural Disasters in Historical and Prehistoric Britain
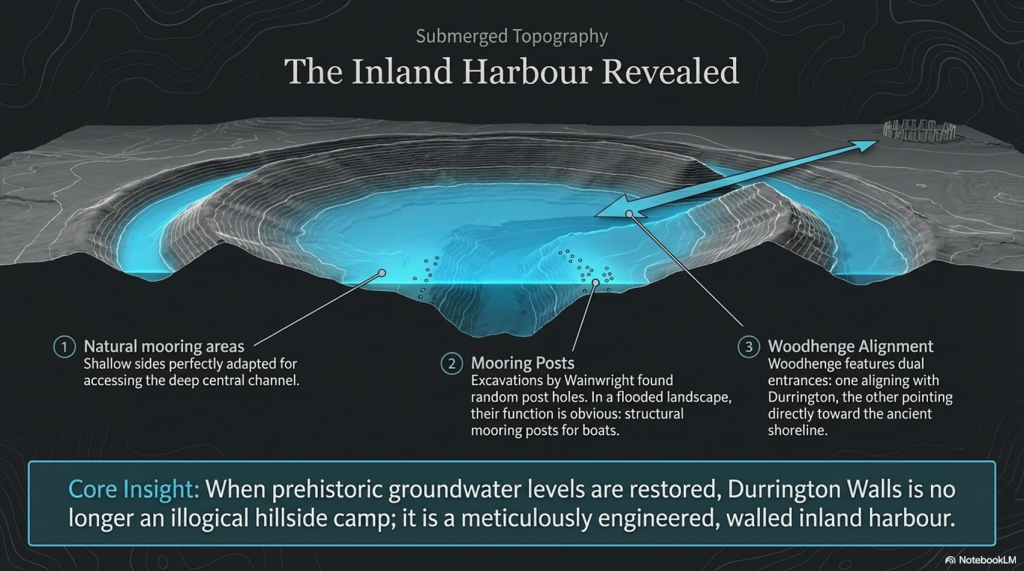
Woodhenge & Durrington Walls Harbour- (The Fury of the Past: Natural Disasters in Historical and Prehistoric Britain)

The suggestion that our forebears might have chosen to establish settlements in locations that, to the modern eye, appear prone to flooding, invites a deeper investigation into the logic and environmental understanding of these ancient communities.

The case of Durrington Walls, traditionally interpreted as a settlement due to the discovery of roundhouse foundations, challenges contemporary notions of ideal habitation sites. The prevailing wisdom that discourages camping on a slope due to the risk of water runoff highlights a modern bias towards flat, stable ground. Yet the archaeological insistence on Durrington Walls as a settlement, despite its topographical peculiarities, might overlook the site’s strategic significance in relation to the environmental conditions of the time.
Harbour

If we entertain the notion of significantly higher prehistoric groundwater levels, Durrington Walls transforms from a seemingly ill-chosen settlement into a potential natural harbour. The site’s configuration, with shallow sides ideal for mooring boats and a central ravine providing depth for watercraft, coupled with the remains of substantial external walls, suggests a sophisticated understanding of landscape and water management by its builders. Such a harbour, protected by formidable chalk walls, would have been a marvel of prehistoric engineering, offering shelter from the elements and facilitating trade or travel.

Woodhenge’s dual entrances further support the hypothesis of a water-centric landscape. One entrance aligns with Durrington Walls, suggesting a terrestrial connection, while the other, leading towards what would have been the ancient shoreline, implies a relationship with waterways. The presence of groundwater at Woodhenge, inferred from magnetometer surveys and the peculiarities of the site’s layout, underscores the adaptability and ingenuity of prehistoric peoples in harnessing their environment.

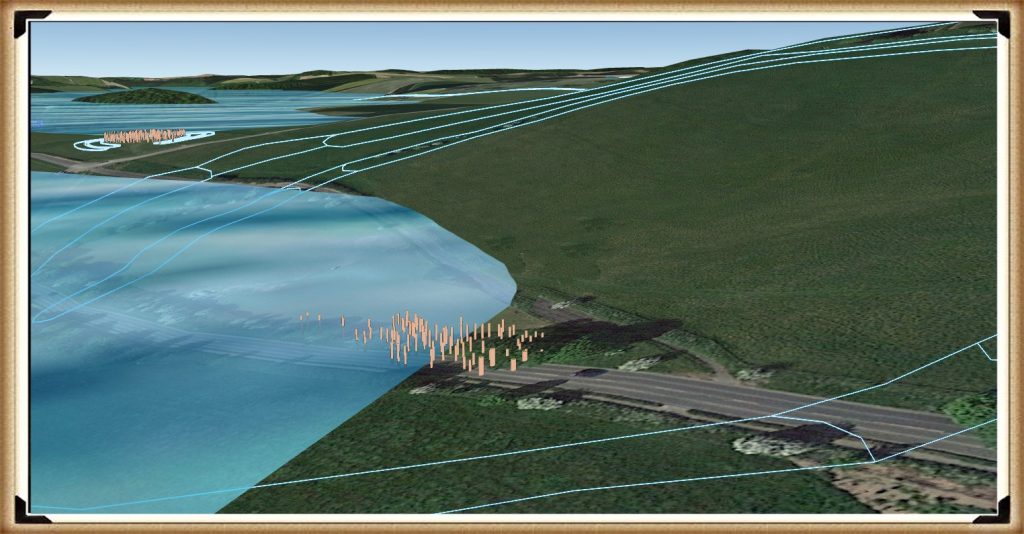
The evolution of the landscape, mirrored in the receding shoreline over millennia and the adaptation of human structures to these changes, reveals a dynamic interaction between our ancestors and their surroundings. The modern road, tracing the ancient shoreline’s path, serves as a tangible reminder of the deep history embedded in the land.

This reconsideration of Durrington Walls and Woodhenge as components of a prehistoric landscape intimately connected with water challenges us to think beyond conventional archaeological interpretations. It suggests that our ancestors were far from foolish in their choice of settlement locations. Instead, they possessed a profound understanding of their environment, selecting sites based on a complex array of factors, including access to water, natural protection, and the strategic advantages these locations offered.
(Extreme weather and Ancient Subterranean shelters)
Woodhenge and Durrington Walls Harbour – (The Fury of the Past: Natural Disasters in Historical and Prehistoric Britain)

We should not be too surprised by this, as lakeshores and coastlines still have paths along with them today so that we can fully enjoy them. There is no reason to believe that prehistoric people did anything different 8,000 years ago, and such a path would also have a practical purpose, as the shorelines were used as a mooring site.  If we are correct about the road and the mooring points, is it possible to find post holes here underground?

Unbelievably, the answer is yes!

Wainwright, in his excavations of Durrington Walls, discovered lots of them. Without a shoreline, the post holes would look random and not make much sense. However, as soon as the groundwater flooding is added, their function becomes apparent: they held mooring posts, as that is the natural landing area for boats coming to and from Stonehenge, Avebury or Old Sarum.  But are there other sites that have walls to protect them from the weather?

Avebury

Navigating through the mysteries of Avebury and its ancient landscapes, we find ourselves in the midst of a dialogue that blends the profound insights of archaeology with the nuanced understanding of geology, much in the spirit of Jacob Bronowski’s interdisciplinary exploration. Avebury, nestled within the chalkland of the Upper Kennet Valley, presents a fascinating case study of human interaction with a dynamically changing environment.

The positioning of Avebury on a low chalk ridge, elevated above the surrounding landscape, and its proximity to the Marlborough Downs, speak to the strategic selection of this site by our ancestors. The discovery of flint artefacts dating to the late Mesolithic period suggests a long history of human presence, perhaps drawn by the natural resources and the strategic vantage point this location offers.
The Fury of the Past: Natural Disasters in Historical and Prehistoric Britain

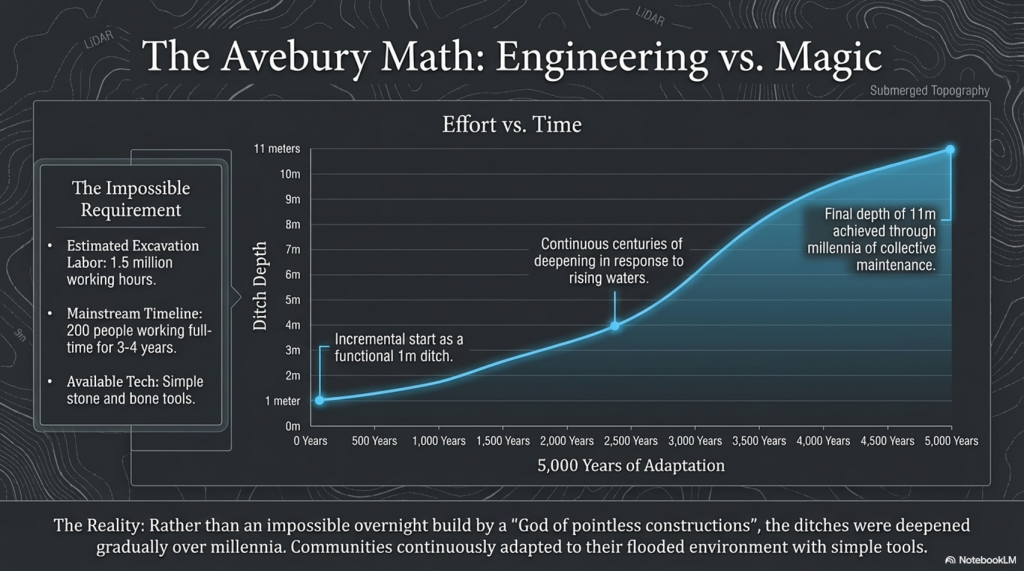
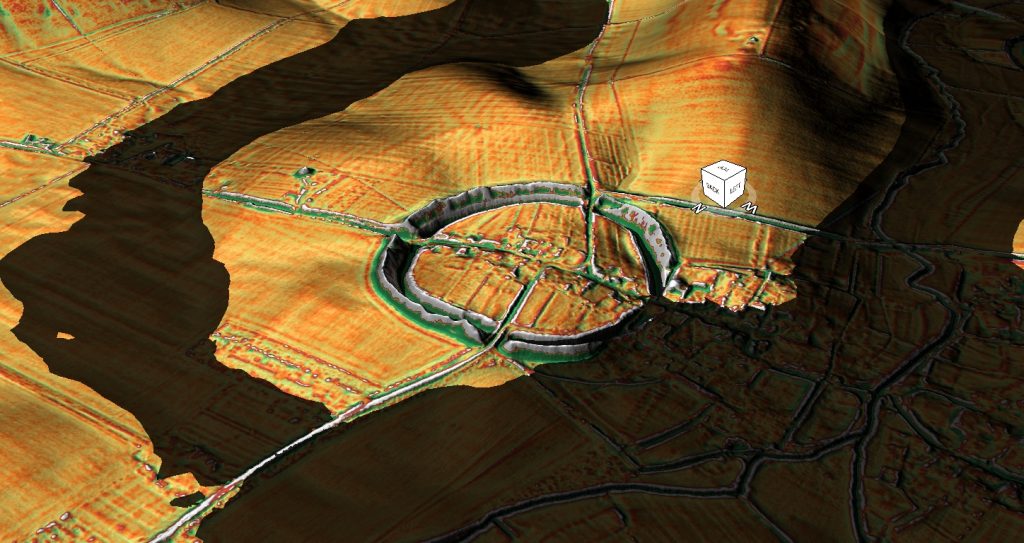
The post-glacial flooding that reshaped the landscape around Avebury, transforming it into an almost island-like monument surrounded by waterways, highlights the profound impact of natural forces on human settlements. The effort to maintain Avebury’s island status through the construction of ditches and large banks reflects a determined human response to a changing environment, aimed at preserving the site’s symbolic or functional significance.

The estimated 1.5 million working hours required to construct the Avebury monument, involving 200 people working full-time for three to four years, underscores the monumental effort invested in this endeavour. This contrasts sharply with the even more staggering effort estimated for the construction of Silbury Hill, suggesting a remarkable dedication of resources and labour to these ancient projects. The discrepancy in the estimated working hours needed to move the respective volumes of chalk at Avebury and Silbury Hill raises intriguing questions about the methods, technologies, and organisational structures of prehistoric societies.

These ancient monuments, Avebury and Silbury Hill, stand as testaments to the ingenuity and resilience of our ancestors, who, faced with a world marked by extreme weather events and changing landscapes, sought to leave their mark through these colossal earthworks. The monumental scale of these projects, achieved without the modern machinery or technological aids available today, invites us to reconsider the capabilities of ancient societies and their profound connection to the landscapes they inhabited.
(Extreme weather and Ancient Subterranean shelters)
Avebury Harbour- (The Fury of the Past: Natural Disasters in Historical and Prehistoric Britain)

This is just another fact that does not make sense! –

There is just no consistency in archaeological findings; it’s all subjective, and quite frankly, wrong!

The suggestion that monuments like Avebury evolved gradually over centuries, with their ditches deepening from a modest one meter to the monumental eleven meters over 5,000 years, presents a compelling narrative of continuous human engagement with these sites. This slow but persistent expansion and deepening of the ditches could indeed offer a plausible explanation for the archaeological conundrum of the tools used in their construction.

The incremental growth of these monuments suggests a process deeply intertwined with the rhythms of prehistoric life, in which the maintenance and expansion of the ditches became part of the community’s ongoing relationship with their environment and heritage. The gradual excavation of the ditches, possibly for ritual cleansing, defence, or to expand the monument’s scope, would have allowed the use of simple tools available at the time. This contrasts with the daunting task of constructing such massive earthworks within a single generation, which would have required resources and coordination levels that seem less plausible without sophisticated tools and technologies.
The Fury of the Past: Natural Disasters in Historical and Prehistoric Britain

Giant Ditches

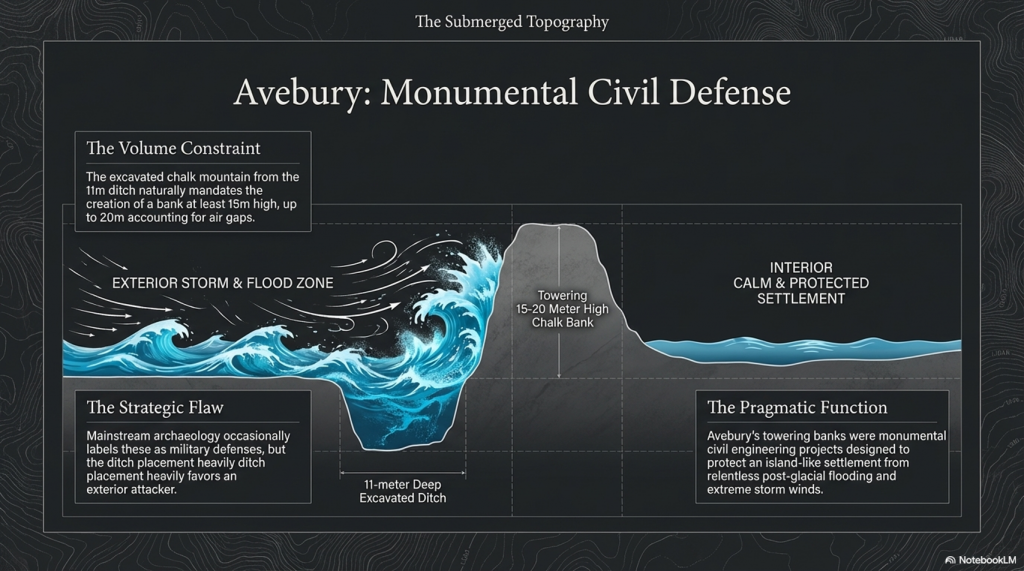
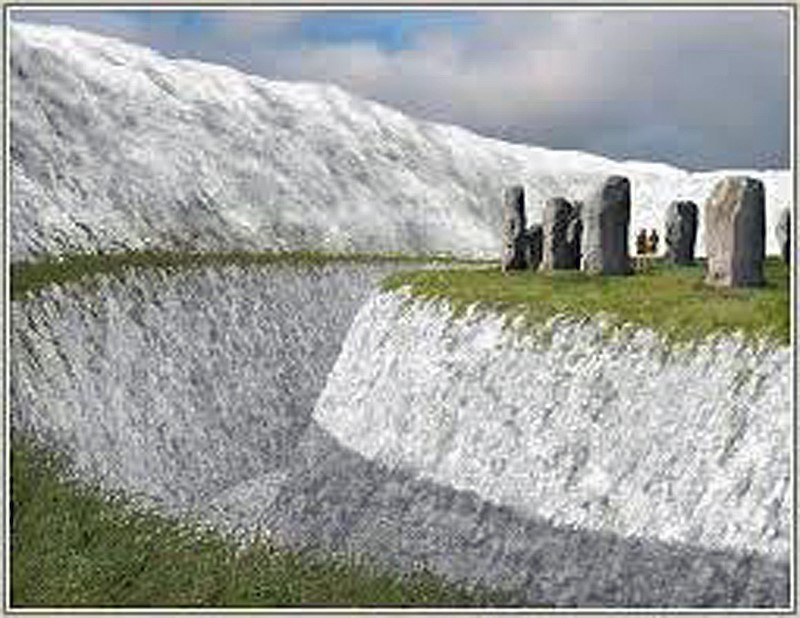
The analysis of the ‘chalk mountain’ formed from excavated material offers fascinating insights into the monument’s purpose and symbolism. The calculation that the bank could originally have stood at least 15 meters high, with the potential to reach 20 meters when accounting for chalk compression and air gaps, underscores the monumental effort invested in these structures. This towering presence would have dominated the landscape, serving as a potent symbol of the community’s identity, beliefs, and capabilities.

The bank’s considerable height, derived from the volume of chalk moved from the ditches, also speaks to the technical understanding and engineering skills of the people who built these monuments. The manipulation of the landscape on such a scale, with the tools and knowledge available at the time, demonstrates a sophisticated grasp of materials and a deep connection to the land itself.

This perspective, which sees the monuments growing organically over time, enriches our understanding of the relationship between prehistoric societies and their monumental creations. It suggests that these structures were not static symbols imposed on the landscape but dynamic, evolving entities that reflected the changing needs, beliefs, and aspirations of their builders.
(Extreme weather and Ancient Subterranean shelters)
Avebury Harbour Walls- (The Fury of the Past: Natural Disasters in Historical and Prehistoric Britain)


The endeavour to construct a 15-meter-high wall, especially within the context of ancient monumental architecture, invites a nuanced exploration that bridges the gap between archaeological theory and the lived realities of prehistoric communities. The suggestion that such walls were defensive structures, yet paradoxically positioned to ostensibly favour attackers, propels us into a deeper inquiry into the motivations and environmental challenges faced by these ancient builders.

The comparison with Durrington, where a high wall ostensibly serves a protective function for boats against wind and storms, suggests a pragmatic approach to construction that transcends mere defensive purposes. This insight challenges the notion of monumental walls as solely ceremonial or defensive and invites consideration of their role in mitigating the era’s environmental conditions.

The archaeological pivot to ‘ceremonial’ explanations in the face of such paradoxes, while often serving as a placeholder for the unknown, may indeed overlook the practical interactions between these ancient communities and their volatile climates. The humorously termed “God of pointless constructions and practices” belies a critical gap in our understanding of the symbiotic relationship between human societies and their environments.

Underground Bunkers

The suggestion that past weather was more severe and that the construction of shelters and walls was a response to these conditions is compelling. This perspective is supported by the presence of souterrains, or underground structures, which served as refuges from harsh weather. These structures, varying in design and function across regions, exemplify the adaptability and ingenuity of ancient communities in the face of climatic adversity.

The regional variation in the design of souterrains, from fogous in Cornwall that served as larders to other forms of underground shelter, underscores the diversity of responses to environmental challenges. This diversity not only highlights the practical considerations that drove the construction of monumental and subterranean structures but also reflects the rich tapestry of cultural practices that evolved in tandem with changing landscapes and climates.
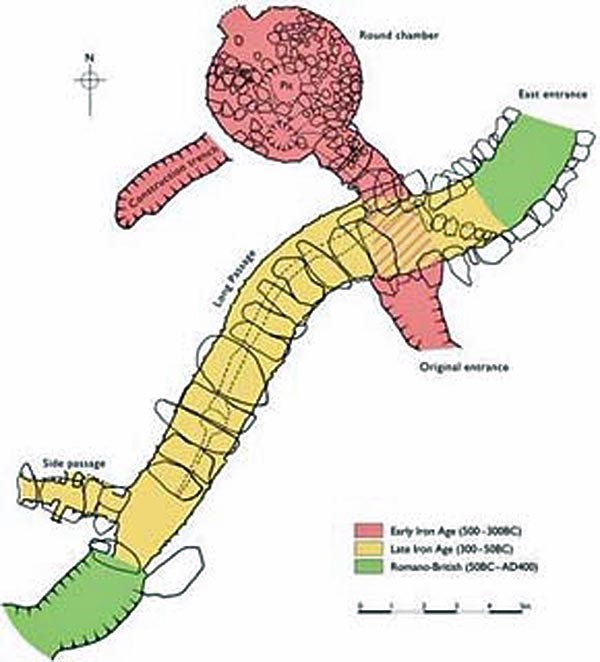
(Extreme weather and Ancient Subterranean shelters)
Souterrains- (The Fury of the Past: Natural Disasters in Historical and Prehistoric Britain)


The souterrains of Ireland, often colloquially termed ‘caves’, constitute a fascinating part of the archaeological and cultural landscape, rich in historical significance and imbued with the mysteries of the past. The scholarly works of individuals such as A.T. Lucas and the comprehensive study by Clinton in 2001 have provided invaluable insights into these subterranean structures, offering a window into their distribution, associated settlements, functions, and the chronology of their use.

Originating from the French term for “underground passageway,” souterrains were integral to the communities that constructed them, serving purposes that extended beyond the mere architectural or ceremonial. These underground galleries, often associated with settlements and ringforts, reflect a blend of ingenuity and necessity, designed to withstand the trials of their times.

Constructed by excavating earth and lining the resulting spaces with stone slabs or wood, souterrains were reburied to integrate seamlessly with the landscape. In instances where they were carved directly into rock, such elaborate preparations were unnecessary. Their functions, far removed from burial or ritualistic uses, leaned towards the practical, serving primarily as food stores or refuges during periods of conflict. The presence of souterrains within or adjacent to ringforts, and their dating to periods contemporary with these structures, suggests a synchronisation of defensive strategies and domestic planning.
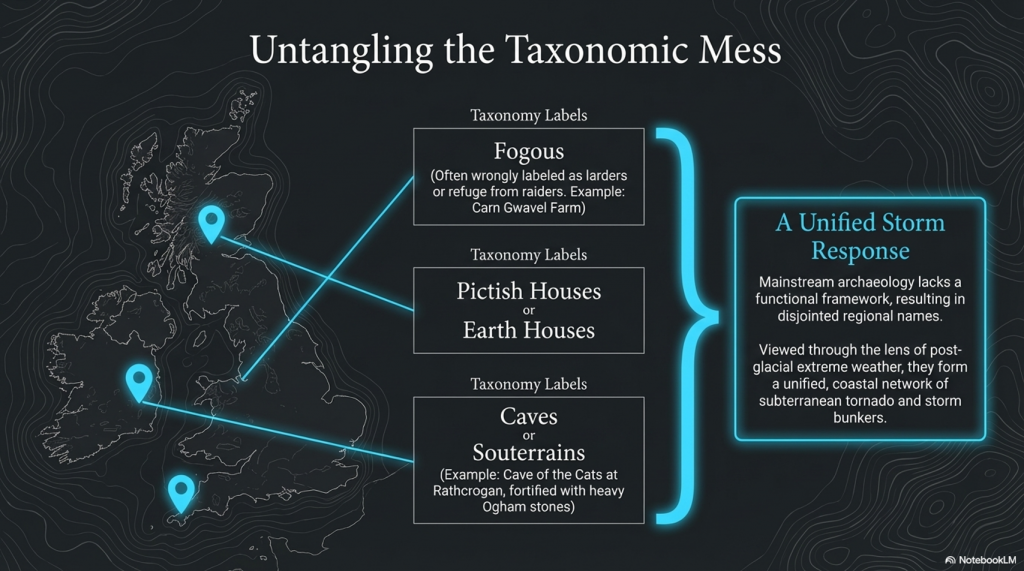
The Fury of the Past: Natural Disasters in Historical and Prehistoric Britain

The utilisation of ogham stones as structural elements within souterrains, and the repurposing of ancient script-bearing stones as roofing lintels or doorposts, underscores a fascinating intersection of cultural heritage and architectural necessity. Such practices highlight the adaptive reuse of materials and the deep-rooted connection between the physical and the symbolic in Irish heritage. The ‘cave of the cats’ at Rathcrogan stands as a prominent example, where the widened natural limestone fissure incorporates ogham stones, weaving together the threads of history, architecture, and mythology.

The distribution of souterrains in Ireland, particularly concentrated in certain counties, speaks to the geographical and environmental factors that influenced their construction. These underground structures, with their often obvious entrances, challenge our modern perceptions of secrecy and security, suggesting that their protective function was balanced with the practical needs of accessibility and use.

The first thing that strikes you as strange is the fact that these landscape features are categorised with different names in different locations:

Earth Houses – Modern use

Fogous – Cornwall

Pictish Houses – Found in Scotland (confusion arises here as some are only partially subterranean), unlike the Earth Houses in the same region.

Caves – Ireland

It’s quite literally an archaeological mess.  And the reason for this mess is that archaeologists don’t understand why they were built, so they gave them local names, unlike barrows, Stone circles and henges, which appear in the same areas but with a unified name to save confusion.  So, what can we find out about these structures that will help us understand why they were built?

Location, Location, Location

If we look at the minimal archaeological evidence, we do see a defined pattern of construction. For example, in Cornwall, we have found to date a collection of fifteen ‘fogous’.  According to archaeologists, this is a proposed use for fogous, a refuge during raiding trips, as they are close to the sea.  Sadly, if you look more closely, you see them in non-coastal areas and even in the middle of Dartmoor (Lade Hill Brook), where it’s called a Beehive Hut. 

The problem with looking for such objects in Devon is that hundreds of ‘caves’ are dotted around from the days of tin mining, and therefore it is almost impossible to distinguish a prehistoric mine opening from a fogou.
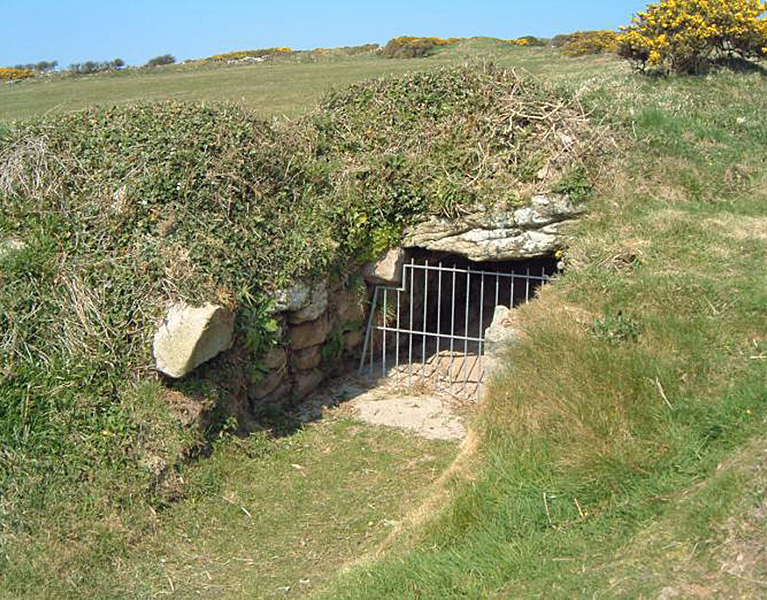
(Extreme weather and Ancient Subterranean shelters)
Fogou- (The Fury of the Past: Natural Disasters in Historical and Prehistoric Britain)


The exploration of subterranean structures across the British Isles and their potential functions opens a fascinating chapter in the study of prehistoric human adaptation to environmental challenges. The presence of fogous in Cornwall, notably the example at Carn Gwavel Farm on the Isle of Scilly, exemplifies the ingenuity of ancient communities in creating shelters that blend seamlessly with the landscape. These underground chambers, with their distinctive S-shaped curves and corbelled construction, suggest a level of architectural sophistication designed to address specific needs, whether for storage, habitation, or protection.

The orientation of fogous towards the SW-NE axis raises intriguing questions about their purpose. While some might speculate a religious or ceremonial significance, the practical considerations of climate and environmental exposure cannot be overlooked. The architectural similarities between fogous, chamber cairns, and passage chambers across different regions—each adapted to local conditions and available materials—underscore a widespread practice of constructing subterranean spaces for varied uses.

In regions like Ireland and Scotland, where these structures are more commonly found and referred to as ‘caves’ or ‘earth houses,’ their abundance points to a shared cultural practice of utilising underground spaces. The absence of similar structures in areas like Devon, Dorset, Somerset, and Wiltshire, juxtaposed with the concentration of other prehistoric monuments, suggests regional variations in responses to environmental and social pressures.

The situation in Wales, with its chambered cairns and passage chambers, adds another layer to this complex tapestry. The discovery of bodies within these structures has led to their classification as burial sites, yet the possibility that their original purpose evolved over time warrants consideration. The comparison to modern bunkers, which have found new uses beyond their original intent, illustrates the fluidity of human interactions with built environments.

Tornadoes

The hypothesis that these subterranean shelters were constructed in response to severe storm conditions, akin to practices in contemporary hurricane-prone areas of the USA, highlights a timeless human priority: the need for protection against the elements. This perspective offers a compelling narrative of prehistoric resilience and adaptability, suggesting that the construction of such shelters was a rational response to the challenges posed by a dynamic and sometimes hostile environment.

Understanding the motivations behind the construction of fogous and similar structures requires an interdisciplinary approach that considers archaeological evidence, environmental science, and historical climatology. The severity of prehistoric storms, as inferred from geological indicators of post-glacial flooding and climate change, provides a backdrop against which the necessity and ingenuity of these ancient shelters can be fully appreciated.

In contemplating these ancient structures, we are reminded of the enduring human capacity to innovate and adapt to the world’s ever-changing face. The legacy of fogous and their counterparts across the British Isles and beyond speaks to a deep-seated human instinct to seek shelter and safety in the face of nature’s fury, a testament to the ingenuity and resilience of our ancestors that continues to inspire and inform our understanding of human history.

But is there any other evidence that tornadoes hit Britain?

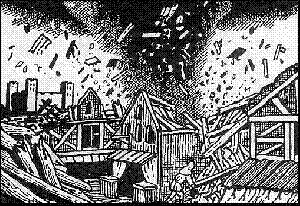
On 17th October 1091, London was hit by a vicious tornado.
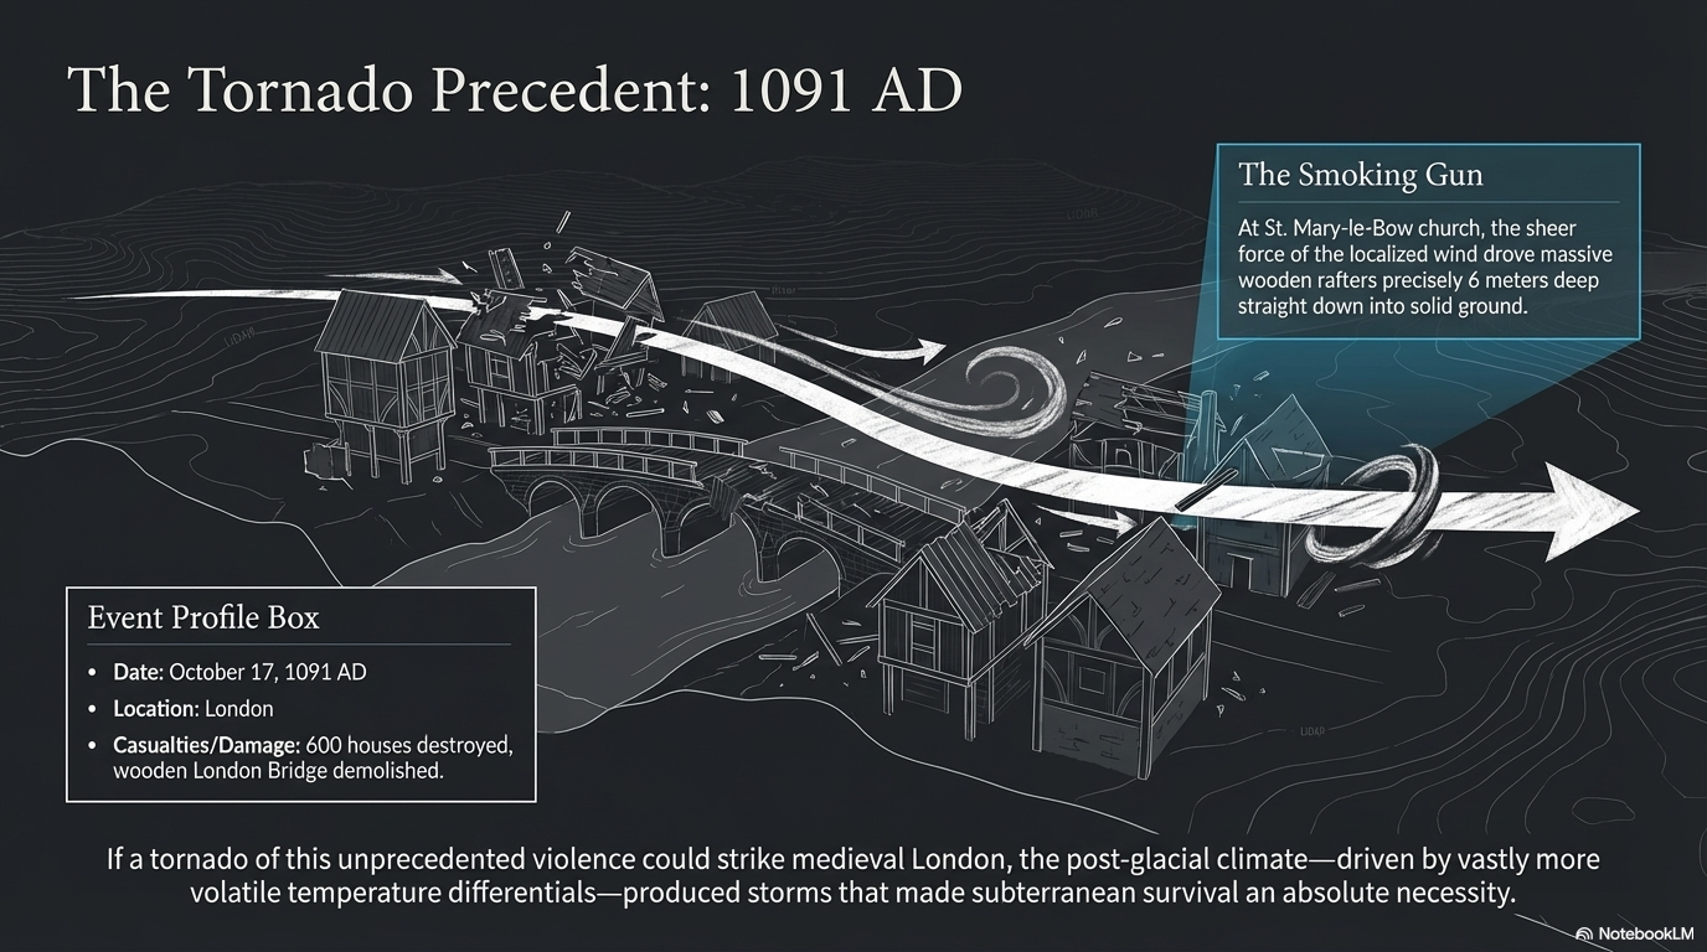
The Fury of the Past: Natural Disasters in Historical and Prehistoric Britain
(The Fury of the Past: Natural Disasters in Historical and Prehistoric Britain)

The historical records describing the destruction wrought upon London, including the demolition of the wooden London Bridge, the devastation of 600 houses, and the severe damage to St. Mary-le-Bow church, underscore the formidable power of natural forces. The detail of rafters being driven six meters into the ground at St. Mary-le-Bow vividly illustrates the intensity of the event, likely a tornado, which also resulted in loss of life and widespread homelessness. This account provides a stark reminder of the vulnerability of even the most seemingly permanent human constructions to the whims of nature.

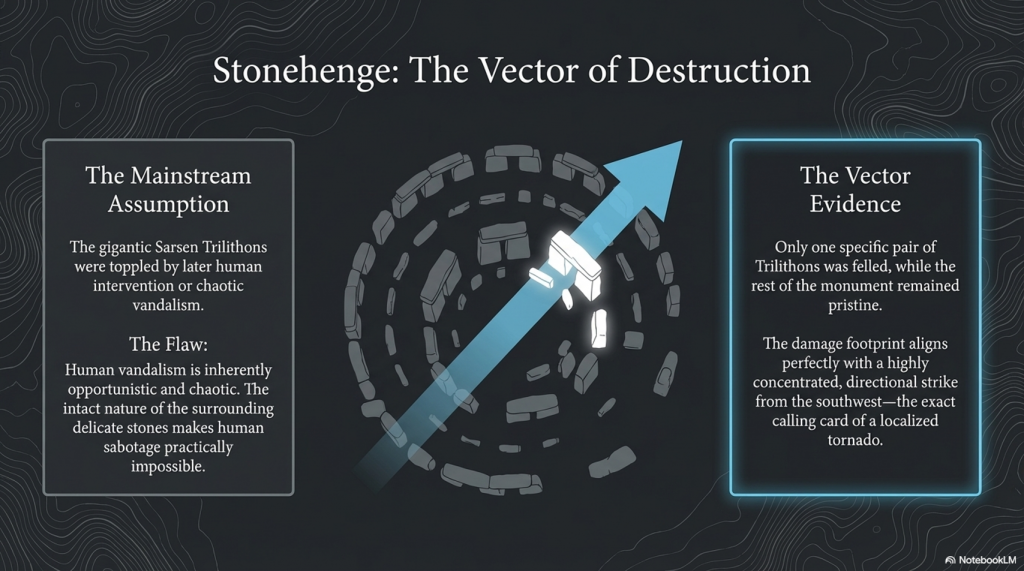
The enduring mystery surrounding Stonehenge, particularly the toppling of the gigantic Sarsen Trilithon Stones, invites a reconsideration of the forces capable of such feats. The traditional assumption that human intervention aimed at dismantling the monument falls short in light of the damage’s selective nature. The hypothesis of a tornado strike from the southwest offers a compelling alternative explanation, aligning with the directional pattern of damage observed at the site. The fact that only one pair of the trilithons was felled, while the rest of the monument remained relatively intact, suggests an event that combined immense power with precise directionality, characteristics emblematic of tornadoes.
The Fury of the Past: Natural Disasters in Historical and Prehistoric Britain

Tornadoes, though not commonly associated with Britain’s climate in the popular imagination, are indeed part of the British weather landscape, albeit on a smaller scale than in regions like the United States. The potential for a tornado to have caused the specific pattern of destruction observed at Stonehenge challenges preconceived notions about the stability of such ancient structures and the range of natural disasters that have affected them throughout history.

The observation made by Stukeley in the 16th century and the subsequent ‘repairs’ at the turn of the last century underscore the ongoing interaction between human efforts to preserve or restore ancient monuments and the natural processes that continue to shape them. This dynamic interplay highlights the fragility of our cultural heritage and the importance of understanding the human and natural factors that have influenced these iconic structures over millennia.

In exploring the possibility that tornadoes could impact Stonehenge, we are reminded of the broader implications of climate and environmental forces for archaeological sites. Such considerations not only enrich our understanding of the past but also inform preservation strategies for safeguarding our cultural heritage against future natural events. The case of Stonehenge serves as a poignant example of the complex relationship between human history, natural phenomena, and the ongoing efforts to interpret and preserve the legacies of ancient civilisations in the face of nature’s capricious power.
The Fury of the Past: Natural Disasters in Historical and Prehistoric Britain

PodCast

Author’s Biography

Robert John Langdon, a polymathic luminary, emerges as a writer, historian, and eminent specialist in LiDAR Landscape Archaeology.

His intellectual voyage has been interwoven with stints as an astute scrutineer in government and grand corporate bastions, a tapestry spanning British Telecommunications, Cable and Wireless, British Gas, and the esteemed University of London.

A decade hence, Robert’s transition into retirement unfurled a chapter of insatiable curiosity. This phase saw him immerse himself in Politics, Archaeology, Philosophy, and the enigmatic realm of Quantum Mechanics. His academic odyssey traversed the venerable corridors of knowledge hubs such as the Museum of London, University College London, Birkbeck College, The City Literature Institute, and Chichester University.

In the symphony of his life, Robert is a custodian of three progeny and a pair of cherished grandchildren. His sanctuary lies ensconced in the embrace of West Wales, where he inhabits an isolated cottage, its windows framing a vista of the boundless sea – a retreat from the scrutinising gaze of Her Majesty’s Revenue and Customs, an amiable clandestinity in the lap of nature.

Exploring Prehistoric Britain: A Journey Through Time

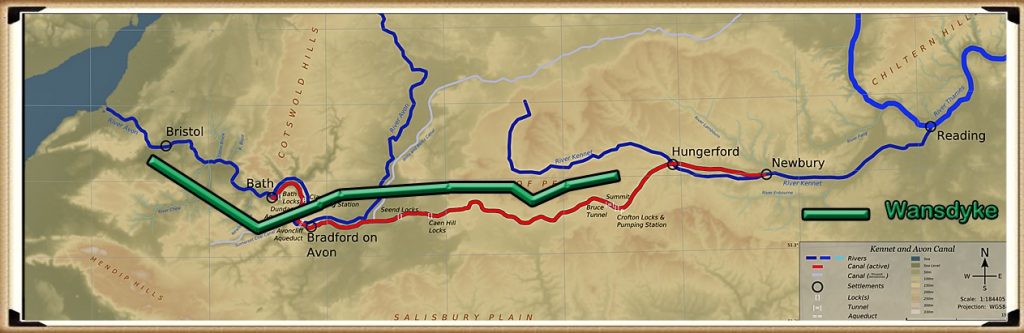
My blog delves into the fascinating mysteries of prehistoric Britain, challenging conventional narratives and offering fresh perspectives grounded in cutting-edge research, particularly LiDAR technology. I invite you to explore some key areas of my research. For example, the Wansdyke, often cited as a defensive structure, is re-examined in light of new evidence. I’ve presented my findings in my blog post Wansdyke: A British Frontier Wall – ‘Debunked’, and a Wansdyke LiDAR Flyover video further visualises my conclusions.

My work also often challenges established archaeological dogma. I argue that many sites, such as Hambledon Hill, commonly identified as Iron Age hillforts, are not what they seem. My posts Lidar Investigation Hambledon Hill – NOT an ‘Iron Age Fort’ and Unmasking the “Iron Age Hillfort” Myth explore these ideas in detail and offer an alternative view. Similarly, sites like Cissbury Ring and White Sheet Camp receive re-evaluations based on LiDAR analysis in my posts “Lidar Investigation Cissbury Ring through time” and “Lidar Investigation White Sheet Camp,“ revealing fascinating insights into their true purpose. I have also examined South Cadbury Castle, often linked to the mythical Camelot56.

My research also extends to ancient water management, including the role of canals and other linear earthworks. I have discussed the true origins of Car Dyke in multiple posts, including Car Dyke – ABC News Podcast and Lidar Investigation Car Dyke – North Section, which suggest a Mesolithic origin 2357. I also explore the misidentification of Roman aqueducts, as seen in my posts on the Great Chesters (Roman) Aqueduct. My research has also been greatly informed by my post-glacial flooding hypothesis, which has helped explain landscape transformations over time. I have discussed this hypothesis in several posts, including AI now supports my Post-Glacial Flooding Hypothesis and Exploring Britain’s Flooded Past: A Personal Journey

Finally, my blog also investigates prehistoric burial practices, as seen in Prehistoric Burial Practices of Britain and explores the mystery of Pillow Mounds, often mistaken for medieval rabbit warrens, but with a potential link to Bronze Age cremation in my posts: Pillow Mounds: A Bronze Age Legacy of Cremation? and The Mystery of Pillow Mounds: Are They Really Medieval Rabbit Warrens?. My research also includes astronomical insights into ancient sites, for example, in Rediscovering the Winter Solstice: The Original Winter Festival. I also review new information about the construction of Stonehenge in The Stonehenge Enigma.

Further Reading

For those interested in British Prehistory, visit www.prehistoric-britain.co.uk, a comprehensive resource featuring an extensive collection of archaeology articles, modern LiDAR investigations, and groundbreaking research. The site also includes insights and excerpts from the acclaimed Robert John Langdon Trilogy, a series of books that explore Britain during the Prehistoric period. Titles in the trilogy include The Stonehenge Enigma, Dawn of the Lost Civilisation, and The Post-Glacial Flooding Hypothesis, which offer compelling evidence of ancient landscapes shaped by post-glacial flooding.

To further explore these topics, Robert John Langdon has developed a dedicated YouTube channel featuring over 100 video documentaries and investigations that complement the trilogy. Notable discoveries and studies showcased on the channel include 13 Things that Don’t Make Sense in History and the revelation of Silbury Avenue – The Lost Stone Avenue, a rediscovered prehistoric feature at Avebury, Wiltshire.

In addition to his main works, Langdon has released a series of shorter, accessible publications, ideal for readers delving into specific topics. These include:

For active discussions and updates on the trilogy’s findings and recent LiDAR investigations, join our vibrant community on Facebook. Engage with like-minded enthusiasts by leaving a message or contributing to debates in our Facebook Group.

Whether through the books, the website, or interactive videos, we aim to provide a deeper understanding of Britain’s fascinating prehistoric past. We encourage you to explore these resources and uncover the mysteries of ancient landscapes through the lens of modern archaeology.

For more information, including chapter extracts and related publications, visit the Robert John Langdon Author Page. Dive into works such as The Stonehenge Enigma or Dawn of the Lost Civilisation, and explore cutting-edge theories that challenge traditional historical narratives.

Other Blogs

[sitemap_posts]
Caerfai Promontory Fort – Archaeological Nonsense

Introduction

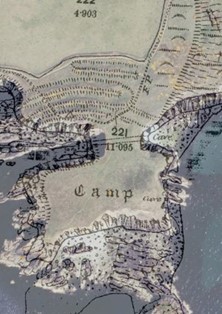
The a repeat episode of Digging for Britain (Season 11) turns its gaze to Caerfai Promontory Fort—also called Penpleidiau—a dramatic headland just southeast of St David’s. On paper, it ticks the usual boxes of a coastal ‘hillfort’. In reality, a closer look reveals that nothing about this site behaves like a fort at all. In fact, its earthworks contradict the defensive story archaeologists keep repeating.(Caerfai Promontory Fort)

All the banks are in the wrong place for a ‘fort’

Perched on a 500-metre-long promontory with cliffs plunging 20 metres into St Bride’s Bay, Caerfai looks impressive. But the classification rests almost entirely on a pair of southern ramparts that supposedly once protected the interior. Two neatly aligned gaps on the eastern side are then assumed—without real evidence—to be the original entrances. (Caerfai Promontory Fort)

Caerfai promontory fort
All the banks are in the wrong place for a ‘Fort’ – Caerfai promontory fort – archaeological nonsense

Things start to unravel once you examine the broader landscape. The crucial eastern sector isn’t shown on LiDAR at all, because archaeologists believe a significant portion of the headland has eroded away. Yet if half the ‘fort’ slid into the sea, why were the remaining earthworks built in positions that made no tactical sense in the first place?

Why fortify sheer cliffs? Why build higher, more exposed banks on the northern side, where an attack is least likely? None of this sits comfortably with a defensive interpretation.

LiDAR makes the ‘fort’ idea even stranger

LiDAR finally gives us the clarity the traditional model avoids. A well-cut external ditch curves from the western cliff edge around to the east, dipping noticeably deeper as it progresses. For a defensive feature, that is the wrong way around. You would expect a consistent depth—or a deeper western section, where an attacker could approach. Instead, the ditch continues beyond the supposed defensive banks, as though it had a purpose unrelated to warfare.

This inconsistent geometry is the hallmark not of a fort, but of a practical working landscape—one shaped by people who were managing boats, not armies. (Caerfai Promontory Fort)

A better explanation: Caerfai as a mooring and haulage site

Caerfai promontory fort
Lidar shows its not defensive – Caerfai promontory fort – archaeological nonsense

Once you strip away the inherited assumptions, a far more coherent picture emerges. The layout makes perfect sense if Caerfai was never meant to be a stronghold, but a coastal facility. A cross-dyke used for mooring, hauling and sheltering boats explains:

  • why the ditch deepens toward the east (for controlled drainage and haulage)
  • why the earthworks extend beyond the ‘entrance gaps’
  • why the cliffs needed no defensive attention
  • and why the banks sit where they do—on the access side, not the seaward side

In rough weather, boats could be pulled up the slope using ropes anchored to the banks, protected from the swell and wind. When conditions improved, they could be lowered back into the water with equal ease.

This interpretation fits the broader maritime pattern emerging across prehistoric Britain: earthworks used not as military constructions, but as practical coastal installations built by seafaring communities who knew the shoreline intimately.

Caerfai is not a fort. It’s archaeological nonsense to call it one. It is, instead, another overlooked piece of Britain’s maritime prehistory—a working harbour in miniature, disguised for decades by the persistence of an outdated story. (Caerfai Promontory Fort)

Offa’s Dyke

This can be seen very clearly in our investigation into Offa’s Dyke where the promortory fort near Chepstow has a similar cross-dyke section that was once interpreted as a ‘defensive ditch’ – the problem is that it is the wrong way if it is defending against the Welsh – so can only have been a cross-dyke for boats to moor at the site.

Caerfai promontory fort - archaeological nonsense
Cross-dyke as is facing away from the Welsh!! -Caerfai promontory fort – archaeological nonsense

In conclusion, the Caerfai Promontory Fort challenges the conventional ‘Hill Fort’ narrative, urging archaeologists to reconsider the purposes of coastal structures. This case study highlights the importance of questioning established interpretations and exploring alternative perspectives in archaeological studies. By unraveling the complexities of Caerfai, we gain valuable insights into the practical functions that may have shaped our ancient landscapes, ultimately enriching our understanding of the past.

(Caerfai Promontory Fort)

Podcast

Author’s Biography

Robert John Langdon, a polymathic luminary, emerges as a writer, historian, and eminent specialist in LiDAR Landscape Archaeology.

His intellectual voyage has interwoven with stints as an astute scrutineer for governmental realms and grand corporate bastions, a tapestry spanning British Telecommunications, Cable and Wireless, British Gas, and the esteemed University of London.

A decade hence, Robert’s transition into retirement unfurled a chapter of insatiable curiosity. This phase saw him immerse himself in Politics, Archaeology, Philosophy, and the enigmatic realm of Quantum Mechanics. His academic odyssey traversed the venerable corridors of knowledge hubs such as the Museum of London, University College London, Birkbeck College, The City Literature Institute, and Chichester University.

In the symphony of his life, Robert is a custodian of three progeny and a pair of cherished grandchildren. His sanctuary lies ensconced in the embrace of West Wales, where he inhabits an isolated cottage, its windows framing a vista of the boundless sea – a retreat from the scrutinous gaze of the Her Majesty’s Revenue and Customs, an amiable clandestinity in the lap of nature’s embrace.

Exploring Prehistoric Britain: A Journey Through Time

My blog delves into the fascinating mysteries of prehistoric Britain, challenging conventional narratives and offering fresh perspectives based on cutting-edge research, particularly using LiDAR technology. I invite you to explore some key areas of my research. For example, the Wansdyke, often cited as a defensive structure, is re-examined in light of new evidence. I’ve presented my findings in my blog post Wansdyke: A British Frontier Wall – ‘Debunked’, and a Wansdyke LiDAR Flyover video further visualizes my conclusions.

My work also often challenges established archaeological dogma. I argue that many sites, such as Hambledon Hill, commonly identified as Iron Age hillforts are not what they seem. My posts Lidar Investigation Hambledon Hill – NOT an ‘Iron Age Fort’ and Unmasking the “Iron Age Hillfort” Myth explore these ideas in detail and offer an alternative view. Similarly, sites like Cissbury Ring and White Sheet Camp, also receive a re-evaluation based on LiDAR analysis in my posts Lidar Investigation Cissbury Ring through time and Lidar Investigation White Sheet Camp, revealing fascinating insights into their true purpose. I have also examined South Cadbury Castle, often linked to the mythical Camelot56.

My research also extends to the topic of ancient water management, including the role of canals and other linear earthworks. I have discussed the true origins of Car Dyke in multiple posts including Car Dyke – ABC News PodCast and Lidar Investigation Car Dyke – North Section, suggesting a Mesolithic origin2357. I also explore the misidentification of Roman aqueducts, as seen in my posts on the Great Chesters (Roman) Aqueduct. My research has also been greatly informed by my post-glacial flooding hypothesis which has helped to inform the landscape transformations over time. I have discussed this hypothesis in several posts including AI now supports my Post-Glacial Flooding Hypothesis and Exploring Britain’s Flooded Past: A Personal Journey

Finally, my blog also investigates prehistoric burial practices, as seen in Prehistoric Burial Practices of Britain and explores the mystery of Pillow Mounds, often mistaken for medieval rabbit warrens, but with a potential link to Bronze Age cremation in my posts: Pillow Mounds: A Bronze Age Legacy of Cremation? and The Mystery of Pillow Mounds: Are They Really Medieval Rabbit Warrens?. My research also includes the astronomical insights of ancient sites, for example, in Rediscovering the Winter Solstice: The Original Winter Festival. I also review new information about the construction of Stonehenge in The Stonehenge Enigma.

Further Reading

For those interested in British Prehistory, visit www.prehistoric-britain.co.uk, a comprehensive resource featuring an extensive collection of archaeology articles, modern LiDAR investigations, and groundbreaking research. The site also includes insights and extracts from the acclaimed Robert John Langdon Trilogy, a series of books exploring Britain during the Prehistoric period. Titles in the trilogy include The Stonehenge Enigma, Dawn of the Lost Civilisation, and The Post Glacial Flooding Hypothesis, offering compelling evidence about ancient landscapes shaped by post-glacial flooding.

To further explore these topics, Robert John Langdon has developed a dedicated YouTube channel featuring over 100 video documentaries and investigations that complement the trilogy. Notable discoveries and studies showcased on the channel include 13 Things that Don’t Make Sense in History and the revelation of Silbury Avenue – The Lost Stone Avenue, a rediscovered prehistoric feature at Avebury, Wiltshire.

In addition to his main works, Langdon has released a series of shorter, accessible publications, ideal for readers delving into specific topics. These include:

For active discussions and updates on the trilogy’s findings and recent LiDAR investigations, join our vibrant community on Facebook. Engage with like-minded enthusiasts by leaving a message or contributing to debates in our Facebook Group.

Whether through the books, the website, or interactive videos, we aim to provide a deeper understanding of Britain’s fascinating prehistoric past. We encourage you to explore these resources and uncover the mysteries of ancient landscapes through the lens of modern archaeology.

For more information, including chapter extracts and related publications, visit the Robert John Langdon Author Page. Dive into works such as The Stonehenge Enigma or Dawn of the Lost Civilisation, and explore cutting-edge theories that challenge traditional historical narratives.

Other Blogs

[sitemap_posts]
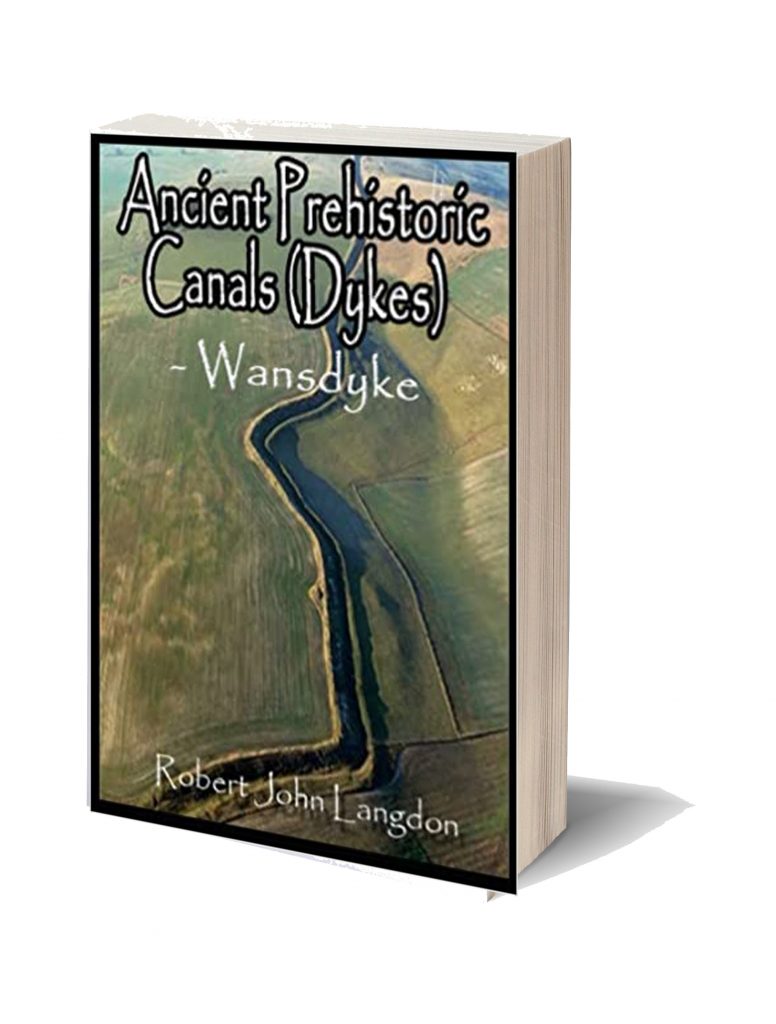
Prehistoric Canals – Wansdyke

Promotional Video – Ancient Prehistoric Canals (Dykes) – Wansdyke

Chapter 1 – Dykes, Ditches and Earthworks

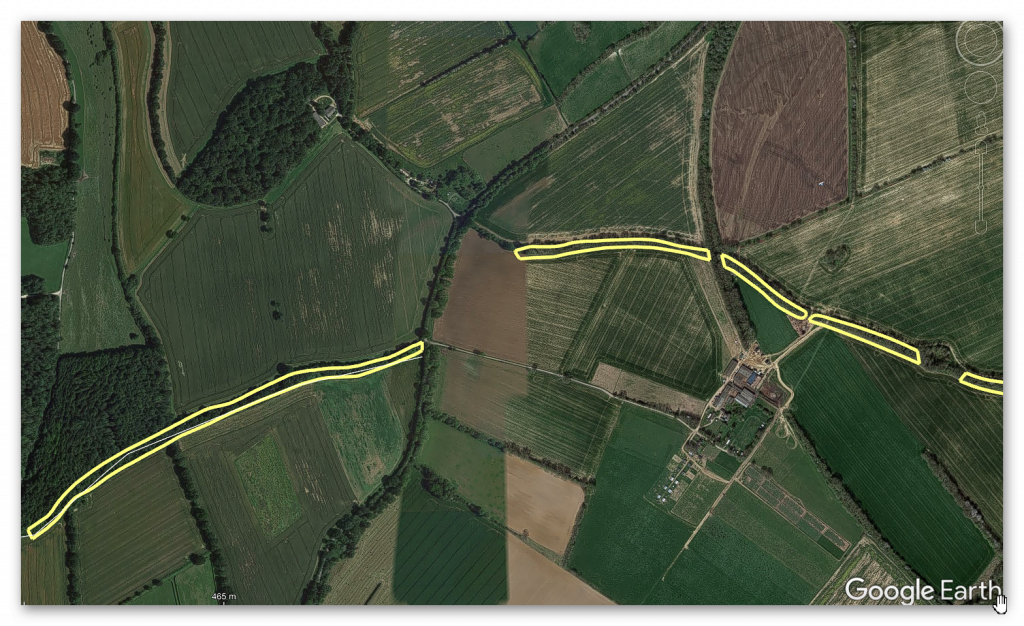
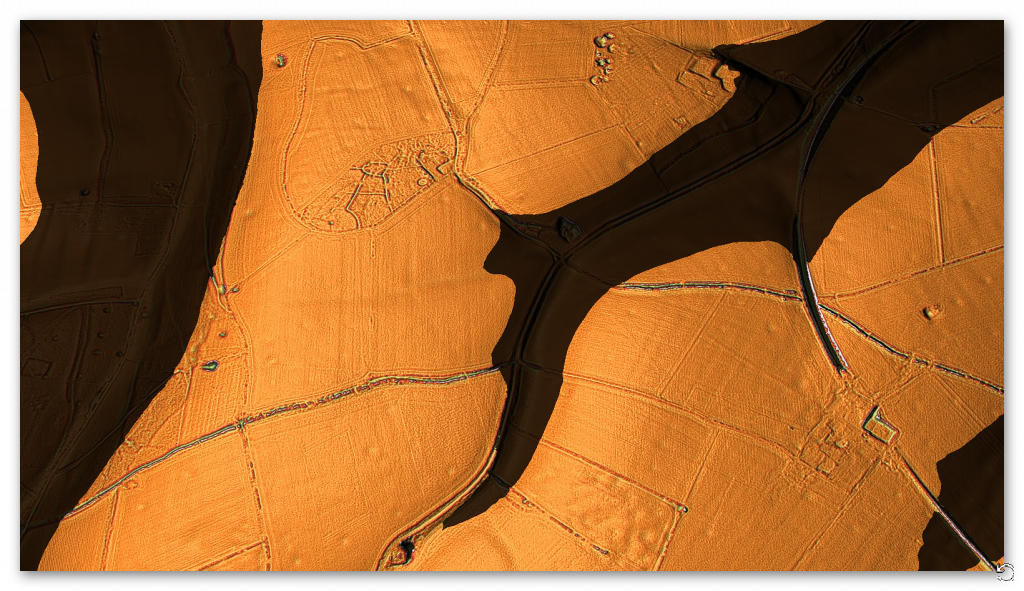
Start of Wansdyke East  -Prehistoric Canals - Wansdyke 2
Start of Wansdyke East – Prehistoric Canals – Wansdyke

The modern word dike or Dyke most likely derives from the Dutch word “dijk”, with the construction of dikes in the Netherlands well attested as early as the 12th century. The 126 kilometres (78 mi) long Westfriese Omringdijk was completed by 1250 and was formed by connecting existing older dikes. The Roman chronicler Tacitus even mentions that the rebellious Batavi pierced dikes to flood their land and protect their retreat (AD 70).  The word dijk initially indicated both the trench and the bank.– Wikipedia

If you study archaeology at university or even on an ordinance survey map at length, you will notice strange earthworks on the sides of hills of Britain, with no rational explanation as to why they are there and for what reason.  These features are mostly ignored at university, or an excuse is made for their construction.  The reality is that these features do not make any sense unless there are other factors in operation which have been ignored.

The first thing to notice is that the word ‘Dyke’ is associated with water.  It does seem strange you would call an earthwork on top of a hill a Dyke, unless there was some history passed down through the years to its actual use.  If we look at the most famous Dyke in Britain, ‘Offa’, we notice that it is attributed to a Saxon King and, therefore, could not be prehistoric.   Or is this a clear indication of how archaeologists find excuses for these features rather than factual, empirical evidence?

“Offa’s Dyke (Welsh: Clawdd Offa) is a massive linear earthwork, roughly followed by some of the current borders between England and Wales. In places, it is up to 65 feet (19.8 m) wide (including its flanking ditch) and 8 feet (2.4 m) in height.  In the 8th century, it formed some kind of delineation between the Anglian kingdom of Mercia and the Welsh kingdom of Powys.” – Wikipedia

At face value, this explanation seems to answer all the questions about Dykes (except the water connection).  But suppose you delve further down to look at the evidence, such as findings from the Dyke and any written history. In that case, you get a different version for the Roman historian Eutropius in his book, Historiae Romanae Breviarium, written around 369 AD, mentions the Wall of Severus, a structure built by Septimius Severus who was Roman Emperor between 193 AD and 211 AD:

“He had his most recent war in Britain, and to fortify the conquered provinces with all security; he built a wall for 133 miles from sea to sea. He died at York, a reasonably old man, in the sixteenth year and third month of his reign.” – Eutropius (369 AD)

This ‘wall’ need not be made of stone as we know from their Scottish endeavours that the first structure as a defence was usually a bank and a ditch – just like a Dyke!!

The problem with this account is that none of the known Roman defences are 133 miles long – Harridan’s Wall is only 70 miles, so are they talking about Offa’s Dyke, which is much longer?

Chapter 2 – The Post-Glacial Flooding Hypothesis

Rise of Sea Levels - Prehistoric Canals - Wansdyke 2
Rise of Sea Levels – Prehistoric Canals – Wansdyke 2

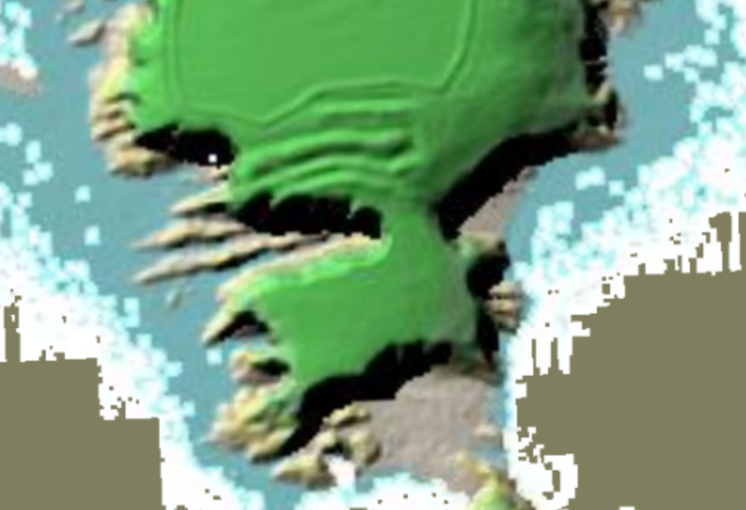
Before we show you what these ‘Linear Earthworks‘ were used for in prehistoric times.  We need to give you an idea of how the environment was at the time of construction and why it is so different today.

In ‘The Post-Glacial Flooding Hypothesis,’ we looked at the new mathematical models that allowed us to calculate the amount of water released during and after the Last Glacial Maximum just over ten thousand years ago.

If the Dykes of Britain are canals (and not markers or defensive ditches), we must prove that the water table was higher in the past than today (otherwise, they would still be flooded).

The models contained in the PGFH showed us that a minimum of 8.42 quadrillion tonnes of water was released on the UK at the end of the last ice age.  This is equivalent to 98425.2 inches of rain falling on every square inch of Britain’s landmass or the same as – One Inch of rain steadily falling every day for the next 270 years

The worst known flooding in British history occurred in 1947 when just six inches of rain (149mm) fell on up to 12″ of snow (so a maximum of 15″ of rain if melted) over three months. The flooding, which inundated nearly all the main rivers in the South, Midlands, and the Northeast of England, was notable for its origins, geographical extent, and duration.

It impacted thirty out of the forty English counties over two weeks, when around 700,000 acres of land flooded. As a result, tens of thousands of people were temporarily displaced from their homes, and thousands of acres of crops were lost; and this was just 15 of the estimated equivalent of 98,425 inches of water that was shed on the British landscape after the last Ice Age. 

Raised Water Table

According to William Donn (Donn et al., 1962). The Fennoscandian and Great Britain ice sheet covered 4.7 106 km2, which is equivalent to: 

•          8.42 106 Gigatonnes of water / 4.7 106 km2, which gives     us 1.79 Gt per km2

•          1.79 Gt of water at a penetration rate of 43%, give us   0.77 Gt of water per km2

•          0.77 Gigatonnes of water by UK landmass 242,495 km² give us 186,804 Gt of groundwater

This water will be released at a rate of 1 – 12mm per annum and possibly at a depth of 75km. Therefore, to release groundwater at a depth of 75km at an average rate of 6mm per annum would take 12,500 years – not the 1,200 years previously believed, which is just the surface water from the last stages of the meltwater ice.

This is why rivers (like the Thames) still flow even after months of drought, as the groundwater is constantly leaking into the river, which was at its highest rate at the start of the Mesolithic, just after the great meltwater floods.

Sea-Level Changes

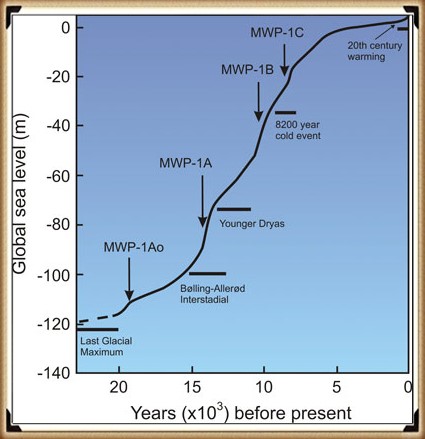
If this model is correct, we should be able to get verification via other empirical evidence, as shown in sea level water rises, to see if it has been constant over the last 12,500 years.

Most geologists and paleoclimatologists, when talking about the end of the last ice age, refer people to the phenomenon called the ‘Meltwater Pulse’ – which is the rapid rise in sea level (20m) between 13,500 and 14,700 years before present, over a 400 – 500 year period. Although it is a tremendous value, it should be recognised that this ‘pulse’ as only 16% of the total sea rise since the end of the last ice age.

Chapter 3 – Hydrology 101

Groundwater Sources - Prehistoric Canals - Wansdyke 2
Groundwater Sources – Prehistoric Canals – Wansdyke

When it comes to the use of ‘linear earthworks’ (we call ‘Dykes’), there is massive confusion amongst both professionals and amateur archaeologists about how such structures could function when they are dry today?

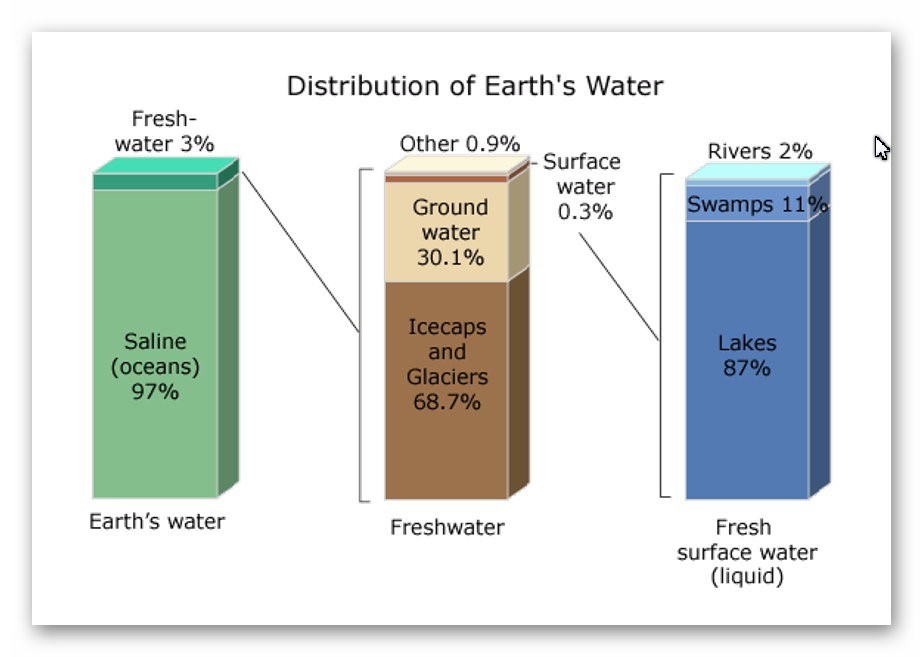
The incorrect perception of these ‘Dykes’ is either they are ‘rivers’ (like the Thames) that flow uphill or Victorian Canals with locks and wooden gates regulating the flow of the water – which are equally nonsensical as a prehistoric structures. Basic Hydrology that most people (should be but not necessarily ALL) learnt at school is that water is under the ground – not just a little water but 30% of all the fresh water on the planet.

This abundance of ‘groundwater’ is evident as it is the source of ALL rivers and supplies the Wells that have been dug since the beginning of time when rivers were absent. Even today, if you go into your garden and dig a hole, it will eventually fill with groundwater, whether in a valley or on top of a hill or mountain.

How and why water is on hills is very challenging for individuals as most people have a simplistic view of water being flat and sitting at ground level – but the earth is a far more complicated structure as this is the reason that it took centuries for people to recognise that we lived on a sphere and not a ‘flat-earth’ as such complex concepts such as gravity are hard to comprehend.

The reality is that ‘streams’ of water are encapsulated within the bedrock allowing ‘springs’ to start rivers at a great height as the groundwater is under pressure and erupts to the surface from BELOW and does not flow up or down the hill internally – but can flow downhill AFTER it escapes from the soil, because at the point of escape gravity then becomes the greater force overcoming the water pressure when within the bedrock – which stops it flowing down the landscape and can push it up to the top of hills and mountains.

Consequently, wells work even on hills as the groundwater is encapsulated in the bedrock and soil. The above illustration shows that if wells are dug halfway up a hill where there is a groundwater pocket, they will fill – if we join up these wells, the entire ditch will also fill with water – sourced from the ground.

The central aspect that must be remembered when considering the reasons behind the construction and maintenance of these earthworks (Dykes) is that the environment was so much different in the Mesolithic Period, which changed rapidly when entering the Neolithic and then even more changes in the Bronze and Iron Ages.

Once the ice sheets had melted and the climate began to warm, the landscape gradually changed from open tundra to dense woodland. By around 8000 BC, pine and birch dominated the woodland cover. These were slowly replaced by lime, elm and oak with some hazel. By 6500 BC, pine and birch woodland would only have been found on the thinner limestone soils of the uplands.

2025 Update – A Quantified Groundwater Decline Model for Stonehenge/Wansdyke/Avebury

Using Radiocarbon-Anchored Hydrological Markers from the Chalk Aquifer

Abstract

This paper presents a quantified model of post-glacial groundwater decline for the Stonehenge–Durrington–Wansdyke chalk block, expressed as groundwater height relative to the modern aquifer baseline.

The model integrates borehole stratigraphy, hydrologically constrained radiocarbon samples, and lateral aquifer continuity to produce a monotonic height–time curve from the early Mesolithic to the Bronze Age. Crucially, the radiocarbon samples used do not date human activity or construction phases, but instead function as groundwater elevation markers, constraining minimum or maximum water levels through time.

This approach resolves long-standing contradictions in the Stonehenge landscape chronology and supersedes interpretive models reliant on typology or isolated C14 dates.

1. Introduction: why groundwater, not monuments

Traditional Stonehenge chronologies rely on radiocarbon dates obtained from pits, artefacts, or infilled features and then interpreted as construction or usage phases. In hydrologically active chalk landscapes, this approach is fundamentally flawed: most dated material records post-formational infilling, not the conditions under which a feature was cut or a landscape functioned.

Instead, this study treats groundwater height as the primary controlling variable. In a laterally continuous chalk aquifer, groundwater level is a regional physical property that constrains what landscapes can exist, what features can function, and when construction is even possible.

The question addressed here is therefore not “when was Stonehenge built?” but:

When did groundwater fall below the elevations required for Stonehenge Bottom, Durrington palaeochannels, and Wansdyke to function as dry features?

2. Methodological principles

2.1 Aquifer continuity

The Upper Chalk beneath Stonehenge, Durrington Walls, and Wansdyke forms a single hydraulically continuous unit. Large-scale groundwater changes are therefore regional, not local. A groundwater level reconstructed at one site applies across the chalk block, adjusted only for topography.

2.2 What radiocarbon dates can and cannot do

Radiocarbon dates are not used here as construction dates. Instead, they are used only where they satisfy all three of the following criteria:

  1. In-situ organic material (preferably plant macrofossils)
  2. Hydrologically controlled context (palaeochannel base, waterlogged organic horizon, peat lens)
  3. Known or stated elevation (OD)

Such samples provide minimum groundwater heights at known times. Samples that fail these criteria (bulk humic sediments, disturbed fills, rootlet-contaminated samples) are explicitly excluded.

3. Data sources

3.1 Borehole stratigraphy (Stonehenge & surrounds)

Borehole logs beneath Stonehenge Bottom and adjacent areas record:

  • Water-derived sediments
  • Solution voids
  • Shell-bearing horizons
  • Prolonged saturation indicators

These demonstrate sustained groundwater levels significantly above modern values during the early Holocene, forming the physical basis of the model.

3.2 Radiocarbon samples used as groundwater markers

The following samples are extracted from the English Heritage Radiocarbon Database and associated ALSF projects. They are not Stonehenge construction dates, but hydrological constraints.

SUERC-10037

  • Date: 8445 ± 40 BP (≈ 7550–7500 cal BC)
  • Material: Waterlogged sediment (humic acid fraction)
  • Context: Gravel-bottomed palaeochannel with organic infill
  • Elevation: +49.55 m OD
  • Interpretation: Early Mesolithic wet ground with persistent saturation

    09d789aa-9fd6-4816-8220-5ac1e62…

SUERC-10038

  • Date: 8575 ± 35 BP (≈ 7600–7580 cal BC)
  • Material: Waterlogged sediment (humin fraction)
  • Context: Same sealed palaeochannel horizon as SUERC-10037
  • Elevation: +49.55 m OD
  • Notes: Minimal reservoir effect; consistent with pollen evidence

    09d789aa-9fd6-4816-8220-5ac1e62…

OxA-15972

  • Date: 7300 ± 40 BP (≈ 6240–6060 cal BC)
  • Material: Waterlogged sediment
  • Context: Palaeochannel infill
  • Interpretation: Channel already inactive; date reflects groundwater fall below channel base

    09d789aa-9fd6-4816-8220-5ac1e62…

OxA-15931

  • Date: 4334 ± 30 BP (≈ 2550–2290 cal BC)
  • Material: Waterlogged sediment (bulk sample)
  • Context: Early infilling after palaeochannel abandonment
  • Interpretation: Minimum age for sustained groundwater decline

    09d789aa-9fd6-4816-8220-5ac1e62…

OxA-15886 (preferred material)

  • Date: 3410 ± 60 BP (≈ 1890–1530 cal BC)
  • Material: Waterlogged plant macrofossil (monocot fragments)
  • Context: Sealed palaeochannel base
  • Significance: Highest-quality hydrological marker in the dataset

    09d789aa-9fd6-4816-8220-5ac1e62…

4. Construction of the H(t) groundwater curve

Groundwater height is expressed relative to today’s mean groundwater level, which already incorporates seasonal variability. This removes the need for uncertainty envelopes and isolates the long-term signal.

The curve is anchored by:

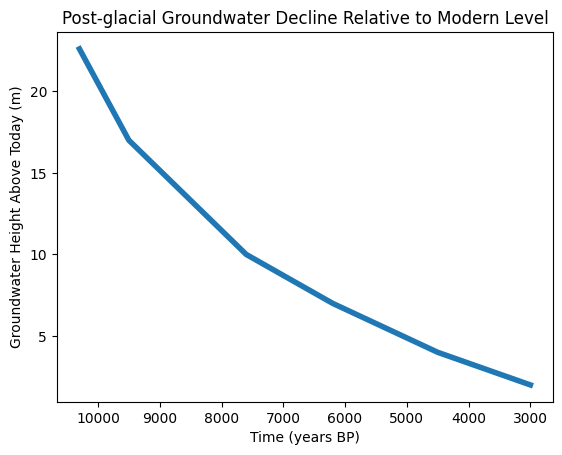
  • A calculated groundwater height of +22.6 m above modern at ~10,300 BP, derived from the linked Stonehenge–Wansdyke hydrological solution
  • Radiocarbon-anchored minimum groundwater levels at successive times

The resulting curve shows:

  • Rapid drawdown during the early Holocene
  • A long, shallow decline through the Mesolithic and Neolithic
  • Final stabilisation near modern levels in the Bronze Age

This curve is monotonic and physically constrained.

5. Results and implications

5.1 Stonehenge Bottom

At groundwater levels ≥ +10 m above modern, Stonehenge Bottom cannot function as a dry landscape. Borehole evidence, molluscs, pollen, and palaeochannels are all consistent with this state during the Mesolithic.

5.2 Durrington Walls

Palaeochannels dated using infill material record the decline of groundwater, not monument construction. When correctly interpreted, these dates support prolonged wet conditions rather than late dryland activity.

5.3 Wansdyke

The groundwater differential observed at Wansdyke is consistent with the same regional water table reconstructed at Stonehenge, reinforcing aquifer continuity and validating the linked model.

6. Why this supersedes traditional models

This approach differs fundamentally from conventional archaeology:

Traditional modelGroundwater model

Isolated C14 dates

Integrated hydrological curve

Interpretive phases

Physically constrained thresholds

Typology-driven

Mathematics-driven

Site-specific

Regionally continuous

Once groundwater height is constrained, many archaeological interpretations become physically impossible, regardless of cultural preference.

7. Conclusion

By treating radiocarbon samples as hydrological markers rather than construction dates, and by anchoring them to a laterally continuous chalk aquifer, it is possible to construct a robust, testable groundwater height–time curve for the Stonehenge landscape.

This model explains:

  • Borehole evidence
  • Molluscan and pollen preservation
  • Palaeochannel persistence
  • Chronological inconsistencies in monument interpretation

The burden of proof now lies not in reinterpretation, but in producing contradictory groundwater mathematics.

Until that is done, the dry-chalk Neolithic model for Stonehenge is not debated — it is superseded.

Case Study Wansdyke – Morgan’s Hill West

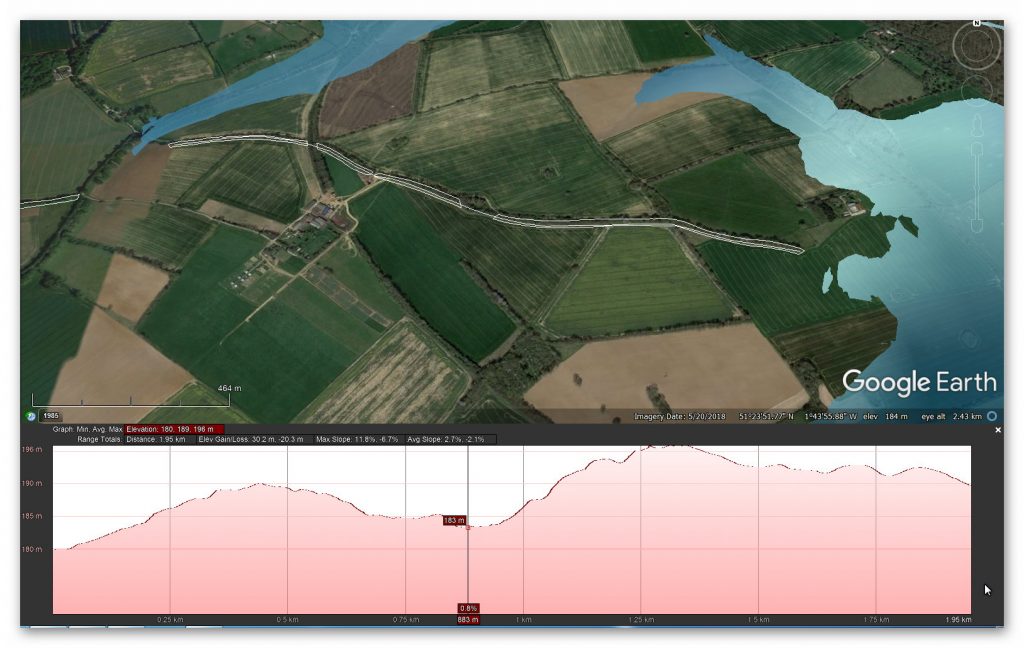
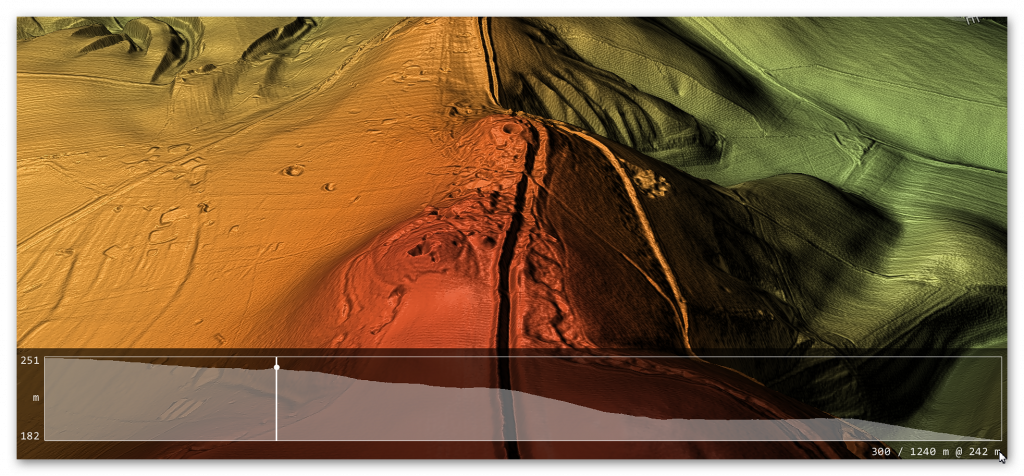
The steepest aspect of Wansdyke is the rise over Morgan’s Hill, which is an incline from 182m OD to 252m OD.

Figure 34 - Morgan Hill West (Wansdyke)  - Prehistoric Canals - Wansdyke 2
Figure 34 – Morgan Hill West (Wansdyke) – Prehistoric Canals – Wansdyke 2

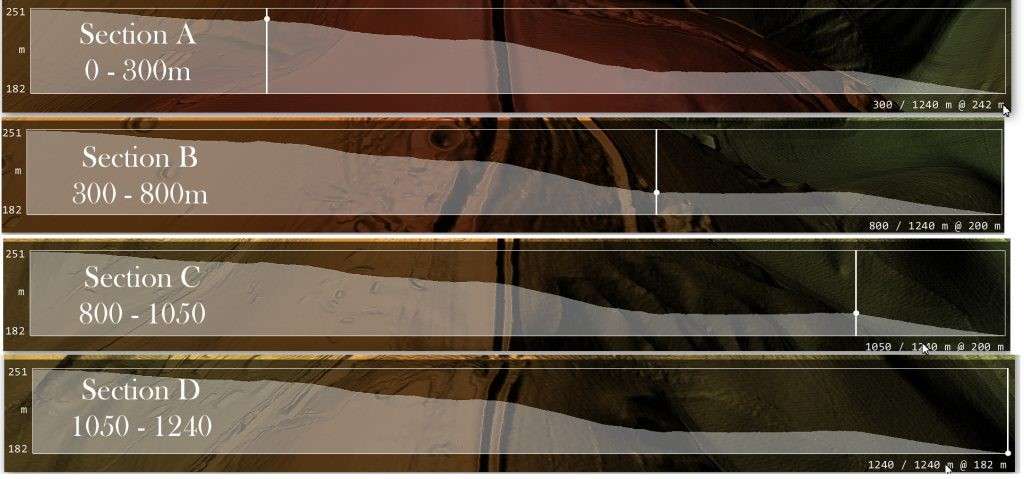
If we are correct with our assumption, we need to show that you can transverse this massive incline using natural springs and basic wooden weirs.  If we split the gradient into four parts, we can see better the profile and problems our ancestors faced.

Prehistoric Canals - Wansdyke 2
Figure 35 Morgan’s Hill West in Sections – Prehistoric Canals – Wansdyke

Section A – 0 to 300 downhill

Length is 300m, and the inclination lowers from 251m OD to 242m OD at a ratio of 3% or 1:33 – If we accept that within this section, we had four cat A ‘springs’ that would release 11.2 cu. metres of water PER SECOND (11,200 litres per second) would fill a 10m ditch that is 1.5 deep by one-metre width of the Dyke’s ditch every SECOND.

According to the mathematical formula (v = k * C * R0.63 * S0.54 ), water at the end of section A would be travelling at 5 MPH – the speed of the Thames at Henley (so quite navigable) and, therefore, no need for any Weirs to reduce the water flow.

Section B – 300 to 800m downhill

This section would receive water at one metre per second from Section A, travelling at 5 MPH – The length of this section is 500m in length, and the inclination lowers from 242m OD to 200m at a ratio of 8% or 1:12 this would accelerate the water to 15 mph which is too fast the navigate uphill. Therefore, a series of weirs would have been placed either under the water or, as the early Victorians achieved, by a paddle weir or both.

An underwater weir (blocking 50% of the water but allowing boats to move over the top without hindrance) would reduce the flow by 50% – so if placed at the End of Section A (at 5 MPH) would reduce the water flow to 2.5 MPH and down to 12.5 MPH at the End of Section B. Consequently, if we place one of these 50% reduction weirs at 100m intervals the water flow would not go over the 5-mph mark and would probably be in the region of 3 – 5 MPH which again is easily navigable.

Chapter 4 – Wansdyke

Wansdyke v Avon and Kennet Canal  - Prehistoric Canals - Wansdyke 2
Wansdyke v Avon and Kennet Canal – Prehistoric Canals – Wansdyke

According to Wikipedia, “Wansdyke consists of two sections of 14 and 19 kilometres (9 and 12 mi) long with some gaps in between. East Wansdyke is an impressive linear earthwork, consisting of a ditch and bank running approximately east-west, between Savernake Forest and Morgan’s Hill. West Wansdyke is also a linear earthwork, running from Monkton Combe south of Bath to Maes Knoll south of Bristol, but less impressive than its eastern counterpart. The middle section, 22 kilometres (14 mi) long, is sometimes referred to as ‘Mid Wansdyke’ but is formed by the remains of the London to Bath Roman road. It used to be thought that these sections were all part of one continuous undertaking, especially during the Middle Ages when the pagan name Wansdyke was applied to all three parts.

East Wansdyke in Wiltshire, on the south of the Marlborough Downs, has been less disturbed by later agriculture and building and remains more clearly traceable on the ground than the western part. Here the bank is up to 4 m (13 ft) high with a ditch up to 2.5 m (8.2 ft) deep. Wansdyke’s origins are unclear, but archaeological data shows that the eastern part was probably built during the 5th or 6th century. That is after the withdrawal of the Romans and before the takeover by Anglo-Saxons. The ditch is on the north side, so presumably it was used by the British as a defence against West Saxons encroaching from the upper Thames Valley westward into what is now the West Country.

West Wansdyke, although the antiquarians like John Collinson considered West Wansdyke to stretch from south East of Bath to the west of Maes Knoll, a review in 1960 considered that there was no evidence of its existence to the west of Maes Knoll.   Keith Gardner refuted this with newly discovered documentary evidence.  In 2007 a series of sections were dug across the earthwork which showed that it had existed where there are no longer visible surface remains.

It was shown that the earthwork had a consistent design, with stone or timber revetment. There was little dating evidence, but it was consistent with either a late Roman or post-Roman date. A paper in “The Last of the Britons” conference in 2007 suggests that the West Wansdyke continues from Maes Knoll to the hill forts above the Avon Gorge and controls the crossings of the river at Saltford and Bristol as well as at Bath.

As there is little archaeological evidence to date the western Wansdyke, it may have marked a division between British Celtic kingdoms or have been a boundary with the Saxons. The evidence for its western extension is earthworks along the north side of Dundry Hill, its mention in a charter and a road name.

Sections covered in the Book - Prehistoric Canals - Wansdyke 2
Sections covered in the Book – Prehistoric Canals – Wansdyke

Section 1

HE:1003784 Wansdyke: section 610yds (560m) NW of Wernham Farm to 250yds (230m) SW of New Buildings (560m = 1680 working days – 20 men taking 84 days to complete)

Figure 44 Wansdyke NW of Wernham (with added water levels)  - Prehistoric Canals - Wansdyke 2
Figure 44 Wansdyke NW of Wernham (with added water levels) – Prehistoric Canals – Wansdyke


No, HE Historic Details or Excavations Registered

OS Map

1800 OS Map -Prehistoric Canals - Wansdyke 2
Prehistoric Canals – Wansdyke

1800 OS Map

OS Map -Prehistoric Canals - Wansdyke 2
Prehistoric Canals – Wansdyke

LiDAR Map

LiDAR Map -Prehistoric Canals - Wansdyke 2
Prehistoric Canals – Wansdyke

LiDAR (with Mesolithic water levels)

Prehistoric Canals - Wansdyke 2
Prehistoric Canals – Wansdyke

A feature called ‘firs’ is a gap on the OS Map – there is a strange quarry pit (no relevant substances under the surface to quarry?) – this pit is two metres deep and probably built later to the original ditch.


Are we looking for a hole to find the groundwater to keep the canal working with fresh water? As we will discover, this is not the first pit cut deep on the line of Wansdyke.


The Mesolithic water levels certainly explain the strange start of Wansdyke and the unexplained gaps (if it’s not a canal) in the Dyke.


Notice on the LiDAR maps the extensive ‘pits’ surrounding the Dyke, which are not below the Mesolithic river shoreline and are 14m in diameter.

Figure 45 - Quarry pits found in Paleochannels  - Prehistoric Canals - Wansdyke 2
Figure 45 – Quarry pits found in Paleochannels – Prehistoric Canals – Wansdyke

These features seem to be connected to even larger quarry holes (some under the Mesolithic shoreline), indicating that minerals have been extracted here for thousands of years and may be the reason for the Dykes construction to take minerals away – as have also found these pits in other mineral-rich areas of Britain such as Hadrian’s Wall.


Durrington Walls


The pits are about 20m in diameter and up to 5m deep, as revealed by further geophysical surveys using ground-penetrating radar and mechanical coring around Durrington Walls. Small quantities of struck flint, shell, and animal bone have been recovered from them, with the bone providing radiocarbon dates from about 2500 BC to 1200 BC.

Prehistoric Canals - Wansdyke 2
Prehistoric Canals – Wansdyke

What we see is that this type of quarrying was commonplace in the past and has confused archaeologists – but as this was a trading nation, the solution is evident and straightforward. 


Gap in the Dyke route

At the end of Section 1, we find the first gap (if you exclude the massive gap at the start of the Dyke) – this gap appears as the Dyke dips into a paleochannel. The obvious conclusion for the break in Wansdyke is that it must have been full of water at the construction time.

Prehistoric Canals - Wansdyke 2
Prehistoric Canals – Wansdyke
Figure 46 - Mesolithic Water levels show gap disappears - Prehistoric Canals - Wansdyke 2
Figure 46 – Mesolithic Water levels show gap disappears – Prehistoric Canals – Wansdyke
Ancient Prehistoric Canals - Wansdyke (The Book) -Prehistoric Canals - Wansdyke 2
Ancient Prehistoric Canals – Wansdyke (The Book) – Prehistoric Canals – Wansdyke 2

This was an extracts from the NEW Book Ancient Prehistoric Canals (Dykes) – Wansdyke available on Amazon as a FULL COLOUR HARD BACK (£19.95) or a ECONOMY (£4.99) SOFTBACK black and white VERSION – it is also available as a KINDLE (£1.99) book. For further information about our work on Prehistoric Britain visit our WEBSITE or VIDEO CHANNEL.

Book Details

  • ASIN ‏ : ‎ B0BF31GQKC
  • Publisher ‏ : ‎ Independently published (18 Sept. 2022)
  • Language ‏ : ‎ English
  • Hardcover ‏ : ‎ 134 pages
  • ISBN-13 ‏ : ‎ 979-8353488897
  • Dimensions ‏ : ‎ 15.24 x 1.3 x 22.86 cm
  • Illustrations: 85
  • Customer reviews: 5.0 out of 5 stars    1 rating

Podcast

Author’s Biography

Robert John Langdon, a polymathic luminary, emerges as a writer, historian, and eminent specialist in LiDAR Landscape Archaeology.

His intellectual voyage has interwoven with stints as an astute scrutineer for governmental realms and grand corporate bastions, a tapestry spanning British Telecommunications, Cable and Wireless, British Gas, and the esteemed University of London.

A decade hence, Robert’s transition into retirement unfurled a chapter of insatiable curiosity. This phase saw him immerse himself in Politics, Archaeology, Philosophy, and the enigmatic realm of Quantum Mechanics. His academic odyssey traversed the venerable corridors of knowledge hubs such as the Museum of London, University College London, Birkbeck College, The City Literature Institute, and Chichester University.

In the symphony of his life, Robert is a custodian of three progeny and a pair of cherished grandchildren. His sanctuary lies ensconced in the embrace of West Wales, where he inhabits an isolated cottage, its windows framing a vista of the boundless sea – a retreat from the scrutinous gaze of the Her Majesty’s Revenue and Customs, an amiable clandestinity in the lap of nature’s embrace.

Exploring Prehistoric Britain: A Journey Through Time

My blog delves into the fascinating mysteries of prehistoric Britain, challenging conventional narratives and offering fresh perspectives based on cutting-edge research, particularly using LiDAR technology. I invite you to explore some key areas of my research. For example, the Wansdyke, often cited as a defensive structure, is re-examined in light of new evidence. I’ve presented my findings in my blog post Wansdyke: A British Frontier Wall – ‘Debunked’, and a Wansdyke LiDAR Flyover video further visualizes my conclusions.

My work also often challenges established archaeological dogma. I argue that many sites, such as Hambledon Hill, commonly identified as Iron Age hillforts are not what they seem. My posts Lidar Investigation Hambledon Hill – NOT an ‘Iron Age Fort’ and Unmasking the “Iron Age Hillfort” Myth explore these ideas in detail and offer an alternative view. Similarly, sites like Cissbury Ring and White Sheet Camp, also receive a re-evaluation based on LiDAR analysis in my posts Lidar Investigation Cissbury Ring through time and Lidar Investigation White Sheet Camp, revealing fascinating insights into their true purpose. I have also examined South Cadbury Castle, often linked to the mythical Camelot56.

My research also extends to the topic of ancient water management, including the role of canals and other linear earthworks. I have discussed the true origins of Car Dyke in multiple posts including Car Dyke – ABC News PodCast and Lidar Investigation Car Dyke – North Section, suggesting a Mesolithic origin2357. I also explore the misidentification of Roman aqueducts, as seen in my posts on the Great Chesters (Roman) Aqueduct. My research has also been greatly informed by my post-glacial flooding hypothesis which has helped to inform the landscape transformations over time. I have discussed this hypothesis in several posts including AI now supports my Post-Glacial Flooding Hypothesis and Exploring Britain’s Flooded Past: A Personal Journey

Finally, my blog also investigates prehistoric burial practices, as seen in Prehistoric Burial Practices of Britain and explores the mystery of Pillow Mounds, often mistaken for medieval rabbit warrens, but with a potential link to Bronze Age cremation in my posts: Pillow Mounds: A Bronze Age Legacy of Cremation? and The Mystery of Pillow Mounds: Are They Really Medieval Rabbit Warrens?. My research also includes the astronomical insights of ancient sites, for example, in Rediscovering the Winter Solstice: The Original Winter Festival. I also review new information about the construction of Stonehenge in The Stonehenge Enigma.

Further Reading

For those interested in British Prehistory, visit www.prehistoric-britain.co.uk, a comprehensive resource featuring an extensive collection of archaeology articles, modern LiDAR investigations, and groundbreaking research. The site also includes insights and extracts from the acclaimed Robert John Langdon Trilogy, a series of books exploring Britain during the Prehistoric period. Titles in the trilogy include The Stonehenge Enigma, Dawn of the Lost Civilisation, and The Post Glacial Flooding Hypothesis, offering compelling evidence about ancient landscapes shaped by post-glacial flooding.

To further explore these topics, Robert John Langdon has developed a dedicated YouTube channel featuring over 100 video documentaries and investigations that complement the trilogy. Notable discoveries and studies showcased on the channel include 13 Things that Don’t Make Sense in History and the revelation of Silbury Avenue – The Lost Stone Avenue, a rediscovered prehistoric feature at Avebury, Wiltshire.

In addition to his main works, Langdon has released a series of shorter, accessible publications, ideal for readers delving into specific topics. These include:

For active discussions and updates on the trilogy’s findings and recent LiDAR investigations, join our vibrant community on Facebook. Engage with like-minded enthusiasts by leaving a message or contributing to debates in our Facebook Group.

Whether through the books, the website, or interactive videos, we aim to provide a deeper understanding of Britain’s fascinating prehistoric past. We encourage you to explore these resources and uncover the mysteries of ancient landscapes through the lens of modern archaeology.

For more information, including chapter extracts and related publications, visit the Robert John Langdon Author Page. Dive into works such as The Stonehenge Enigma or Dawn of the Lost Civilisation, and explore cutting-edge theories that challenge traditional historical narratives.

Other Blogs

[sitemap_posts]
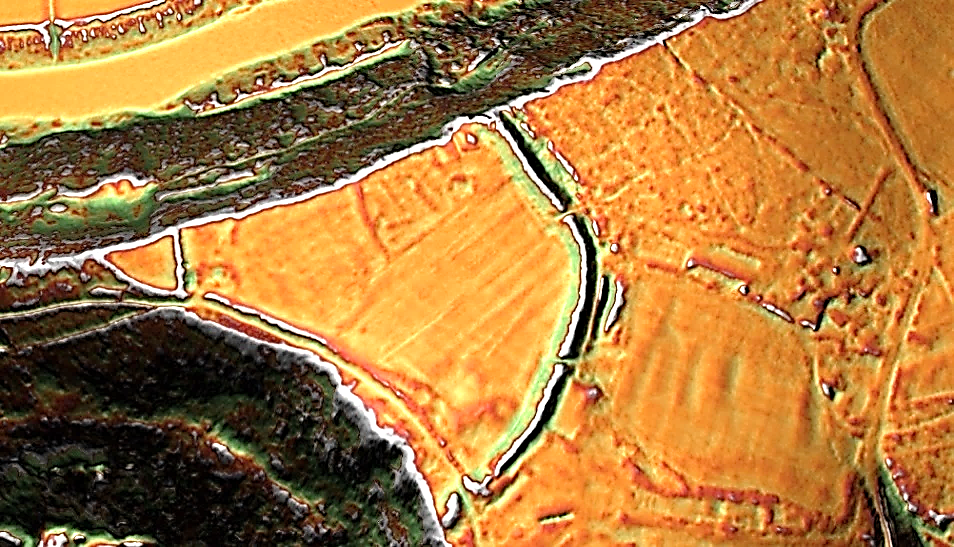
The Great Dorchester Aqueduct Hoax

Introduction

The feature long attributed to the Dorchester Roman aqueduct presents a fascinating but contentious case within archaeology. Its winding route, peculiar design, and unsubstantiated functional claims challenge conventional interpretations of Roman engineering in Britain. In this blog, we delve into key aspects of the feature, including its gradient, design, and capacity to deliver water, to uncover whether it truly served as an aqueduct or had a different purpose entirely. By critically examining the evidence and incorporating modern methodologies like LiDAR, we aim to provide a fresh perspective on this enigmatic structure. (The Great Dorchester Aqueduct Hoax)

The first question we address is the gradient of the watercourse, a critical factor for any functioning aqueduct. The report claims a 1:2700 gradient ratio, yet an elevation analysis reveals inconsistencies, with over 14 peaks along the route that would obstruct continuous water flow. Without evidence of additional water sources, such as springs or siphons, the practicality of this gradient as a reliable mechanism for water transport is highly questionable. Understanding whether these claims hold up under scrutiny is essential to reassessing the feature’s functionality.

Next, we investigate the watercourse design, which deviates significantly from typical Roman aqueducts. Rather than following a direct route, it hugs the hillsides in a winding path, much like Linear Earthworks or dykes. This design raises questions about whether it was intended for water transport or repurposed from an earlier feature. Comparing its structure to other earthworks, such as the Car Dyke, may offer insights into its original purpose and whether it truly served the Roman settlement at Dorchester.

We also examine the capacity of the aqueduct to deliver water to its destination. The report provides dimensions for a one-meter-wide section of the channel but fails to calculate flow rates or compare this with the water supply from the River Frome or wells. This omission highlights a recurring issue in archaeological reporting: the lack of practical, critical analysis of large-scale constructions’ economic and logistical considerations. Understanding the volume and practicality of water delivery is essential to determine whether this feature justified the investment in labour and resources.

Finally, we explore an alternative interpretation of the feature, informed by comparisons to other earthworks like Offa’s Dyke and Wansdyke. Often assumed to have continuous, singular functions, these structures have been reinterpreted as fragmented constructions with economic purposes, such as transporting minerals or resources. The proximity of quarry pits and the feature’s connection to Poundbury suggest it may have played a role in trade or resource transport rather than as a water conduit. This broader context challenges the long-held assumption of its Roman origins and function.

Through this analysis, we aim to uncover the realities behind the Dorchester watercourse, questioning assumptions and presenting evidence-based interpretations. By applying modern methods and critical thinking, we seek to highlight the complexities of such archaeological features and the potential for misattribution in historical narratives. (The Great Dorchester Aqueduct Hoax)

A Source of Confusion: New Archaeological Evidence for the Dorchester Aqueduct

This research paper re-examines the Dorchester Roman aqueduct, a famous but incompletely understood water system in Britain. Utilizing new geophysical surveys, LiDAR data, and GIS analysis, the authors reassess previously proposed aqueduct routes and water sources. They challenge earlier interpretations, particularly those of Bill Putnam, by presenting evidence that extends the aqueduct’s known length and suggests a different origin point near Notton on the River Frome. This work integrates a century’s worth of archaeological research with modern technology for a more comprehensive understanding. A trial excavation supports these findings.

Briefing Document: Dorchester Aqueduct Re-evaluation

1. Introduction

This document summarizes the key findings of a recent study re-examining the Dorchester Aqueduct, a well-known Roman watercourse in Britain. The study, conducted by Harry Manley, Paul Cheetham, Dave Stewart, and Miles Russell, utilizes new geophysical and topographic data, along with a reappraisal of past excavations, to challenge previous assumptions about the aqueduct’s route and water source. The document highlights the study’s methodology, findings, and their implications.

 (The Great Dorchester Aqueduct Hoax)
(The Great Dorchester Aqueduct Hoax)

2. Background: The Dorchester Aqueduct & Previous Investigations

  • Significance: The Dorchester Aqueduct is described as “arguably the most famous and well-examined Roman watercourse in Britain,” though it’s also noted that Roman aqueducts in Britain are generally “a comparatively poorly understood element of the provincial civilian infrastructure.”
  • Purpose of Aqueducts: Roman aqueducts were essential for supplying water to towns and forts, especially bathhouses. These systems operated by gravity, channeling water from a source to its destination. While less grand than those in Gaul and Spain, British aqueducts were a point of civic pride.
  • Past Investigations: Investigations have occurred sporadically over the last 100 years, particularly in the 1990s with Bill Putnam’s work. However, the upper reaches and the water source(s) of the aqueduct have remained a source of debate.
  • Conflicting Theories on Water Source: Several sources have been proposed, including:
  • Foxlease Withybed (Coates)
  • Notton Mill (Foster)
  • Stream at Steppes Farm (Farrar)
  • Spring at Nunnery Mead (Sparey-Green)
  • Artificial lake near Steppes Farm (Putnam) – Note: This was Putnam’s conclusion after extensive work, including his suggestion of a dam.

3. New Research Approach & Methodology

  • New Research Project: In 2020, a research project was initiated by Bournemouth University to clarify the aqueduct’s route in its upper section and determine the water source.
  • Integrated Approach: This project used a combination of:
  • GIS-based landscape modeling
  • Airborne Laser Scanning (ALS/LiDAR) data
  • Geophysical surveys (magnetometry and Ground Penetrating Radar – GPR)
  • Targeted excavation
  • Integration with existing historical and archaeological evidence.
  • GIS for Data Management: A GIS (Geographic Information System) was created to manage spatial datasets, allowing the synthesis and viewing of different data layers (LiDAR, geophysical survey data, aerial photographs, excavation records, etc.).
  • Hydrological Modeling: High-resolution LiDAR data was used to create detailed ground surface contours, allowing for accurate hydrological modeling. This model enabled a more precise analysis of potential aqueduct routes by examining slope gradients.
  • They created a model that assumed a constant gradient, based on a 7.2m elevation change over a 20km distance, resulting in a 0.1m vertical change every 270m horizontally.
  • This hydrological model allowed the research team to compare the theorized routes of previous researchers and understand the validity of their suggested routes.
(The Great Dorchester Aqueduct Hoax)

4. Key Findings & Analysis

  • Re-evaluation of Previous Routes: The hydrological model was used to evaluate the routes proposed by Coates, Foster/Farrar, Sparey-Green, and Putnam.
  • Problems with Previous Interpretations:Coates, Foster/Farrar: Their routes diverge from the hydrological model in Steppes Bottom, particularly their trajectory up the eastern flank of the coombe before returning to Steppes Bottom.
  • Sparey-Green: His suggested source at Nunnery Mead doesn’t fit the hydrological model, dropping too quickly in elevation to be a viable source for the aqueduct.
  • Putnam: The study challenges Putnam’s conclusions by showing that his 1992 excavation trench in Steppes Bottom was located ~250m too far upslope, based on the current hydrological model. This meant that he never encountered the actual aqueduct route, leading to his conclusion that the aqueduct did not extend beyond the bottom of the valley. Additionally, an earthwork interpreted by Putnam as a medieval water channel is now seen as potentially part of the Roman aqueduct. The hydrological model suggests this earthwork was actually part of the aqueduct, based on its close alignment.
  • Geophysical Survey & Excavation at Nunnery Mead:Magnetometry: Revealed a linear anomaly (Anomaly A) consistent with a buried structure running along a contour line on the hillside and not a boundary marker.
  • GPR: Confirmed Anomaly A as a cut feature with terrace deposits and a clay lining.
  • Excavation (Trench 1): The evaluation trench exposed a terraced cut feature containing clay layers surrounding a soil core with evidence of decayed wooden planks, indicating a constructed channel. This feature aligned with the magnetic and GPR anomalies.
  • Aqueduct Construction at Nunnery Mead:The aqueduct at Nunnery Mead is consistent with Putnam’s ‘Phase 1b’ typology and thus Roman in origin.
  • The channel is approximately 1.0m wide and 0.35m deep.
  • Wooden planks formed a box-shaped conduit.
  • Clay was used for lining and bedding layers.
  • Constructed on a terraced platform cut into the hillside to aid construction.
  • Implications for Water Source: The excavation at Nunnery Mead extends the aqueduct’s route further upstream than previously established. It also challenges the theory that the source was at Steppes Bottom. The authors suggest that the aqueduct may have continued to Notton on the River Frome.

5. Key Quotes

  • “Although the locations of the lower sections of the aqueduct as it approaches Dorchester are well known, the upper reaches… are less visible in the landscape and can only be inferred using elevation data and archaeological excavation.”
  • “Each of these suggested sources will be reviewed here in the light of current research by the authors.”
  • “The availability of elevation data through ALS using LiDAR has allowed archaeologists to investigate ground surface microtopography in greater detail than traditional survey methods and over larger spatial extents.”
  • “The hydrological model derived from airborne laser scanning has produced a theoretical route of the aqueduct based upon an assumed gradient. This model has, for the first time, provided a basis for a critical evaluation of each of the different conjectured aqueduct routes…”
  • “Not finding the aqueduct where it was expected to be in Barrow Plantation cemented in Putnam’s mind the idea that the aqueduct did not continue west of Steppes Bottom to a source at Notton, and therefore influenced his fieldwork strategy and interpretations for the rest of his research project.”
  • “The archaeological evidence found in Trench 1 suggests that the Dorchester Aqueduct continues up the Frome valley to at least Nunnery Mead.”
  • “The location of the aqueduct at Nunnery Mead demonstrates that Putnam’s assertion that the source of the water was further downstream at Steppes Bottom must now be questioned.”
(The Great Dorchester Aqueduct Hoax)

6. Conclusions and Further Work

  • Challenging Established Ideas: The study demonstrates that previous interpretations, particularly those by Bill Putnam, were likely based on incomplete data and potentially mislocated excavations.
  • New Route: The study has extended the known route of the aqueduct to at least Nunnery Mead and suggests a source further upstream at Notton on the River Frome.
  • Importance of Integrated Approach: The study shows the value of combining GIS, LiDAR, geophysical surveys, and excavation data for accurate analysis.
  • Future Research:Integration of Putnam’s original excavation archive into their research.
  • Further geophysical and topographic surveys west of Nunnery Mead and at Notton are planned.
  • Reassessment of the construction phases and chronology of the aqueduct.

7. Implications

This research significantly revises our understanding of the Dorchester Aqueduct, providing a more accurate route and questioning the previously held theory of a source at Steppes Bottom. This has implications for the understanding of Roman engineering capabilities and civic infrastructure, demonstrating the importance of re-examining past research with new data and technologies.

This briefing document provides a comprehensive overview of the key findings and implications of the research. It emphasizes the value of the new research methods employed and challenges previous interpretations of the Dorchester Aqueduct, setting the stage for future research. (The Great Dorchester Aqueduct Hoax)

Our analysis

When you first examine the suspected “Roman Aqueduct” route, the most striking feature is its winding, irregular path that follows the elevated land of the flooded River Terrace. It hardly resembles the precise, straight lines we associate with Roman civil engineering, especially considering the presence of a few straight Roman roads running parallel to sections of this feature.

Reading through the accompanying document only deepens this scepticism. Much of the information presented is speculative, despite their commendable efforts to correct earlier, flawed conclusions that failed to meet the standards of modern archaeology. Ironically, the report falls short in some fundamental aspects, omitting key details you would expect in a thorough, contemporary archaeological study.

The authors emphasise using modern methods like LiDAR to investigate the site. However, the quality of their LiDAR data raises questions. The report’s illustrations, which should provide clarity and enhance understanding, fail to leverage the full potential of high-resolution LiDAR. This is a significant oversight, as high-resolution data is crucial for precise analysis. Using such tools to critique their findings, it becomes apparent that there are substantial gaps in their critical analysis of the site and their conclusions. (The Great Dorchester Aqueduct Hoax)

Elevation Map

When examining a water feature like an aqueduct, the key consideration is its ability to transport water effectively from a higher altitude to its intended destination. This requires a steep gradient to ensure a consistent flow while avoiding issues like blockages, leaks, or the need to overcome uphill sections, which would require additional force to move the water.

However, the information provided is surprisingly sparse when we look for detailed calculations on the gradient and flow dynamics used in this case. Here’s how AI interpreted the document and its explanation of the gradient:(The Great Dorchester Aqueduct Hoax)

The researchers calculated the gradient of the Dorchester aqueduct using a combination of LiDAR-derived topographic data, hydrological modelling, and GIS analysis. Here’s the process they followed, as described in the PDF:


1. LiDAR Data for High-Resolution Topography

  • They used Airborne Laser Scanning (LiDAR) to produce a detailed Digital Terrain Model (DTM) of the landscape. The LiDAR data provided a spatial resolution of 1 meter horizontally and allowed for precise identification of ground surface contours.
  • These contours revealed the microtopography of the Frome Valley and areas through which the aqueduct passed, even where surface traces of the aqueduct were no longer visible.

2. Defining Elevation Ranges

  • They determined the approximate elevation range of the aqueduct by analyzing its known locations and projecting where it likely ran.
  • The aqueduct’s inferred elevation ranged from 76.2 meters to 83.4 meters above Ordnance Datum (OD) over its course.

3. Hydrological Modeling with GIS

  • The researchers used GIS software to model a theoretical route for the aqueduct. They calculated a constant gradient by dividing the total elevation drop (about 7.2 meters) by the horizontal length of the aqueduct (approximately 20 kilometers).
  • This yielded a gradient of 0.1 meters drop per 270 meters of horizontal distance (1:2700), which aligns with standard Roman aqueduct construction principles.

4. Contour Line Tracing

  • Starting at the presumed water source near Notton, they traced the 83.4-meter contour line for 270 meters before stepping down by 0.1 meters to the next contour.
  • This process was repeated until they reached the aqueduct’s end at Dorchester, allowing them to project the likely course while respecting the calculated gradient.

5. Comparison with Conjectured Routes

  • The calculated gradient was compared to previous conjectured routes proposed by earlier researchers. Where the gradient of older routes diverged significantly, these were flagged as incorrect or improbable.

Summary of Method

This method ensured a scientifically consistent approach to mapping the aqueduct’s route, balancing the need for a manageable slope with the constraints of the landscape. However, the document acknowledges that earlier calculations and trench placements by researchers like Bill Putnam were misaligned with the actual gradient, leading to some erroneous conclusions in the past.

According to the PDF, the estimated gradient of the Dorchester aqueduct is approximately 0.1 meters of elevation drop per 270 meters of horizontal distance (1:2700). This gentle slope was carefully designed to ensure a steady flow of water while minimizing erosion and loss of water due to overflow. (The Great Dorchester Aqueduct Hoax)

Implications of This Gradient

  • Sustainability: A gradient this shallow is typical for Roman aqueducts, as it balances maintaining water flow with the need to manage the terrain.
  • Engineering Precision: Achieving such a consistent gradient over a long distance (approximately 20 km) would have required precise surveying and construction techniques.

Flow Rate: While gentle, this gradient was sufficient to provide a continuous supply of water, assuming proper maintenance and minimal interruptions in the channel.

Conclusion

So what we have is that – Starting at the presumed water source near Notton, they traced the 83.4-meter contour line for 270 meters before stepping down by 0.1 meters to the next contour – This yielded a gradient of 0.1 meters drop per 270 meters of horizontal distance (1:2700), which aligns with standard Roman aqueduct construction principles. The problem is that the Route is not 270m long it’s 18,482m long. To see how this would have looked, we traced the path of the supposed Aqueduct in our LiDAR mapping facility and created an elevation map to see if this conclusion was accurate. (The Great Dorchester Aqueduct Hoax)

(The Great Dorchester Aqueduct Hoax)
Path of the Dorchester Aqueduct – (The Great Dorchester Aqueduct Hoax)
(The Great Dorchester Aqueduct Hoax)
Elevation map of the Aqueduct – (The Great Dorchester Aqueduct Hoax)

The elevation map reveals that the aqueduct’s route does not maintain the claimed 1:2700 gradient ratio throughout its course. Contrary to the report’s assertions, the aqueduct would not be capable of carrying water unaided, as there are over 14 elevation peaks along the route that would obstruct the flow. The report fails to address these inconsistencies or explain how these obstacles could have been overcome.

Volume of Water Obtained

The next crucial aspect to examine is whether the gradient issues could have been mitigated by another, unmentioned source of additional water, such as siphons or natural springs, and whether the volume of water to be delivered justified the aqueduct’s construction over existing sources like wells or the nearby River Frome. The PDF outlines the duct dimensions used but provides no flow rate calculations that could be compared to the natural water supply already available at the site. This omission raises significant concerns. It reflects a broader issue in archaeology, where critical thinking about large-scale constructions’ practicalities and economic feasibility is often overlooked.

Societies, even ones reliant on slave labour like the Romans, did not build such infrastructure without weighing the costs in workforce and resources. Every project required justification, whether financial, logistical, or functional. Ignoring these commercial and societal factors limits our understanding of why specific constructions were prioritised over alternatives, such as using existing water sources or repurposing other features. For instance, if the aqueduct were not primarily for drinking water but for transporting minerals or other resources to the fort, this would fundamentally alter its interpretation. Historians and archaeologists must factor in these considerations to better understand the motivations and economics behind such constructions.

The Reoprt suggests (according to AI)

Dimensions of the Aqueduct

  • Channel Dimensions: The aqueduct had a wooden, box-shaped conduit approximately 1 meter wide and 0.35 meters deep. This size would have determined the volume of water that could flow through it at any given time.
  • Terracing and Gradient: The aqueduct followed a gentle gradient of approximately 1:2700, which would influence the velocity and flow rate of water.

Implications for Volume and Flow Rate

  • Using the channel dimensions (1 m x 0.35 m) and assuming a steady flow, the cross-sectional area of the channel would be approximately 0.35 square meters.
  • The flow rate would depend on the gradient and the channel’s condition (e.g., smoothness of the lining and obstructions), but the document does not provide detailed hydrological calculations or estimates.

Missing Data in the Report

The PDF does not include:

  • Any calculations of the discharge rate (e.g., cubic meters per second) based on the gradient and channel dimensions.
  • An estimate of how much water would be available at the terminal point in Dorchester, or any adjustment for water loss due to evaporation, leakage, or seepage along the 20 km route.

Conclusion

Unfortunately, the report fails to address the fundamental aspects required for a thorough analysis, focusing only on a small section to calculate the flow rate (as we saw ith the gradient calculations). This limited approach is inadequate for a modern study, especially one likely to be used as a foundation for future analysis and citations.

By applying LiDAR to the existing sections of the feature, we can gain a more accurate understanding of the true size of these water ducts along the entire route. This broader analysis will provide better insights than relying on a single segment, which may have been altered over time and might not reflect the original structure. This is yet another critical consideration that archaeologists often overlook in their assessments.

(The Great Dorchester Aqueduct Hoax)
Measurement Points on the Map Route – (The Great Dorchester Aqueduct Hoax)

We have chosen the most observable points that still exist to get an idea of the size of this watercourse. (The Great Dorchester Aqueduct Hoax)

(The Great Dorchester Aqueduct Hoax)
MP 1 – The Aqueduct seems to meet with the Prehistoric Hillfort – (The Great Dorchester Aqueduct Hoax)
(The Great Dorchester Aqueduct Hoax)
MP 1 – The Duct seems to be 16m wide at this point – 15m larger than the report – (The Great Dorchester Aqueduct Hoax)

It should be noted that there is no existing channel to the Roman town of Durnovaria – it has always been summised. Yet we do know it went to the Prehistoric Site of Poundbury and was connected to one of it’s ditches. (The Great Dorchester Aqueduct Hoax)

(The Great Dorchester Aqueduct Hoax)
MP 2 and MP 3 is around a Paleochannel – the question is was it filled with water so they had to go around? – (The Great Dorchester Aqueduct Hoax)
(The Great Dorchester Aqueduct Hoax)
MP 2 is 15m about the same size as MP 1 – (The Great Dorchester Aqueduct Hoax)
(The Great Dorchester Aqueduct Hoax)
Mp 3 is 13m about the same size as MP 3 -(The Great Dorchester Aqueduct Hoax)
(The Great Dorchester Aqueduct Hoax)
MP 4 is 11m again slightly smaller bout a lot bigger than the 1m in the report – (The Great Dorchester Aqueduct Hoax)
(The Great Dorchester Aqueduct Hoax)
MP 5 is the largest we have found at 23m and twice the size of the others further down the river – (The Great Dorchester Aqueduct Hoax)

There is no signs of the Aqueduct past this point although the report goes on for another 6 km down the river. What we have found in the LiDAR map is that the watercourse may have gone around the other side of this hill and has gone undiscovered. (The Great Dorchester Aqueduct Hoax)

(The Great Dorchester Aqueduct Hoax)
The watercurse seems to go around this hillock and has been missed in the report. – (The Great Dorchester Aqueduct Hoax)

The report’s focus on a single excavated section of the watercourse severely limits its relevance, especially compared to the extensive ditches on 19th-century OS maps. Additionally, the lack of investigation into the waterway beyond the prehistoric monument of Poundbury is a glaring oversight. This is a critical area to examine, as confirming whether the watercourse connected to the Roman site would make many assumptions moot if it did not serve the Romans.

Another significant issue is the reliance on calculations based solely on a one-meter-wide section of the aqueduct. This approach is problematic, as much larger sections of the watercourse—ranging from 15 to 23 times wider—exist. A more comprehensive analysis is essential to understand how the system functions practically. Without this broader perspective, the entire structure appears highly dysfunctional if interpreted as a single, unified construction. (The Great Dorchester Aqueduct Hoax)

Design

The report does not explicitly reference the aqueduct’s design in terms of its unusual alignment hugging the hillside rather than following the straight paths characteristic of Roman roads. It primarily focuses on the aqueduct’s dimensions, gradient, and some inferred routes but does not critically address this apparent deviation from typical Roman engineering practices. If we look at other Roman Aqueducts for information (via AI) we find that:

Typical Roman Aqueduct Design

  1. Straight Alignments:
    • Roman aqueducts often followed straight alignments where possible, reflecting their preference for efficient, direct routes, similar to their roads.
    • Deviations usually occurred due to natural obstacles like mountains, valleys, or other terrain challenges.
  2. Bridging and Tunneling:
    • When confronted with significant elevation changes or natural obstacles, the Romans frequently used impressive bridging (e.g., the Pont du Gard) or tunneled through hills to maintain a direct route.
  3. Standard Gradient:
    • Aqueducts maintained a consistent, gentle gradient (typically around 1:500 to 1:3000) to ensure a steady flow of water without stagnation or overflow.

Dorchester Aqueduct’s Unusual Features

  1. Hugging the Hillside:
    • The winding path of the Dorchester aqueduct, following the contours of the hillside, is atypical compared to the more direct routes commonly seen in Roman engineering.
    • This design suggests the engineers were constrained by local geography or aimed to minimize construction effort and costs by avoiding the need for extensive tunneling or bridging.
  2. Deviation from Roman Norms:
    • Unlike roads, which prioritized straightness to reduce travel time, aqueducts could afford to be more adaptive to the terrain, especially in less resource-rich provinces like Britannia.
    • The Dorchester design may reflect a more pragmatic approach, prioritizing ease of construction over traditional Roman aesthetics or norms.

Similar Examples in Roman Engineering

  1. Zaghouan Aqueduct (Tunisia):
    • While relatively straight, it includes winding sections to avoid rugged terrain.
  2. Ephesus Aqueducts (Turkey):
    • Some sections wind along hillsides to follow natural contours, likely reducing the need for costly engineering solutions.

Why Might the Dorchester Aqueduct Hug the Hillside?

  1. Geological Constraints:
    • The hillside path may have been the most practical route due to the geology of the Frome Valley, avoiding unstable terrain or areas prone to flooding.
  2. Cost Efficiency:
    • Building along the hillside might have minimized the need for elaborate structures like bridges or retaining walls.
  3. Non-Roman Influence:
    • If the aqueduct was adapted from a pre-Roman feature (e.g., a prehistoric water management system), this design might reflect earlier practices rather than Roman engineering principles.

Looking at the way the aqueduct is influenced by the prehistoric Paleochannels we may get an indication to the origins and function of the Watercourse. AI suggested that it maybe something inherited in history by the Romans and recently we have found an almost exact feature on a once thought to be a roman feature but through mathematics we now know id prehistoric in date but used by the romans for their own use – Car Dyke.

Look at the comparisons of the two sites and see the almost identical use of the shorelines of the prehistoric waters for a watercourse. (The Great Dorchester Aqueduct Hoax)

(The Great Dorchester Aqueduct Hoax)
Dorchester Aqueduct – (The Great Dorchester Aqueduct Hoax)
Car Dyke
Car Dyke – (The Great Dorchester Aqueduct Hoax)
(The Great Dorchester Aqueduct Hoax)
If we now Flood the location to the water levels of Prehistry we see the obviuos – (The Great Dorchester Aqueduct Hoax)

Conclusion

Having examined the gradient, size, and design of the watercourse, we can confidently reinterpret this feature, traditionally attributed to a Roman aqueduct, for what it likely represents.

The gradient of the watercourse would require replenishment at intervals to maintain continuous flow. This could only be achieved through springs located at the base of the ditches, a characteristic commonly found in Linear Earthworks (Dykes). A similar phenomenon was identified during our research on Offa’s Dyke, where we discovered it is not a continuous structure but rather a series of more minor dykes that were mistakenly joined into a single monument. Using LiDAR, we demonstrated that this assumption was incorrect.

Likewise, this construction is unlikely to be a continuous aqueduct but rather a collection of separate Dykes. The width and design closely resemble those of other earthworks across Britain, particularly the Car Dyke, which shares similarities in ditch size, design, and water management strategies.

Adding to this theory is the fact that the feature terminates at the prehistoric monument of Poundbury, suggesting a connection to the Mesolithic or Neolithic period, similar to Car Dyke. Notably absent from the report is the observation that the surrounding area is rich with quarry pits, which may be critical to understanding its original purpose. (The Great Dorchester Aqueduct Hoax)

(The Great Dorchester Aqueduct Hoax)
Notice the quarry pits on this hill alone – these holes are over 100ft wide – this is industrial scale mining and could have been contunued in the Roman Period – (The Great Dorchester Aqueduct Hoax)

Our investigations into Offa’s Dyke, Wansdyke, and Hadrian’s Wall’s Vallum have led us to theorize that such earthworks were constructed to transport minerals to ports or harbours for trade, processing, or sale. By this logic, Poundbury may have been a hub for these goods, with the dyke connecting to ditches that functioned as mooring sites for boats to offload materials. This reinterpretation challenges the assumption that these features were purely defensive or infrastructural and suggests a deeper, more economic purpose tied to trade and resource management. (The Great Dorchester Aqueduct Hoax)

Chesters Roman Aqueduct

Like so many others, I, too, took for granted the story of Hadrian’s Wall. Its origins, its purpose, and the architects behind its construction had seemed well-established. It was, after all, a topic I had explored in my days as an aspiring archaeologist, back in the 1990s when I was pursuing my certificate in this discipline. Those days required us to delve deep into the annals of history, to scrutinise the facts, and to offer up our findings in carefully written essays. In those moments, there was no reason to cast doubt upon the authenticity of the information handed down to us through so-called ‘peer-reviewed’ publications.

The eminent archaeologists and historians who authored these works were seen as torchbearers of truth and custodians of knowledge. But, as is often the case in our intellectual journey, a disconcerting revelation lay ahead. It was in my pursuit of understanding a lesser-known segment of Hadrian’s Wall, a portion known as ‘The Vallum,’ that the foundation of my beliefs began to tremble. What I uncovered was a stark departure from what had been suggested by the established sources. It wasn’t just a matter of minor discrepancies; it was a revelation that shattered the very foundation of what I thought I knew. The accepted history of The Vallum was, to my astonishment, flawed, and the implications were profound. Intriguingly, this wasn’t the end of my scholarly quest for truth.

My journey into questioning the accepted narratives of ancient linear earthworks led me to another fascinating discovery – Offa’s Dyke. Much like Hadrian’s Wall, a certain authority on the subject, Fox, had long been regarded as the definitive source. Yet, as I delved deeper, the picture that emerged was one of imagination rather than accurate observation. The truths I sought to uncover lay in meticulous measurements and scientific precision, not mere conjecture. And so, the Vallum, like Offa’s Dyke, emerged as a complex tapestry of subjective fabrications. Not only the Vallum but also its associated features such as Stanegate Road, Military Way, and Great Chesters Viaduct came under scrutiny. The layers of history peeled back to reveal a more intricate, and often enigmatic, narrative. As we journey through the ever-evolving landscape of our understanding, it becomes evident that the past is not a static entity but a dynamic tapestry woven together by our collective pursuit of truth and knowledge.

Robert John Langdon (2023) – Great Chesters Roman Aqueduct

Langdon’s journey was marked by meticulous mapping and years of research, culminating in a hypothesis that would reshape our understanding of prehistoric Britain. He proposed that much of the British Isles had once been submerged in the aftermath of the last ice age, with these ancient sites strategically positioned along the ancient shorelines. His groundbreaking maps offered a fresh perspective, suggesting that Avebury had functioned as a bustling trading hub for our ancient ancestors. This audacious theory challenged the prevailing notion that prehistoric societies were isolated and disconnected, instead highlighting their sophistication in trade and commerce.

In the realm of historical discovery, it is often the audacious thinkers, the mavericks who dare to question established narratives, who propel our understanding forward. Robert John Langdon is undeniably one of these thinkers. With a deep passion for history and an unyielding commitment to his research, he has unearthed a hidden chapter in the story of Avebury—one that transcends the boundaries of time and offers fresh insights into our shared human history.

As Langdon’s trilogy, ‘The Stonehenge Enigma,’ continues to explore these groundbreaking theories, it beckons us to embark on a journey of discovery, to challenge our assumptions, and to embrace the possibility that the past is far more complex and interconnected than we ever imagined. Avebury, with its ancient stones and enigmatic avenues, continues to whisper its secrets to those who dare to listen, inviting us to see history through a new lens—one illuminated by the audacious vision of Robert John Langdon. (Great Chesters Roman Aqueduct)

Great Chesters Roman Aqueduct - Hoax
Great Chesters Roman Aqueduct – Hoax

Further Reading

For information about British Prehistory, visit www.prehistoric-britain.co.uk for the most extensive archaeology blogs and investigations collection, including modern LiDAR reports.  This site also includes extracts and articles from the Robert John Langdon Trilogy about Britain in the Prehistoric period, including titles such as The Stonehenge Enigma, Dawn of the Lost Civilisation and the ultimate proof of Post Glacial Flooding and the landscape we see today. (Free Stonehenge LiDAR Maps)

Robert John Langdon has also created a YouTube web channel with over 100 investigations and video documentaries to support his classic trilogy (Prehistoric Britain). He has also released a collection of strange coincidences that he calls ‘13 Things that Don’t Make Sense in History’ and his recent discovery of a lost Stone Avenue at Avebury in Wiltshire called ‘Silbury Avenue – the Lost Stone Avenue’. (Free Stonehenge LiDAR Maps)

Langdon has also produced a series of ‘shorts’, which are extracts from his main body of books:

The Ancient Mariners

Stonehenge Built 8300 BCE

Old Sarum

Prehistoric Rivers

Dykes ditches and Earthworks

Echoes of Atlantis

Homo Superior

For active discussions on the findings of the TRILOGY and recent LiDAR investigations that are published on our WEBSITE, you can join our and leave a message or join the debate on our Facebook Group.

For in-depth information about British Prehistory, we invite you to explore www.prehistoric-britain.co.uk, an extensive resource featuring archaeology blogs and investigations. This collection includes modern LiDAR reports that shed light on ancient landscapes. Additionally, you will find extracts and articles from the Robert John Langdon Trilogy, offering fascinating insights into Britain during the Prehistoric period. Some notable titles from the trilogy include “The Stonehenge Enigma,” “Dawn of the Lost Civilisation,” and groundbreaking evidence of Post Glacial Flooding and its impact on the landscape we see today.(Free Stonehenge LiDAR Maps)
Robert John Langdon has further enriched the exploration of Prehistoric Britain through his YouTube web channel, boasting over 100 investigations and video documentaries that complement his classic trilogy. In addition to his extensive work, Langdon has unveiled a compilation of intriguing coincidences titled “13 Things that Don’t Make Sense in History.” He has also brought to light his recent discovery of a forgotten Stone Avenue in Avebury, Wiltshire, aptly named ‘Silbury Avenue – the Lost Stone Avenue.’ (Free Stonehenge LiDAR Maps)

For those who wish to actively engage in discussions about the findings from the TRILOGY and recent LiDAR investigations, we invite you to join our community. You can participate by leaving messages and joining our dedicated Facebook Group debates. We encourage open dialogue and exchanging ideas to foster a deeper understanding of Prehistoric Britain and its fascinating mysteries.(Free Stonehenge LiDAR Maps)

As you embark on your journey through British Prehistory, we hope these resources provide valuable insights and inspire further exploration of this captivating field of study.

For more information about British Prehistory and other articles/books, go to our BLOG WEBSITE for daily updates or our VIDEO CHANNEL for interactive media and documentaries. The TRILOGY of books that ‘changed history’ can be found with chapter extracts at DAWN OF THE LOST CIVILISATION, THE STONEHENGE ENIGMA and THE POST-GLACIAL FLOODING HYPOTHESIS. (The Stonehenge Hoax)

Other associated books are also available such as 13 THINGS THAT DON’T MAKE SENSE IN HISTORY and other ‘short’ budget priced books can be found on our AUTHOR SITE. For active discussion on the findings of the TRILOGY and recent LiDAR investigations that is published on our WEBSITE you can join our FACEBOOK GROUP.

(Great Chesters Roman Aqueduct)

Other Blogs

[sitemap_posts]