Stonehenge Phase 1 – 8300 BCE Documentary

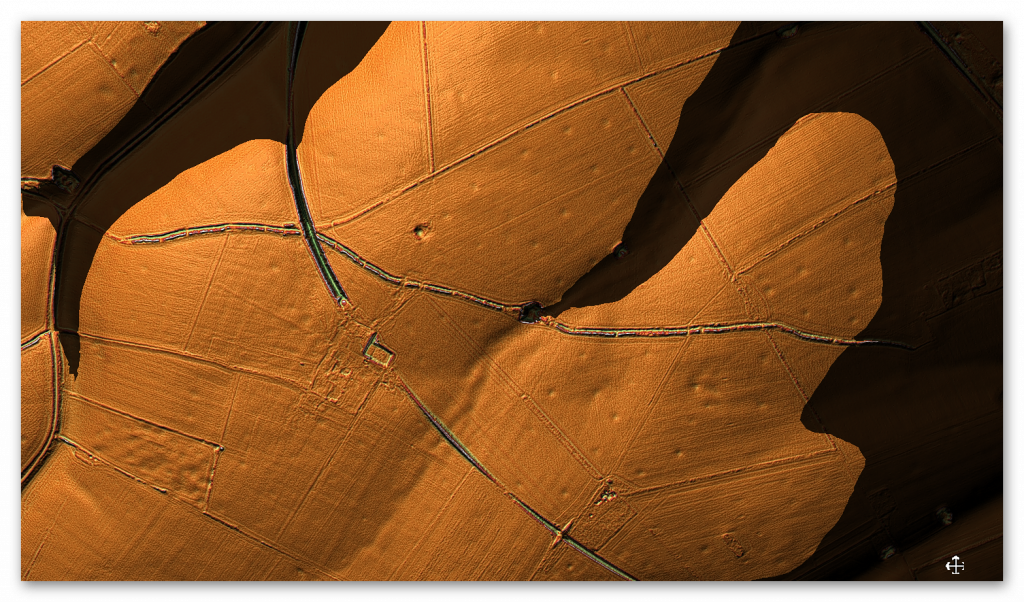
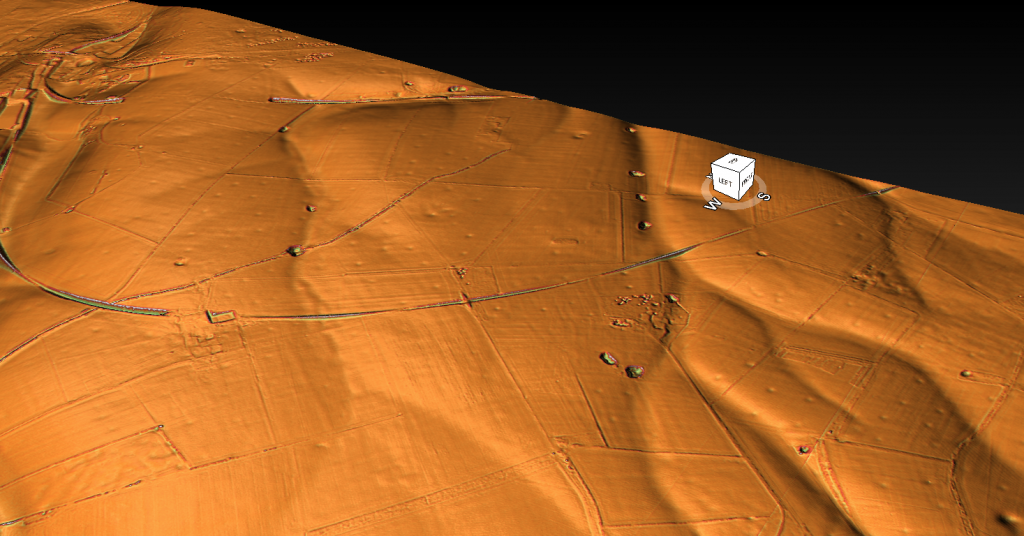
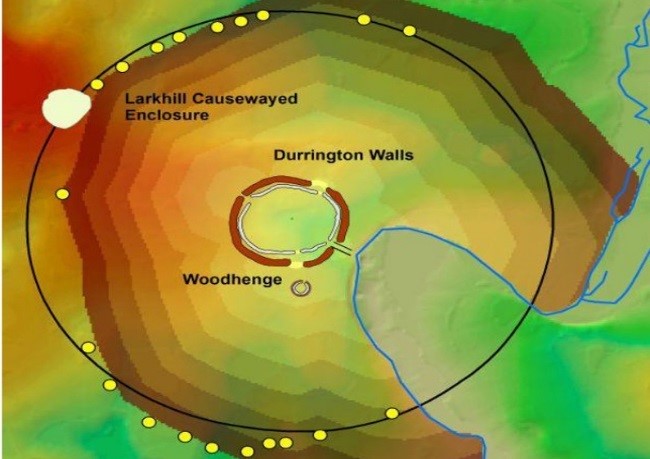
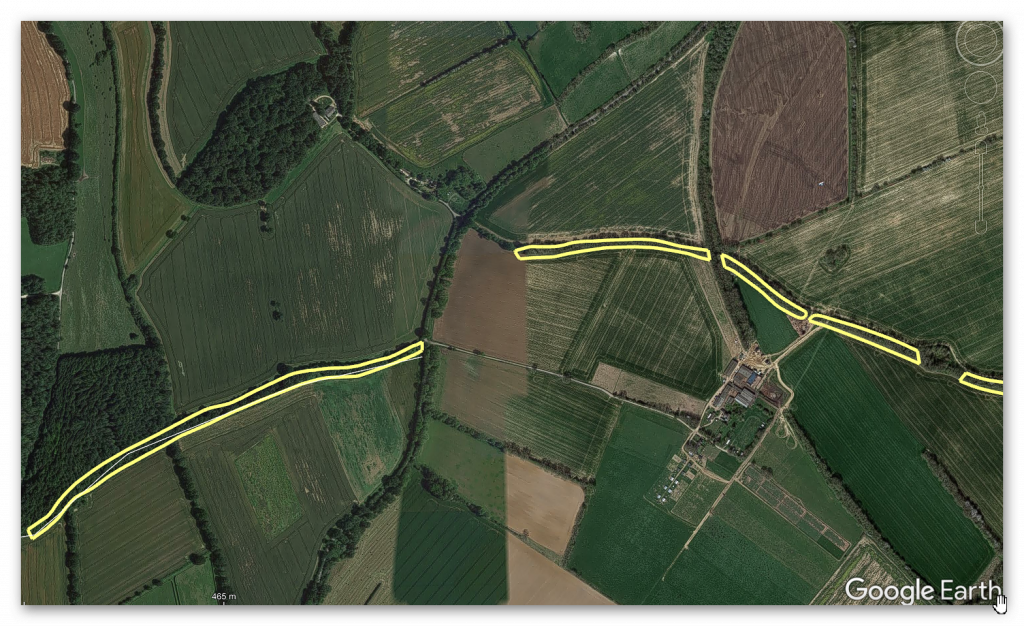
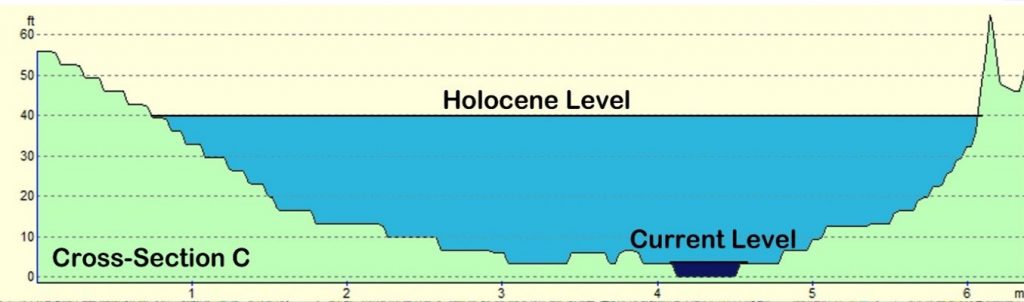
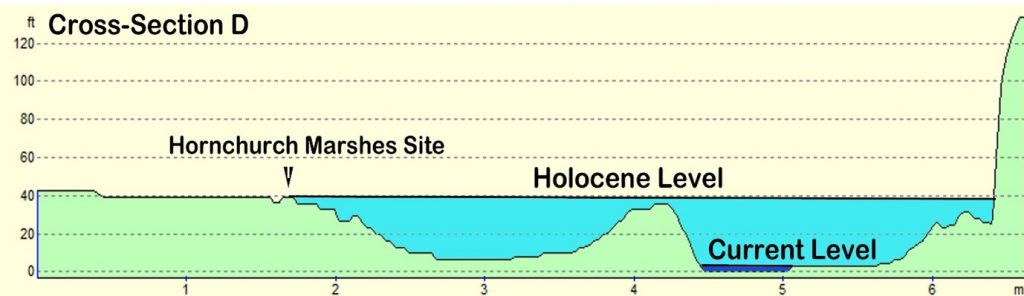
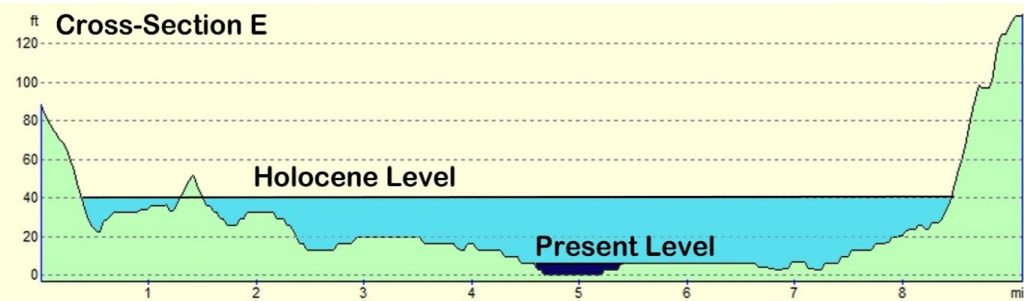
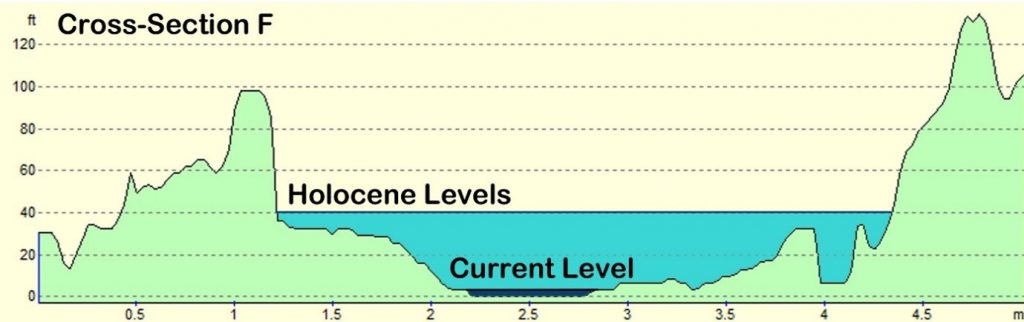
In this video, Robert John Langdon presents mathematical, hydrological, and archaeological evidence that Stonehenge Phase 1—built around 8300 BCE—was Britain’s first true monument. Far older than the conventional 3000 BCE timeline, this reinterpretation reveals a water-filled sanctuary and healing centre, not a dry ceremonial circle. Using LiDAR, ditch profiles, and groundwater modelling, the evidence shows Stonehenge began as a moated medical site in the Mesolithic.

🧮 Key discoveries include: The Aubrey Holes, once thought to be for timber posts, align with water access and wooden palisades. The ditch and moat were dug to the water table, filling naturally and creating bathing pools. Bluestones dissolved minerals into the moat, acting like prehistoric “bath salts” for antiseptic healing. Mortuary slabs within a palisaded enclosure show the site doubled as a treatment centre and mortuary. Radiocarbon reliance on antler picks misdates the site to its abandonment, not its creation.

🔑 Main Arguments: • Stonehenge Phase 1 was a hydrological monument, designed around water, not astronomy. • It functioned as a medical sanctuary, where bluestone-infused waters were used for healing. • The earliest construction aligns with Britain’s high post-glacial water table, not later Neolithic dryland farming.

📏 Methodology Highlights: LiDAR analysis of river valleys and ditch alignments Hydrological modelling of groundwater recession since the Ice Age Archaeological reinterpretation of excavation reports (Aubrey Holes, Station Stones, ditch profiles) Mathematical alignment with Stonehenge’s measured geometry and ditch depth

🚨 This changes everything: Stonehenge did not begin as a late Neolithic temple. It was originally Britain’s first healing monument, built by a Mesolithic boat-using civilisation.

📚 Based on empirical LiDAR, ditch stratigraphy, and hydrological data cross-referenced with archaeological excavation reports.

🔗 LINKS & RESOURCES Blog post: “Stonehenge Phase 1 – Britain’s First Monument” 👉 https://prehistoric-britain.co.uk/sto… Book: The Stonehenge Enigma 👉 https://prehistoric-britain.co.uk/the… 📍 Related Blogs The Stonehenge Code – Mathematical Proof of Early Dating 👉 https://prehistoric-britain.co.uk/the… Post-Glacial Flooding Hypothesis – Rethinking the Past 👉 https://prehistoric-britain.co.uk/ret… Stonehenge, Doggerland & the Atlantis Connection 👉 https://prehistoric-britain.co.uk/sto… Antler Pick Hoax – Misdating Britain’s Monuments 👉 https://prehistoric-britain.co.uk/twi…

Contents/Chapters – with Timestamps

00:00 Stonehenge Phase One — Britain’s First Monument
00:05 Introduction — The Forgotten Phase
01:12 How We Know Stonehenge Phase One Dates to 8300 BCE
03:08 Layout and Function — The Real Purpose of the Site
05:26 The Bluestones — Transport, Composition and Use
07:10 The Water — How It Worked and Why It Mattered
08:25 Evidence of Bluestone Reuse and Replacement
09:43 The Healing Spring at Carn Menyn
13:10 The Palisade and the Silent Towers
14:30 Decline and Transition to Phase Two
15:39 Conclusion — A Monument Built on Function, Not Fantasy

Key Findings

Here are 8 key findings drawn directly from the transcript:

  • Stonehenge Phase One is argued to date to around 8300 BCE, based on radiocarbon dates from Stonehenge postholes and comparable dates from Preseli quarry activity.
  • The earliest Stonehenge is presented as a practical health and mortuary site, not primarily as a temple or ceremonial monument. Its layout is interpreted as combining water, excarnation and controlled access.
  • The ditch is interpreted as a water-filled moat or therapeutic bathing system, supplied by the local chalk aquifer rather than as a purely symbolic earthwork.
  • Bluestones are argued to have been deliberately chipped and placed into the water, allowing salts and trace minerals to leach into the moat and create a mineral-rich treatment environment.
  • The large number of bluestone fragments is interpreted as evidence of repeated use and replacement, rather than simple accidental breakage or collapse.
  • The Preseli spring at Carn Menyn is proposed as a physical model for Stonehenge’s mineral-water system, suggesting that the same stone was transported to reproduce the properties of the Welsh spring.
  • The Y and Z holes are interpreted as evidence for a timber palisade enclosing excarnation platforms, creating a controlled area where scavenger birds could remove flesh before bones were transferred elsewhere.
  • The transition to Phase Two is linked to falling water levels, with the decline of the aquifer-fed system prompting a shift away from the original practical function toward the later monumental Stonehenge.

Transcript

Introduction — The Forgotten Phase

Most people imagine Stonehenge as the great sarsen trilithons. In fact, those belong to Phase Two, constructed around 4300 BCE. The real story begins much earlier.

Phase One, built around 8300 BCE, was entirely different in form and function.

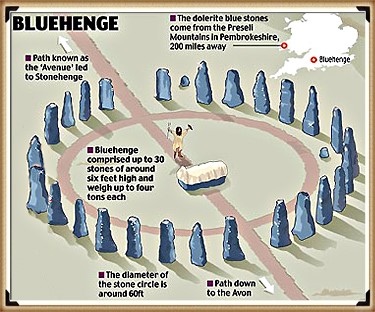
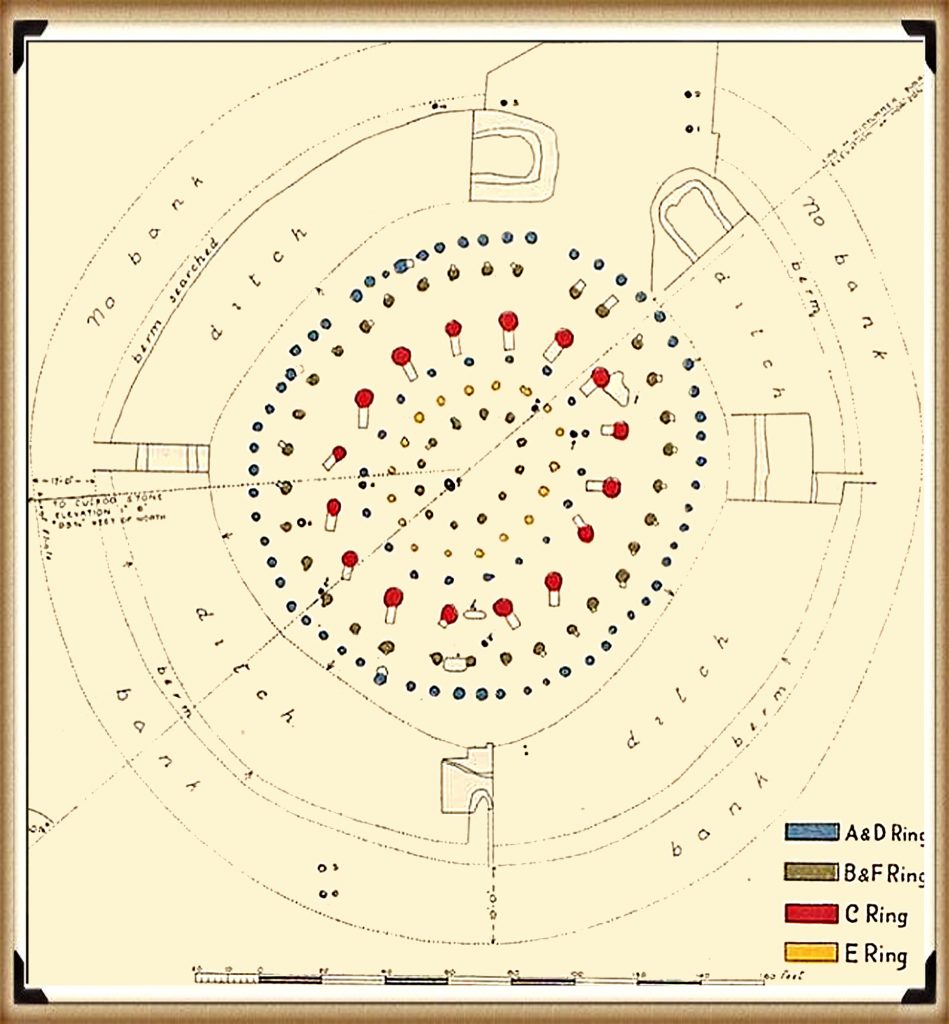
This earliest version of Stonehenge was a working health and mortuary site. It featured a chalk-cut moat that held water, 58 imported Preseli bluestones, and a timber palisade enclosing raised stone platforms for excarnation.

Birds were allowed to clean the dead, a practice still seen today in India’s Towers of Silence. The Y and Z holes marked the outer limits of the palisade. The Q and R holes defined where excarnation slabs once stood.

The entire setup was pragmatic, not ritualistic.

How We Know Stonehenge Phase One Was Built Around 8300 BCE

The date for Stonehenge Phase One is not speculative. It is supported by radiocarbon dating from multiple sites.

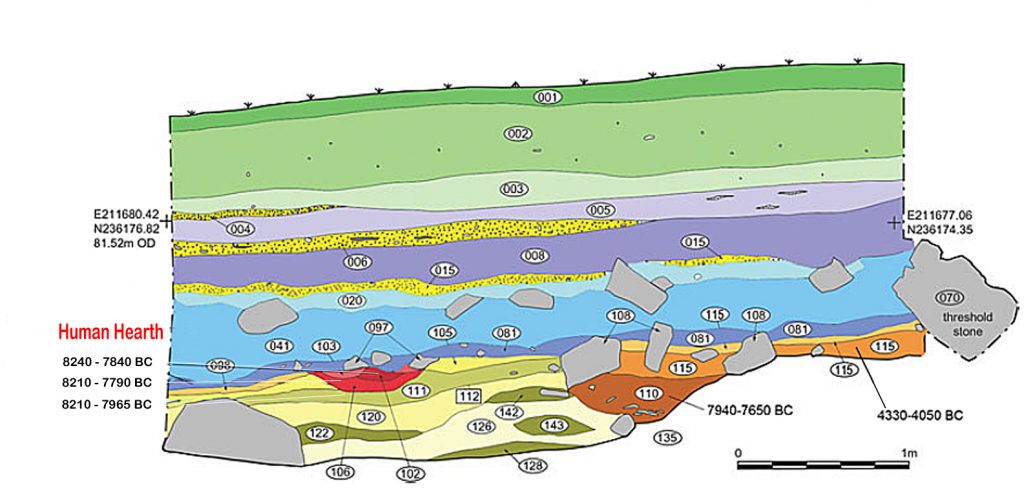
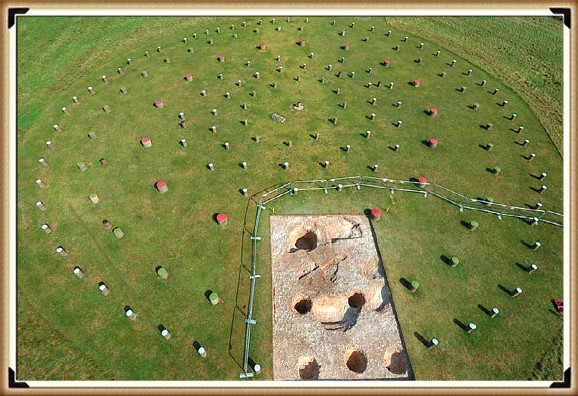
Charcoal samples from postholes discovered during the Stonehenge car park excavation have been dated to around 8300 BCE.

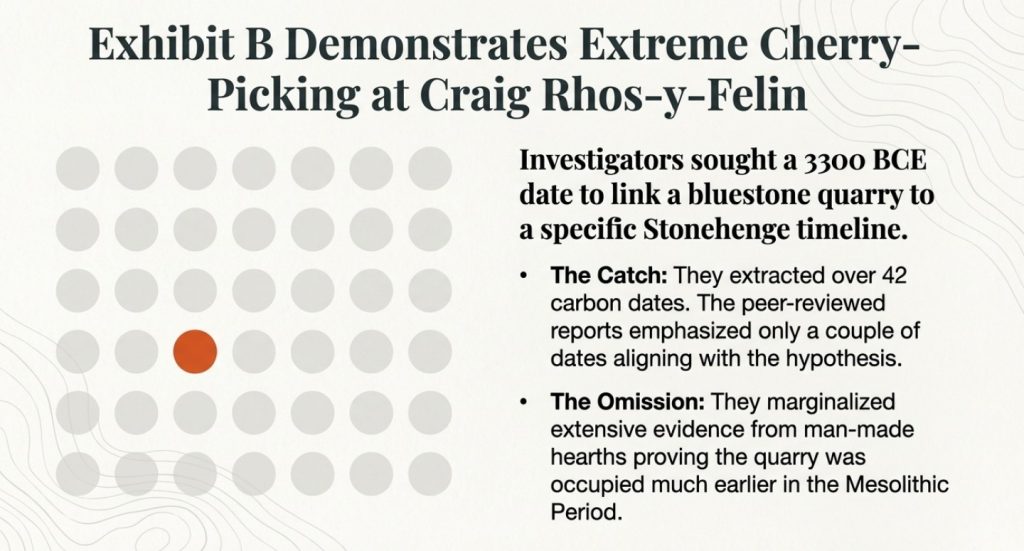
This corresponds closely with two quarry sites in the Preseli Hills of Wales, where evidence of human activity, including hearths associated with stone extraction, has also produced C14 dates from the same period.

These sites are not random campfires but appear to be linked directly to quarrying activity associated with the bluestones.

This level of coordination between quarrying and monument construction suggests an advanced society operating across hundreds of miles, capable of planning and logistics long before the Neolithic.

The matched radiocarbon dates from the quarry and monument provide strong empirical support for the theory that bluestones were transported and erected at Stonehenge in the ninth millennium BCE.

Hydrological modelling further reinforces the idea that this was the period when the chalk aquifer could have provided a permanent water source at the monument. But it is the radiocarbon evidence, independently dated at both source and site, that fixes Stonehenge Phase One to approximately 8300 BCE.

This would make it the earliest scientifically verified monumental construction in the British Isles.

Layout and Function — The Real Purpose of the Site

The layout of Phase One was deliberate and practical.

At the centre were the Q and R holes, which supported dolmen-style excarnation slabs: single flat stones balanced precisely on pointed supports to deter rodents.

These slabs were used to expose bodies to the elements and scavenger birds — an efficient and sanitary method of processing the dead.

The palisade surrounding the structure, marked by the Y and Z holes, enclosed this inner space to protect the area while allowing avian access.

The design shows a clear understanding of decomposition cycles and scavenger behaviour.

The north-west orientation of the Q and R hole alignment corresponds to the Moon’s setting position, reinforcing the functional connection between death and timing.

The number of bluestones — 58 — was not arbitrary. It corresponds with a lunar cycle used to track the Moon’s 18.6-year nodal variation and eclipse cycle.

This knowledge was likely vital for excarnation timing, navigation and tidal awareness — critical information for a riverine trading society.

The Bluestones

The bluestones themselves were never intended simply to remain intact.

As noted by Darvill and Wainwright, the bluestones were chipped from almost immediately. More than 3,675 fragments have been discovered — a remarkable total given that only around half of the site has been excavated.

These fragments were deliberately introduced into the chalk moat.

With their mineral and rock-salt content, the bluestone chips enriched the water, enhancing its potential medicinal properties.

This suggests that Stonehenge Phase One was not a ceremonial temple, but a sophisticated facility for managing death, disease and recovery.

Transport, Composition and Use

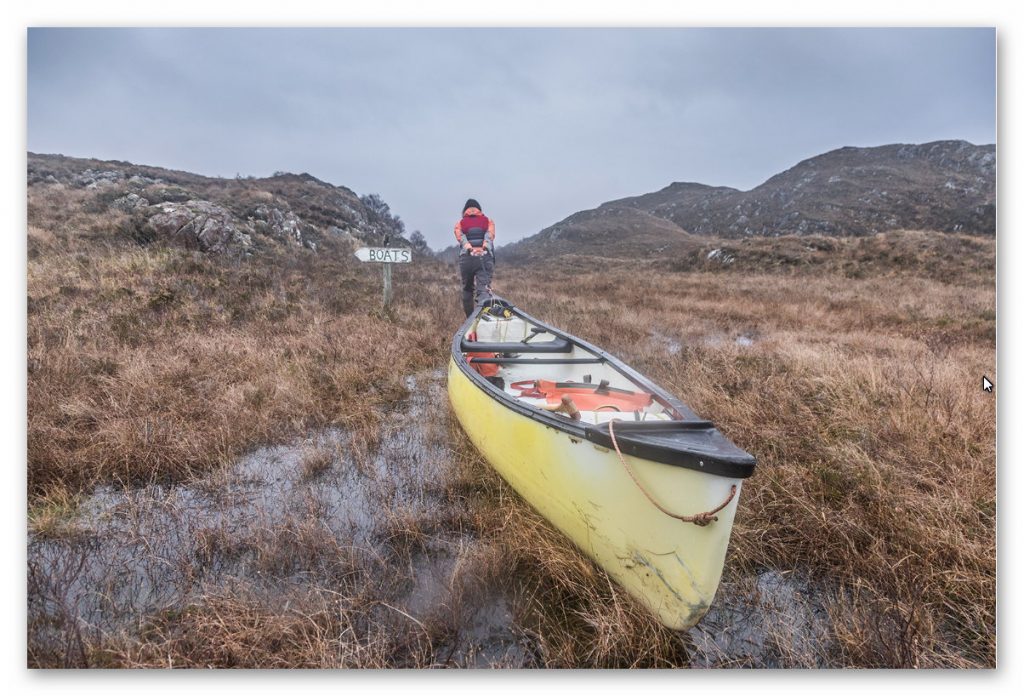
The Preseli bluestones used at Stonehenge were transported from south-west Wales, likely using river and canal networks rather than being dragged overland.

The discovery of an ancient prehistoric catamaran boatyard in Wales suggests that heavy loads could have been transported using double-hulled craft.

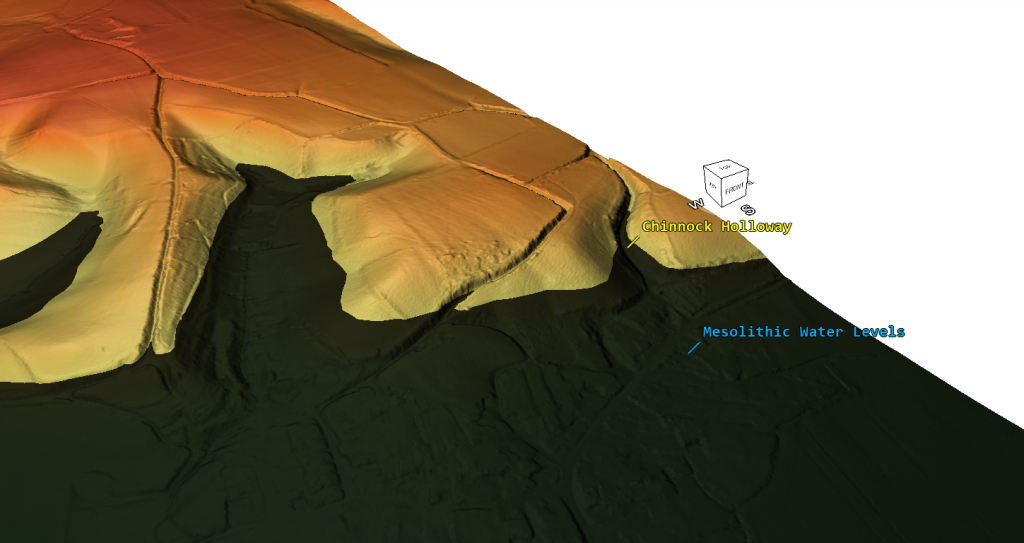
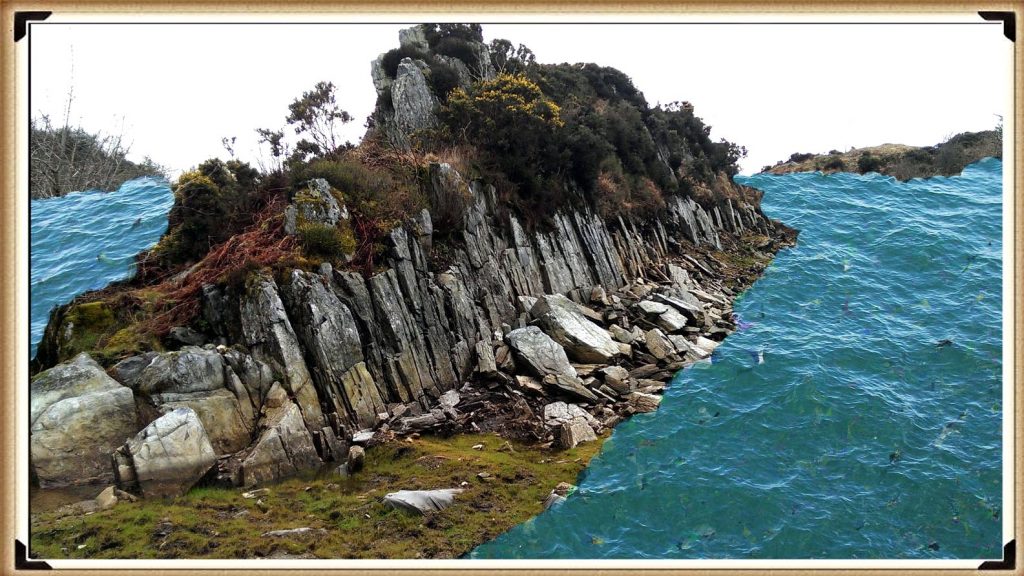
Britain’s river levels were significantly higher at the time, which could have enabled direct water transport towards the site without requiring the type of overland journey normally imagined.

But what matters more than their origin is their composition.

The Preseli stones contain salts, copper and trace minerals that can leach into water when submerged or broken.

More than 3,675 bluestone fragments have been found in the moat area.

This suggests that the stones may have been intentionally broken up to release minerals into the water, creating a form of early mineral spa.

This interpretation is further supported by Darvill and Wainwright, who observed that the stones were being chipped from the time of their erection and proposed that Stonehenge may have served as a healing centre.

This evidence strengthens the argument that Stonehenge functioned primarily as a public-health structure, particularly concerned with sepsis and infection — major causes of death in prehistoric society.

The Water — How It Worked and Why It Mattered

The chalk-cut ditch surrounding the central enclosure was not ornamental.

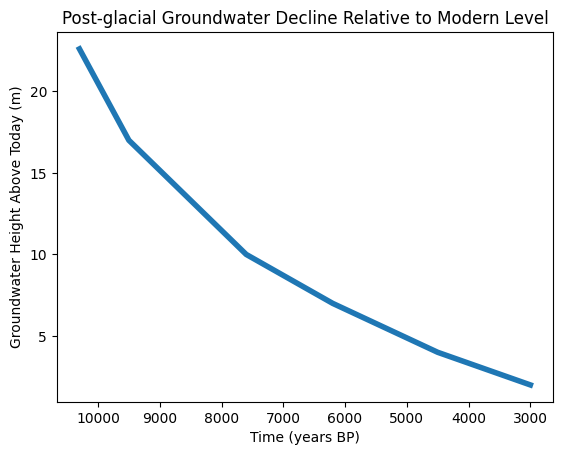
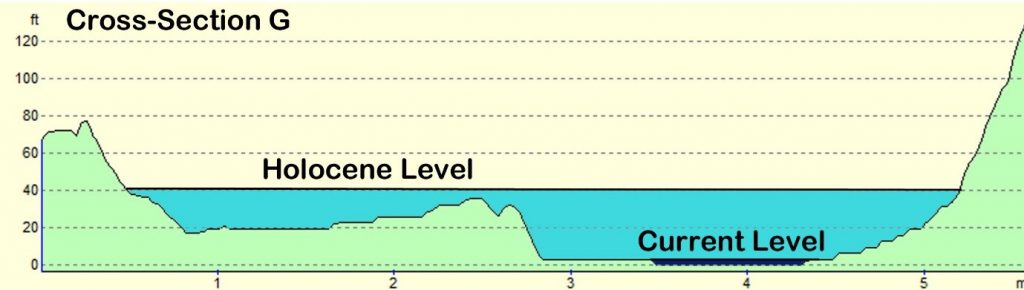
It was a functional water feature drawing from a naturally high water table during the Mesolithic.

The aquifer-fed ditch would have maintained mineral-rich water around the site, turning the enclosed area into a therapeutic environment.

Bluestone chippings, deliberately broken and deposited in this moat, would have slowly released salts and trace elements into the water.

Salt has antiseptic properties and is still used in wound care today. Soaking injuries in such water could therefore have helped clean wounds and possibly reduce infections in a world without antibiotics.

The antlers found in the ditch have traditionally been interpreted as construction tools.

An alternative explanation is that they were dredging tools used to maintain the flow and clarity of the water system.

They were found in later layers, suggesting periodic cleaning and maintenance of the moat rather than necessarily being tools used in its original excavation.

Evidence of Reuse and Replacement

Conventional narratives tend to portray the stones as being erected once and then remaining in place.

However, C14 dating and excavation records suggest a more complicated history.

The bluestones appear to have been replaced multiple times over a prolonged period, rather than simply being transported once and left standing.

Dating of stone-socket fills indicates repeated insertion events, in some cases separated by centuries.

This supports the idea that the site was actively maintained rather than simply abandoned or commemorated.

Within this model, replacement intervals may have been connected to mineral depletion. Once sufficient salts and trace minerals had leached from existing stones, they could have been broken up and replaced.

This could explain the extraordinarily large number of fragments despite the limited amount of the monument that has been excavated.

With only around 50 per cent of the site dug, more than 3,600 fragments have already been recovered, meaning the total surviving quantity could potentially be considerably greater.

Under this interpretation, these were not simply random breakages or damage caused by collapse. The stones were systematically chipped and the material deposited into the water.

The Healing Spring at Carn Menyn

A major criticism of the healing-stones hypothesis has been the supposed lack of empirical evidence.

But research at Carn Menyn in the Preseli Mountains — one of the proposed source areas for Stonehenge bluestones — reveals a now-dry sacred springhead that may help explain the stones’ original significance.

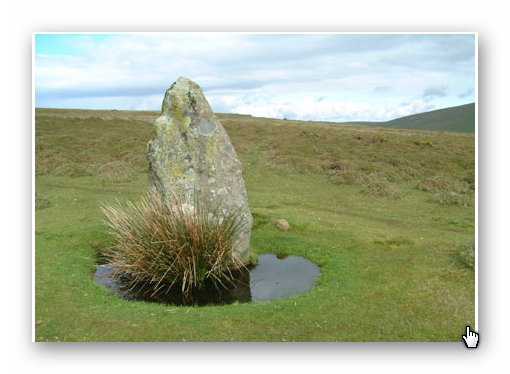
Gordon Freeman’s fieldwork identified a collapsed cromlech and associated cairn built directly over a once-flowing freshwater spring known locally as Pen y Tarddiant Sanctaidd — the Holy Springhead.

This spring fed a stone-lined stream channel called Rhestr Gerrig, or “Stone Row”, which wound through the landscape towards a marshy area known as Fat Hazelnut Bog.

Although this water source has since dried up, its historical importance appears considerable.

The spring was significant enough to have a formal monument constructed over it, and the fact that a cromlech capped the spring suggests a long tradition of ritualised — and potentially therapeutic — use.

But this may be more than symbolism.

The springhead sits within the geological formation associated with spotted dolerite bluestone.

If the spring water passed through mineral-bearing rock, it could have absorbed salts and trace mineral ions.

The potential effects of mineral water on wounds could have been observed by prehistoric people without any knowledge of modern biochemistry.

This provides a practical reason why the same stone could have been deliberately selected and transported more than 200 kilometres to the chalk aquifer basin at Stonehenge: to reproduce the properties associated with the Preseli water source.

Under this interpretation, the deliberate chipping of bluestones and depositing of their fragments into the moat was not ceremonial destruction.

It was chemical replication.

The stones infused the water with trace minerals, producing a mineralised bathing system intended to reproduce the healing waters associated with the original spring in Wales.

Taken together, the presence of a prehistoric sacred spring, the mineral composition of bluestone and the evidence for deliberately broken bluestone at Stonehenge allow archaeology, geology and hydrology to be considered together as a functional explanation for what has traditionally been labelled a ritual monument.

Stonehenge Phase One was therefore not simply a temple.

It may have been Britain’s first public-health sanctuary, with the spring at Carn Menyn providing its biochemical blueprint.

The Palisade and the Silent Towers

One of the most overlooked features of Stonehenge Phase One is the timber palisade surrounding the inner platforms.

This structure was not necessarily defensive. It could have served a functional and hygienic purpose, containing excarnation within the central area while restricting access.

This enclosure is defined by the Y and Z holes, which are consistent and evenly spaced.

Within this interpretation, they formed the foundation for uprights surrounding a series of protected raised platforms.

Birds — particularly carrion feeders such as jackdaws, ravens and crows — were allowed access to clean the bodies.

The cleaned bones were then taken to nearby Long Barrows for interment.

This practice resembles the principle employed by India’s Towers of Silence, where sky-burial traditions involve exposure of the dead to carrion birds.

It reflects a process of natural decomposition and purification.

Stonehenge’s arrangement therefore provided a sanitary and repeatable method of processing the dead, remarkable for its time.

Decline and Transition to Phase Two

Over time, the water table dropped as the aquifer drained and post-glacial rebound altered the landscape.

The once-functioning moat began drying up and the mineral bath became less effective.

This environmental change marks the end of Phase One and the beginning of a new chapter in the life of Stonehenge.

The bluestones were gradually replaced by larger sarsen stones, marking a transition from a practical medical site to something more monumental.

These sarsens were installed around 4300 BCE, beginning what most people today incorrectly consider to be the start of Stonehenge.

This change is reflected in the construction of the Avenue, a wide route leading away from the original riverfront location towards a new shoreline farther to the north-east.

This redirection reflects both astronomical alignments and the practical reality of hydrological change.

Conclusion — A Monument Built on Function, Not Fantasy

The first phase of Stonehenge was not a mystical temple, a ceremonial gathering place or simply a stone calendar.

It was a public-health structure grounded in the harsh realities of Mesolithic life: infection, injury and death.

Its foundation was not spiritual conjecture but practical science, built on a prehistoric shoreline, maintained by a saturated aquifer and enriched by mineral-laden bluestone chips introduced into the water.

It was a place of triage, treatment and transformation.

Thanks to a new mathematical dating model — grounded in radiocarbon evidence from quarry hearths, site postholes and hydrological mapping — Phase One can be placed at around 8300 BCE.

This would place Stonehenge among the oldest monumental structures in Europe and dismantle the conventional late-Neolithic timeline proposed for its beginnings.

It was not a late-Neolithic curiosity, but a pioneering Mesolithic achievement.

And this was a rational, functional innovation, unlike the speculative calendars and solar temples traditionally proposed.

Archaeologists have consistently struggled to interpret key features of the site.

The postholes forming the central crescent pattern align with where excarnation slabs could have stood. Their unusual shape and placement remain largely unacknowledged in conventional interpretations.

Even the surrounding palisade, indicated in this model by the Y and Z holes, has received little consideration as a protective and hygienic structure.

Traditionally described simply as a ceremonial ditch, the ditch may instead have been a ring of water-filled pits designed to accommodate seating platforms below water level for therapeutic bathing.

This unusual design is central to understanding what Stonehenge might originally have been.

The fog is lifting with advances in LiDAR, mineral analysis, hydrology and radiocarbon calibration.

Stonehenge Phase One should now be considered as a potential candidate for Britain’s first scientific structure — a masterpiece of Mesolithic engineering, biology and community medicine, misunderstood for thousands of years by a profession still reluctant to let go of fantasy.

Author’s Biography

Robert John Langdon, a polymathic luminary, emerges as a writer, historian, and eminent specialist in LiDAR Landscape Archaeology.

His intellectual voyage has been interwoven with stints as an astute scrutineer in government and grand corporate bastions, a tapestry spanning British Telecommunications, Cable and Wireless, British Gas, and the esteemed University of London.

A decade hence, Robert’s transition into retirement unfurled a chapter of insatiable curiosity. This phase saw him immerse himself in Politics, Archaeology, Philosophy, and the enigmatic realm of Quantum Mechanics. His academic odyssey traversed the venerable corridors of knowledge hubs such as the Museum of London, University College London, Birkbeck College, The City Literature Institute, and Chichester University.

In the symphony of his life, Robert is a custodian of three progeny and a pair of cherished grandchildren. His sanctuary lies ensconced in the embrace of West Wales, where he inhabits an isolated cottage, its windows framing a vista of the boundless sea – a retreat from the scrutinising gaze of Her Majesty’s Revenue and Customs, an amiable clandestinity in the lap of nature.

Exploring Prehistoric Britain: A Journey Through Time

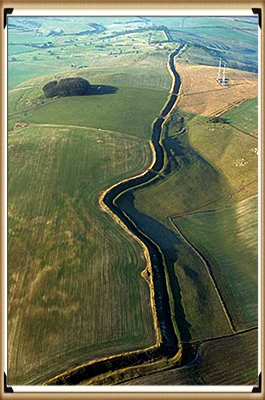
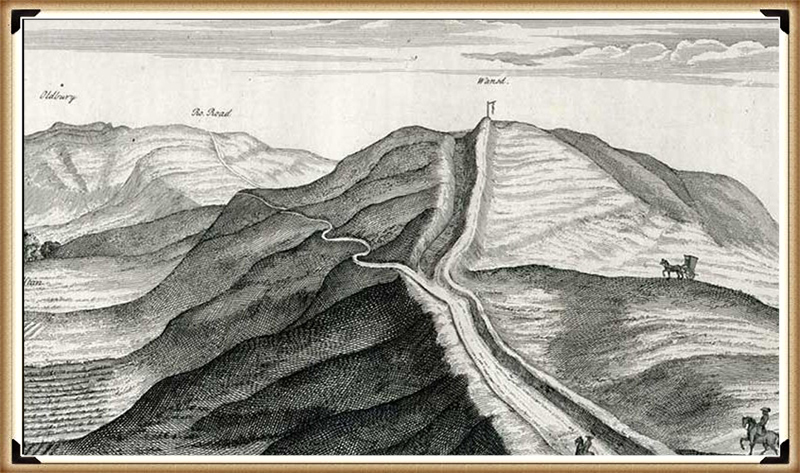
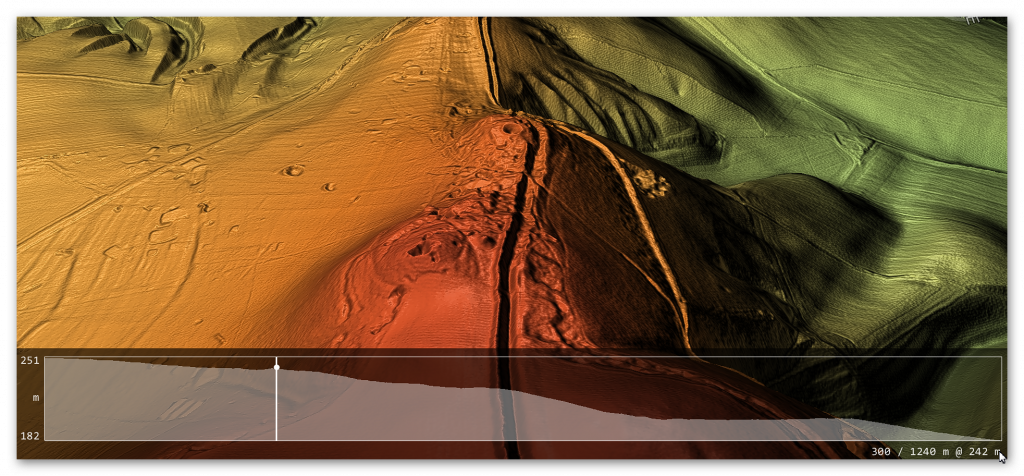
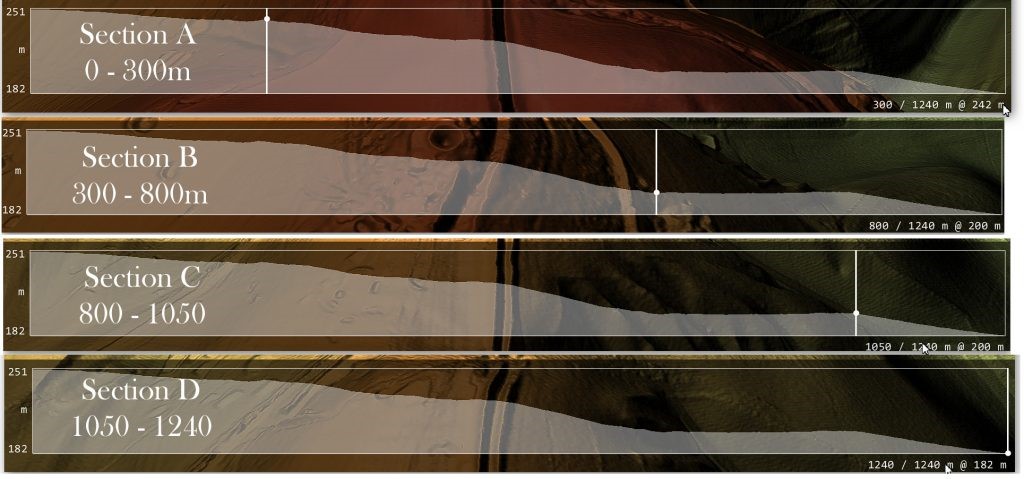
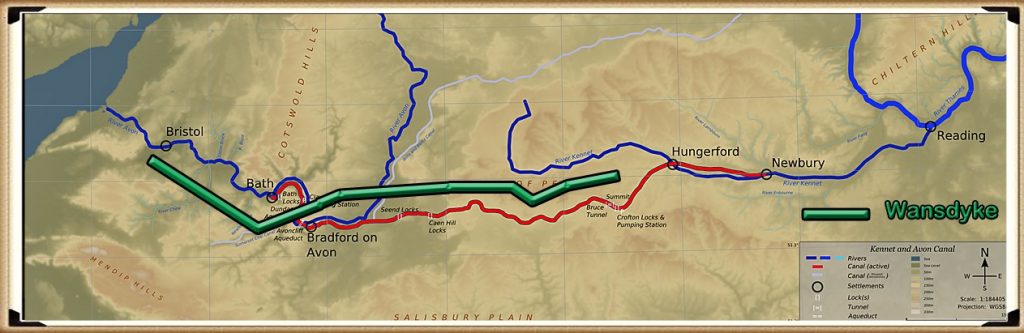
My blog delves into the fascinating mysteries of prehistoric Britain, challenging conventional narratives and offering fresh perspectives grounded in cutting-edge research, particularly LiDAR technology. I invite you to explore some key areas of my research. For example, the Wansdyke, often cited as a defensive structure, is re-examined in light of new evidence. I’ve presented my findings in my blog post Wansdyke: A British Frontier Wall – ‘Debunked’, and a Wansdyke LiDAR Flyover video further visualises my conclusions.

My work also often challenges established archaeological dogma. I argue that many sites, such as Hambledon Hill, commonly identified as Iron Age hillforts, are not what they seem. My posts Lidar Investigation Hambledon Hill – NOT an ‘Iron Age Fort’ and Unmasking the “Iron Age Hillfort” Myth explore these ideas in detail and offer an alternative view. Similarly, sites like Cissbury Ring and White Sheet Camp receive re-evaluations based on LiDAR analysis in my posts “Lidar Investigation Cissbury Ring through time” and “Lidar Investigation White Sheet Camp, revealing fascinating insights into their true purpose. I have also examined South Cadbury Castle, often linked to the mythical Camelot56.

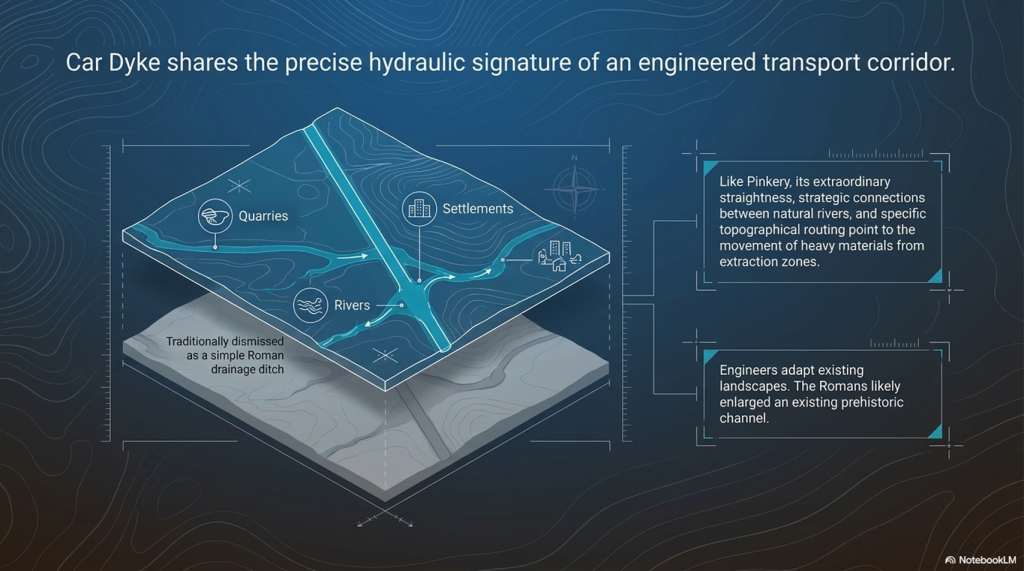
My research also extends to ancient water management, including the role of canals and other linear earthworks. I have discussed the true origins of Car Dyke in multiple posts, including Car Dyke – ABC News Podcast and Lidar Investigation Car Dyke – North Section, which suggest a Mesolithic origin 2357. I also explore the misidentification of Roman aqueducts, as seen in my posts on the Great Chesters (Roman) Aqueduct. My research has also been greatly informed by my post-glacial flooding hypothesis, which has helped explain landscape transformations over time. I have discussed this hypothesis in several posts, including AI now supports my Post-Glacial Flooding Hypothesis and Exploring Britain’s Flooded Past: A Personal Journey

Finally, my blog also investigates prehistoric burial practices, as seen in Prehistoric Burial Practices of Britain and explores the mystery of Pillow Mounds, often mistaken for medieval rabbit warrens, but with a potential link to Bronze Age cremation in my posts: Pillow Mounds: A Bronze Age Legacy of Cremation? and The Mystery of Pillow Mounds: Are They Really Medieval Rabbit Warrens?. My research also includes astronomical insights into ancient sites, for example, in Rediscovering the Winter Solstice: The Original Winter Festival. I also review new information about the construction of Stonehenge in The Stonehenge Enigma.

Other Blogs

1

2

8

a

b

c

d

e

f

g

h

i

l

m

n

o

p

r

s

t

u

v

w

The Post-Glacial Flooding Hypothesis – 1/11

Chapter 1 – The Legacy of the Ice Age

Book Extract

1. Introduction

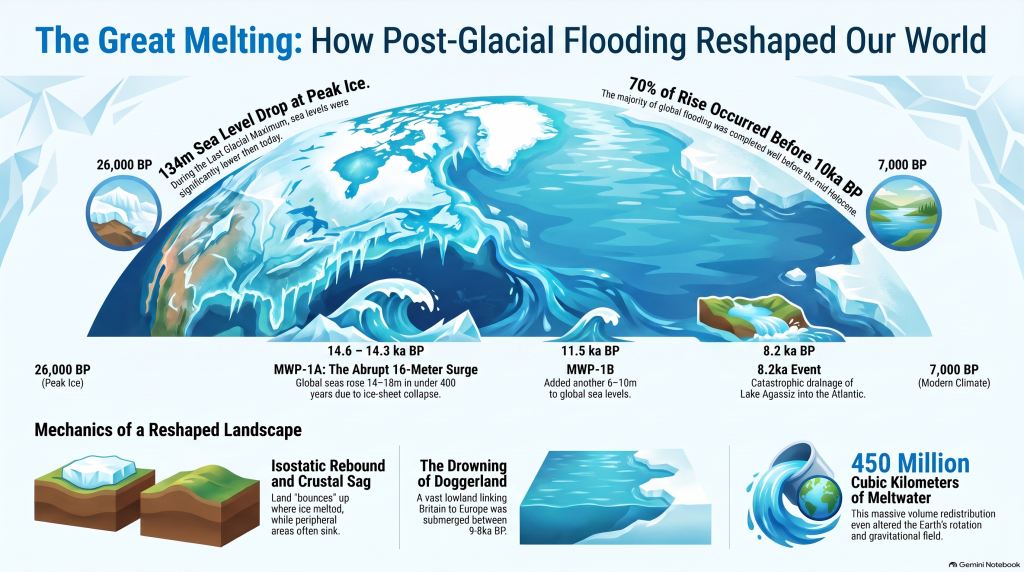
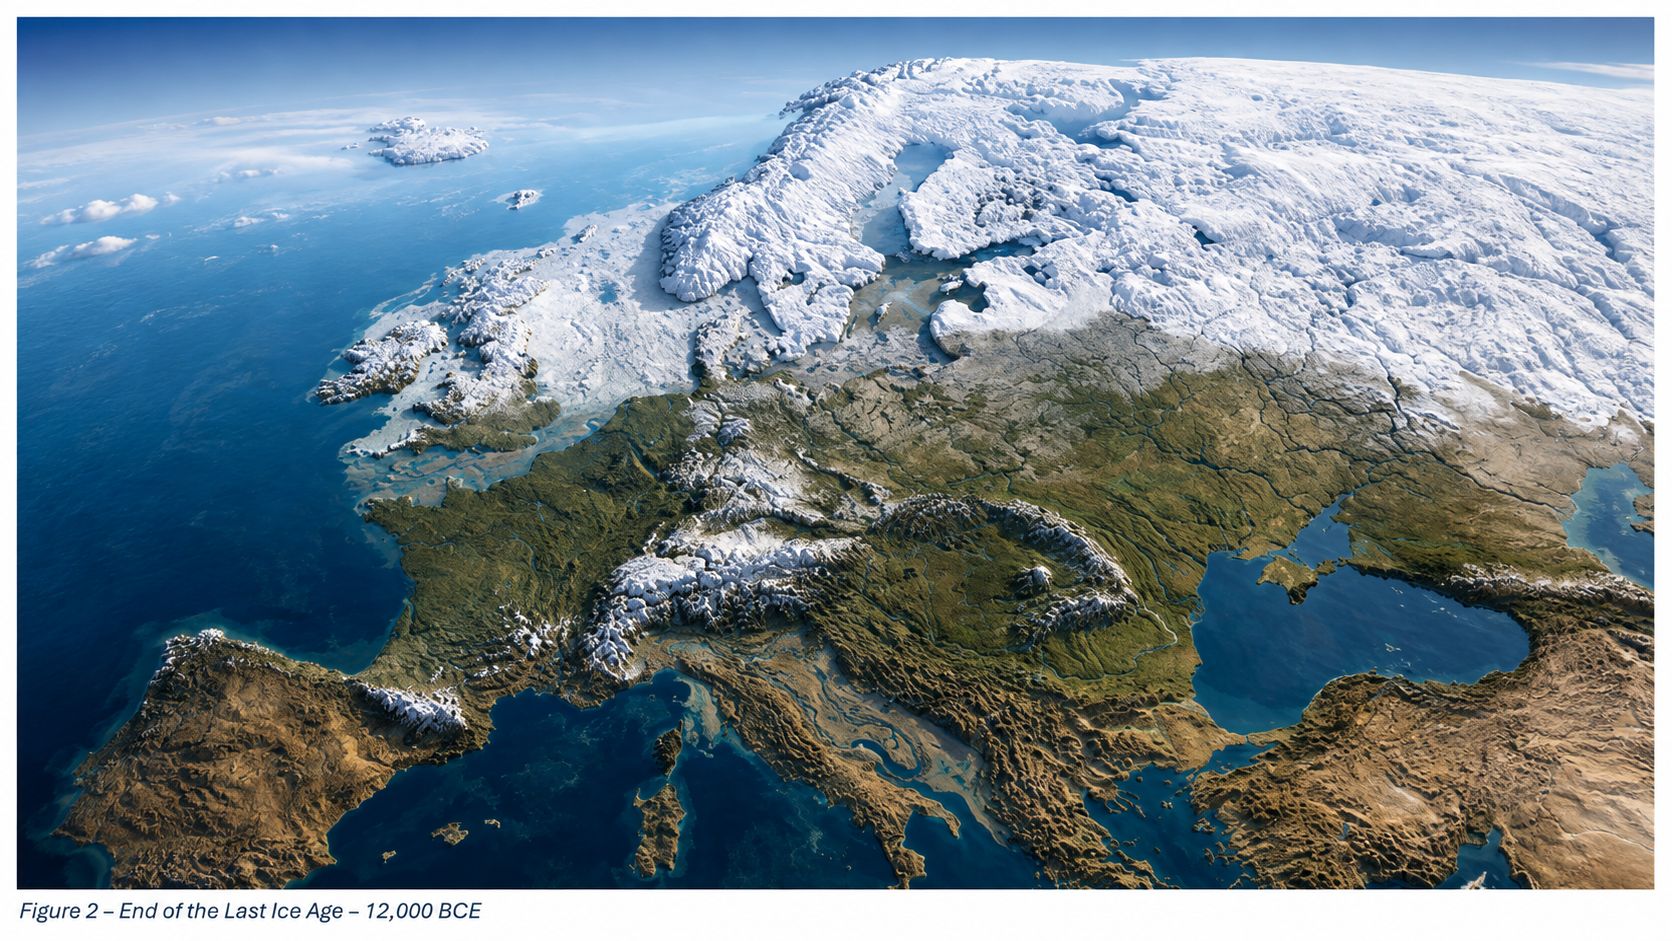
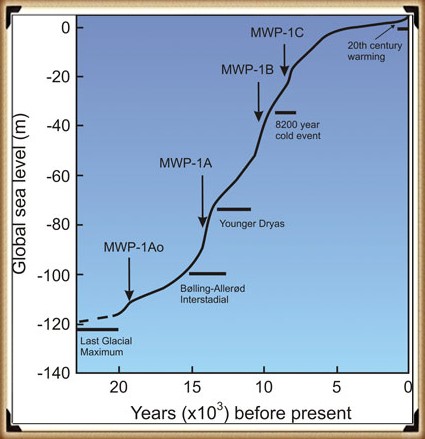
Roughly twenty-six thousand years ago, the Earth entered the final phase of the last ice age, when more than 30 million square kilometres of the northern continents were mantled by ice. Sea level dropped by over a hundred metres, continents expanded, and the atmosphere became drier and dustier. When the climate warmed, that frozen water returned to the ocean basins, transforming every river and shoreline on the planet. Understanding the magnitude and tempo of this transition is fundamental to reconstructing the landscapes that Holocene societies inherited. (The Post-Glacial Flooding Hypothesis)

The scientific history of sea-level research stretches back more than a century. Fairbridge (1961) first proposed that global “drowned terraces” recorded former sea levels. Oxygen-isotope analysis later provided a direct measure of global ice volume (Shackleton & Opdyke 1973; Chappell & Shackleton 1986). By the 1990s, uranium-thorium dating of coral reefs (Bard et al., 1990) and glacio-isostatic models (Lambeck & Chappell 2001) produced continuous global sea-level curves for the late Quaternary. Satellite altimetry and GRACE gravimetry now track present-day mass exchange between ice sheets and oceans with millimetre precision (Watkins et al., 2015; Cazenave et al., 2018).

These cumulative datasets reveal that the transformation from the Last Glacial Maximum (LGM) to the modern interglacial was neither instantaneous nor globally uniform. The following sections examine the evidence for the magnitude of the LGM, the deglacial rise in sea level, and the feedbacks that coupled ice, ocean, and atmosphere into a single dynamic system.

The Post-Glacial Flooding Hypothesis

2. The Last Glacial Maximum

The LGM, dated between ~26 000 and 19 000 years BP, represents the maximum combined extent of Northern Hemisphere ice sheets. Reconstructions by Ehlers et al. (2018) show the Laurentide Ice Sheet extending south of the Great Lakes, the Fennoscandian complex covering Scandinavia, northern Britain, and the Baltic, and separate domes over the Barents and Kara Seas. In the Southern Hemisphere, the Patagonian, New Zealand, and Antarctic ice sheets expanded simultaneously. Global mean air temperature was about 5–6 °C lower than today (Tierney et al., 2020).

Cosmogenic-nuclide dating of moraines indicates near-synchronous maxima in both hemispheres within 1–2 kyr (Balco et al., 2009). Ice cores from Antarctica record atmospheric CO₂ concentrations of only ~190 ppm, the lowest of the last 800 kyr (Lüthi et al., 2008). The increased planetary albedo and reduced greenhouse forcing locked the Earth into a radiative imbalance until orbital precession increased summer insolation at high latitudes around 21 ka BP, initiating melting.

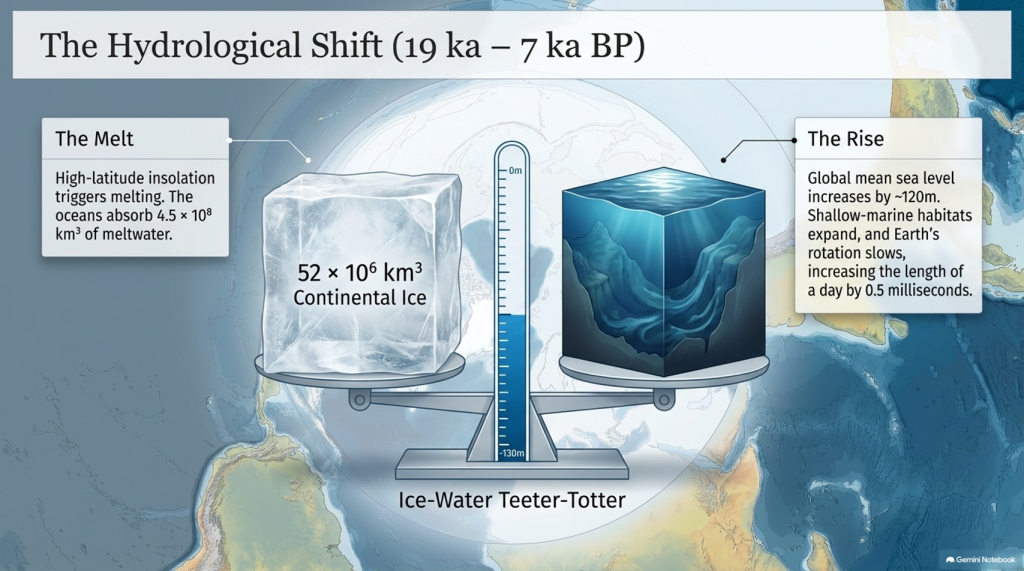
Sea level at the LGM stood 134 ± 5 m below present (Rohling et al., 2009; Lambeck et al., 2014), implying an extra ~52 × 10⁶ km³ of continental ice—roughly triple modern Antarctic volume. The load depressed the lithosphere by up to a kilometre and generated a peripheral forebulge hundreds of kilometres wide. When deglaciation began, these distortions created regional variations in relative sea level (RSL) of tens of metres—a problem that still complicates correlation between sites.

The Post-Glacial Flooding Hypothesis

3. Quantifying Global Ice and Sea-Level Change

High-resolution oxygen-isotope records from the Red Sea (Rohling et al., 2009) and global benthic stacks (Lisiecki & Raymo, 2005) define the eustatic component of sea-level change. Grant et al. (2014) extended the Red Sea curve to 500 kyr BP and confirmed an approximately linear relation between δ¹⁸O and global mean sea level within ±140 m. Combined with coral-reef U/Th dates (Peltier & Fairbanks 2006) and glacio-isostatic modelling (ICE-6G v2; Peltier et al., 2015), these data yield the following deglacial sequence:

The Post-Glacial Flooding Hypothesis
  1. Stable minimum (26–19 ka) — Sea level constant near −130 m; ice volume at maximum.
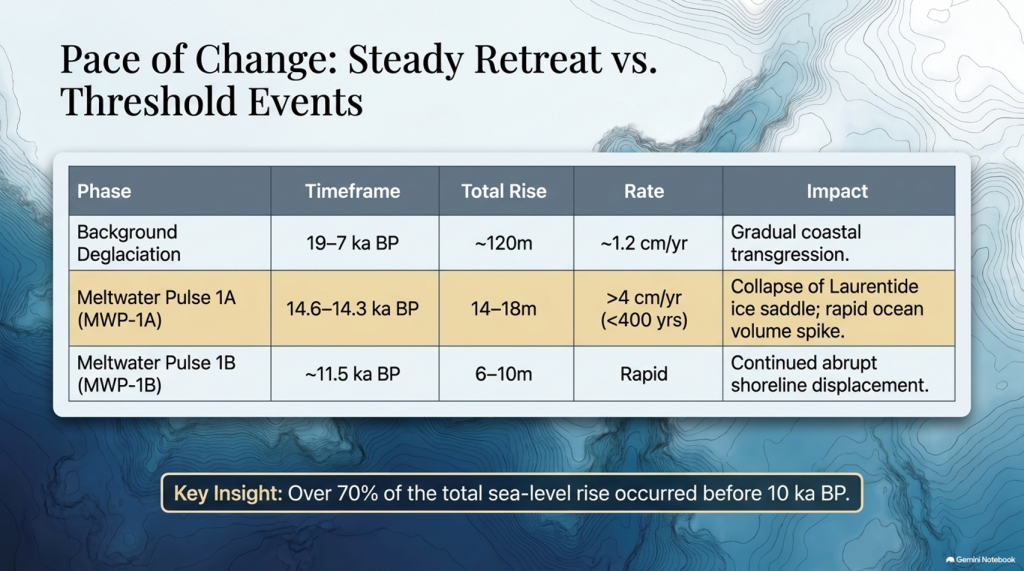
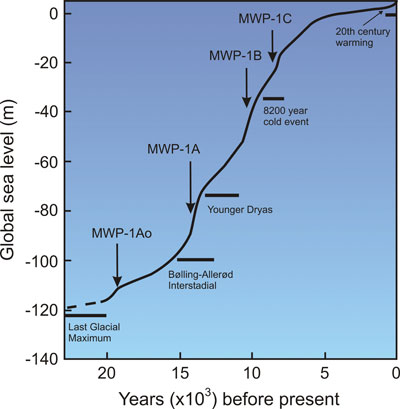
  2. Deglacial rise (19–7 ka) — Global mean increase ~120 m; average rate ~1.2 cm yr⁻¹.

Waelbroeck et al. (2019) and Gowan et al. (2021) further improved resolution, showing that roughly 70% of the total rise occurred before 10 ka BP and that rates exceeded 4 cm yr⁻¹ during short meltwater pulses. These figures quantify the pace of global hydrological reorganisation that followed the LGM.

The Post-Glacial Flooding Hypothesis

4. Meltwater Pulses and Deglacial Chronology

Superimposed on the long-term trend are several abrupt accelerations known as Meltwater Pulses (MWPs). MWP-1A (14.6–14.3 ka BP) raised global sea level by 14–18 m in < 400 years (Deschamps et al., 2012). Coral cores from Tahiti and Barbados capture the event as a distinct change in growth depth and isotope composition. MWP-1B, centred near 11.5 ka BP, added another 6–10 m (Liu et al., 2019). A later, smaller pulse (~8.2 ka BP) corresponded to catastrophic drainage of pro-glacial Lake Agassiz into the North Atlantic (Teller et al., 2002).

Numerical models (Gregoire et al., 2012) indicate that collapse of the Laurentide ice saddle triggered MWP-1A, releasing freshwater at ~0.3 Sverdrups—enough to disrupt the Atlantic Meridional Overturning Circulation (AMOC) and cause short-lived cooling across the Northern Hemisphere (Liu et al., 2009). Geomorphic evidence of megafloods, such as the Missoula outburst channels in North America (Bretz 1969; Baker 2013), provides analogues for the required discharge scale.

MWPs demonstrate that deglaciation was a series of threshold events rather than a steady retreat. The timing of pulses aligns closely with abrupt climatic shifts seen in Greenland ice cores (NGRIP Members 2004), underscoring the tight coupling between ice dynamics and global climate.

5. Isostatic Rebound and Crustal Adjustment

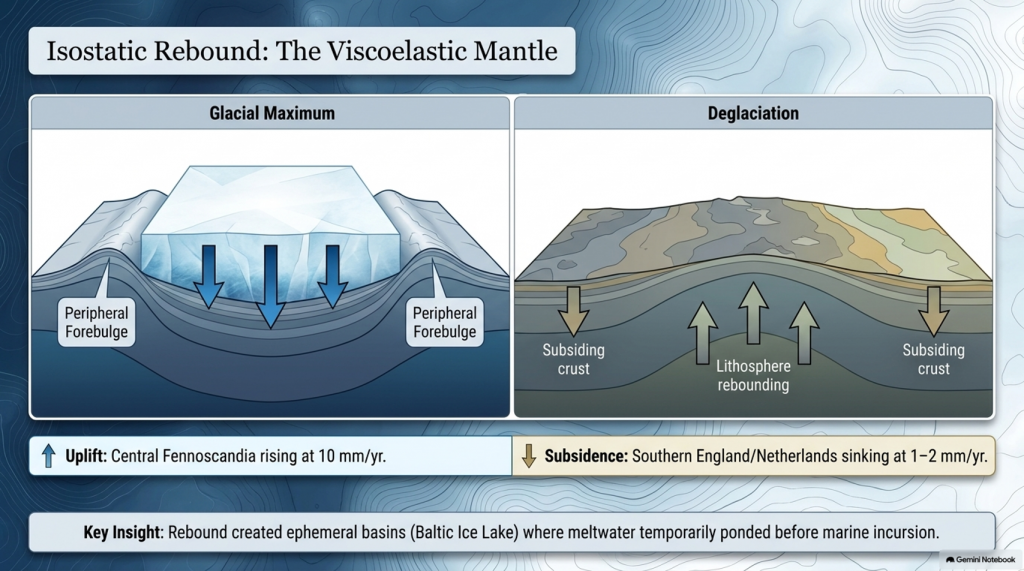
Once surface loads were removed, the lithosphere began to rebound. The process is governed by viscoelastic relaxation of the mantle with characteristic times of 1–5 kyr (Milne et al., 2006). Modern GPS and tide-gauge data show uplift of 10 mm yr⁻¹ in central Fennoscandia and subsidence of 1–2 mm yr⁻¹ in southern England and the Netherlands—the collapsing forebulge. Modelling (Lambeck et al., 2014; Peltier et al., 2015) reproduces these patterns when mantle viscosities of 3–5 × 10²¹ Pa s are used.

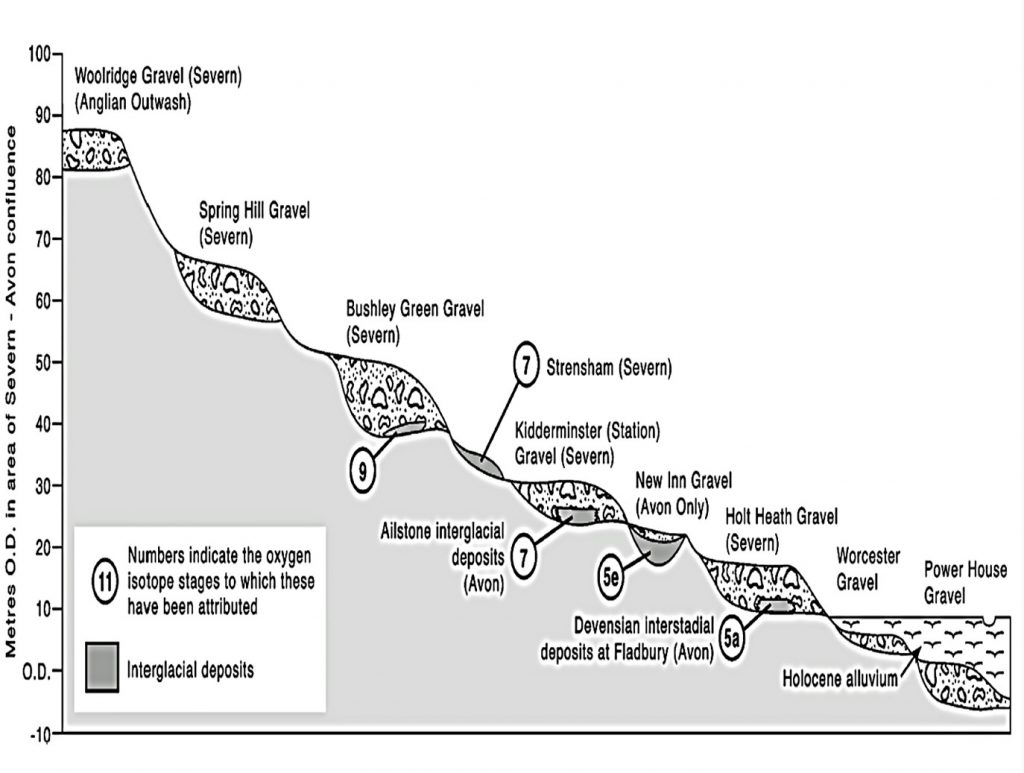
Rebound created ephemeral basins along glacial margins where meltwater ponded before marine incursion. The Baltic Ice Lake and the Champlain Sea are classic examples, forming as differential uplift temporarily dammed drainage routes (Saarnisto & Salonen 1995; Parent & Occhietti 1999). Many present-day estuaries owe their origins to these basins. Sediment cores from the Humber, Thames, and Rhine estuaries contain alternating freshwater and brackish layers that track the balance between isostasy and eustasy (Shennan et al., 2018).

The Post-Glacial Flooding Hypothesis

6. The Rebirth of the Oceans

Between 19 ka and 7 ka BP, the oceans absorbed roughly 4.5 × 10⁸ km³ of meltwater, raising mean sea level by ~120 m. Coral records from Tahiti, Huon Peninsula, and the Sunda Shelf show a remarkably consistent transgression curve (Deschamps et al., 2012; Hanebuth et al., 2000). By 7 ka BP, sea level stabilised within a few metres of the modern datum.

The redistribution of this mass altered Earth’s rotation and gravitational field, increasing the length of day by 0.5 milliseconds (Mitrovica & Munk 2003) and displacing the geoid by several decimetres. More tangibly, flooding of continental shelves expanded shallow-marine habitats and enhanced nutrient exchange between land and sea, fuelling mid-Holocene marine productivity (Haug et al., 2001). The creation of new estuarine and lagoonal systems also provided nursery grounds for species that later became critical to human subsistence.

7. Climate Feedbacks During Deglaciation

Ice-core and modelling studies reveal that the deglacial rise in greenhouse gases both responded to and accelerated warming. CO₂ increased from 190 ppm at the LGM to 270 ppm by 11 ka BP (Lüthi et al., 2008). Methane doubled from 350 to 700 ppb (Loulergue et al., 2008). The combined radiative forcing of ~2.5 W m⁻² produced a global temperature increase of ~4 °C (IPCC AR6 2021). Shakun et al. (2012) demonstrated that Antarctic warming led the CO₂ rise by several centuries, implying that oceanic outgassing initiated the feedback loop.

Freshwater discharges into the North Atlantic weakened the AMOC and triggered millennial-scale climate reversals. The Younger Dryas (12.9–11.7 ka BP) involved a 5–7 °C drop in Greenland temperatures followed by rapid recovery within a few decades (Severinghaus et al., 1998). Numerical experiments show that such shifts require freshwater fluxes of 0.05–0.1 Sverdrups (Liu et al., 2009). Once meltwater routing shifted southward and AMOC strength recovered, interglacial stability was achieved.

The Post-Glacial Flooding Hypothesis

8. The Transformation of North-West Europe

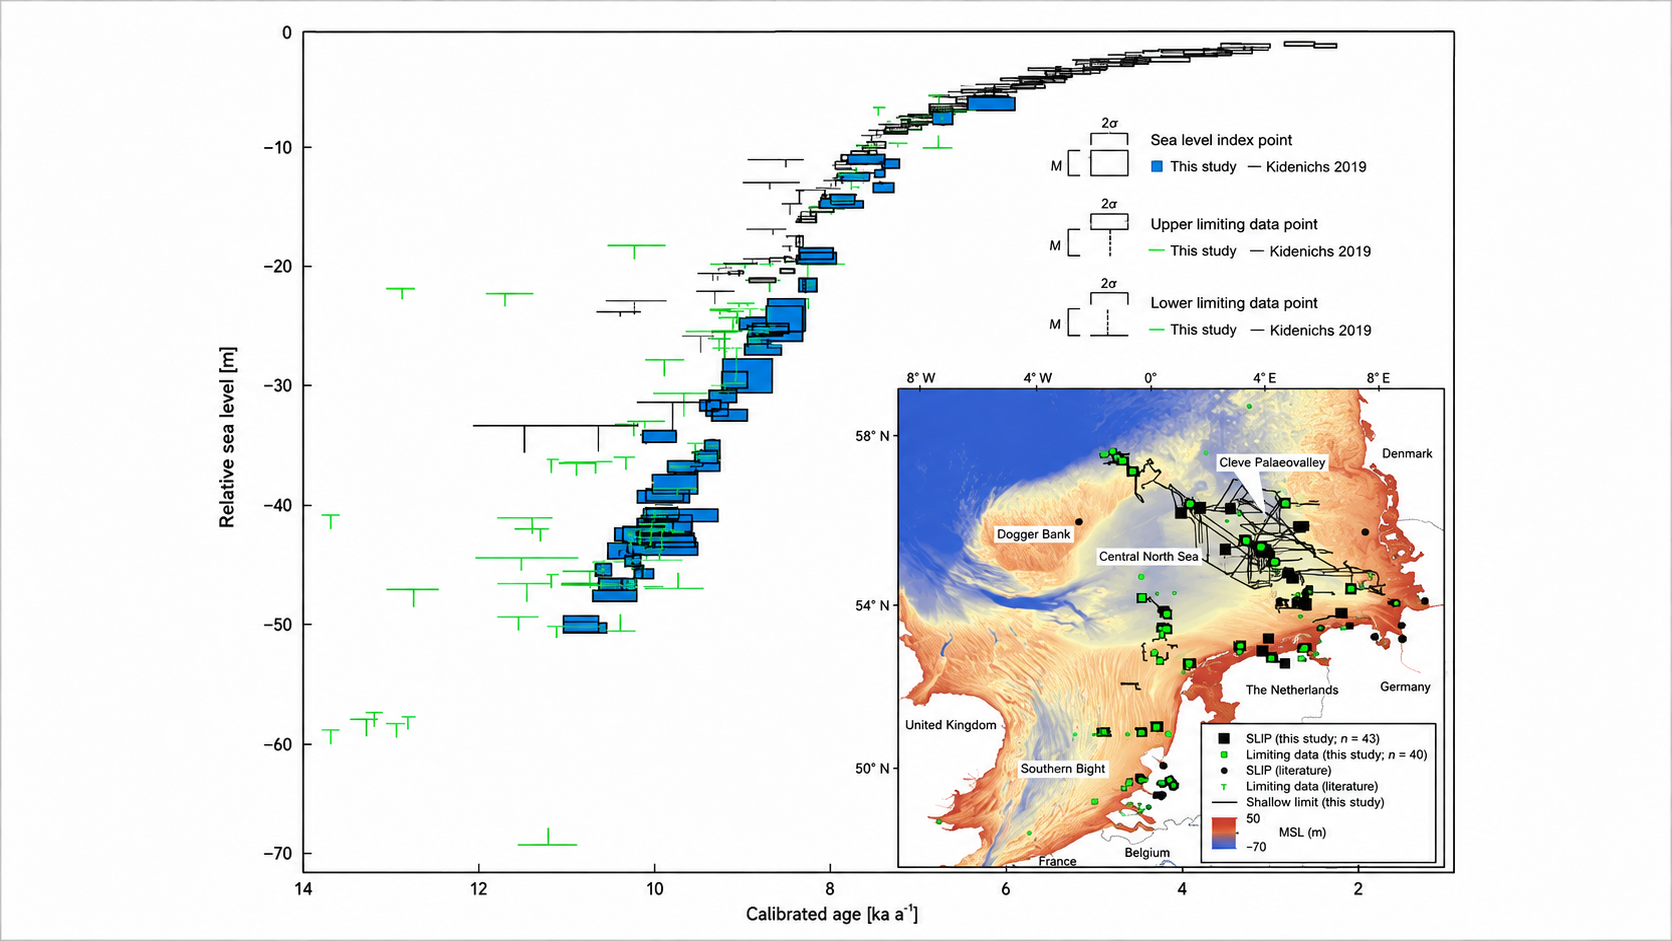
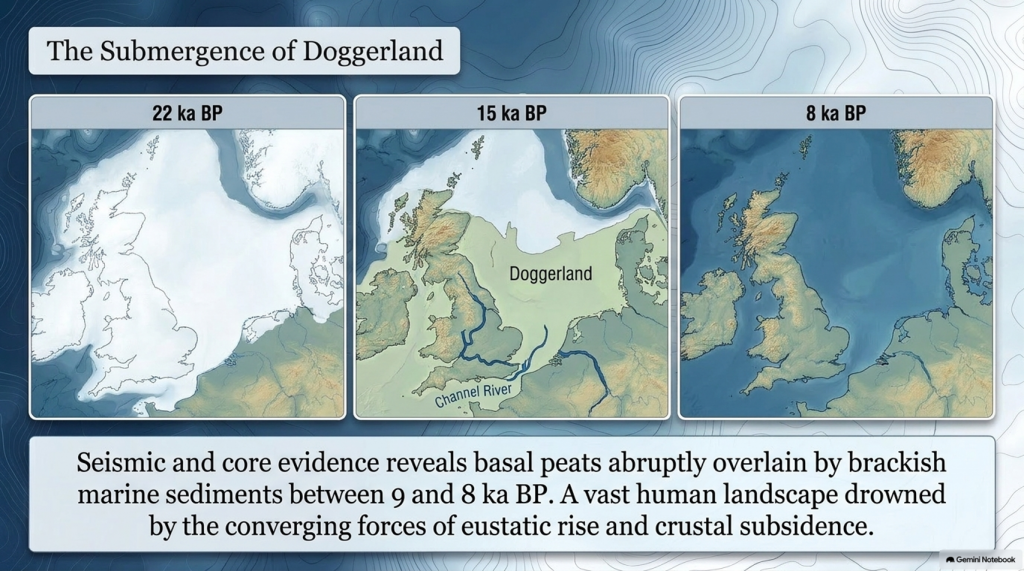
Retreat of the British–Irish Ice Sheet began near 22 ka BP and concluded by 15 ka BP (Clark et al., 2012). Deglaciation exposed outwash plains and periglacial lakes that evolved into estuaries and wetlands as sea level rose. Seismic and core evidence from the southern North Sea shows basal peats overlain by brackish and marine sediments between 9 and 8 ka BP (Hijma & Cohen 2011). These sequences chart the drowning of Doggerland—a vast lowland linking Britain to Europe. Pollen and macrofossil data indicate temperate woodland colonisation prior to submergence (Gaffney et al., 2009).

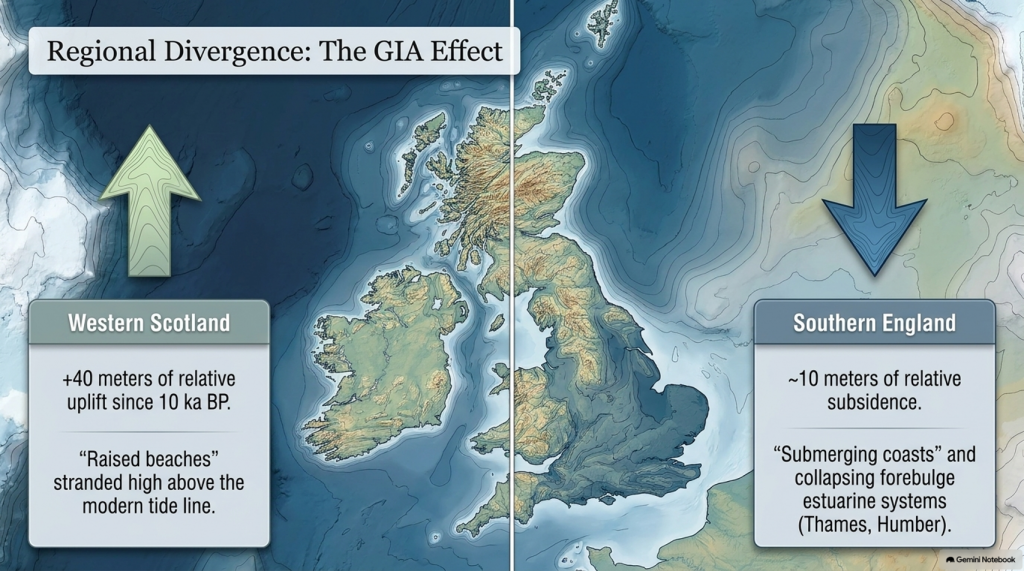
Regional RSL curves diverge sharply due to GIA: western Scotland has risen > 40 m since 10 ka, while southern England has subsided by ~10 m (Bradley et al., 2020). Raised beaches in the north and submerged forests in the south reflect this differential motion. In the English Channel, fluvial erosion during early deglaciation carved the “Channel River,” later flooded by 8 ka (Mellett et al., 2013). Similar sequences occur along the Irish and Danish coasts, documenting the progressive marine transgression of northwest Europe.

The Post-Glacial Flooding Hypothesis

9. Towards a Global–Regional Synthesis

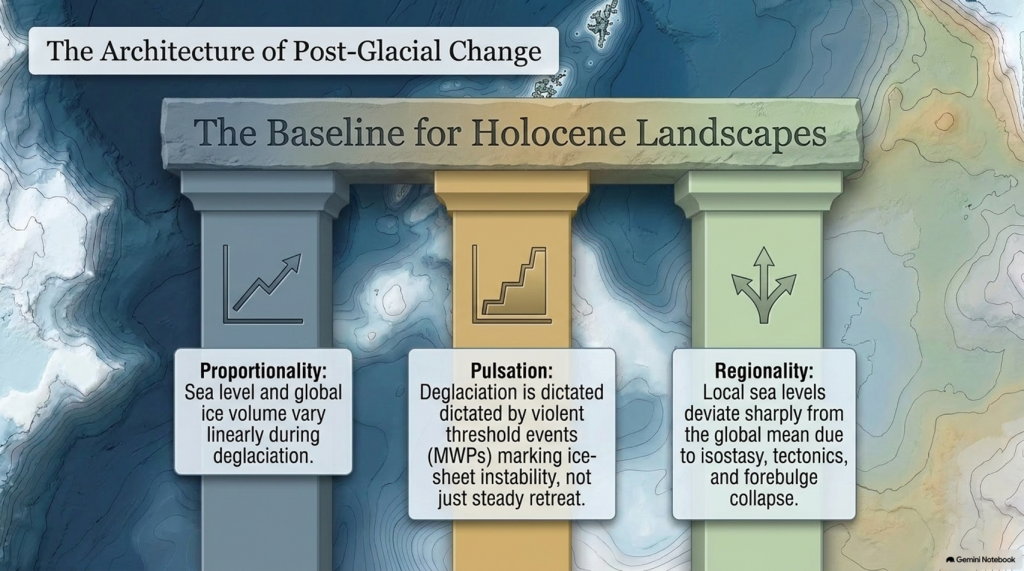
By combining isotopic, coral, and geodetic datasets, modern reconstructions achieve decimetre precision for Holocene sea level (Gowan et al., 2021). Three principles emerge:

  1. Proportionality — Sea level and global ice volume vary linearly during deglaciation.
  2. Pulsation — Superimposed meltwater pulses mark thresholds in ice-sheet stability.
  3. Regionality — Local deviations result from isostasy, tectonics, and sediment compaction.

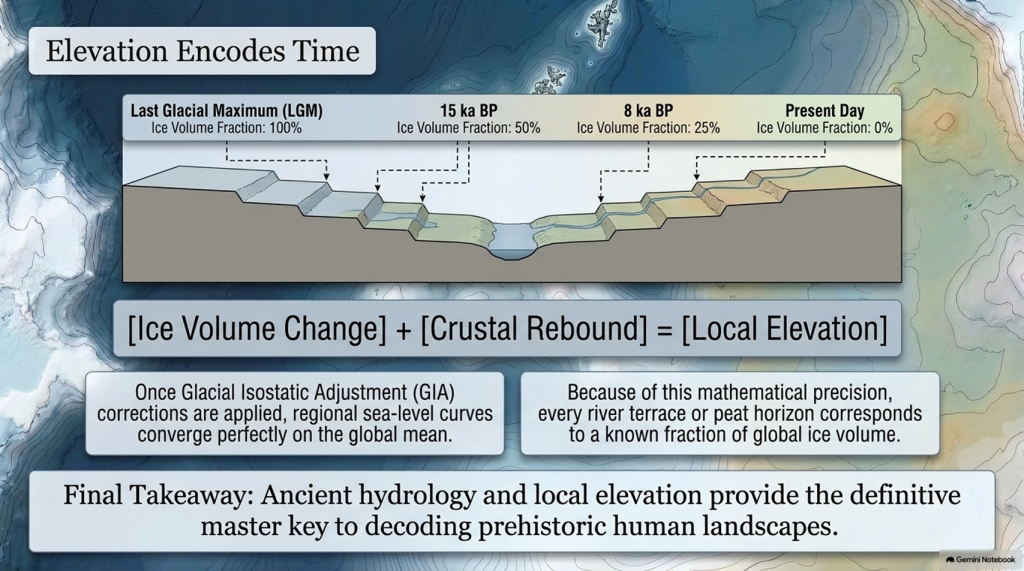
Shennan et al. (2018) synthesised over 500 Holocene RSL indicators for the British Isles, demonstrating that once GIA corrections are applied, regional curves converge on the global mean within analytical error. These findings provide a quantitative baseline for analysing river-terrace altitudes and groundwater histories in later chapters.

Equally important, comparison with modern sea-level observations highlights the extraordinary pace of contemporary change. Satellite altimetry records a mean rise of 3.4 ± 0.4 mm yr⁻¹ since 1993 (Cazenave et al., 2018)—an order of magnitude faster than the late-Holocene background rate (Kopp et al., 2016). The processes that ended the last ice age therefore remain relevant to current climate dynamics.

The Post-Glacial Flooding Hypothesis

10. Conclusion

The end of the last ice age was a planetary event in which ice, water, and rock interacted on colossal scales. Between 26 ka and 7 ka BP, sea level rose more than 120 m, ice sheets vanished from most temperate latitudes, and the hydrological cycle intensified. The evidence—oxygen-isotope curves, coral terraces, basal peats, and glacio-isostatic models—forms a coherent narrative of gradual yet punctuated change.

These quantitative reconstructions define the environmental backdrop for all Holocene landscapes. They also establish a principle crucial to later chapters: that elevation within fluvial and coastal systems encodes time, because each terrace or peat horizon corresponds to a known fraction of global ice volume. The following chapter therefore turns from global physics to the mathematical description of flooding itself—the equations that translate ice-volume change into measurable hydrological response.

The Post-Glacial Flooding Hypothesis

Plain-Language Conclusion

The ice age was like the planet putting a huge amount of the world’s water into giant freezers on land.  When those freezers started to melt:

  • All that stored water went back into the oceans.
  • The seas rose by about 120 metres.
  • The weight of the ice came off the land, so some places bounced up, others sagged down.

Scientists can see this story in:

  • tiny shells on the sea floor,
  • old coral reefs now sitting at the “wrong” depths,
  • layers of mud and peat around coasts.

Put simply:

We froze the oceans on land, then poured them back in. The combination of rising seas and bouncing crust rearranged coastlines everywhere, and we can measure it.

To read the rest of the book, follow this link: https://prehistoric-britain.co.uk/the-post-glacial-flooding-hypothesis-book

FREE ONLINE BOOK is available HERE: https://prehistoric-britain.co.uk/the-post-glacial-flooding-hypothesis-book

PODCAST

Author’s Biography

Robert John Langdon, a polymathic luminary, emerges as a writer, historian, and eminent specialist in LiDAR Landscape Archaeology.

His intellectual voyage has been interwoven with stints as an astute scrutineer in government and grand corporate bastions, a tapestry spanning British Telecommunications, Cable and Wireless, British Gas, and the esteemed University of London.

A decade hence, Robert’s transition into retirement unfurled a chapter of insatiable curiosity. This phase saw him immerse himself in Politics, Archaeology, Philosophy, and the enigmatic realm of Quantum Mechanics. His academic odyssey traversed the venerable corridors of knowledge hubs such as the Museum of London, University College London, Birkbeck College, The City Literature Institute, and Chichester University.

In the symphony of his life, Robert is a custodian of three progeny and a pair of cherished grandchildren. His sanctuary lies ensconced in the embrace of West Wales, where he inhabits an isolated cottage, its windows framing a vista of the boundless sea – a retreat from the scrutinising gaze of Her Majesty’s Revenue and Customs, an amiable clandestinity in the lap of nature.

Exploring Prehistoric Britain: A Journey Through Time

My blog delves into the fascinating mysteries of prehistoric Britain, challenging conventional narratives and offering fresh perspectives grounded in cutting-edge research, particularly LiDAR technology. I invite you to explore some key areas of my research. For example, the Wansdyke, often cited as a defensive structure, is re-examined in light of new evidence. I’ve presented my findings in my blog post Wansdyke: A British Frontier Wall – ‘Debunked’, and a Wansdyke LiDAR Flyover video further visualises my conclusions.

My work also often challenges established archaeological dogma. I argue that many sites, such as Hambledon Hill, commonly identified as Iron Age hillforts, are not what they seem. My posts Lidar Investigation Hambledon Hill – NOT an ‘Iron Age Fort’ and Unmasking the “Iron Age Hillfort” Myth explore these ideas in detail and offer an alternative view. Similarly, sites like Cissbury Ring and White Sheet Camp receive re-evaluations based on LiDAR analysis in my posts “Lidar Investigation Cissbury Ring through time” and “Lidar Investigation White Sheet Camp, revealing fascinating insights into their true purpose. I have also examined South Cadbury Castle, often linked to the mythical Camelot56.

My research also extends to ancient water management, including the role of canals and other linear earthworks. I have discussed the true origins of Car Dyke in multiple posts, including Car Dyke – ABC News Podcast and Lidar Investigation Car Dyke – North Section, which suggest a Mesolithic origin 2357. I also explore the misidentification of Roman aqueducts, as seen in my posts on the Great Chesters (Roman) Aqueduct. My research has also been greatly informed by my post-glacial flooding hypothesis, which has helped explain landscape transformations over time. I have discussed this hypothesis in several posts, including AI now supports my Post-Glacial Flooding Hypothesis and Exploring Britain’s Flooded Past: A Personal Journey

Finally, my blog also investigates prehistoric burial practices, as seen in Prehistoric Burial Practices of Britain and explores the mystery of Pillow Mounds, often mistaken for medieval rabbit warrens, but with a potential link to Bronze Age cremation in my posts: Pillow Mounds: A Bronze Age Legacy of Cremation? and The Mystery of Pillow Mounds: Are They Really Medieval Rabbit Warrens?. My research also includes astronomical insights into ancient sites, for example, in Rediscovering the Winter Solstice: The Original Winter Festival. I also review new information about the construction of Stonehenge in The Stonehenge Enigma.

Further Reading

For those interested in British Prehistory, visit www.prehistoric-britain.co.uk, a comprehensive resource featuring an extensive collection of archaeology articles, modern LiDAR investigations, and groundbreaking research. The site also includes insights and excerpts from the acclaimed Robert John Langdon Trilogy, a series of books that explore Britain during the Prehistoric period. Titles in the trilogy include The Stonehenge Enigma, Dawn of the Lost Civilisation, and The Post-Glacial Flooding Hypothesis, which offer compelling evidence of ancient landscapes shaped by post-glacial flooding.

To further explore these topics, Robert John Langdon has developed a dedicated YouTube channel featuring over 100 video documentaries and investigations that complement the trilogy. Notable discoveries and studies showcased on the channel include 13 Things that Don’t Make Sense in History and the revelation of Silbury Avenue – The Lost Stone Avenue, a rediscovered prehistoric feature at Avebury, Wiltshire.

In addition to his main works, Langdon has released a series of shorter, accessible publications, ideal for readers delving into specific topics. These include:

For active discussions and updates on the trilogy’s findings and recent LiDAR investigations, join our vibrant community on Facebook. Engage with like-minded enthusiasts by leaving a message or contributing to debates in our Facebook Group.

Whether through the books, the website, or interactive videos, we aim to provide a deeper understanding of Britain’s fascinating prehistoric past. We encourage you to explore these resources and uncover the mysteries of ancient landscapes through the lens of modern archaeology.

For more information, including chapter extracts and related publications, visit the Robert John Langdon Author Page. Dive into works such as The Stonehenge Enigma or Dawn of the Lost Civilisation, and explore cutting-edge theories that challenge traditional historical narratives.

Thurnam’s 137 Skulls: The Forgotten People Behind Britain’s Megaliths.

Long barrows, long skulls; round barrows, round skulls—and a biological division archaeology has known about for more than 150 years

1. The evidence was never lost—it was simply left behind

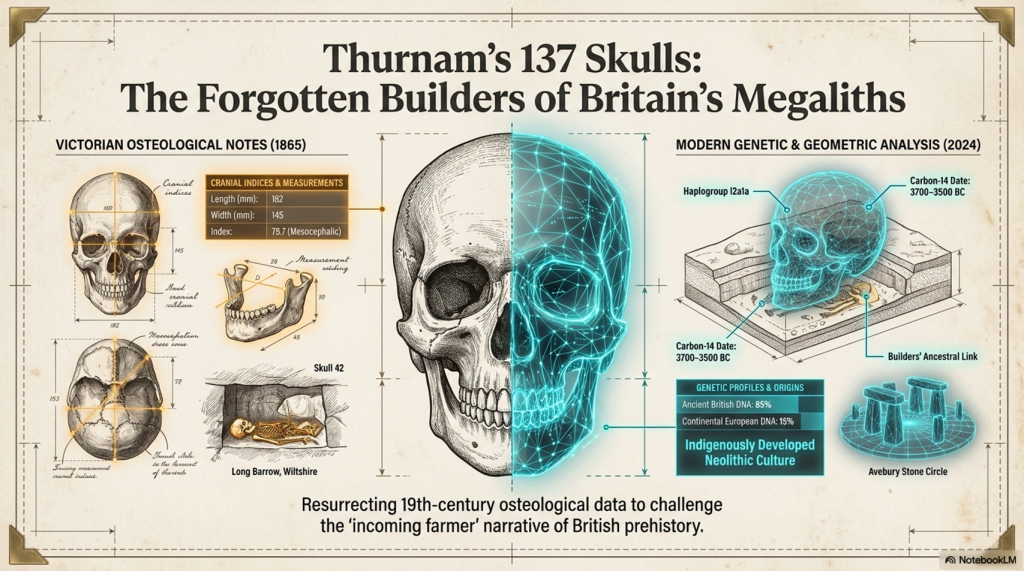
More than 150 years ago, Dr John Thurnam assembled an extraordinary body of physical evidence from Britain’s prehistoric burial monuments. He did not study a single unusual skeleton and construct a theory around it. He compared large groups of human skulls recovered from two archaeologically distinct types of monument: the earlier long barrows and the later round barrows.

His conclusion became one of the most memorable statements in British archaeology:

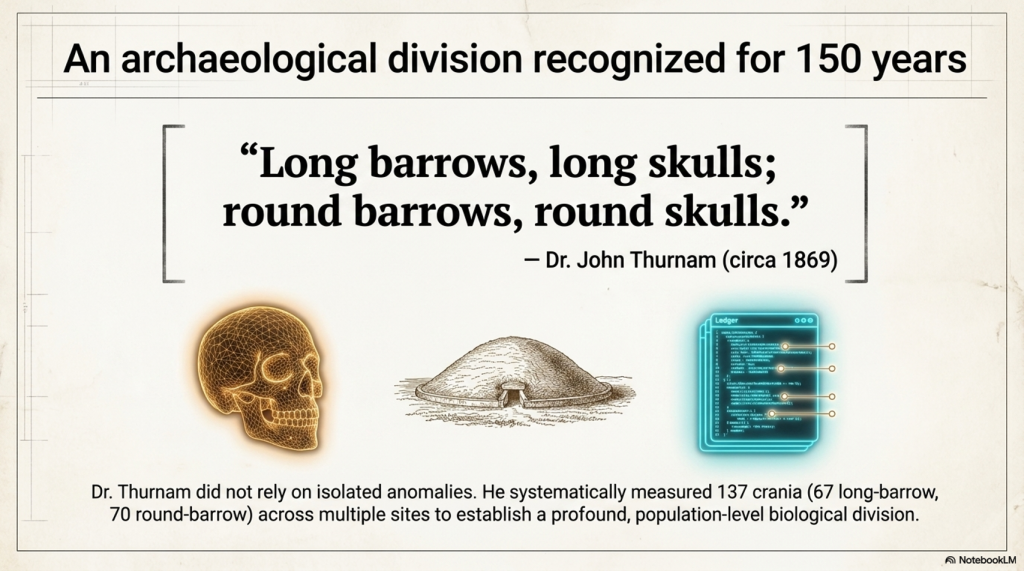
“Long barrows, long skulls; round barrows, round skulls.”

Thurnam's 137 Skulls: The Forgotten People Behind Britain's Megaliths.
Thurnam’s 137 Skulls: The Forgotten People Behind Britain’s Megaliths.

The saying survives, but the scale of the evidence behind it has largely disappeared from public discussion.

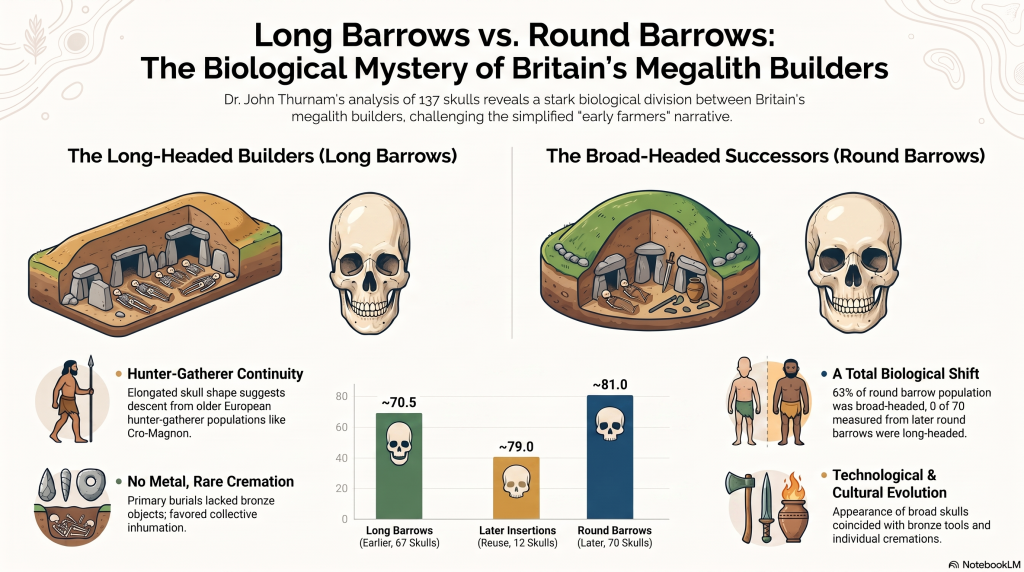
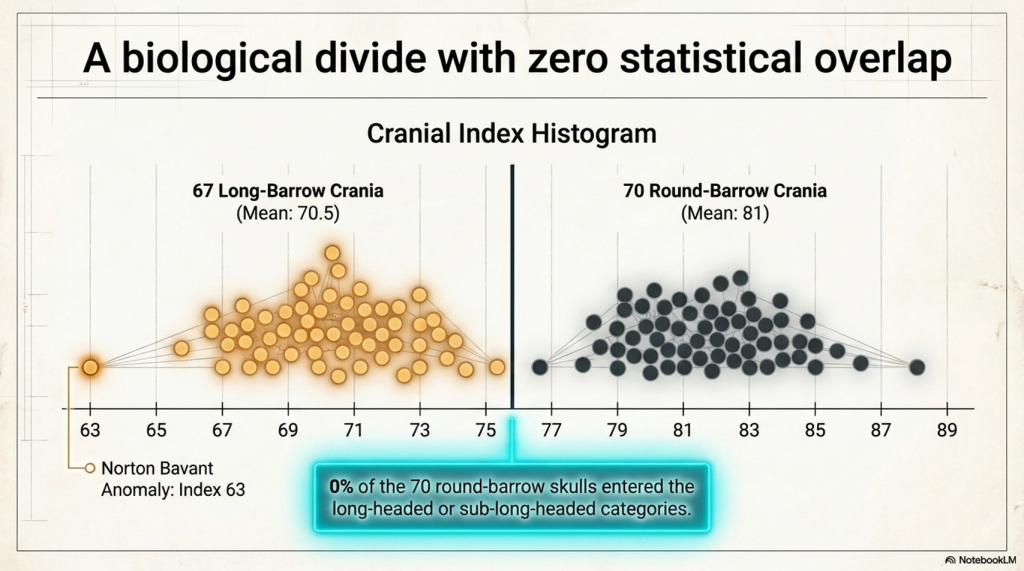
Thurnam’s two studies contain measurements from 67 long-bar­row crania and 70 round-bar­row crania—a combined sample of 137 prehistoric skulls. The long-bar­row series had a combined average cranial index of approximately 70.5. The round-bar­row series averaged approximately 81.

A cranial index is calculated by dividing the maximum breadth of a skull by its maximum length and multiplying by 100. A low index indicates a relatively long, narrow skull. A higher index indicates a shorter, broader skull.

This does not mean that one skull was literally twice the length of another. It describes the proportional relationship between length and breadth. Nevertheless, a difference between population averages of 70.5 and 81 is substantial.

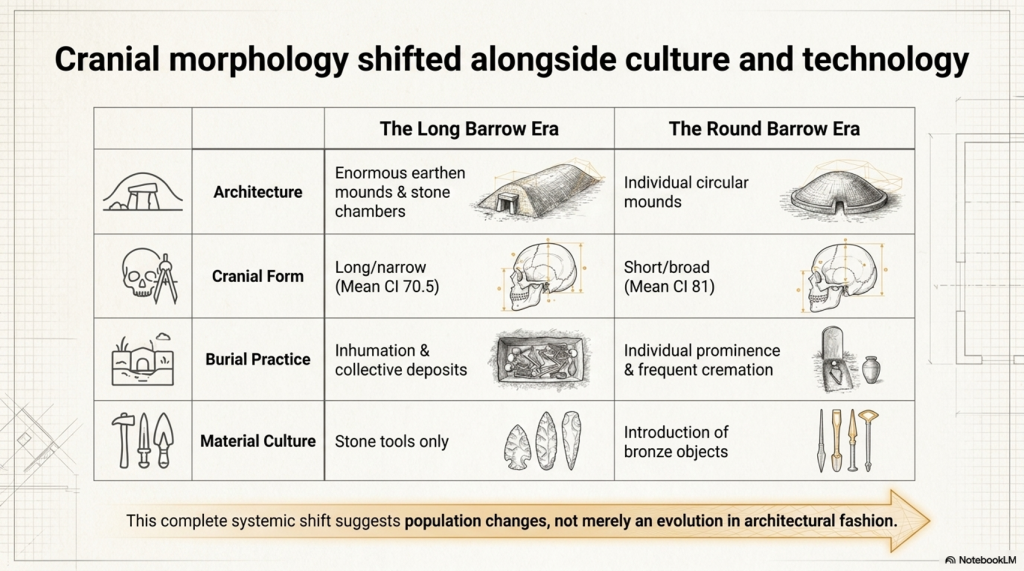
More importantly, the skull measurements did not exist in isolation. They followed changes in monument form, burial practice and associated material culture.

Thurnam classified the long barrows as the earlier monuments. Their primary deposits usually contained whole or disarticulated skeletons, often gathered together at the broad end of the mound. Metal objects were absent from the original burials, and cremation was rare and incomplete.

The round barrows belonged to a later archaeological tradition. Cremation was far more common, bronze objects appeared, and individual burials became increasingly prominent. Thurnam regarded the contrast as evidence of two different populations or chronological communities rather than a mere change in architectural fashion.

Victorian researchers surrounded these measurements with racial labels and social interpretations that cannot simply be carried into modern science. Thurnam’s ideas about chiefs, slaves, sacrifice and cannibalism must be treated as historical hypotheses, not proven explanations.

But rejecting his Victorian terminology does not make his measurements disappear.

A skull measured at a cranial index of 68 remains proportionally long, whether it was measured in 1869 or yesterday. The correct response is to remeasure the surviving specimens, establish their precise archaeological contexts, radiocarbon-date them and obtain ancient DNA.

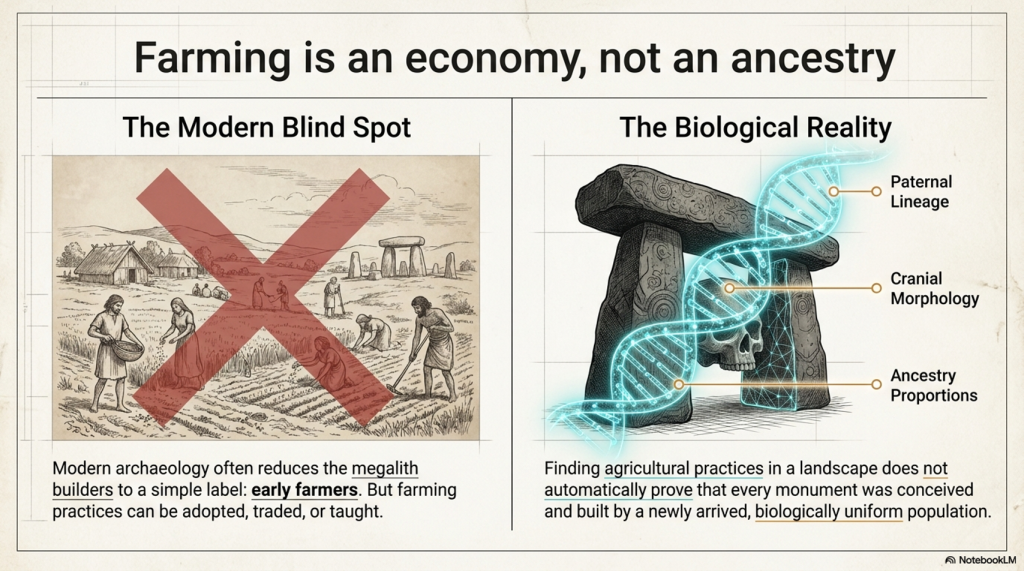
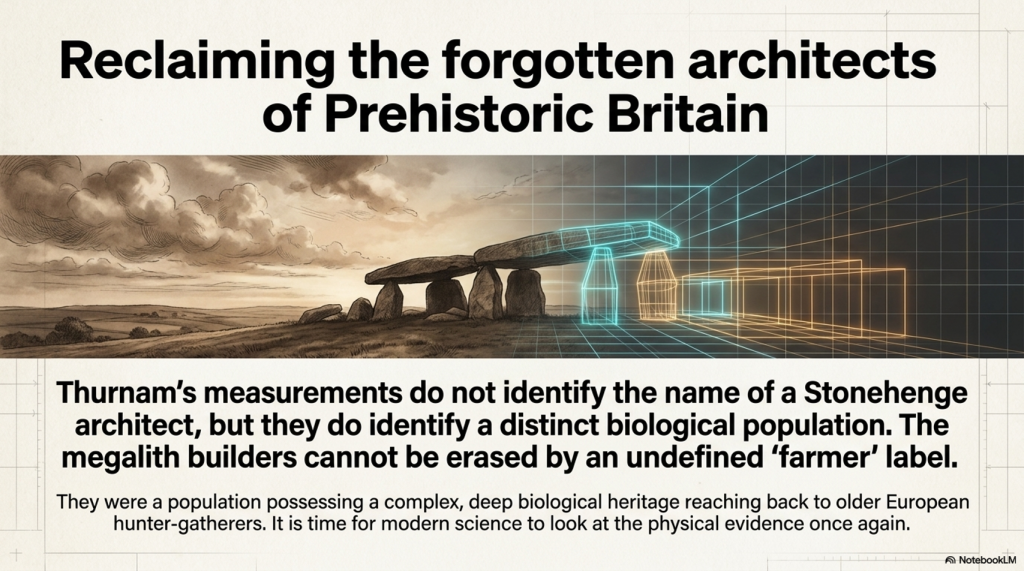
Instead, modern accounts commonly reduce the question of Britain’s megalithic builders to a simple label: early farmers.

That label may describe an economy, but it does not identify biological ancestry, monument designers, engineers or the social group whose dead were selected for burial inside the monuments.

Farming can be adopted. Domestic animals can be traded. Cultivation can spread between neighbouring populations. Finding agricultural practices in a landscape does not automatically prove that every monument in that landscape was conceived and built by a newly arrived population.

Thurnam’s evidence therefore raises a question that archaeology has never adequately resolved:

Why did the people buried in long barrows possess a consistently elongated cranial form, while the people buried in later round barrows possessed much broader skulls?

That is not a Victorian curiosity. It is a modern research question waiting to be reopened.

Thurnam's 137 Skulls: The Forgotten People Behind Britain's Megaliths.
Thurnam’s 137 Skulls: The Forgotten People Behind Britain’s Megaliths.

2. The 67 long-bar­row skulls: what Thurnam actually measured

Thurnam separated long barrows into two principal forms: unchambered long barrows and chambered long barrows.

The unchambered monuments were generally enormous earthen mounds with lateral ditches and primary burials concentrated beneath the broader and higher end. The chambered monuments incorporated stone-built compartments containing multiple human remains.

From ten unchambered long barrows, Thurnam obtained 27 measurable crania. Their indices ranged from 63 to 75, with an overall average of only 69. He described them as remarkably long and narrow.

The lowest value, 63, came from the nine-skull series at Norton Bavant. This was an exceptionally elongated skull even by the standards of the wider long-bar­row sample.

Unchambered long-bar­row crania

SiteMeasured skullsIndex rangeMean index
Winterbourne Stoke17575
Tilshead East568–7471.5
Bowl’s Barrow, Heytesbury465–7067
Fyfield, Giant’s Grave16969
Tilshead Lodge266–6867
Figheldean16767
Netheravon16969
Tilshead Old Ditch16868
Stonehenge Long Barrow 165270.5–7171
Norton Bavant963–7368.5
Total2763–7569

The table is striking because the pattern is not confined to one cemetery. It appears across multiple Wiltshire long barrows excavated at different times.

The four skulls from Bowl’s Barrow averaged 67. The two from Tilshead Lodge averaged 67. The single measurable examples from Figheldean, Netheravon and Tilshead Old Ditch produced indices of 67, 69 and 68 respectively.

Thurnam’s 27-skull unchambered series included 21 skulls he regarded as male and six as female. Although Victorian sex assessments require modern checking, this indicates that the result was not created by measuring only one sex.

The chambered long barrows produced another 40 measurable crania from seven sites.

Chambered long-bar­row crania

SiteMeasured skullsIndex rangeMean index
Uley271–7472.5
Littleton Drew768–7471
West Kennet467–7370
Nympsfield274–7574
Rodmarton571–7473
Charlton Abbot’s1768–7771
Oldbury368–7471
Total4067–7771.5

The chambered sample is slightly broader on average than the unchambered series, but it remains predominantly elongated.

West Kennet produced four skulls ranging from 67 to 73, averaging 70. Littleton Drew produced seven skulls averaging 71. Charlton Abbot’s supplied the largest chambered sample, with 17 skulls and a mean of 71.

We must not claim that every one of these 67 people was strictly dolichocephalic. Thurnam’s published tables provide site ranges and averages rather than all 67 individual measurements. At sites such as Charlton Abbot’s, where the range reaches 77, some individuals were evidently broader-headed.

What can be stated securely is that:

  • the combined long-bar­row population averaged approximately 70.5;
  • every site series had a long-headed, sub-long-headed or predominantly long-headed average;
  • the strongest unchambered series were extraordinarily elongated;
  • the pattern occurred across both earthen and chambered long-bar­row traditions.

This is not the result of selecting two spectacular museum skulls. It is a regional population pattern involving 67 measured crania from 17 monumental burial sites.

Thurnam's 137 Skulls: The Forgotten People Behind Britain's Megaliths.
Thurnam’s 137 Skulls: The Forgotten People Behind Britain’s Megaliths.

3. The 70 round-bar­row skulls: the population changes

The round-bar­row evidence is even more dramatic because Thurnam published a categorical distribution for the complete sample.

He assembled 70 skulls from later round-bar­row burials. Their cranial indices ranged from 74 to 89, with an average close to 81.

Among those 70 skulls, Thurnam found:

  • no dolichocephalic examples;
  • no sub-dolichocephalic examples;
  • 12 intermediate skulls with indices of 74–76;
  • 14 broader skulls with indices of 77–79;
  • 44 brachycephalic skulls with indices of 80–89.

Distribution of the 70 round-bar­row skulls

Cranial categoryIndex rangeNumberProportion
Dolichocephalic70 or below00%
Sub-dolichocephalic71–7300%
Orthocephalic74–761217%
Sub-brachycephalic77–791420%
Brachycephalic80–894463%
Total74–8970100%

The significance is not that every round-bar­row person had an almost spherical skull. The majority were broad-headed, while a minority occupied an intermediate range.

The critical result is that not one of the 70 entered Thurnam’s long-headed or sub-long-headed classes.

The complete contrast

Burial populationMeasured craniaApproximate mean indexLong/sub-long skulls
Long barrows6770.5Predominant, but exact individual total unavailable
Round barrows70810 of 70
Later secondary burials inside long barrows12about 79Predominantly broader-headed

The third row is particularly important.

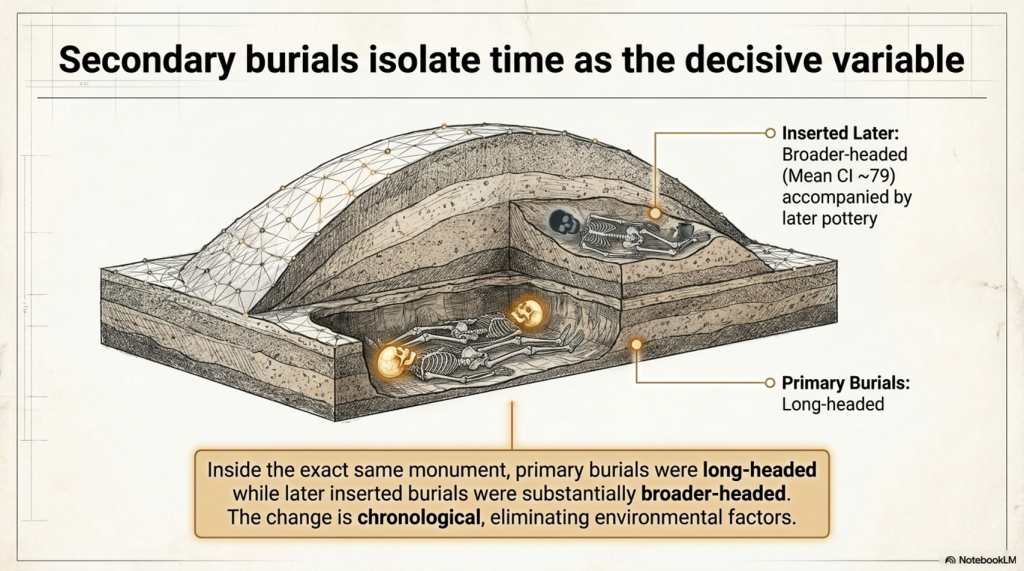
Long barrows were sometimes reopened and reused by later people. Thurnam examined 12 skulls from secondary burials inserted into Wiltshire long barrows. Their average index was approximately 79.

Some were accompanied by later pottery, including decorated drinking cups. These were not part of the original long-bar­row burial population.

This produces a remarkably controlled comparison.

Inside the same monument:

  • the primary burials were long-headed;
  • the later inserted burials were substantially broader-headed.

Therefore, the difference cannot easily be dismissed as the effect of soil, regional geography, monument location or measurement technique. The cranial form changes with the archaeological phase.

The same point is illustrated by individual named round-bar­row skulls.

Ten named Wiltshire round-bar­row examples

SiteCranial index
Kennet Hill74
Morgan’s Hill75
Stonehenge, Barrow 15078
Stonehenge, Collection 26679
Wilsford80
Winterbourne Stoke81
Roundway83
Codford83
Stonehenge, Barrow 15084
Stonehenge, Collection 26584

These ten had an average index of approximately 80.1.

The burial evidence changes as well. Thurnam’s long barrows were dominated by inhumation and collective deposits. Cremation occurred only exceptionally. In the later circular barrows, cremation was far more common and bronze artefacts became part of the archaeological record.

The evidence therefore points to more than architectural development.

We see simultaneous changes in:

  • skull proportions;
  • treatment of the dead;
  • collective versus individual burial;
  • cremation frequency;
  • monument design;
  • associated technology.

Whether this represents migration, population mixing, social selection or long-term biological change remains open to investigation.

What is not scientifically reasonable is to pretend that no physical distinction existed.


Thurnam's 137 Skulls: The Forgotten People Behind Britain's Megaliths.
Thurnam’s 137 Skulls: The Forgotten People Behind Britain’s Megaliths.

4. From Cro-Magnon to the long-bar­row population

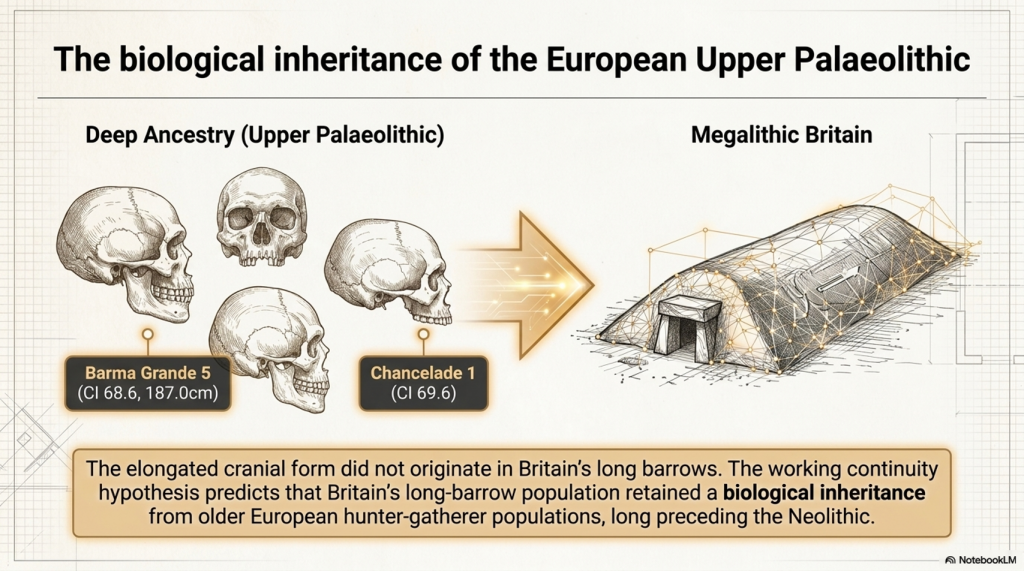
The elongated cranial form did not originate in Britain’s long barrows.

Long, narrow skulls are present much earlier in the European Upper Palaeolithic record. Specimens traditionally associated with Cro-Magnon, Barma Grande, Grotte des Enfants, Chancelade, Předmostí and other Upper Palaeolithic sites frequently possess substantial front-to-back cranial length.

“Cro-Magnon” is a historical label for early European Homo sapiens, which was once seen as a separate modern species. Nevertheless, the term remains useful when discussing a recognisable Upper Palaeolithic pattern of tall, robust bodies and large, often elongated crania.

The 2025 European cranial study by Pavel Grasgruber provides modern measurements for many of these specimens. It identifies considerable variation rather than a single universal Cro-Magnon type, but it also confirms that several Upper Palaeolithic individuals possessed conspicuously tall or narrow cranial forms.

Barma Grande 5 and Chancelade 1 stand out as tall, narrow cranial outliers. Early western European specimens including Cro-Magnon 1 and Grotte des Enfants 4 show differences from some central and eastern European Upper Palaeolithic skulls, although the study stresses that limited sample size prevents a simple biological classification.

Our own matched body-and-cranium database includes several relevant individuals:

Upper Palaeolithic/Mesolithic specimenReconstructed statureCranial index
Barma Grande 5187.0 cm68.6
Grotte des Enfants 4185.7 cm76.8
Předmostí 3183.0 cm71.8
Sungir 1183.2 cm76.6
Oberkassel 1175.1 cm72.7
Romito 4173.2 cm74.9
Bichon 1169.9 cm75.8
Chancelade 1165.7 cm69.6

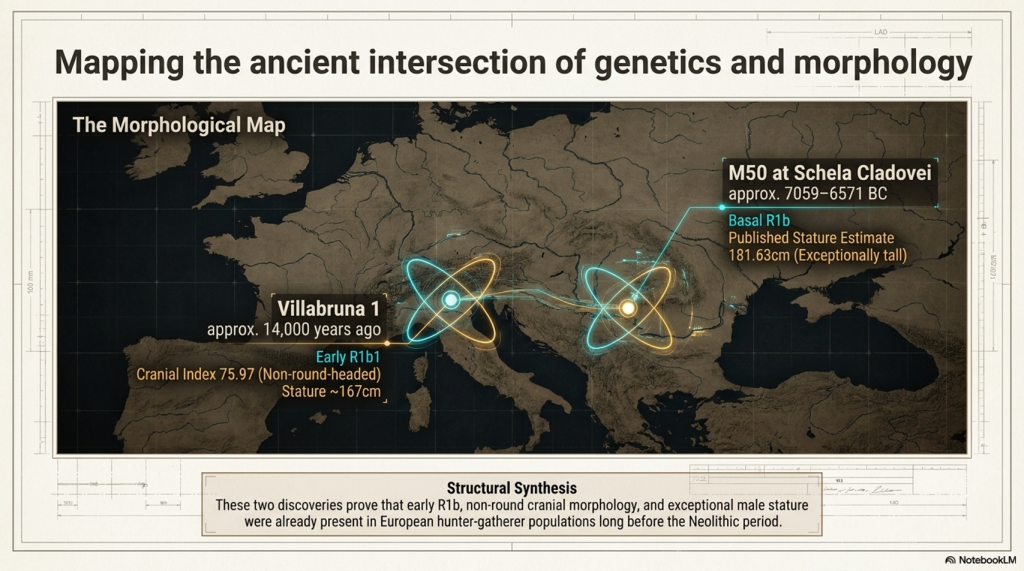
Note: Villabruna 1 and M50 provide two complementary pieces of evidence. Villabruna 1 directly connects early R1b1 with a non-round-headed cranium, having a cranial index of 75.97. M50 directly connects basal R1b with exceptional stature, having a published estimate of 181.63 centimetres. The complete combination of early R1b, exceptional stature and strongly long-headed cranial morphology has not yet been demonstrated in one securely documented individual, but both components of the working hypothesis are now represented within the early R1b record.

Thurnam's 137 Skulls: The Forgotten People Behind Britain's Megaliths.
Thurnam’s 137 Skulls: The Forgotten People Behind Britain’s Megaliths.

This demonstrates two important points.

First, an elongated skull does not automatically indicate exceptional stature. Chancelade 1 was strongly long-headed but comparatively short, while Grotte des Enfants 4 was very tall despite having a broader cranial index than Barma Grande 5.

Second, the combined pattern of tall stature, robust anatomy and elongated cranial form unquestionably existed among some Upper Palaeolithic European populations.

The central question is whether Britain’s long-barrow population represents biological continuity from these older European hunter-gatherers.

Cranial morphology is substantially inherited and has long been used to investigate biological affinity, population continuity and descent. Individual skulls may be affected by development, nutrition, cultural practices or burial pressure, but these factors cannot reasonably explain away a repeated population-level pattern involving 67 measured crania from 17 long-barrow monuments.

The evidence becomes still stronger because the cranial form changes with the archaeological phase. The primary long-barrow burials were predominantly long-headed, while the later secondary burials inserted into the same monuments were substantially broader-headed. The later round-barrow population was broader-headed again.

This is not a random collection of unusual skulls. It is a structured biological pattern associated with different burial populations and different archaeological periods.

The working continuity hypothesis is therefore:

Britain’s long-barrow population retained a substantial biological inheritance from older European hunter-gatherer populations, including the elongated cranial form visible among parts of the Upper Palaeolithic population traditionally described as Cro-Magnon.

This does not require every long-barrow individual to have been identical to every Upper Palaeolithic specimen. Ancient populations contained variation, just as modern populations do. The argument concerns biological continuity across populations, not the claim that one unchanging physical type survived for tens of thousands of years.

Thurnam's 137 Skulls: The Forgotten People Behind Britain's Megaliths.
Thurnam’s 137 Skulls: The Forgotten People Behind Britain’s Megaliths.

The conventional narrative proposes that Anatolian-derived farming populations migrated progressively across Europe and eventually reached Britain. However, genetic resemblance alone does not establish that migration route, and our analysis of more than 14,000 calibrated radiocarbon records has not identified the archaeological trail that such a mass population movement should have produced.

There is no coherent sequence of increasingly later settlement sites running from Anatolia through southeastern Europe, central Europe, France and finally Britain. Nor is there the expected concentration of early sites along the proposed migration corridor. Instead, the radiocarbon evidence shows extensive activity already present in northwestern Europe during the period in which the supposed farmer migration is claimed to have occurred.

Genetic components described as Anatolian-related may reflect shared ancestry, contact, intermarriage or limited gene flow. They do not automatically prove that a large farming population crossed Europe, replaced indigenous communities or constructed Britain’s monumental landscape.

It is therefore entirely possible that people later classified archaeologically as “farmers” were substantially descended from older European hunter-gatherer populations who adopted cultivation, livestock and new material practices without being biologically replaced.

The important distinction is this:

Agriculture describes what people did. Cranial morphology helps establish who they descended from, while radiocarbon evidence tests whether the claimed migration actually occurred.

The long-barrow measurements therefore support biological continuity with Europe’s older inhabitants, while the radiocarbon record provides no corresponding settlement trail for the conventional Anatolian farmer migration narrative


Thurnam's 137 Skulls: The Forgotten People Behind Britain's Megaliths.
Thurnam’s 137 Skulls: The Forgotten People Behind Britain’s Megaliths.

5. The R1b question: what the archaeological record permits us to predict

R1b is not a blood group. It is a Y-chromosome haplogroup passed primarily through the paternal line.

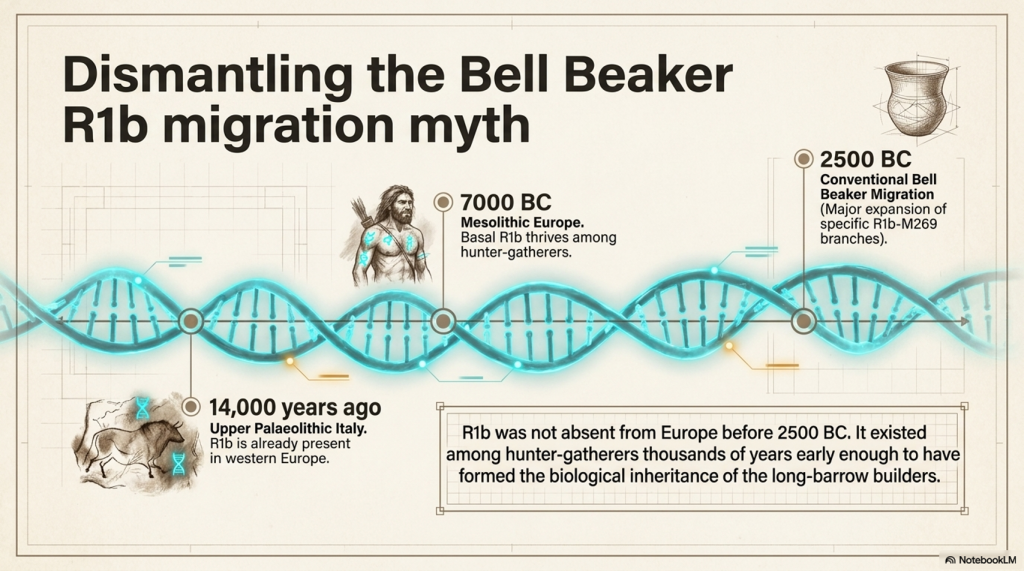
The traditional popular narrative often associates the major expansion of R1b in western Europe with Bronze Age Steppe-related or Bell Beaker populations after approximately 2500 BC.

That explanation may describe a major later expansion of particular R1b branches, especially those descending from R1b-M269.

It cannot mean that R1b itself was absent from Europe before the Bell Beaker period.

Ancient DNA has now identified R1b among European hunter-gatherers thousands of years before the proposed Bell Beaker migration.

Villabruna 1: R1b in Upper Palaeolithic Italy

The earliest confirmed R1b individual currently known is Villabruna 1, discovered at Riparo Villabruna in northern Italy.

Villabruna 1:

  • was an adult male;
  • belonged to the Late Upper Palaeolithic Epigravettian population;
  • was directly dated to approximately 14,000 years ago;
  • carried the early paternal lineage R1b1, or R-L754;
  • had estimated stature results ranging from approximately 167.2 to 169.1 centimetres.

The average stature reported for European Late Upper Palaeolithic males was approximately 165.6 centimetres. Villabruna 1 therefore fell within the taller part of the known male range for his period.

Villabruna 1 places R1b in western Europe around nine thousand years before the conventional Bell Beaker horizon.

His discovery separates two questions that are too often confused.

The first is when R1b originally appeared in Europe.

The second is when particular later branches of R1b expanded and became dominant.

The expansion of some R1b branches during the Bronze Age cannot be presented as the first appearance of the wider R1b lineage in Europe.

Thurnam's 137 Skulls: The Forgotten People Behind Britain's Megaliths.
Thurnam’s 137 Skulls: The Forgotten People Behind Britain’s Megaliths.

M50: a tall Mesolithic R1b hunter-gatherer

The strongest direct body-and-DNA crossover currently in our database is I4655, also recorded as SCCL_50 and M50, from Schela Cladovei on the Romanian bank of the Danube.

This individual:

  • belonged to basal R-L754/R1b;
  • dates to approximately 7059–6571 calibrated BC;
  • had a right tibia measuring 412 millimetres;
  • received a published stature estimate of 181.63 centimetres.

This is direct evidence that an exceptionally tall Mesolithic European man carried basal R1b roughly four thousand years before the conventional Bell Beaker horizon.

M50 is particularly important to our investigation because his stature fits the physical pattern being examined.

The evidence already shows that some Upper Palaeolithic European populations possessed tall stature, robust skeletal proportions and elongated cranial forms.

M50 now demonstrates that exceptional stature was also present in at least one securely identified early R1b hunter-gatherer.

It does not prove that M50 possessed an elongated skull, because his individual cranium has not yet been securely matched to published cranial measurements.

Nor does it prove that Britain’s long-barrow population was predominantly R1b.

What it proves is that R1b existed among European hunter-gatherers early enough to have formed part of the biological inheritance from which later long-barrow populations could have developed.

Villabruna 1 establishes the presence of R1b in Upper Palaeolithic western Europe.

M50 demonstrates the continued presence of basal R1b among Mesolithic hunter-gatherers and provides a direct association with exceptional male stature.

The responsible hypothesis is therefore:

Early R1b paternal lineages were present among European hunter-gatherers long before the Bell Beaker period, and Britain’s long-headed long-barrow population may have included descendants carrying those lineages.

That is a prediction capable of being tested.

It is not yet a universal conclusion.

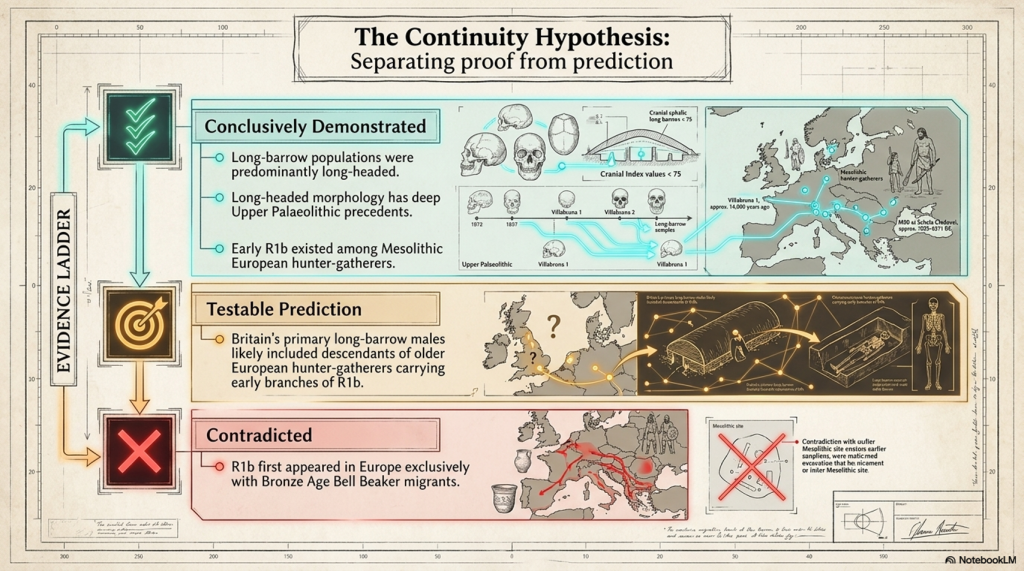
The evidence ladder

StatementPresent status
R1b existed in Upper Palaeolithic western EuropeDirectly demonstrated by Villabruna 1 approximately 14,000 years ago
Villabruna 1 was relatively tall for his periodSupported by published stature estimates of approximately 167.2–169.1 centimetres
Basal R1b existed among Mesolithic European hunter-gatherersDirectly demonstrated
Some early R1b individuals were exceptionally tallDirectly demonstrated by I4655/M50, estimated at 181.63 centimetres
Long-headed European populations existed before the NeolithicDirectly demonstrated by Upper Palaeolithic and Mesolithic cranial measurements
Britain’s primary long-barrow burials were predominantly long-headedStrongly demonstrated by Thurnam’s series of 67 crania
Britain’s long-barrow population included males carrying R1bPlausible and directly testable, but not yet demonstrated across the population
All long-headed prehistoric people carried R1bNot demonstrated
All early R1b individuals were tall or long-headedNot demonstrated
R1b first appeared in Europe with Bell Beaker migrantsContradicted if interpreted as the first European appearance of the wider R1b lineage
Particular later R1b branches expanded during the Bronze AgePossible, but separate from the earlier presence of basal R1b

The absence of a securely identified round-headed early R1b individual in our present register strengthens the working association between early R1b, greater stature and elongated cranial form.

However, the absence of contradictory evidence is not the same as proof.

The archaeological record currently presents two independently demonstrated patterns.

The first is the presence of R1b paternal lineages among Upper Palaeolithic and Mesolithic European hunter-gatherers.

The second is the persistence of elongated cranial morphology from older European populations into Britain’s primary long-barrow burial population.

The working hypothesis is that these two patterns may intersect.

Britain’s long-headed long-barrow population may have included descendants of older European hunter-gatherers carrying early branches of R1b.

This is not an attempt to project the later Bell Beaker model backwards into an earlier period.

It is a testable prediction based on:

  • the confirmed presence of R1b in Upper Palaeolithic Italy;
  • the confirmed presence of basal R1b among Mesolithic Danube hunter-gatherers;
  • the exceptional stature of M50;
  • the existence of elongated cranial forms among older European populations;
  • the predominantly long-headed character of Britain’s primary long-barrow burials.
Thurnam's 137 Skulls: The Forgotten People Behind Britain's Megaliths.
Thurnam’s 137 Skulls: The Forgotten People Behind Britain’s Megaliths.

Aveline’s Hole: the missing British crossover

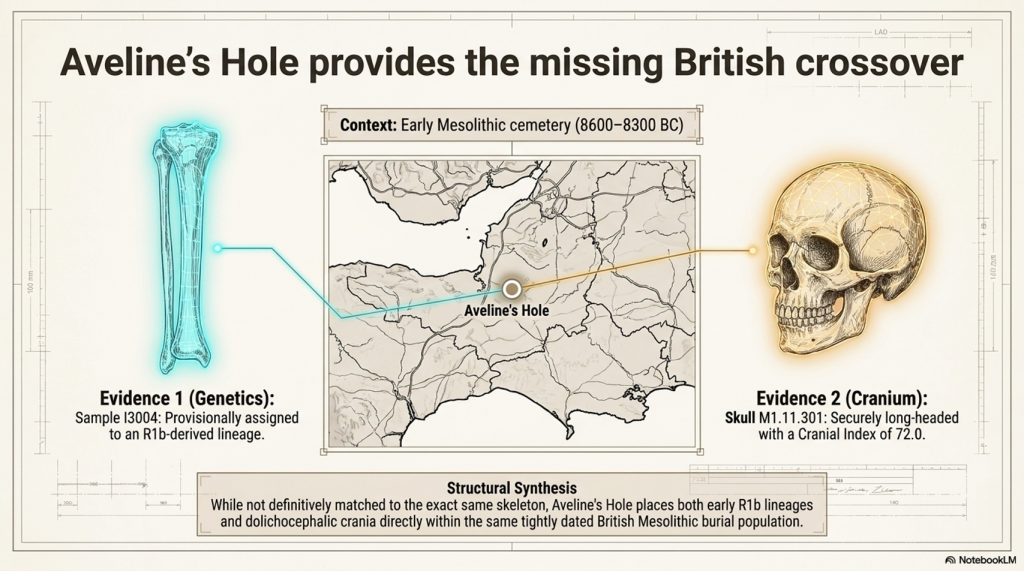
A third and potentially critical connection comes from Aveline’s Hole in Somerset, Britain’s largest known Early Mesolithic cemetery.

The male genetic sample I3004, also recorded as SB 337B3, came from a human tibia directly dated to approximately 8600–8300 BC.

The current genetic annotation assigns this individual to an R1b-derived paternal lineage. This would place R1b in Britain more than five thousand years before the conventional Bell Beaker horizon.

Aveline’s Hole also produced directly measured long-headed crania.

The reconstructed skull M1.11.301 had a maximum cranial length of 186 millimetres and a maximum breadth of 134 millimetres. Its cranial index was 72.0, placing it securely within the dolichocephalic, or long-headed, category.

The surviving evidence does not presently demonstrate that the R1b tibia and the long-headed skull belonged to the same person. They must therefore not be combined as though they represent a single securely reconstructed individual.

Nevertheless, their occurrence within the same tightly dated Early Mesolithic burial population is highly significant.

Aveline’s Hole provides the missing geographical and chronological bridge between the other two early R1b findings.

Villabruna 1 demonstrates that R1b1 was present in Upper Palaeolithic Italy approximately fourteen thousand years ago and was carried by an individual with a non-round-headed cranium.

M50 at Schela Cladovei demonstrates that basal R1b was carried by an exceptionally tall Mesolithic man whose published stature estimate was 181.63 centimetres.

Aveline’s Hole places an R1b-derived paternal lineage within a British Early Mesolithic cemetery where securely long-headed individuals were also buried.

These are three complementary observations:

Individual or siteGenetic evidencePhysical evidencePresent status
Villabruna 1, ItalyEarly R1b1/R-L754Cranial index 75.97; non-round-headedIndividual genetic and cranial crossover
Aveline’s Hole, BritainI3004 provisionally assigned to an R1b-derived lineageAt least one cemetery cranium had an index of 72.0Site-level crossover; genetic call requires confirmation
M50, Schela CladoveiBasal R-L754/R1bPublished stature estimate of 181.63 cmIndividual genetic and stature crossover

The three findings cannot yet be merged into a claim that one securely identified person possessed R1b, exceptional stature and an extremely long skull.

They do, however, substantially strengthen the prediction that these characteristics intersected within the older European population.

The evidence now shows:

  • early R1b associated with a non-round-headed individual in Upper Palaeolithic Italy;
  • a provisional R1b male within a British Mesolithic cemetery containing long-headed crania;
  • and basal R1b associated with exceptional stature in Mesolithic southeastern Europe.

The Aveline’s Hole result is particularly important because it places the proposed association directly within Britain thousands of years before the construction of the long barrows.

Its current Y-chromosome assignment carries a technical quality warning and must therefore remain provisional. However, it is no longer an isolated result without archaeological context. It occurs within a burial population whose surviving cranial evidence independently includes the long-headed form predicted by the hypothesis.

Revised evidence ladder

StatementPresent status
R1b existed in Upper Palaeolithic western EuropeDirectly demonstrated by Villabruna 1
An early R1b1 individual possessed a non-round-headed craniumDirectly demonstrated by Villabruna 1
Basal R1b existed among Mesolithic European populationsDirectly demonstrated by M50 and other early samples
Some early R1b individuals were exceptionally tallDirectly demonstrated by M50
Long-headed people were buried at Aveline’s HoleDirectly demonstrated by cranial measurements, including an index of 72.0
An R1b-derived male was buried at Aveline’s HoleProvisionally supported by I3004, but the contamination-flagged genetic call requires confirmation
The Aveline R1b male was the measured long-headed individualNot demonstrated; the DNA sample came from a tibia that has not been matched to the measured cranium
Early R1b and long-headed morphology occurred within the same British Mesolithic cemeterySupported at site-population level
Britain’s long-barrow males carried R1bStrengthened as a testable prediction, but not yet directly demonstrated
R1b first appeared in Europe with Bell Beaker migrantsContradicted if interpreted as the first European appearance of R1b

The next scientific step

The surviving long-barrow skulls identified by Thurnam should be relocated in museums and archaeological collections.

Their original labels, monument locations, chamber positions, burial phases and excavation histories should be reconciled with modern catalogues.

Where preservation allows, the research programme should include:

  • direct radiocarbon dating;
  • renewed cranial measurement;
  • three-dimensional scanning;
  • ancient-DNA sampling;
  • Y-chromosome identification;
  • mitochondrial identification;
  • isotope testing;
  • comparison with the known prehistoric body-size records.

The results should then be compared by individual.

Cranial form, stature, skeletal proportions, genetic lineage, burial position and archaeological date should no longer be studied as separate categories of evidence.

A confirmed group of primary long-barrow males possessing elongated skulls, exceptional stature and early R1b paternal lineages would provide the missing biological connection between Upper Palaeolithic populations, Mesolithic hunter-gatherers and Britain’s megalithic communities.

Until that work is carried out, the R1b connection remains a strong research hypothesis—not a licence to replace one simplistic migration narrative with another.

What can already be stated with certainty is that R1b did not first appear in Europe with the Bell Beaker phenomenon.

It was present in Upper Palaeolithic Italy approximately fourteen thousand years ago.

It survived among Mesolithic European hunter-gatherers.

And at least one of those securely identified Mesolithic R1b men stood approximately 181.63 centimetres tall.

Thurnam's 137 Skulls: The Forgotten People Behind Britain's Megaliths.
Thurnam’s 137 Skulls: The Forgotten People Behind Britain’s Megaliths.

6. Our new method: estimating a person’s height from the skull

Long-bar­row excavations often preserved skulls while postcranial bones were lost, mixed, damaged or separated from their original individuals.

That creates an obvious problem. Traditional stature reconstruction depends primarily on complete long bones such as the femur and tibia. Without those bones, the person’s height is usually left unknown.

Our project has therefore begun testing whether external cranial dimensions can provide a preliminary stature range.

The method is based on adult male prehistoric individuals for whom both cranial measurements and independently reconstructed body heights survive.

The three principal skull measurements are:

  • M1: maximum cranial length;
  • M8: maximum cranial breadth;
  • M17: cranial vault height.

These three dimensions are multiplied to produce an external cranial-size proxy. The cube root then converts that volume-like product back into a linear measurement.

Current three-dimensional model

Estimated stature in centimetres:

89.11 + 0.5537 × ∛(M1 × M8 × M17)

This is not a measurement of actual brain volume. It is an external three-dimensional cranial-size proxy.

The current calibration sample contains 14 securely or probably matched adult males.

SpecimenKnown statureM1M8M17
Barma Grande 5187.0204140153
Grotte des Enfants 4185.7198152131
Sungir 1183.2188144130
Předmostí 3183.0202145133
Oberkassel 1175.1194141137
Předmostí 9173.3196145134
Romito 4173.2195146132
Villabruna 1172.9181137.5133.5
Rochereil 1172.6190138138
Le Peyrat 5171.5194144126
Bichon 1169.9190144122
Arene Candide 3169.3185144126
Arene Candide 5167.1203142146
Chancelade 1165.7194135149

The present model has an average in-sample error of approximately 4.9 cm. That is useful for broad categories—short, medium, tall or very tall—but it is not accurate enough to claim an exact stature.

A simpler two-dimensional fallback is available when M17 is missing:

Estimated stature = 107.402 + 0.002442 × (M1 × M8)

In leave-one-out testing, this model produced an average error of approximately 5.9 cm:

Validation resultPerformance
Within ±5 cm57.1%
Within ±7 cm71.4%
Within ±10 cm78.6%
Mean absolute error5.9 cm

This level of error is why our database reports a range rather than presenting a cranial estimate as a direct measurement.

Historical records demonstrate the problem.

Historical caseBody-based stature2D skull estimateDifference
Coldrum male composite164.5 cm172.5 cm+8.0 cm
Halling Man166.5 cm from femur172.3 cm+5.8 cm
Ipswich Man180.0 cm174.9 cm−5.1 cm

The Coldrum result is also a group composite rather than one individual. None of these historical cases has been used to alter the model.

For most of Thurnam’s 67 long-bar­row skulls, only cranial indices, ranges and site averages are currently published in the material we have extracted. A cranial index alone cannot produce a height because it gives a proportion rather than the skull’s absolute dimensions.

We therefore need the original M1, M8 and M17 measurements from Crania Britannica, museum catalogues or surviving skulls.

Once recovered, those dimensions could provide the first systematic stature estimates for many of Britain’s long-headed long-bar­row occupants.

Thurnam's 137 Skulls: The Forgotten People Behind Britain's Megaliths.
Thurnam’s 137 Skulls: The Forgotten People Behind Britain’s Megaliths.

Applying the method to skulls without surviving body measurements

The most important purpose of the model is not to recalculate the heights of individuals whose skeletons already provide stature estimates.

Its real value lies in the cranial-only discoveries for which the skull survives, but the associated long bones are missing or cannot be securely identified.

Our present register contains several such cases.

Where maximum cranial length, maximum cranial breadth and cranial vault height survive, the preferred three-dimensional model can be used.

Where only maximum length and breadth are available, the less precise two-dimensional fallback model must be used.

The following results are therefore predictions rather than known statures.

Skull or siteM1 lengthM8 breadthM17 heightCranial indexModel usedEstimated statureApproximate height
Aveline’s Hole skull M1.11.301186 mm134 mmNot available72.0Two-dimensional168.3 cm5 ft 6 in
Carnon calvaria184 mm137 mmNot available74.46Two-dimensional169.0 cm5 ft 6½ in
Langwith Man192 mm135 mm127 mm70.31Three-dimensional171.5 cm5 ft 7½ in
Engis skull198 mm140 mmNot available70.71Two-dimensional175.1 cm5 ft 9 in
Dartford cranium207 mm150 mmNot available72.46Two-dimensional183.2 cmapproximately 6 ft

These estimates reveal a considerable range of possible body sizes among the surviving long-headed skulls.

The relatively small Aveline’s Hole and Carnon crania produce estimates of approximately 168 to 169 centimetres.

Langwith Man produces an estimate of approximately 171.5 centimetres.

The larger Engis skull produces an estimate of approximately 175 centimetres.

The exceptionally large Dartford cranium produces an estimated stature of approximately 183 centimetres, or around six feet.

These figures must not be treated as direct measurements.

The two-dimensional model has a mean leave-one-out error of approximately 5.9 centimetres. A practical working range of roughly six centimetres on either side of each estimate is therefore more responsible than presenting a single exact height.

The estimates could consequently be expressed approximately as:

  • Aveline’s Hole: 162 to 174 centimetres;
  • Carnon: 163 to 175 centimetres;
  • Langwith: 165 to 177 centimetres;
  • Engis: 169 to 181 centimetres;
  • Dartford: 177 to 189 centimetres.

These are working archaeological ranges, not formal statistical confidence intervals.

The importance of Aveline’s Hole

The Aveline’s Hole calculation requires particular care.

The measured skull had a cranial index of 72.0 and produces a two-dimensional stature estimate of approximately 168.3 centimetres.

However, this skull has not been securely matched to the male tibia from which the provisional R1b genetic result was obtained.

We cannot therefore claim that the R1b male himself stood 168 centimetres tall.

What can be stated is that the Aveline’s Hole cemetery contained:

  • a provisionally identified R1b-derived male;
  • at least one securely long-headed skull;
  • and a measured cranium whose dimensions suggest an individual of approximately medium stature.

The genetic, cranial and stature evidence remains associated at the cemetery-population level rather than the securely identified individual level.

What the estimates suggest

The cranial-only results do not indicate that all long-headed individuals were exceptionally tall.

Instead, they suggest that long-headed prehistoric populations included individuals ranging from approximately average stature to potentially more than six feet tall.

This is an important distinction.

Cranial shape and cranial size are not the same measurement.

A person may possess a strongly elongated skull without possessing an exceptionally large skull or exceptional body height.

The Dartford cranium combines an elongated form with unusually large absolute dimensions and consequently produces the tallest prediction.

Aveline’s Hole possesses a similarly long-headed form but smaller absolute dimensions and therefore produces a much lower stature estimate.

This is precisely why cranial index alone cannot estimate height.

The index reveals the proportion of the skull.

The complete measurements reveal its physical size.

Present conclusion

The model now provides provisional stature estimates for five cranial discoveries where a secure body-based comparison is unavailable.

The results range from approximately 168 centimetres to approximately 183 centimetres.

They demonstrate that Britain and western Europe’s surviving long-headed crania did not represent one uniform body size.

Some appear to have belonged to individuals of ordinary or medium stature.

Others, particularly the Dartford individual, may have belonged to exceptionally tall people.

Further recovery of the original cranial measurements from long-barrow collections could extend this analysis from five isolated examples to a much larger prehistoric population.

Thurnam's 137 Skulls: The Forgotten People Behind Britain's Megaliths.
Thurnam’s 137 Skulls: The Forgotten People Behind Britain’s Megaliths.

7. Who built Britain’s megaliths—and what must happen next?

Thurnam’s measurements do not identify the name of a Stonehenge architect.

They do something more fundamental: they identify a distinctive biological population occupying Britain’s early monumental burial tradition.

The 67 long-bar­row crania were predominantly long-headed. The 70 later round-bar­row skulls contained no dolichocephalic or sub-dolichocephalic individuals in Thurnam’s classification. Later burials inserted into long barrows were broader-headed and averaged approximately 79.

The change in human morphology follows the change in monument and burial practice.

This creates a serious problem for the simplified story that “incoming farmers built Britain’s megaliths.”

Modern genetics supports substantial migration into Britain during the Neolithic. It does not automatically prove that every long barrow, causewayed enclosure, stone setting and later phase of Stonehenge was conceived by one biologically uniform immigrant population.

Thurnam's 137 Skulls: The Forgotten People Behind Britain's Megaliths.
Thurnam’s 137 Skulls: The Forgotten People Behind Britain’s Megaliths.

The word farmer identifies subsistence practice.

It does not identify:

  • paternal lineage;
  • cranial morphology;
  • ancestry proportions;
  • social leadership;
  • specialist engineering knowledge;
  • the population selected for monumental burial.

People can adopt agriculture without losing their ancestry. Incoming farmers can mix with indigenous hunter-gatherers. Different groups can cooperate, exchange partners and technologies, or occupy different positions within the same society.

The traditional construct therefore contains a hidden logical jump:

Farming appears in the archaeological record; therefore incoming farmers designed and built the monumental landscape.

That conclusion must be demonstrated, not assumed.

What the evidence currently permits us to say

FindingAssessment
Long-bar­row and round-bar­row skull populations were markedly differentStrongly demonstrated
The original long-bar­row population was predominantly long-headedStrongly demonstrated
Later secondary burials inside long barrows were broader-headedStrongly demonstrated
Long-headed morphology has Upper Palaeolithic European precedentsDemonstrated
Early R1b existed among Mesolithic European hunter-gatherersDemonstrated
Long-bar­row people descended partly from older hunter-gatherersStrong continuity hypothesis
Long-bar­row males probably included early R1b lineagesTestable hypothesis
Long-bar­row people alone built every British megalithNot demonstrated
Incoming farmers alone built every British megalithNot demonstrated

This is the crucial distinction.

The evidence does not justify declaring that every long-headed person was a monument builder or that one paternal lineage created an entire civilisation.

But it equally does not justify removing the long-headed burial population from the discussion and replacing them with an undefined category called “farmers.”

The surviving human remains offer a direct route to resolving the question.

A serious research project should:

  • locate all surviving skulls from Thurnam’s 17 long-bar­row series;
  • identify individual museum and excavation numbers;
  • separate primary deposits from later intrusions;
  • rescan and remeasure the crania;
  • recover M1, M8 and M17 for stature modelling;
  • radiocarbon-date the individuals directly;
  • sequence their DNA;
  • compare their ancestry with Mesolithic, Early Neolithic and Bronze Age populations;
  • test whether R1b occurs among the long-headed males;
  • compare their reconstructed statures with our 429-person prehistoric body-size database.

This investigation could confirm, modify or reject the Cro-Magnon–Mesolithic–long-bar­row continuity hypothesis.

That is how science should work.

The measurements have existed since the nineteenth century. Modern radiocarbon dating, 3D imaging and ancient DNA now allow us to test what Thurnam could only observe.

“Long barrows, long skulls; round barrows, round skulls” was not merely a Victorian slogan.

It was a concise description of a measurable change in Britain’s prehistoric population.

The physical evidence has waited more than 150 years for archaeology to finish the investigation.

Thurnam's 137 Skulls: The Forgotten People Behind Britain's Megaliths.
Thurnam’s 137 Skulls: The Forgotten People Behind Britain’s Megaliths.

PODCAST

Author’s Biography

Robert John Langdon, a polymathic luminary, emerges as a writer, historian, and eminent specialist in LiDAR Landscape Archaeology.

His intellectual voyage has been interwoven with stints as an astute scrutineer in government and grand corporate bastions, a tapestry spanning British Telecommunications, Cable and Wireless, British Gas, and the esteemed University of London.

A decade hence, Robert’s transition into retirement unfurled a chapter of insatiable curiosity. This phase saw him immerse himself in Politics, Archaeology, Philosophy, and the enigmatic realm of Quantum Mechanics. His academic odyssey traversed the venerable corridors of knowledge hubs such as the Museum of London, University College London, Birkbeck College, The City Literature Institute, and Chichester University.

In the symphony of his life, Robert is a custodian of three progeny and a pair of cherished grandchildren. His sanctuary lies ensconced in the embrace of West Wales, where he inhabits an isolated cottage, its windows framing a vista of the boundless sea – a retreat from the scrutinising gaze of Her Majesty’s Revenue and Customs, an amiable clandestinity in the lap of nature.

Exploring Prehistoric Britain: A Journey Through Time

My blog delves into the fascinating mysteries of prehistoric Britain, challenging conventional narratives and offering fresh perspectives grounded in cutting-edge research, particularly LiDAR technology. I invite you to explore some key areas of my research. For example, the Wansdyke, often cited as a defensive structure, is re-examined in light of new evidence. I’ve presented my findings in my blog post Wansdyke: A British Frontier Wall – ‘Debunked’, and a Wansdyke LiDAR Flyover video further visualises my conclusions.

My work also often challenges established archaeological dogma. I argue that many sites, such as Hambledon Hill, commonly identified as Iron Age hillforts, are not what they seem. My posts Lidar Investigation Hambledon Hill – NOT an ‘Iron Age Fort’ and Unmasking the “Iron Age Hillfort” Myth explore these ideas in detail and offer an alternative view. Similarly, sites like Cissbury Ring and White Sheet Camp receive re-evaluations based on LiDAR analysis in my posts “Lidar Investigation Cissbury Ring through time” and “Lidar Investigation White Sheet Camp, revealing fascinating insights into their true purpose. I have also examined South Cadbury Castle, often linked to the mythical Camelot56.

My research also extends to ancient water management, including the role of canals and other linear earthworks. I have discussed the true origins of Car Dyke in multiple posts, including Car Dyke – ABC News Podcast and Lidar Investigation Car Dyke – North Section, which suggest a Mesolithic origin 2357. I also explore the misidentification of Roman aqueducts, as seen in my posts on the Great Chesters (Roman) Aqueduct. My research has also been greatly informed by my post-glacial flooding hypothesis, which has helped explain landscape transformations over time. I have discussed this hypothesis in several posts, including AI now supports my Post-Glacial Flooding Hypothesis and Exploring Britain’s Flooded Past: A Personal Journey

Finally, my blog also investigates prehistoric burial practices, as seen in Prehistoric Burial Practices of Britain and explores the mystery of Pillow Mounds, often mistaken for medieval rabbit warrens, but with a potential link to Bronze Age cremation in my posts: Pillow Mounds: A Bronze Age Legacy of Cremation? and The Mystery of Pillow Mounds: Are They Really Medieval Rabbit Warrens?. My research also includes astronomical insights into ancient sites, for example, in Rediscovering the Winter Solstice: The Original Winter Festival. I also review new information about the construction of Stonehenge in The Stonehenge Enigma.

Further Reading

For those interested in British Prehistory, visit www.prehistoric-britain.co.uk, a comprehensive resource featuring an extensive collection of archaeology articles, modern LiDAR investigations, and groundbreaking research. The site also includes insights and excerpts from the acclaimed Robert John Langdon Trilogy, a series of books that explore Britain during the Prehistoric period. Titles in the trilogy include The Stonehenge Enigma, Dawn of the Lost Civilisation, and The Post-Glacial Flooding Hypothesis, which offer compelling evidence of ancient landscapes shaped by post-glacial flooding.

To further explore these topics, Robert John Langdon has developed a dedicated YouTube channel featuring over 100 video documentaries and investigations that complement the trilogy. Notable discoveries and studies showcased on the channel include 13 Things that Don’t Make Sense in History and the revelation of Silbury Avenue – The Lost Stone Avenue, a rediscovered prehistoric feature at Avebury, Wiltshire.

In addition to his main works, Langdon has released a series of shorter, accessible publications, ideal for readers delving into specific topics. These include:

For active discussions and updates on the trilogy’s findings and recent LiDAR investigations, join our vibrant community on Facebook. Engage with like-minded enthusiasts by leaving a message or contributing to debates in our Facebook Group.

Whether through the books, the website, or interactive videos, we aim to provide a deeper understanding of Britain’s fascinating prehistoric past. We encourage you to explore these resources and uncover the mysteries of ancient landscapes through the lens of modern archaeology.

For more information, including chapter extracts and related publications, visit the Robert John Langdon Author Page. Dive into works such as The Stonehenge Enigma or Dawn of the Lost Civilisation, and explore cutting-edge theories that challenge traditional historical narratives.

Other Blogs

s

t

Pinkery Canal

The Victorian Engineering Project That Challenges Everything We Thought We Knew About Britain’s Ancient Dykes


Introduction

For years, one of the most common objections to Britain’s great prehistoric dykes has been remarkably simple. (Pinkery Canal: The Victorian Engineering Project)

“They’re too high.”

“There wouldn’t have been enough water.”

“They couldn’t have been used for transport.”

Pinkery Canal on Exmoor changes that debate forever.

Built around 1820, this remarkable engineering project carried water across one of the highest stretches of land in southern Britain. Its purpose remains debated, but the engineering itself is undeniable. Victorian engineers considered it entirely practical to construct a canal more than 400 metres above sea level, collecting water from reservoirs, springs, bogs and hillside runoff as it crossed the moor.

That single fact removes one of archaeology’s favourite objections.

More interesting still is why it was built.

Several interpretations suggest the canal formed part of a wider system intended to move or support the movement of minerals and other resources across difficult terrain, linking extraction sites with the estate’s developing transport network. Whether for transport, water power, or land improvement, the principle is the same: using water engineering to connect remote upland resources with places where they can be processed, distributed, or exported.

 (Pinkery Canal: The Victorian Engineering Project)
(Pinkery Canal: The Victorian Engineering Project)

That concept should sound familiar.

Across Britain, more than 1,500 ancient linear dykes cross the landscape. They are usually described as defensive boundaries, yet many display engineering characteristics that are difficult to reconcile with purely military functions. Could at least some have formed part of much earlier transport and water-management systems, linking quarries, rivers and settlements in much the same way that Victorian engineers attempted on Exmoor?

This article isn’t about proving Pinkery Canal is prehistoric, yet it should be noted that there are aspects of this canal that predate the Victorian construction date and maybe where the engineers obtained the original idea?

It’s about recognising that a documented nineteenth-century engineering project demonstrates something archaeologists have often dismissed—that high-altitude canals are entirely feasible, that they can be supplied by catchment water rather than a single river, and that long-distance water engineering for moving resources across the landscape is not only possible, but historically documented.

Perhaps it’s time to stop asking whether such systems could have existed…

...and start asking where else we should be looking.


 (Pinkery Canal: The Victorian Engineering Project)
(Pinkery Canal: The Victorian Engineering Project)

1. The Myth

For years, critics of Britain’s prehistoric dykes have repeated the same two objections.

“Nobody would build a canal hundreds of metres above sea level.”

“There wouldn’t be enough water to keep it supplied.”

Pinkery Canal on Exmoor demolishes both arguments.

Not because it became a great commercial success.

Not because every detail of its purpose is understood.

But because Victorian engineers actually designed and constructed it.

Nearly 9 km (5½ miles) long and lying over 400 metres above sea level, Pinkery Canal is undeniable proof that engineers considered high-altitude water engineering both practical and achievable.

That fact alone changes the debate.

Whether the canal ultimately fulfilled its intended purpose is almost irrelevant. Its existence proves that altitude was not considered an insurmountable obstacle, and that upland landscapes could provide sufficient water through reservoirs, bogs, springs, and intercepted surface runoff to justify the construction of a major canal.

In other words, two of the most frequently repeated objections to prehistoric canals are no longer objections at all.

The question is no longer:

“Could people build canals at high altitude?”

Pinkery Canal answers that with a resounding yes.

The real question is:

If the Victorians considered this perfectly feasible less than 200 years ago, why do archaeologists still insist prehistoric engineers could not have done the same?
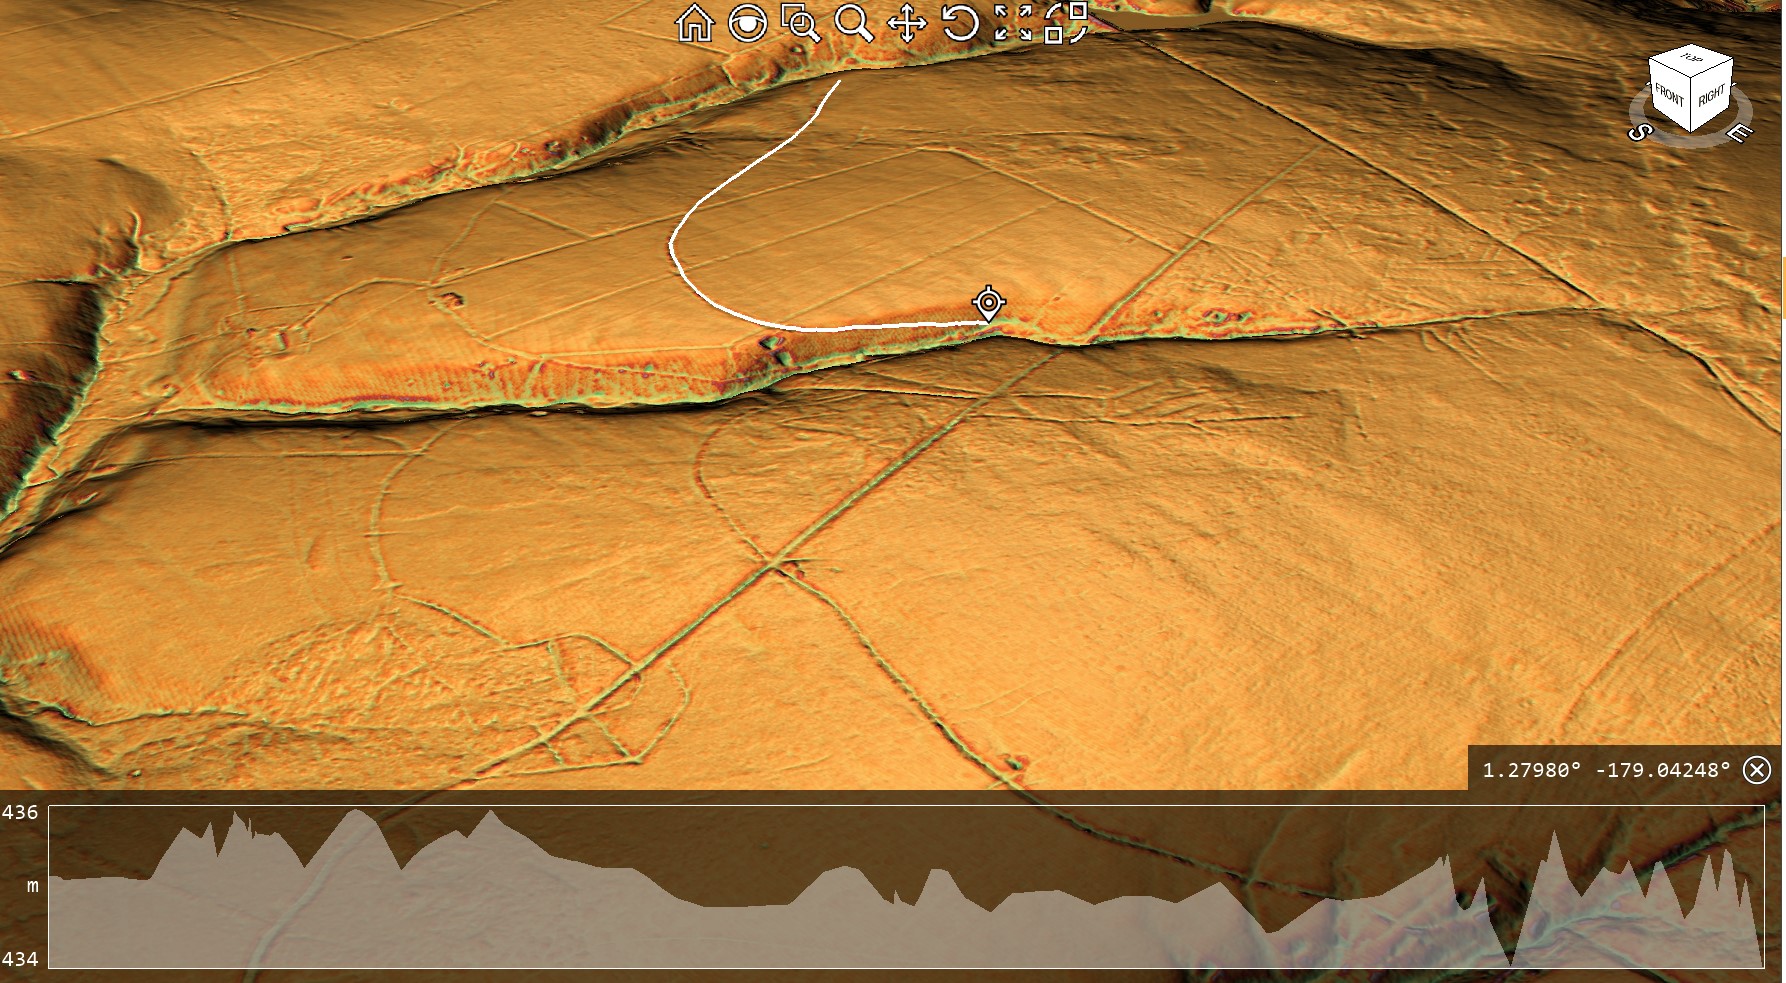
 (Pinkery Canal: The Victorian Engineering Project)
(Pinkery Canal: The Victorian Engineering Project)

2. The Engineering

Forget the archive for a moment.

Forget the arguments over dates.

Imagine Pinkery Canal had just been discovered using modern LiDAR, with no nineteenth-century documents to guide us. How would an engineer interpret the monument purely from its design?
The first impression is its sheer ambition.

Stretching for almost 9 km (5½ miles) across the southern slopes of Exmoor at more than 400 metres above sea level, Pinkery Canal is one of the most remarkable examples of upland hydraulic engineering ever attempted in Britain. It crosses exposed moorland, deep peat, boggy ground and numerous valley heads. This was not a casual drainage ditch dug by local farmers. It required planning, surveying, labour, and a clear engineering objective.

The canal begins at its western end with an artificial reservoir created behind a substantial embankment or dam. That single feature immediately challenges one of the proposed interpretations.

 (Pinkery Canal: The Victorian Engineering Project)
The reservoir – (Pinkery Canal: The Victorian Engineering Project)

Drainage systems are designed to remove water.

Reservoirs are designed to store it.

Those are fundamentally different engineering objectives.

If the intention had simply been to drain the moor, why begin by constructing a dam capable of impounding water? The reservoir suggests that water itself was regarded as a valuable resource requiring collection, regulation and controlled distribution rather than something to be discarded.

The route itself is equally revealing.

Rather than taking the shortest downhill path, as every modern drainage ditch on Exmoor does today, Pinkery Canal follows a long, sweeping contour across the hillside. Modern drainage channels cut almost directly downslope because their purpose is obvious: to remove water from the land as quickly and efficiently as possible.

 (Pinkery Canal: The Victorian Engineering Project)
(Pinkery Canal: The Victorian Engineering Project)

Pinkery does the exact opposite.

It deliberately remains on the hillside, maintaining a remarkably consistent elevation over many kilometres while gently curving around the contours. Every bend represents additional surveying, excavation and labour. Engineers do not introduce unnecessary curves into a project of this scale. Every deviation must therefore have served a purpose.

That purpose may lie in the hydrology itself.

Unlike a river-fed canal supplied by a single large watercourse, a contour canal can collect water progressively along its entire length. Every spring, emerging from the hillside, every bog, every valley-head seep, every small stream, and every episode of surface runoff flowing down the slope contribute additional water. Rather than relying on a single source, the canal effectively harvests water from its entire catchment.

This is one of Pinkery’s most important engineering lessons.

For years, critics have argued that high-altitude canals would never have possessed sufficient water. Pinkery demonstrates another solution entirely. In a wet upland landscape, rainfall, springs, peat bogs, and intercepted runoff constitute the water supply. The canal itself becomes a collector, gradually increasing its flow as it crosses the hillside.

The LiDAR evidence also reveals that the canal is far more sophisticated than the phrase “contour leat” suggests.

Detailed examination shows changing widths, varying bank forms and an undulating longitudinal profile rather than a perfectly level line. The route repeatedly approaches the heads of valleys and drainage features. Modern maps also show later north-south drainage channels cutting across the canal, demonstrating that subsequent engineers adopted a completely different solution to reclaim the moor. Their drains are short, straight and steep. Pinkery is long, sinuous and almost level.

These are two entirely different engineering philosophies.

The terminal arrangements are equally intriguing.

At both ends, the canal appears closely associated with quarry workings or extraction areas. At least one location has a defined track linking the quarry directly to the canal. At another, the canal appears to terminate in a carefully engineered widening adjacent to a palaeochannel rather than simply continuing into the valley below. If drainage had been the objective, extending the ditch a short distance downhill would have been the simplest solution. Instead, the engineering appears far more elaborate than a straightforward drainage outlet.

 (Pinkery Canal: The Victorian Engineering Project)
(Pinkery Canal: The Victorian Engineering Project)

Whether these features relate to transport, water management, construction, or another purpose remains uncertain, but they deserve far greater attention than they have received.

Perhaps the most striking conclusion is that, despite detailed archaeological surveys, no single interpretation successfully explains every aspect of the monument.

Transport explains some features but not others.

Drainage explains some features but struggles with the reservoir and the geometry.

Water power requires hydraulic calculations that have yet to be convincingly demonstrated.

Irrigation raises unanswered questions about distribution.

Each hypothesis explains part of the engineering.

No one yet explains the complete system.

That is precisely why Pinkery Canal remains so fascinating.

It is not simply an archaeological site.

It is a large-scale engineering puzzle.

And whatever its ultimate purpose, one conclusion is beyond dispute. Victorian engineers considered it entirely practical to build and supply a major contour canal more than 400 metres above sea level. In doing so, they demolished two of archaeology’s favourite objections in a single project: that high-altitude canals could not be built, and that there would never have been sufficient water to sustain them.

The real challenge now is no longer asking whether such engineering was possible.

Pinkery has already answered that question.

The challenge is understanding why it was designed exactly as it was.


 (Pinkery Canal: The Victorian Engineering Project)
(Pinkery Canal: The Victorian Engineering Project)

3. Pinkery and Car Dyke – More Similar Than You Might Think

At first glance, Pinkery Canal and Car Dyke appear to have nothing in common.

One crosses the high moorland of Exmoor.

The other traverses the low-lying Fenlands of eastern England.

One is traditionally regarded as Victorian.

The other has long been attributed to Roman engineers.

Yet when viewed as engineering projects rather than archaeological labels, the similarities become surprisingly difficult to ignore.

Both were constructed to move water across the landscape rather than simply allowing it to flow naturally downhill.

(Car Dyke - North Section)
Car Dyke reused in a similar fashion as Pinkery Canal – (Pinkery Canal: The Victorian Engineering Project)

Both follow carefully selected routes designed to exploit the surrounding topography rather than take the shortest possible course.

Both have uncertain purposes despite decades of archaeological investigation.

And both have been linked to the movement of heavy materials from extraction areas towards wider transport networks.

That last point is particularly interesting.

Several interpretations of Pinkery Canal suggest it formed part of a system for moving lime, minerals, or other resources across Exmoor. Whether by boat, a water-powered incline, or another engineering solution, the underlying objective appears to have been the same: to overcome difficult terrain and connect remote resources to the estate’s developing transport network.

That is remarkably similar to the engineering questions surrounding Car Dyke.

For generations, archaeologists have regarded Car Dyke simply as a Roman drainage canal.

Yet its extraordinary scale, remarkable straightness and strategic connections between rivers have always hinted at a far more ambitious purpose. Our own investigation concluded that Car Dyke makes far more sense as a transport corridor linking quarries, settlements, rivers and distribution centres across the Fenlands. Rather than creating an entirely new waterway, the Romans may have enlarged and engineered an existing prehistoric channel, transforming it into Britain’s largest canal-like transport route.

(Britain's Giant Prehistoric Waterways)

Pinkery demonstrates that this approach is neither unusual nor implausible.

Throughout history, engineers have repeatedly adapted existing landscapes rather than starting with a blank slate. Rivers have been canalised. Ancient roads have become Roman roads. Medieval tracks became turnpikes. Victorian railways often followed much older routeways.

Why should canals be any different?

Pinkery therefore provides something that has been missing from the debate over Britain’s prehistoric dykes.

It offers a documented example of engineers modifying a landscape, harvesting water from multiple natural sources and constructing a substantial canal in terrain that many archaeologists would previously have dismissed as impossible.

Pinkery demonstrate that the engineering principles behind our Car Dyke hypothesis are entirely realistic.

Instead of asking whether prehistoric engineers could have built such systems, perhaps archaeology should begin asking whether later engineers simply inherited, enlarged, and improved landscapes whose origins stretch much further back than the surviving documents.

 (Pinkery Canal: The Victorian Engineering Project)
(Pinkery Canal: The Victorian Engineering Project)

4. The Second Myth Falls – Where Did the Water Come From?

Perhaps the most common criticism of prehistoric canals is not their height, but their supposed lack of water.

The argument is usually presented as though every canal requires a single obvious source—a large river, a lake, or a permanent reservoir.

Without one, the idea is dismissed.

Pinkery Canal demonstrates that this assumption is far too simplistic.

When viewed from the ground, Exmoor appears to be little more than open moorland.

Viewed using modern LiDAR and historical mapping, however, an entirely different landscape emerges.

Pinkery crosses one of the wettest upland environments in southern Britain.

Its route intersects extensive peat deposits, blanket bog, spring lines, valley-head seepages, small streams and countless natural drainage pathways. Historical maps also show large areas of marshy ground surrounding parts of the canal, while later land reclamation introduced numerous straight drainage ditches to drain the landscape.

 (Pinkery Canal: The Victorian Engineering Project)
First Section By the Reservoir – (Pinkery Canal: The Victorian Engineering Project)

In other words, this was never a dry hillside.

It was a giant natural catchment.

That distinction is crucial.

Rather than relying on a single river to supply it, Pinkery appears to have been designed to collect water progressively as it crossed the landscape. Every period of rainfall generated surface runoff from the higher ground above. Every spring emerging from the peat contributed additional flow. Every valley head intercepted by the canal became another source of water.

The canal itself became the collector.

This is a completely different hydraulic principle from the one usually imagined by archaeologists.

Instead of asking:

“Where is the river feeding the canal?”

Perhaps the better question is:

“How much water does the entire catchment above the canal produce?”

Once viewed in that way, the engineering begins to make far more sense.

The long, curving alignment is no longer simply following a contour.

It is harvesting water from an entire hillside.

Every bend allows the canal to intercept another small drainage system. Every kilometre increases the contributing catchment. Rather than relying on a single large source, the available water gradually accumulates along the route.

 (Pinkery Canal: The Victorian Engineering Project)

This also explains why the western reservoir becomes so important.

The dam provided an initial stored supply, ensuring water was available even during drier periods, while the remainder of the canal progressively collected additional inflows from springs, bogs and hillside runoff.

Together they formed a single hydraulic system.

Ironically, the modern drainage network demonstrates the exact opposite of the engineering philosophy.

Today’s straight north-south drainage ditches were constructed to remove water from the moor as quickly as possible. They cut directly downslope, rapidly carrying water away from the peat and into the valleys below.

Pinkery does the reverse.

Instead of losing water, it captures it.

Instead of accelerating drainage, it intercepts it.

Instead of taking the shortest route downhill, it deliberately remains on the contour, collecting water from every natural drainage feature it encounters.

This distinction is fundamental.

The canal was not simply crossing a wet landscape.

It appears to have been designed around it.

For students of Britain’s prehistoric dykes, this observation is particularly significant.

One of the most common objections to their interpretation as waterways has always been the supposed absence of a large feeder river. Pinkery demonstrates another engineering solution entirely. A canal does not necessarily require a single major water source. Given the right landscape, it can harvest countless smaller sources distributed across an entire catchment.

Whether Victorian engineers consciously calculated this in modern hydrological terms is almost irrelevant.

Their design shows they understood the principle.

And if nineteenth-century engineers recognised that an upland landscape of springs, bogs and runoff could sustain a canal, perhaps archaeologists should think more carefully before dismissing similar possibilities elsewhere in Britain.


 (Pinkery Canal: The Victorian Engineering Project)
(Pinkery Canal: The Victorian Engineering Project)

5. If It Was Simply Drainage, Why Doesn’t It Behave Like a Drain?

One of the most revealing aspects of the Pinkery Canal is not where it begins or ends.

It is the shape of the engineering itself.

For nearly two centuries, the canal has frequently been described as a contour leat, with drainage often forming part of the explanation. Yet when the surrounding landscape is examined using modern LiDAR, an obvious question emerges.

If the objective was simply to drain the moor, why wasn’t it designed like every other drainage system on Exmoor?

The answer is surprisingly simple.

Because it wasn’t.

 (Pinkery Canal: The Victorian Engineering Project)
The end of Section One goes into a quarry past two other quarries – (Pinkery Canal: The Victorian Engineering Project)

Modern drainage ditches are easy to recognise. They follow the most efficient engineering solution possible. They are generally straight or only gently curved, taking the shortest practical route downhill. Their purpose is to quickly remove water from the land, reducing waterlogging and reclaiming boggy ground for agriculture.

The later drainage channels that cross the Pinkery Canal demonstrate exactly this principle.

Cutting almost directly north-to-south, they ignore the contours and descend rapidly into the valleys below. They waste no effort. They take the shortest available route because every unnecessary metre represents additional excavation and cost.

That is exactly what engineers designing a drainage system would be expected to do.

Pinkery Canal is completely different.

Instead of descending the hillside, it clings to it.

Instead of taking the shortest route, it extends for almost 9 kilometres in a broad sweeping curve.

Instead of accelerating water downhill, it appears to intercept it, retaining a remarkably consistent elevation across the landscape.

From an engineering perspective, those are not small differences.

They are fundamental.

Every bend required additional surveying.

Every curve required additional excavation.

Every extra metre increased both labour and construction costs.

Engineers simply do not introduce that level of complexity unless it serves a practical purpose.

 (Pinkery Canal: The Victorian Engineering Project)
(Pinkery Canal: The Victorian Engineering Project)

The obvious question, therefore, becomes:

What was the canal trying to achieve that a series of straight drainage ditches could not?

This is where the modern drainage network becomes unexpectedly useful.

Far from supporting the drainage interpretation, it provides a direct comparison between two completely different engineering philosophies.

The modern drains remove water.

Pinkery appears to manage it.

The modern drains cut across the landscape.

Pinkery works with it.

The modern drains dispose of water as quickly as possible.

Pinkery appears designed to collect water progressively from the surrounding catchment while preventing its immediate loss downslope.

These are not variations of the same design.

They are solutions to different engineering problems.

This distinction also helps explain why the canal repeatedly approaches the heads of valleys and natural drainage features. Rather than avoiding them, the alignment appears to exploit them. Every small stream, spring, or area of surface runoff that the canal intercepts becomes another potential source of water entering the system.

That behaviour makes perfect sense for a contour channel intended to harvest water.

It makes far less sense for a ditch whose sole purpose was drainage.

Perhaps the most telling observation is that Victorian engineers later constructed entirely different drainage works across the same landscape. If a simple drainage ditch had been the original objective, why wasn’t Pinkery built in the same way as the later drains?

The answer appears to be that it was never solving the same problem.

Pinkery Canal may ultimately have failed to achieve its intended purpose, but its geometry reveals something important.

It was not engineered as the quickest way to drain Exmoor.

It was engineered to control water.

Understanding that distinction is the key to understanding the monument itself—and perhaps to understanding many of Britain’s much older linear earthworks as well.


 (Pinkery Canal: The Victorian Engineering Project)
(Pinkery Canal: The Victorian Engineering Project)

6. The Reservoir – Storing Water or Removing It?

Perhaps the single most overlooked feature of the entire Pinkery Canal system lies at its western end.

Before the canal even began, the Victorian engineers constructed a substantial embankment, creating what is now known as Pinkery Pond. This artificial reservoir formed the head of the entire system, storing water before it entered the canal.

At first glance, this may appear entirely unremarkable.

In reality, it may be one of the most important engineering clues on the site.

Think about the logic.

If your primary objective is to drain a wet upland landscape, why begin by constructing a dam?

Drainage and reservoirs represent two fundamentally different engineering philosophies.

A drainage system is designed to remove water from the landscape as efficiently as possible. Every engineering decision seeks to accelerate the movement of water downhill, reducing flooding, drying peat and reclaiming land for agriculture.

 (Pinkery Canal: The Victorian Engineering Project)
The Canal can not operate as a single entity without the paleochannel being full of water – (Pinkery Canal: The Victorian Engineering Project)

A reservoir does exactly the opposite.

It captures water.

It stores water.

It regulates water.

It delays its release.

Those are not minor differences.

They are completely different engineering objectives.

This immediately raises an obvious question.

Was Pinkery Canal ever intended to function as a simple drainage ditch?

The reservoir suggests otherwise.

 (Pinkery Canal: The Victorian Engineering Project)
(Pinkery Canal: The Victorian Engineering Project)

Instead of treating water as a nuisance, the engineer appears to regard it as a valuable resource that requires careful management. Water could be impounded during wetter periods, creating a reserve that could maintain flow through the canal even when natural runoff declined.

That interpretation fits remarkably well with the canal’s overall design.

As discussed previously, the canal follows a long contour across one of the wettest landscapes in southern Britain. Rather than rapidly discharging water into the nearest valley, it intercepts springs, bogs, valley-head seepages and surface runoff along its entire route. The reservoir therefore appears to provide the initial supply, while the surrounding catchment progressively replenishes the system as it continues eastwards.

Viewed together, the dam and canal form a single hydraulic network rather than two unrelated engineering works.

This also explains why the reservoir should not be dismissed as merely a convenient pond.

It was an integral part of the design.

Without stored water at the head of the system, the canal would have been entirely dependent upon seasonal rainfall. By constructing a reservoir first, Victorian engineers introduced a degree of hydraulic control, allowing water levels to be managed instead of simply reacting to whatever nature provided.

Once again, this differs fundamentally from the later drainage ditches that now cross the moor. Those channels require no reservoirs because their purpose is simply to remove water from the landscape. Gravity performs all the work.

Pinkery required something far more sophisticated.

It required water to be available when needed.

 (Pinkery Canal: The Victorian Engineering Project)
End of section one shows a quarry and a road to the Canal (Pinkery Canal: The Victorian Engineering Project)

That simple observation creates difficulties for several of the traditional interpretations. If the canal existed only to drain land, the reservoir appears unnecessary. If it existed to transport water, power machinery, or support navigation, however, regulating and storing water would be much easier to understand.

The reservoir, therefore, becomes much more than an isolated feature at the western end of the canal.

It becomes the first component in a carefully engineered hydraulic system.

Whether that system ultimately succeeded is almost secondary.

Its design demonstrates that the engineers were not simply trying to get rid of water.

They were trying to control it.

And that distinction may prove to be one of the most important lessons Pinkery Canal has to offer—not only for understanding this remarkable Victorian project, but also for reconsidering how similar large-scale water engineering systems elsewhere in Britain have been interpreted.

You’re right. I was too generic. If we’re referring to the report, we should discuss the profiles by number and what each demonstrates, rather than making broad statements.

Here’s a much stronger version.

 (Pinkery Canal: The Victorian Engineering Project)
(Pinkery Canal: The Victorian Engineering Project)

7. The Engineering Puzzle: What the Profiles Actually Reveal

One of the strengths of the Historic England survey is that it did not simply record the canal’s position. It excavated and measured cross-sections along its entire length, producing sixteen profile drawings that reveal something far more interesting than the accompanying interpretation acknowledges.

Far from being a uniform ditch, the Pinkery Canal constantly changes its form.

 (Pinkery Canal: The Victorian Engineering Project)

Profiles 1–5 show a relatively consistent engineered channel cut into the hillside, but even here the uphill and downhill banks vary considerably in both height and width. This immediately suggests the builders were responding to local ground conditions rather than applying a single standard design.

Profiles 6–11 become even more revealing. Here, the downslope bank becomes substantially larger in places, while the uphill side often appears much less pronounced. If the feature was merely intended as a drainage ditch, this extra effort seems unnecessary. Gravity already removes water downhill. There would be little reason to build and maintain substantial retaining banks on the downhill side.

Instead, these profiles make far more engineering sense if the objective is to retain water within the channel while preventing it from escaping downslope.

Profiles 12 and 15 are particularly interesting because the canal becomes much deeper on one side, reflecting the increasing side slope of the hillside. Rather than abandoning the contour, the builders modified the earthworks to maintain the channel despite increasingly difficult terrain. That is a considerable investment in engineering effort.

By contrast, Profile 16 shows a much more symmetrical section, suggesting that local topography again dictated the amount of excavation and banking required. The canal was clearly being adapted to changing ground conditions rather than simply being cut to a single standard template.

Perhaps the most important observation is what none of the profiles shows.

None resembles a simple modern drainage ditch.

Modern drainage systems generally seek the quickest route downhill using relatively uniform cuts. Pinkery repeatedly does the opposite. Its profiles demonstrate deliberate construction to maintain a contour route while containing water against the land’s natural fall.

The retaining banks become key evidence.

On a hillside, any water entering the canal naturally wants to escape over the lower edge. The substantial downhill embankments shown in many of the profiles would have acted as retaining structures, keeping water within the channel while intercepting runoff from bogs, springs, and small streams higher on the slope.

Ironically, the report illustrates all of this beautifully but never fully explores its engineering implications. The profiles are presented as descriptive archaeology rather than as evidence of hydraulic design.

Yet these drawings may contain one of the most important clues to understanding the Pinkery Canal.

They show that the builders were not simply digging a ditch.

They were designing a hydraulic system whose cross-section changed repeatedly in response to the landscape.

That is engineering.

The real mystery is not whether the builders understood hydraulics.

The profiles prove they did.

The mystery is what hydraulic problem they were actually trying to solve.

I think this is a good conclusion, but I’d make one important change. I would avoid saying “this is why canals failed in Britain.” Historically, Britain’s canal network was hugely successful for decades before railways largely displaced it. A stronger and more accurate point is that lock canals trade speed for flexibility. Every lock introduces a delay, whereas a contour canal with continuous water offers uninterrupted movement.

Here’s how I’d write the conclusion.

 (Pinkery Canal: The Victorian Engineering Project)
(Pinkery Canal: The Victorian Engineering Project)

8. What Pinkery Canal Really Teaches Us

Pinkery Canal remains one of Britain’s most fascinating engineering puzzles.

Almost two centuries after its construction, archaeologists still cannot agree upon its purpose. Was it built for transport? Water power? Irrigation? Land improvement? Water management? Every interpretation explains part of the evidence, yet none successfully accounts for the monument as a complete engineering system.

Perhaps the problem is not the evidence.

Perhaps it is the questions being asked.

Throughout this investigation, we have deliberately set the archive aside and examined the monument as engineers would.

In doing so, several important conclusions emerge.

First, Pinkery Canal proves beyond doubt that high-altitude canals are entirely feasible. Victorian engineers had no hesitation in constructing a major contour canal more than 400 metres above sea level. The argument that upland canals are somehow impossible can therefore be dismissed.

Second, Pinkery demonstrates that canals do not necessarily require a major river to function. By combining a reservoir with intercepted springs, bogs, valley-head seepages and surface runoff, the canal could potentially harvest water from its entire catchment. The landscape itself became the feeder system.

Third, the monument’s geometry differs fundamentally from a drainage ditch. Instead of removing water as quickly as possible, it appears to be designed to intercept, retain, and regulate it. The substantial banks recorded in the cross-sectional profiles reinforce this interpretation, showing engineering adapted to controlling water rather than simply disposing of it.

Finally, Pinkery reminds us that ancient and historic engineers were often far more inventive than we give them credit for.

 (Pinkery Canal: The Victorian Engineering Project)
(Pinkery Canal: The Victorian Engineering Project)

Today, when we think of canals, we instinctively picture straight channels linked together by locks.

That is understandable because lock canals dominated Britain’s Industrial Revolution.

But lock systems come at a cost.

Every lock interrupts the journey.

Boats must stop, water levels must be altered, gates opened and closed, and only then can the journey continue. Over a long route, those delays accumulate significantly.

A contour canal operates on a completely different principle.

Once water is established within the channel, a boat can continue along the contour without repeatedly stopping to negotiate locks. The route may be longer, but movement is continuous.

That is an elegant engineering solution.

Its weakness, however, is equally obvious.

Everything depends upon maintaining a reliable water supply.

If the reservoir feeding Pinkery Canal could not provide sufficient water during prolonged dry periods, the entire system would struggle to operate effectively. Whether this ultimately contributed to its limited success remains an intriguing possibility, although the surviving evidence cannot yet answer that question with certainty.

This comparison also helps explain why Britain’s prehistoric dykes deserve far more serious investigation.

Features such as the Car Dyke, the Wansdyke, and Offa’s Dyke have often been viewed through the lens of defence or territorial boundaries. Yet if naturally fed springs, groundwater and higher prehistoric water levels provided a more dependable year-round supply than an artificial upland reservoir, then the hydraulic possibilities become considerably more interesting.

Pinkery does not prove that Britain’s prehistoric dykes were canals.

What it does prove is something equally important.

Many of the engineering objections used to dismiss that possibility are no longer sustainable.

High-altitude canals are possible.

Catchment-fed canals are possible.

Long-distance contour engineering is possible.

Victorian engineers demonstrated every one of those principles.

Perhaps the greatest lesson from Pinkery is not about Victorian engineering at all.

It is a reminder that we should never underestimate the ingenuity of earlier societies simply because their achievements do not fit our modern expectations. Every generation builds upon the knowledge of those who came before it. If nineteenth-century engineers recognised the advantages of contour water engineering, it is entirely reasonable to ask whether they were rediscovering principles that had been understood long before the Industrial Revolution.

That is why sites like Pinkery Canal deserve to be studied—not simply as isolated archaeological curiosities, but as windows into the long history of engineering innovation that shaped Britain’s landscape.

 (Pinkery Canal: The Victorian Engineering Project)
(Pinkery Canal: The Victorian Engineering Project)

PODCAST

Author’s Biography

Robert John Langdon, a polymathic luminary, emerges as a writer, historian, and eminent specialist in LiDAR Landscape Archaeology.

His intellectual voyage has been interwoven with stints as an astute scrutineer in government and grand corporate bastions, a tapestry spanning British Telecommunications, Cable and Wireless, British Gas, and the esteemed University of London.

A decade hence, Robert’s transition into retirement unfurled a chapter of insatiable curiosity. This phase saw him immerse himself in Politics, Archaeology, Philosophy, and the enigmatic realm of Quantum Mechanics. His academic odyssey traversed the venerable corridors of knowledge hubs such as the Museum of London, University College London, Birkbeck College, The City Literature Institute, and Chichester University.

In the symphony of his life, Robert is a custodian of three progeny and a pair of cherished grandchildren. His sanctuary lies ensconced in the embrace of West Wales, where he inhabits an isolated cottage, its windows framing a vista of the boundless sea – a retreat from the scrutinising gaze of Her Majesty’s Revenue and Customs, an amiable clandestinity in the lap of nature.

Exploring Prehistoric Britain: A Journey Through Time

My blog delves into the fascinating mysteries of prehistoric Britain, challenging conventional narratives and offering fresh perspectives grounded in cutting-edge research, particularly LiDAR technology. I invite you to explore some key areas of my research. For example, the Wansdyke, often cited as a defensive structure, is re-examined in light of new evidence. I’ve presented my findings in my blog post Wansdyke: A British Frontier Wall – ‘Debunked’, and a Wansdyke LiDAR Flyover video further visualises my conclusions.

My work also often challenges established archaeological dogma. I argue that many sites, such as Hambledon Hill, commonly identified as Iron Age hillforts, are not what they seem. My posts Lidar Investigation Hambledon Hill – NOT an ‘Iron Age Fort’ and Unmasking the “Iron Age Hillfort” Myth explore these ideas in detail and offer an alternative view. Similarly, sites like Cissbury Ring and White Sheet Camp receive re-evaluations based on LiDAR analysis in my posts “Lidar Investigation Cissbury Ring through time” and “Lidar Investigation White Sheet Camp, revealing fascinating insights into their true purpose. I have also examined South Cadbury Castle, often linked to the mythical Camelot56.

My research also extends to ancient water management, including the role of canals and other linear earthworks. I have discussed the true origins of Car Dyke in multiple posts, including Car Dyke – ABC News Podcast and Lidar Investigation Car Dyke – North Section, which suggest a Mesolithic origin 2357. I also explore the misidentification of Roman aqueducts, as seen in my posts on the Great Chesters (Roman) Aqueduct. My research has also been greatly informed by my post-glacial flooding hypothesis, which has helped explain landscape transformations over time. I have discussed this hypothesis in several posts, including AI now supports my Post-Glacial Flooding Hypothesis and Exploring Britain’s Flooded Past: A Personal Journey

Finally, my blog also investigates prehistoric burial practices, as seen in Prehistoric Burial Practices of Britain and explores the mystery of Pillow Mounds, often mistaken for medieval rabbit warrens, but with a potential link to Bronze Age cremation in my posts: Pillow Mounds: A Bronze Age Legacy of Cremation? and The Mystery of Pillow Mounds: Are They Really Medieval Rabbit Warrens?. My research also includes astronomical insights into ancient sites, for example, in Rediscovering the Winter Solstice: The Original Winter Festival. I also review new information about the construction of Stonehenge in The Stonehenge Enigma.

Further Reading

For those interested in British Prehistory, visit www.prehistoric-britain.co.uk, a comprehensive resource featuring an extensive collection of archaeology articles, modern LiDAR investigations, and groundbreaking research. The site also includes insights and excerpts from the acclaimed Robert John Langdon Trilogy, a series of books that explore Britain during the Prehistoric period. Titles in the trilogy include The Stonehenge Enigma, Dawn of the Lost Civilisation, and The Post-Glacial Flooding Hypothesis, which offer compelling evidence of ancient landscapes shaped by post-glacial flooding.

To further explore these topics, Robert John Langdon has developed a dedicated YouTube channel featuring over 100 video documentaries and investigations that complement the trilogy. Notable discoveries and studies showcased on the channel include 13 Things that Don’t Make Sense in History and the revelation of Silbury Avenue – The Lost Stone Avenue, a rediscovered prehistoric feature at Avebury, Wiltshire.

In addition to his main works, Langdon has released a series of shorter, accessible publications, ideal for readers delving into specific topics. These include:

For active discussions and updates on the trilogy’s findings and recent LiDAR investigations, join our vibrant community on Facebook. Engage with like-minded enthusiasts by leaving a message or contributing to debates in our Facebook Group.

Whether through the books, the website, or interactive videos, we aim to provide a deeper understanding of Britain’s fascinating prehistoric past. We encourage you to explore these resources and uncover the mysteries of ancient landscapes through the lens of modern archaeology.

For more information, including chapter extracts and related publications, visit the Robert John Langdon Author Page. Dive into works such as The Stonehenge Enigma or Dawn of the Lost Civilisation, and explore cutting-edge theories that challenge traditional historical narratives.

Other Blogs

s

t

Archaeology: The Flaws of Peer Review

Introduction

The peer-review system in archaeology is often regarded as a safeguard for academic integrity and quality control.  However, it has become a gatekeeping mechanism that suppresses alternative interpretations and enforces conformity to prevailing theories.  Michael Gordin, a historian of science, has noted that peer review is often mistaken for a flawless vetting system when, in reality, it is prone to bias and conservatism.  He argues that the process tends to favour established paradigms, making it difficult for groundbreaking ideas to gain traction.

Archaeologist E. Thomas Lawson has pointed out that the peer-review system is highly susceptible to institutional biases.  In a study published in Science and Technology Studies, Lawson demonstrated that reviewers often reject submissions that challenge dominant models, not necessarily because they lack weak evidence, but because they disrupt the consensus.  This issue is particularly acute in archaeology, where entrenched narratives about cultural evolution, settlement patterns, and technological development dominate scholarly discourse.  Those who propose alternative chronologies or challenge the attribution of artefacts often find their work dismissed outright, regardless of its empirical rigour.(Archaeology: The Flaws of Peer Review)

Archaeology: The Flaws of Peer Review
Most Peer-reviewed papers are ‘Pulp-fiction’ constructed for publicity and funding – (Archaeology: The Flaws of Peer Review)

A stark example of this suppression can be seen at the Cerutti Mastodon site in California.  When Steven Holen and his team published their findings in Nature in 2017, suggesting that humans may have been in North America over 130,000 years ago, the backlash was immediate.  Critics did not merely question the dating methods; they dismissed the research as implausible, despite the use of multiple independent dating techniques.  This reaction illustrates how peer review often functions not as an objective filter but as a reinforcement of accepted timelines and theories, even when the evidence demands reconsideration.

Further, the peer-review system is primarily controlled by a small number of academic gatekeepers.  A 2020 analysis by J. Scott Turner in The Journal of Scholarly Publishing revealed that many archaeological journals rely on a narrow pool of reviewers, many of whom share institutional affiliations and research backgrounds.  This concentration of influence creates an echo chamber where dissenting voices struggle to be heard.  Turner’s study found that papers proposing unconventional interpretations had a rejection rate nearly three times that of papers aligned with mainstream archaeological views.

(Archaeology: The Flaws of Peer Review)

This lack of openness is compounded by the anonymous nature of peer review, which allows reviewers to dismiss or delay controversial findings without accountability.  In some cases, reviewers have been found to recommend rejection of papers that later, when published through alternative means, proved to be groundbreaking.  For instance, the discovery of pre-Clovis human presence in the Americas faced decades of dismissal until mounting evidence from sites like Monte Verde forced a reassessment of long-held beliefs.  The delay in accepting such evidence highlights how peer review can be a brake on scientific progress rather than a facilitator of truth.

Another fundamental flaw of the peer-review system is its failure to recognise the evolving nature of scientific inquiry.  History has shown that many discoveries initially rejected by the academic establishment later became widely accepted.  The heliocentric model, continental drift, and the role of bacteria in ulcers were all dismissed before overwhelming evidence overturned the consensus.  In archaeology, similar patterns emerge, where findings that contradict prevailing models are routinely discarded until the weight of evidence makes resistance untenable.

(Archaeology: The Flaws of Peer Review)

Archaeology must embrace a more open and transparent review process to foster true scientific progress.  Double-blind peer review, in which authors and reviewers remain anonymous, could help mitigate personal and institutional biases.  Additionally, encouraging post-publication peer review—where studies are critiqued and refined after publication rather than being blocked from dissemination—would enable a more dynamic and evidence-driven discourse.  Greater interdisciplinary collaboration, incorporating fields such as genetics, geophysics, and AI-assisted analysis, could also help challenge entrenched assumptions and promote a more balanced evaluation of new findings.

If archaeology aims to uncover the truth about the past, then the discipline must acknowledge and address the limitations of its review system.  Suppressing dissenting ideas only delays the inevitable reevaluation of flawed theories.  By reforming the peer-review process to prioritise empirical validity over academic orthodoxy, archaeology can become a more dynamic and self-correcting field that genuinely pursues knowledge rather than merely defending existing paradigms.

(Archaeology: The Flaws of Peer Review)

Preconceived notions

The peer-review process stands as a cornerstone of modern scientific inquiry, intended to filter research, uphold quality, and ensure the validity of published findings.  It is a system whereby experts in a particular field critically evaluate a submitted manuscript before it is accepted for publication, ideally identifying flaws, inconsistencies, and errors.  While the intention behind peer review is laudable, the assumption that all peer-reviewed papers are inherently accurate and error-free is a dangerous oversimplification.  Particularly within archaeology, where interpretation plays a significant role and definitive proof can be elusive, placing unwavering faith in the peer-review stamp can hinder progress and perpetuate flawed narratives.  The provided sources offer compelling insights into the limitations of peer review in archaeology, highlighting instances where the process has failed to prevent the dissemination of questionable findings, often due to the inherent subjectivity of the field and a tendency to prioritise the reporter’s preconceived notions over objective facts.

The investigations surrounding the dating and origins of Stonehenge, particularly the peer-reviewed publications stemming from Mike Parker-Pearson’s (MPP) work on Bluehenge, the bluestone quarries and Waun Mawn, serve as stark examples of how the peer-review system can be flawed and how its weight of evidence can be unduly influenced by the author’s reputation and desired outcomes.  The case of Bluestonehenge further highlights how prior assumptions can drive research conclusions, even when contradictory data exists.  These cases illustrate a broader issue within archaeology: a tendency to align findings with prevailing theories rather than rigorously testing hypotheses against all available evidence.

The Lost Stone Circle – many made up for good TV

The Subjectivity

Unlike the hard sciences that rely on quantifiable data and reproducible experiments, archaeology frequently deals with fragmented evidence requiring interpretation.  Archaeological findings are often unique to specific sites and cannot be replicated.  This reliance on interpretation opens the door to interpretive bias, in which an archaeologist’s perspective, cultural background, or theoretical framework can influence the narrative constructed from the available evidence.  Consequently, the peer reviewers, who are also subject to their own biases, may inadvertently endorse interpretations that align with prevailing theories or the author’s established viewpoint rather than rigorously scrutinising the factual basis of the claims.

This can lead to “possibilities are often presented as certainties, creating a misleading view of the past.” The “establishment’s over-reliance on ‘peer review’ as a conformity standard of credibility” has been criticised, with Richard Horton, editor of The Lancet, suggesting that peer review is merely a “crude means of discovering the acceptability—not the validity—of a new finding.” This crucial distinction underscores that peer review may often reinforce existing paradigms within the archaeological community, potentially hindering the acceptance of genuinely novel or contradictory evidence.

Ricahrd Horton of the Lancet

The Case of Bluestonehenge: A Shift in Narrative Due to Contradictory Evidence

The first site to consider, Bluestonehenge, was under excavation in 2009.  At that time, MPP was preparing to announce it as his bluestone site and believed it predated Stonehenge Phase I.  However, during their meeting, the author of The Stonehenge Enigma (2013) raised concerns about this dating.  Based on his research into the 50 sites surrounding Stonehenge and his post-glacial-flooded-environment hypothesis, they concluded that Bluestonehenge would have been below water during the Neolithic period because the River Avon remained flooded.

MPP dismissed this research and published, but later carbon dating confirmed this point and supported the author’s hypothesis, as it is now accepted that Bluestonehenge was constructed between 2840–2230 BCE, which falls into the Early Bronze Age rather than the Neolithic period as initially proposed by MPP.  This raises significant concerns about the reliability of peer-reviewed interpretations, as the initial dating—endorsed by peer review—was later found to be incorrect.

MPP’s first attempt to justify his dates

The Craig Rhos-y-Felin Quarry: Cherry-Picking Evidence to Fit a Hypothesis

The investigations led by MPP into the origins of Stonehenge’s bluestones provide a compelling case study of how the peer-review process can be intertwined with pursuing a specific hypothesis, potentially overlooking contradictory evidence and leading to flawed conclusions.  The initial breakthrough of finding the bluestone quarry at Craig Rhos-y-Felin was significant.  However, the subsequent attempts to date the quarry and link it definitively to a specific construction date for Stonehenge, particularly around 3300 BCE, demonstrate a tendency to “attempt to find a date that would vindicate their Stonehenge dating methods.”

(Archaeology: The Flaws of Peer Review)

At Craig Rhos-y-Felin, over 42 carbon dates were obtained.  However, the peer-reviewed reports emanating from this investigation were criticised for emphasising only a couple of Neolithic dates that appeared to support the 3300 BCE hypothesis while mainly overlooking the “extensive evidence found in the site’s man-made hearths, which showed that the quarry was first occupied in the Mesolithic Period.” These Mesolithic hearths, dating significantly earlier than the desired Neolithic timeframe, posed a challenge to the pre-existing narrative but were seemingly marginalised in pursuit of a specific conclusion.  This selective presentation of data, which the sources label as “clear ‘cherry-picking’ of the archaeological evidence,” suggests that the weight of the reported evidence was skewed by the author’s desire to validate a prior claim and that the peer-review process in this instance did not sufficiently challenge this biased interpretation.

(Archaeology: The Flaws of Peer Review)
Only accept one of the forty-two carbon dates that were closest to his hypothesis

Waun Mawn: The Search for a Lost Circle and the Limits of Peer Review

The discrepancy between the desired 3300 BCE date and the slightly earlier dates obtained at the quarry site fueled the hypothesis of a “Welsh prototype stone circle which was moved 500 years later.” This second claim by MPP and subsequent peer-reviewed papers and TV programmes “claimed to find this ‘mysterious site,’ later to discover that it was nonsense raises serious questions about the rigour of the research and the extent to which the peer-review process scrutinised these evolving and ultimately unsubstantiated claims.

At Waun Mawn, only four bluestones were found, leading to a “sad attempt to fit a square peg into a round hole” by identifying ten further stone holes and guesstimating the existence of the remaining stones needed to match Stonehenge.  Furthermore, the dating evidence from Waun Mawn is heavily criticised.  While the program highlighted a single OSL date that appeared to align with the desired timeframe, the sources reveal that “there was not one OSL sample taken but 18, which gave results in the range of 6980+/- 2120 BCE to AD 1900 +/- 20.” The fact that “17 dating samples did not verify MPP’s Hypothesis, ONLY a single one,” strongly suggests a selective emphasis on a single data point to support a pre-existing claim.

(Archaeology: The Flaws of Peer Review)
The dates he found corresponded to other carbon dates at Stonehenge but were ignored

Conclusion: Moving Beyond the Illusion of Infallibility

While the peer-review process remains a vital component of archaeological scholarship, it is crucial to recognise its inherent limitations and avoid believing that all peer-reviewed papers are accurate and error-free.  The case studies surrounding Mike Parker-Pearson’s investigations into the origins of Stonehenge highlight how the subjectivity of archaeological interpretation, the pursuit of pre-existing hypotheses, and the potential influence of the reporter’s authority can lead to flawed findings being published.  The selective use of data, the downplaying of contradictory evidence, and the development of speculative theories underscore the need for a more critical engagement with peer-reviewed publications, prioritising rigorous examination of the factual evidence and methodologies employed rather than relying on perceived authority.

(Archaeology: The Flaws of Peer Review)

Prologue

Archaeological research, while often considered a rigorous discipline, faces challenges concerning the reach and reliability of its published work. Studies have shown that a significant portion of academic papers receive minimal attention post-publication. Approximately 44% of all published manuscripts are never cited, indicating that nearly half of these works remain largely unread or unreferenced within the scholarly community.

lucbeaulieu.com

Furthermore, citation analyses reveal that the average number of citations per paper is below ten. Achieving 10 or more citations places a manuscript in the top 24% of the most-cited works worldwide, underscoring the limited engagement many papers receive.

lucbeaulieu.com

Regarding the accuracy of scientific publications, the rate of retractions has seen a notable increase. Although retracted papers still constitute a small fraction—under 0.1%—of the more than 25 million papers indexed in PubMed since the 1940s, this uptick highlights ongoing concerns about the reliability of published research.

en.wikipedia.org

In archaeology, the prevalence of flawed studies is difficult to quantify precisely due to the field’s interpretive nature and the scarcity of replication studies. However, documented cases, such as the Himalayan fossil hoax involving Vishwa Jit Gupta, illustrate that significant errors and even fraudulent activities can persist undetected for extended periods, thereby influencing subsequent research.

en.wikipedia.org

These insights emphasise the necessity for heightened scrutiny and critical engagement within archaeological scholarship to ensure the integrity and impact of its contributions.

PodCast

Author’s Biography

Robert John Langdon, a polymathic luminary, emerges as a writer, historian, and eminent specialist in LiDAR Landscape Archaeology.

His intellectual voyage has interwoven with stints as an astute scrutineer for governmental realms and grand corporate bastions, a tapestry spanning British Telecommunications, Cable and Wireless, British Gas, and the esteemed University of London.

A decade hence, Robert’s transition into retirement unfurled a chapter of insatiable curiosity. This phase saw him immerse himself in Politics, Archaeology, Philosophy, and the enigmatic realm of Quantum Mechanics. His academic odyssey traversed the venerable corridors of knowledge hubs such as the Museum of London, University College London, Birkbeck College, The City Literature Institute, and Chichester University.

In the symphony of his life, Robert is a custodian of three progeny and a pair of cherished grandchildren. His sanctuary lies ensconced in the embrace of West Wales, where he inhabits an isolated cottage, its windows framing a vista of the boundless sea – a retreat from the scrutinous gaze of the Her Majesty’s Revenue and Customs, an amiable clandestinity in the lap of nature’s embrace.

Exploring Prehistoric Britain: A Journey Through Time

My blog delves into the fascinating mysteries of prehistoric Britain, challenging conventional narratives and offering fresh perspectives based on cutting-edge research, particularly using LiDAR technology. I invite you to explore some key areas of my research. For example, the Wansdyke, often cited as a defensive structure, is re-examined in light of new evidence. I’ve presented my findings in my blog post Wansdyke: A British Frontier Wall – ‘Debunked’, and a Wansdyke LiDAR Flyover video further visualizes my conclusions.

My work also often challenges established archaeological dogma. I argue that many sites, such as Hambledon Hill, commonly identified as Iron Age hillforts are not what they seem. My posts Lidar Investigation Hambledon Hill – NOT an ‘Iron Age Fort’ and Unmasking the “Iron Age Hillfort” Myth explore these ideas in detail and offer an alternative view. Similarly, sites like Cissbury Ring and White Sheet Camp, also receive a re-evaluation based on LiDAR analysis in my posts Lidar Investigation Cissbury Ring through time and Lidar Investigation White Sheet Camp, revealing fascinating insights into their true purpose. I have also examined South Cadbury Castle, often linked to the mythical Camelot56.

My research also extends to the topic of ancient water management, including the role of canals and other linear earthworks. I have discussed the true origins of Car Dyke in multiple posts including Car Dyke – ABC News PodCast and Lidar Investigation Car Dyke – North Section, suggesting a Mesolithic origin2357. I also explore the misidentification of Roman aqueducts, as seen in my posts on the Great Chesters (Roman) Aqueduct. My research has also been greatly informed by my post-glacial flooding hypothesis which has helped to inform the landscape transformations over time. I have discussed this hypothesis in several posts including AI now supports my Post-Glacial Flooding Hypothesis and Exploring Britain’s Flooded Past: A Personal Journey

Finally, my blog also investigates prehistoric burial practices, as seen in Prehistoric Burial Practices of Britain and explores the mystery of Pillow Mounds, often mistaken for medieval rabbit warrens, but with a potential link to Bronze Age cremation in my posts: Pillow Mounds: A Bronze Age Legacy of Cremation? and The Mystery of Pillow Mounds: Are They Really Medieval Rabbit Warrens?. My research also includes the astronomical insights of ancient sites, for example, in Rediscovering the Winter Solstice: The Original Winter Festival. I also review new information about the construction of Stonehenge in The Stonehenge Enigma.

Further Reading

For those interested in British Prehistory, visit www.prehistoric-britain.co.uk, a comprehensive resource featuring an extensive collection of archaeology articles, modern LiDAR investigations, and groundbreaking research. The site also includes insights and extracts from the acclaimed Robert John Langdon Trilogy, a series of books exploring Britain during the Prehistoric period. Titles in the trilogy include The Stonehenge Enigma, Dawn of the Lost Civilisation, and The Post Glacial Flooding Hypothesis, offering compelling evidence about ancient landscapes shaped by post-glacial flooding.

To further explore these topics, Robert John Langdon has developed a dedicated YouTube channel featuring over 100 video documentaries and investigations that complement the trilogy. Notable discoveries and studies showcased on the channel include 13 Things that Don’t Make Sense in History and the revelation of Silbury Avenue – The Lost Stone Avenue, a rediscovered prehistoric feature at Avebury, Wiltshire.

In addition to his main works, Langdon has released a series of shorter, accessible publications, ideal for readers delving into specific topics. These include:

For active discussions and updates on the trilogy’s findings and recent LiDAR investigations, join our vibrant community on Facebook. Engage with like-minded enthusiasts by leaving a message or contributing to debates in our Facebook Group.

Whether through the books, the website, or interactive videos, we aim to provide a deeper understanding of Britain’s fascinating prehistoric past. We encourage you to explore these resources and uncover the mysteries of ancient landscapes through the lens of modern archaeology.

For more information, including chapter extracts and related publications, visit the Robert John Langdon Author Page. Dive into works such as The Stonehenge Enigma or Dawn of the Lost Civilisation, and explore cutting-edge theories that challenge traditional historical narratives.

Other Blogs

s

t

Hollows, Sunken Lanes and Palaeochannels

Hollows, Sunken Lanes and Palaeochannels – these landscape features have been the product of mythology throughout history.

Introduction

Standing on the worn, weathered path of a holloway, enveloped by the towering earthen walls on either side, I often contemplate the origins of these enigmatic features. As a wanderer drawn to these ancient pathways, I’ve always been fascinated by the layers of history and mystery that seem to permeate the very soil beneath my feet. Holloways, these sunken roads carved into the landscape, carry with them the aura of countless stories, but their formation captivates my curiosity the most. (Hollows, Sunken Lanes and Palaeochannels)

Hollows, Sunken Lanes and Palaeochannels
Far too high to be foot treaded by traffic or carts – probably quarrying
Hollows

Holloways are found primarily in the rural landscapes of Europe, with many prominent examples in the UK. These paths are often etched into the bedrock, composed of resilient materials like sandstone and chalk. Commonly held beliefs suggest that these sunken roads were formed by the relentless tread of human and animal traffic over centuries. The romantic notion is appealing, conjuring images of medieval pilgrims, bustling traders, and local villagers using these routes daily, gradually wearing down the earth. However, as I walk these secluded paths, far from any major urban centre, the narrative begins to feel a bit disjointed.

The solitude of these holloways contradicts the idea of heavy, consistent traffic. Many of these paths lie hidden, nestled away from the bustling life of cities and even small towns. They weave through the countryside, often known only to locals and to those few who seek them out for their historic and aesthetic appeal. This observation leads me to question: Could human activity alone have really caused such significant erosion in such durable geological materials?

 (Hollows, Sunken Lanes and Palaeochannels)
Chinnock Hollow – Yeovil

Case Study – Chinnock Hollow

My scepticism grows as I consider the geological and environmental factors at play. It seems more plausible that these paths are not solely the product of human endeavour but also, and perhaps more so, of natural processes. Indeed, some of the holloways show signs of being man-made, likely the result of historical quarrying activities. These paths are narrower, carved with a precision that suggests deliberate human intervention, perhaps as part of resource extraction practices in ancient times. The straight, purposeful lines contrast with the more organic shapes of other holloways. (Hollows, Sunken Lanes and Palaeochannels)

More intriguing to me are the holloways with rounded, sinuous forms, which suggest the sculpting hand of natural forces. The hypothesis that resonates with me involves the actions of water—powerful, persistent water. During the last ice age, melting glaciers could have dramatically altered the landscape, with meltwater raising water tables and creating new streams and rivers. Over millennia, these waterways could have carved out the initial shapes of what would become holloways, with subsequent water flow deepening and defining their courses. As the climate warmed and the ice retreated, these temporary torrents may have dried up, leaving behind the hollowed-out paths we see today.

Chinnock Hollow Map
On the old OS map, it looks like it might be associated with town footfall?

This theory aligns with my observations of the Holloways’ locations and forms. Those shaped by water exhibit a rounded, undulating profile that mirrors the natural flow of streams and rivers, a stark contrast to the angular, deliberate cuts of man-made paths. Moreover, the presence of dried-up springs and altered watercourses in the vicinity of many holloways supports this idea, suggesting a historical environmental context far different from today’s. (Hollows, Sunken Lanes and Palaeochannels)

Yet, despite these insights, the allure of the mystical and the mythical still clings to these ancient roads. There is a certain romanticism in imagining the holloways as arteries of the old world, teeming with life and stories. But as much as I appreciate the charm of these tales, my quest for understanding leans on science. The true story of the Holloways, I believe, lies at the intersection of human history and natural history—a narrative crafted not just by the footsteps of our ancestors but by the powerful, sculpting hands of the earth itself.

Hollows, Sunken Lanes and Palaeochannels - Lidar Channock Hollow
Chinnock Hollow on LiDAR clearly shows it is a natural Palaeochannel and not man-made

It’s clear that more comprehensive geological and historical research is needed to fully unravel the origins of these fascinating features. Geologists and historians together could shed light on how these paths were formed and evolved over time, providing a clearer picture that marries the mythical with the empirical. Such investigations could not only satisfy the curiosity of those like myself but also enhance our appreciation of how deeply intertwined our history is with the natural world. As I continue to explore these paths, the desire for knowledge only grows, driving me to advocate for deeper studies that might finally illuminate the full story of these hollowed roads, etched so indelibly into the landscape. (Hollows, Sunken Lanes and Palaeochannels)

(Hollows, Sunken Lanes and Palaeochannels)
Chinnock Holloway with Mesolithic Water Heights – (Hollows, Sunken Lanes and Palaeochannels)

Site Investigation Protocol: Advanced LiDAR Interpretation for Prehistoric Landscape Features

1. Protocol Scope and Strategic Objective

This protocol mandates an immediate strategic departure from the “military-defensive” fantasies that have dominated British archaeology for over a century. We are moving toward a rigorous “hydrological-prehistoric” framework. Traditional interpretations—often little more than “archaeological pulp fiction”—reflexively categorise every ditch as a defensive frontier and every hollow as a product of medieval foot traffic. Such narratives ignore the fundamental geomorphology of the post-glacial British landscape. Accurate classification of dykes, holloways, and earthworks is not a matter of historical debate; it is a matter of geospatial science.

The core objective of this protocol is to deploy high-resolution LiDAR as the primary diagnostic instrument to identify prehistoric canals and palaeochannels. By stripping away the interference of modern agricultural scarring and Holocene vegetation, we expose the “ground truth” of the prehistoric surface. This protocol utilises the “Post-Glacial Flooding Hypothesis” to reclassify features previously shrouded in myth, providing a technical roadmap for identifying a sophisticated maritime infrastructure that once connected Britain to the European continent.

2. Theoretical Framework: The Post-Glacial Hydrological Paradigm

The “Post-Glacial Flooding Hypothesis” is the analytical lens through which all features must be viewed. This paradigm recognises that the primary architects of the British landscape were not Iron Age warriors or Saxon labourers, but the catastrophic volumes of meltwater and significantly raised water tables following the last glacial maximum. Traditional “Ivory Tower” archaeology suffers from a fundamental failure to account for these hydrological forces, leading to the systemic misidentification of natural watercourses as “man-made” sunken roads.

Environmental Drivers of Landscape Formation

Investigators must account for the following drivers in every site assessment:

  • Meltwater Torrents: Persistent, high-energy flows from receding glaciers capable of carving deep, sinuous paths into resilient bedrock like sandstone and chalk.
  • Elevated Water Tables: A historical environment where prehistoric river levels were significantly higher, sustaining active waterways in areas currently classified as “dry.”
  • Palaeochannel Transition: The natural evolution of active Mesolithic waterways into contemporary “dry” hollows as climate stabilisation lowered the regional water table.

Accepting these natural drivers effectively exposes the “Archaeological Pseudoscience” of the “traffic-erosion” theory. If a feature exists in deep solitude, far from historical urban centres, the human-erosion narrative is mathematically invalidated. Furthermore, the “military-frontier” theory for dykes collapses when the features are analysed through “Hydrology 101,” revealing them to be functional maritime canals.

3. Technical Standards for LiDAR Data Acquisition

Traditional surveys are rendered obsolete by surface noise. High-resolution LiDAR (4K, 5K, and 8K) is mandatory to bypass modern infrastructure and reveal the underlying quaternary geology. Analysis must be conducted within 3D viewing software and flyover simulations to replicate a professional remote sensing workflow.

Technical Requirements for Feature Validation

Resolution TierDiagnostic CapabilityPrimary Application
4K QualityBasic relief mapping; identification of modern agricultural scarring.Initial site spotting and large-scale regional overviews.
5K QualityMorphological differentiation; identifies rounded profiles and sinuous paths.Distinguishing between natural erosion and deliberate human quarrying.
8K PrecisionHigh-fidelity texture analysis; sub-meter contouring; underground groundwater fractals.25 sq. km tiles for 3D flyover analysis of landscape-scale canal systems.

The application of 8K precision is the pivot point for site reclassification. It allows for the identification of “rounded, sinuous forms” indicative of natural water flow, as opposed to the “angular, man-made cuts” associated with historical resource extraction. This precision is the only defence against “The Great Antler Pick Hoax,” which posits that primitive tools were responsible for massive landscape engineering.

4. Morphological Analysis: Differentiating Natural Flow from Human Intervention

Morphological rigour is the primary directive. The geometry of a feature dictates its classification, regardless of its proximity to known archaeological sites or established myths.

Diagnostic Signatures: Natural vs. Anthropogenic

  • Water-Sculpted (Natural / Palaeochannel):
    • Profile: Rounded, undulating profiles reflecting fluid dynamics.
    • Path: Sinuous, organic routes that respect topographical contours and connect to groundwater fractals.
    • Location: Often found in “deep solitude”—a diagnostic negative indicator for human erosion theories.
  • Human-Sculpted (Anthropogenic / Resource Extraction):
    • Profile: Angular, precise cuts with sharp transitions characteristic of quarrying.
    • Path: Straight, purposeful lines that override natural topographical flow.

This morphological rigor proves that Chinnock Hollow (Yeovil) is an empirical palaeochannel. LiDAR imaging reveals a sinuous form etched into resilient sandstone and chalk bedrock—a feat impossible for human footfall or cart traffic, which “Ivory Tower” narratives conveniently ignore.

5. Categorical Investigation Procedures: Dykes, Holloways, and Canals

This protocol demands a recursive re-evaluation of Britain’s “Great Dykes” and “Sunken Lanes,” dismantling the hoaxes of “Saxon Dykes” or “Iron Age Forts.”

Mandatory Investigative Directives

  1. Holloways: Conduct a recursive search for dried-up springs and historical environmental contexts. If the feature is etched into resilient bedrock (sandstone/chalk) and exhibits a sinuous profile, it must be classified as a meltwater-carved palaeochannel. The “traffic thread” narrative must be discarded if the feature is located in deep solitude.
  2. Dykes (Prehistoric Canals): Reclassify features like the Wansdyke and Car Dyke as standardised canal systems. The Car Dyke is specifically a Mesolithic canal. These features must be analysed as maritime infrastructure designed for “From the Rhône to Wansdyke” trans-European connectivity, utilised by standardised prehistoric canal boats.
  3. Earthworks and Hillforts: Treat “military way” and “defensive fort” labels as hoaxes. Specifically, the “Military Way” and “Stanegate” at Hadrian’s Wall are historical misidentifications. Investigators must use LiDAR to identify hydrological connections. For example, Durrington Walls must be reclassified from a “henge” to a managed Mesolithic landscape featuring platforms and fish traps integrated into a ditch-and-waterway system.

6. Protocol Synthesis and Forensic Reporting

This protocol marks the final transition from “archaeological pulp fiction” to empirical, LiDAR-based forensic science. The “Ivory Tower Collapse” is inevitable as geospatial data replaces romanticised hearsay. Site investigators are required to produce reports that prioritise empirical signatures over established narratives.

Critical Takeaways for Site Investigators

  1. Priority of Hydrological Context: Mandatory Directive: Always evaluate features as potential watercourses (palaeochannels or canals) before considering human-centric myths.
  2. Resolution-Driven Validation: Only 5K-8K LiDAR tiles provide the precision necessary to validate groundwater fractals and the organic signatures of post-glacial flow.
  3. Rejection of Defensive Assumptions: Question all “defensive” labels. If a feature aligns with the Post-Glacial Flooding Hypothesis or functional maritime engineering, the military interpretation is a documented hoax.

This protocol ensures the “mythical” is finally replaced by the “empirical,” utilising advanced remote sensing to reveal the true prehistoric landscape of Britain.

PodCast

Author’s Biography

Robert John Langdon, a polymathic luminary, emerges as a writer, historian, and eminent specialist in LiDAR Landscape Archaeology.

His intellectual voyage has interwoven with stints as an astute scrutineer for governmental realms and grand corporate bastions, a tapestry spanning British Telecommunications, Cable and Wireless, British Gas, and the esteemed University of London.

A decade hence, Robert’s transition into retirement unfurled a chapter of insatiable curiosity. This phase saw him immerse himself in Politics, Archaeology, Philosophy, and the enigmatic realm of Quantum Mechanics. His academic odyssey traversed the venerable corridors of knowledge hubs such as the Museum of London, University College London, Birkbeck College, The City Literature Institute, and Chichester University.

In the symphony of his life, Robert is a custodian of three progeny and a pair of cherished grandchildren. His sanctuary lies ensconced in the embrace of West Wales, where he inhabits an isolated cottage, its windows framing a vista of the boundless sea – a retreat from the scrutinous gaze of the Her Majesty’s Revenue and Customs, an amiable clandestinity in the lap of nature’s embrace.

Exploring Prehistoric Britain: A Journey Through Time

My blog delves into the fascinating mysteries of prehistoric Britain, challenging conventional narratives and offering fresh perspectives based on cutting-edge research, particularly using LiDAR technology. I invite you to explore some key areas of my research. For example, the Wansdyke, often cited as a defensive structure, is re-examined in light of new evidence. I’ve presented my findings in my blog post Wansdyke: A British Frontier Wall – ‘Debunked’, and a Wansdyke LiDAR Flyover video further visualizes my conclusions.

My work also often challenges established archaeological dogma. I argue that many sites, such as Hambledon Hill, commonly identified as Iron Age hillforts are not what they seem. My posts Lidar Investigation Hambledon Hill – NOT an ‘Iron Age Fort’ and Unmasking the “Iron Age Hillfort” Myth explore these ideas in detail and offer an alternative view. Similarly, sites like Cissbury Ring and White Sheet Camp, also receive a re-evaluation based on LiDAR analysis in my posts Lidar Investigation Cissbury Ring through time and Lidar Investigation White Sheet Camp, revealing fascinating insights into their true purpose. I have also examined South Cadbury Castle, often linked to the mythical Camelot56.

My research also extends to the topic of ancient water management, including the role of canals and other linear earthworks. I have discussed the true origins of Car Dyke in multiple posts including Car Dyke – ABC News PodCast and Lidar Investigation Car Dyke – North Section, suggesting a Mesolithic origin2357. I also explore the misidentification of Roman aqueducts, as seen in my posts on the Great Chesters (Roman) Aqueduct. My research has also been greatly informed by my post-glacial flooding hypothesis which has helped to inform the landscape transformations over time. I have discussed this hypothesis in several posts including AI now supports my Post-Glacial Flooding Hypothesis and Exploring Britain’s Flooded Past: A Personal Journey

Finally, my blog also investigates prehistoric burial practices, as seen in Prehistoric Burial Practices of Britain and explores the mystery of Pillow Mounds, often mistaken for medieval rabbit warrens, but with a potential link to Bronze Age cremation in my posts: Pillow Mounds: A Bronze Age Legacy of Cremation? and The Mystery of Pillow Mounds: Are They Really Medieval Rabbit Warrens?. My research also includes the astronomical insights of ancient sites, for example, in Rediscovering the Winter Solstice: The Original Winter Festival. I also review new information about the construction of Stonehenge in The Stonehenge Enigma.

Further Reading

For those interested in British Prehistory, visit www.prehistoric-britain.co.uk, a comprehensive resource featuring an extensive collection of archaeology articles, modern LiDAR investigations, and groundbreaking research. The site also includes insights and extracts from the acclaimed Robert John Langdon Trilogy, a series of books exploring Britain during the Prehistoric period. Titles in the trilogy include The Stonehenge Enigma, Dawn of the Lost Civilisation, and The Post Glacial Flooding Hypothesis, offering compelling evidence about ancient landscapes shaped by post-glacial flooding.

To further explore these topics, Robert John Langdon has developed a dedicated YouTube channel featuring over 100 video documentaries and investigations that complement the trilogy. Notable discoveries and studies showcased on the channel include 13 Things that Don’t Make Sense in History and the revelation of Silbury Avenue – The Lost Stone Avenue, a rediscovered prehistoric feature at Avebury, Wiltshire.

In addition to his main works, Langdon has released a series of shorter, accessible publications, ideal for readers delving into specific topics. These include:

For active discussions and updates on the trilogy’s findings and recent LiDAR investigations, join our vibrant community on Facebook. Engage with like-minded enthusiasts by leaving a message or contributing to debates in our Facebook Group.

Whether through the books, the website, or interactive videos, we aim to provide a deeper understanding of Britain’s fascinating prehistoric past. We encourage you to explore these resources and uncover the mysteries of ancient landscapes through the lens of modern archaeology.

For more information, including chapter extracts and related publications, visit the Robert John Langdon Author Page. Dive into works such as The Stonehenge Enigma or Dawn of the Lost Civilisation, and explore cutting-edge theories that challenge traditional historical narratives.

Other Blogs

s

t

Archaeological ‘pulp fiction’ – has archaeology turned from science?
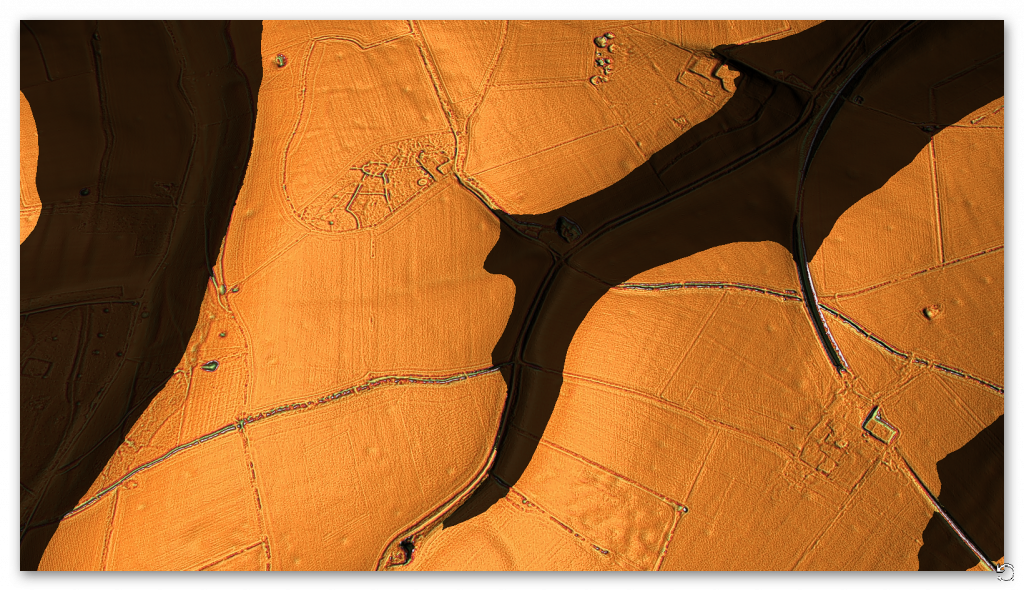
Introduction

After 40 years of studying archaeological features and reports, I have sadly concluded that archaeologists no longer follow accepted scientific methods and now revert to the simplistic traditional model or political correctness, mixed with the occasional sensationalism, not to progress the discipline but moreover, to find funding and maintain their status in the archaeological community.  This new social media marketing technique has also spread to both the geological and anthropological disciplines closely related to this archaeological ‘pulp fiction’. (Archaeological ‘pulp fiction’ – has archaeology turned from science?)

Science is about questioning what is known, as it is understood from History that current knowledge is not a ‘SCIENTIFIC FACT’ but just a supposition which over time will change and become more accurate through questioning the details of these ideas over time and the inevitable future scientific discoveries – but this is not the case in archaeology. (Archaeological ‘pulp fiction’ – has archaeology turned from science?)

Bronowski - Archaeological 'pulp fiction' - has archaeology turned from science?
Bronowski – Archaeological ‘pulp fiction’ – has archaeology turned from science?

In recent years, the discovery of the Bluestone quarry at Craig Rhos-Y-Felin should have brought a new perspective to the construction date and nature of the civilisation that built Stonehenge – Britain’s most famous prehistoric site.  Instead, the findings and data were manipulated to prove an existing hypothesis while excluding more interesting and revolutionary results.

This dogmatic approach to archaeology is compounded by new theories and even findings being ignored and, in some instances, actively crushed by the archaeological establishment and their disciples in favour of this dated ‘historical narrative’ in this new post-truth era of social media – rather than following the past practices of a scientific methodology of examining the potential and feasibility of these new ideas. 

This censorship is also practised in scientific journals and websites either by blanket failure to publish contrary evidence or by claiming a liberal attitude and then demanding excessive peer-reviewed endorsements before consideration.  In some instances, they encourage the simplistic labelling of these ideas as ‘pseudoscience’ in social media and academic punishment at university for any student that dares suggest such ideas in their assignments. (Archaeological ‘pulp fiction’ – has archaeology turned from science?)

Karl Popper quote - Archaeological 'pulp fiction' - has archaeology turned from science?
Popper -(Archaeological ‘pulp fiction’ – has archaeology turned from science?)

Moreover, these education establishments have failed to teach their students basic scientific principles of ‘critical analysis’ and ‘deductive logic’ when examining primary sources, demanding their students rely on secondary sources (opinions) of an accepted highly vetted reading list – which therefore favours the current simplistic traditional theories.  Consequently, this allows them to concentrate their energies on the establishment’s main concern for ‘bums on seats’ to secure funding for future financial security, rather than the higher principle of progressive education – questioning the validity of the certificates and qualifications awarded.

The establishments over-reliance on ‘peer-review’ as a conformity standard of credibility has not only been recognised by myself within my recent Honours degree in History but by moreover Richard Horton, editor of the British medical journal The Lancet, who said that:

“The mistake, of course, is to have thought that peer review was any more than a crude means of discovering the acceptability—not the validity—of a new finding. Editors and scientists alike insist on the pivotal importance of peer review. We portray peer review to the public as a quasi-sacred process that helps to make science our most objective truth teller.

But we know that the system of peer review is biased, unjust, unaccountable, incomplete, easily fixed, often insulting, usually ignorant, occasionally foolish, and frequently wrong.” (Archaeological ‘pulp fiction’ – has archaeology turned from science?)

peer review is biased, unjust, unaccountable, incomplete, easily fixed, often insulting, usually ignorant, occasionally foolish, and frequently wrong." Archaeological 'pulp fiction' - has archaeology turned from science?
Richard Horton – “unjust, unaccountable, incomplete, easily fixed, often insulting, usually ignorant, occasionally foolish, and frequently wrong.” – archaeological ‘pulp fiction’

So, in what areas do we see this flawed blanket censorship and what are the other possibilities archaeologists have failed to comprehend?

Cheddar Man

A recent discovery in Britain was made by analysing the mtDNA (mitochondrial DNA) from the skeleton of a Mesolithic man, discovered in the Cheddar Gorge, Somerset, England. According to the announcement, what researchers found in their analysis was that this ancient person (dated approximately 9000 years ago) likely had a dark (brown-black) skin colour, dark brown hair, blue eyes, and phenotypical features resemble western Europeans. That’s all well and good, but what’s the problem with that? (Archaeological ‘pulp fiction’ – has archaeology turned from science?)

Without going into too much detail about the genomic research conducted, the issue is with the findings compiled with data collected over twenty years prior when the mtDNA collection first began in 1996. The 1996 study (interestingly was not subjected to any peer-review) it has been stated by subsequent reports referencing these findings, suggested that there was modern DNA contamination at some point in the process of collection. (Archaeological ‘pulp fiction’ – has archaeology turned from science?)

Cheddar Man -Archaeological 'pulp fiction' - has archaeology turned from science?
Cheddar Man -(Archaeological ‘pulp fiction’ – has archaeology turned from science?)

The more recent study was made after a fragment of the skull was analysed in 2018. It was found that Cheddar Man’s remains belonged to the same ancestral family as other Mesolithic European populations. This information does not seem too profound, but what appears to be an issue for some, including myself, is simply the lack of efforts to peer-review the work first conducted to ensure that all the findings are legitimate and then knowing its questionable origins to go on to publish the chromosome details of hair colour, eye colour and skin colour via a model to gain maximum publicity. (Archaeological ‘pulp fiction’ – has archaeology turned from science?)

Even if the DNA was not contaminated initially, the chromosomes required to estimate (as this science is still not proven, just a working hypothesis) were missing.  Of the six types of chromosome needed for the estimation of skin tone, 60% of them were absent, and consequently, at BEST, the assessment had a 60% chance of being incorrect.  Science dictates that unless the probability rate is greater than 50%, then the result should not be even attempted as the likelihood (statistically) is wrong!!

Yet, this announcement has now created ‘scientifically based’ documentaries showing that black Rastafarian men (with dreadlocks), discovered and populated Ireland ten thousand years ago, all based on ‘Bad Science’ that gave the establishment political ‘brownie points’ on social media. Previous studies (Genomic structure in Europeans dating back at least 36,200 years, Science DOI: 10.1126/science.aaa0114) have shown that the first Europeans were Scandinavians, and hence cheddar man’s’ blue eyes’. (Archaeological ‘pulp fiction’ – has archaeology turned from science?)

Craig Rhos-Y-Felin (Stonehenge’s Bluestone Quarry)

The Craig Rhos-y-Felin report (by Mike Parker-Pearson) is full of inconsistencies and logical inaccuracies as the layout of the site were never taken into consideration.  Firstly is the river that runs next to the quarry – this shows that this river was still at the edge of the site as long ago as 5620 – 5460 BCE and possibly up to 1030 – 910 BCE. (Archaeological ‘pulp fiction’ – has archaeology turned from science?)

Craig Rhos-Y-Felin - Archaeological 'pulp fiction' - has archaeology turned from science?
Craig Rhos-Y-Felin – (Archaeological ‘pulp fiction’ – has archaeology turned from science?)

Most of the site was then covered by a layer of yellow colluvium (035), dated by oak charcoal to 1030–910 cal BC (combine SUERC-46199; 2799±30 BP and SUERC-46203; 2841±28 BP). This deposit is contemporary with the uppermost fill of a palaeochannel of the Brynberian stream that flowed past the northern tip of the outcrop. Charcoal of Corylus and Tilia from the basal fill of this palaeochannel dates to 5800–5640 cal BC (OxA- 32021; 6833±40 BP) and 5620–5460 cal BC (OxA-32022; 6543±37 BP), both at 95.4% probability.”

Consequently, what the report is trying to tell us, is that an enlarged stream that feeds into the River Nevern was flowing during the Mesolithic Period up to the quarry outcrop rocks, and it remained there just a few metres away, even up to 1000 BCE.  Therefore, the apparent transport system for these large newly quarried stones to their final destination at Stonehenge, as we have seen in other countries with their stone constructions like Egypt – was via a boat. (Archaeological ‘pulp fiction’ – has archaeology turned from science?)

Moreover, the site layout also gives a clear indication of when the stone was genuinely quarried. There is a single monolith ready for transportation by the river on the east side of the site, and the hearths, which are human-made, are a few metres south of this monolith – where you would expect them.  The problem for archaeologists is that these are Mesolithic hearths, and they’re not just one but three hearths dating from 8550 – 8330 BCE; 8220 – 7790 and BCE 7490 – 7190B CE and yet the report quite clearly states:

Rhos-Y-Felin Mesolithic hearths - Archaeological 'pulp fiction' - Archaeological 'pulp fiction' - has archaeology turned from science?
Rhos-Y-Felin Mesolithic hearths – archaeological ‘pulp fiction’

“There is no evidence of any Mesolithic Quarrying or working of Rhyolite from this crop”.

This is an astonishing unscientific claim – for how they would know what tool marks are either Mesolithic or Neolithic (would they not be using the same tools?) And secondly, what do they think they were doing there at the quarry during these 1300 years?

What the establishment would like you to believe is that just TWO of the 42 carbon dates obtained from the site are of importance and the other 40 are irrelevant.  This is ‘bad science’ in pursuit of maintaining the ‘tradition model’ at the expense of real science.

More information can be found about Craig Rhos-Y-Felin can be found on this website and on this video channel. (Archaeological ‘pulp fiction’ – has archaeology turned from science?)

Woodhenge

Sadly, Woodhenge’s traditional reconstruction shows us yet another illustration of flawed science in archaeology.  Even with a ‘second rate’ excavation report from the 1920s, the conclusion of modern archaeologists is that this structure was a single-story house – a slightly grander feature to the traditional ‘iron age’ house or an ‘artistic forest’ of tree stumps is simply nonsense. If we look closely at the evidence presented here, we obtain a totally different and more accurate conclusion to the nature of this structure.

Firstly, if we look at the layout of the site (which lacks much detail), we can see from these original excavation plans the scale of this understatement, as the existing ‘concrete’ posts on the site are far too small.  The most recent photo was from the excavation by Pollard in 2007 indicates that the original post holes are at least five times larger than the current representations. (Archaeological ‘pulp fiction’ – has archaeology turned from science?)

Woodhenge misinterpretation – archaeological ‘pulp fiction’

The following fact that goes unanswered is the reason for the large ramps by the post holes. You don’t take time to put 32 ramps into the soil unless it is essential, as you just added at least another month to the building work for the site and 500 working hours.  What archaeologists have missed (or failed to mention) is in which direction these ramps were cut – as it tells us more than the entire excavation report by Cunnington.

The massive 4 – 5 ft pine posts of the 16 postholes (known as the C Ring) would weigh 214kg per foot of length.  Therefore, several sizeable healthy adults could pick up a single story pole and place it in a hole without assistance or a need for a large ramp.

Moreover, the site plan does also give us another clue to the length of these poles.  If to look carefully at the angle of the ramps into the giant postholes, you will notice that they are not all facing the same direction.  The only logical reason for that to happen is if you erect the pine poles in a set order not to hit or interfere with each other when attempting to erect the posts.  This would prove that the poles at Woodhenge were over 100 ft high (if not taller). (Archaeological ‘pulp fiction’ – has archaeology turned from science?)

Archaeological 'pulp fiction' - has archaeology turned from science?
Giant Posts of Woodhenge – archaeological pulp fiction.

As for the dating of Woodhenge reconstruction (and Durrington Walls), like Stonehenge, unrelated antler and bone fragments have dated it to about 2400 BCE, which is very convenient.  The problem is that most of the post hole samples at Woodhenge were either lost or have been stored away and not tested since the excavations between 1926 to 29, for reasons known best to the experts. (Archaeological ‘pulp fiction’ – has archaeology turned from science?)

Moreover, like the samples taken from the old car park in 1966, pine charcoal was reported to be found “similar to the charcoal found at Woodhenge” was the quote from the labs at the time, who failed to carbon date the samples as the experts had declared them Neolithic, supporting the antler pick dates.  Although now, once this gross error was exposed, we know these pine charcoal wood dates to be in fact Mesolithic 8100 BCE – which ‘begs-the-question’ so are the pine charcoal dates found at Woodhenge also Mesolithic, and why were they not also carbon-dated when the mistake was discovered? – more ‘bad science’ supporting the traditional model.

More information can be found about Woodhenge can be found on this website and on this video channel. (Archaeological ‘pulp fiction’ – has archaeology turned from science?)

Dykes

If you study archaeology at university or even on an ordinance survey map at length, you will notice strange earthworks on the sides of hills of Britain, with no rational explanation as to why they are where they are. At university, these features are mostly ignored, or an excuse is made for their construction. The reality is that these features do not make any sense unless there is another factor in operation.

The first thing to notice is that the word ‘Dyke’ is associated with water. It does seem strange you would call an earthwork on top of a hill a Dyke, unless there was some history passed down through the years to its actual use. If we look at the most famous Dyke in Britain: Offa’s Dyke (that tracks the border between England and Wales).

Wansdyke - Archaeological 'pulp fiction' - has archaeology turned from science?
Wansdyke – (Archaeological ‘pulp fiction’ – has archaeology turned from science?)

“Offa’s Dyke (Welsh: Clawdd Offa) is a massive linear earthwork, roughly followed by some of the current borders between England and Wales. In places, it is up to 65 feet (19.8 m) wide (including its flanking ditch) and 8 feet (2.4 m) high. In the 8th century, it formed some delineation between the Anglia kingdom of Mercia and the Welsh kingdom of Powys.” (Archaeological ‘pulp fiction’ – has archaeology turned from science?)

Stukeley's Drawing showing the Roman road ON TOP of the Dyke showing it was pre-Roman - Archaeological 'pulp fiction' - has archaeology turned from science?
Stukeley’s Drawing showing the Roman road ON TOP of the Dyke showing it was pre-Roman – (Archaeological ‘pulp fiction’ – has archaeology turned from science?)

At face value, this seems to answer all the questions about dykes – except the water connection.

The current ‘traditional model’ for these features is split into two very unconvincing and easily disproven theories:

Defensive Feature – According to English Heritage, “Sometime during the 780s, Offa decided on the construction of a great earth wall and ditch, or dyke, running from ‘sea to sea’.  The work required thousands of men, and each section seems to have been built by people from a different district. The fact that this mammoth undertaking was achieved illustrates the cohesion of the kingdom at this time. The dyke was never garrisoned but would have been manned by relatively small local forces. Offa died in 796 in a battle against the Welsh. It is believed that he was trying to establish a final link in the dyke to the Irish Sea in the north.

The ditch only appears in the north of Wales (with two parallel ditches – not explained by any ‘experts’) and in the South.  There is a massive 30-mile gap in the middle which is denoted by the River Wye.  Consequently. If it was defensive, it had an enormous 30-mile flaw?

Boundary Marker – experts knowing the original ‘defensive identification’ have now fallen  back to support a ‘boundary marker’ theory of the same date – but why build a massive ditch just a few metres from the rest of the river Wye – especially, when you are using over 30% of the same river as the accepted boarder marker?? – it’s completely flawed logic, again to support the irrational traditional model and dating system, especially, when there is a much more rational and simple explanation (a canal)?

More information can be found about Dykes (canals) can be found on this website and on this video channel. (Archaeological ‘pulp fiction’ – has archaeology turned from science?)

The Lost Stone Circle

Following on from the ‘Bad Science’ at Craig Rhos-Y-Felin, Mike Parker-Pearson then went ‘public’ and announced that they found the site of bluestones that supported his hypothesis on Stonehenge being built in 2800 BCE – but there was a problem even with this only two carbon ‘nut case’ date. It was still 500 years too early, and so MPP came up with a ‘credible theory’ about the date differences – A Welsh prototype stone circle that was moved 500 years later.

Consequently, the search started for this mysterious ‘lost’ stone circle in Wales from 2013 (onward) to justify the 500-year gap in his dates. MPP has on several occasions, and he claimed to find this ‘mysterious site’, later to discover that it was nonsense (as he could not find his 3300 BCE date), and then they moved on to find another site.  Needless to say, this is again ‘Bad Science’ as you have prejudiced your methodology, as these other sites may have actually had a more significant impact on the knowledge of Prehistoric Britain and the Stonehenge builders if they were fully excavated and reported upon – rather than just ‘backfilled’ for a later or another excavator in the future, as you are more focused on proving yourself right. (Archaeological ‘pulp fiction’ – has archaeology turned from science?)

Archaeological 'pulp fiction' - has archaeology turned from science?
Waun Mawn – (Archaeological ‘pulp fiction’ – has archaeology turned from science?)

Therefore, the last hope of MPP’s reputation and his’ 10-year search’ fell upon Waun Mawn, culminating in the BBC documentary: “Stonehenge: The Lost Circle Revealed”, show on the 12th February 2021.  Once again of the 43 carbon dates obtained from this new discovery, only three random samples supports his theory and none of the human-made hearths which are Mesolithic (like Craig Rhos-Y-Felin) or late Neolithic. (Archaeological ‘pulp fiction’ – has archaeology turned from science?)

When they eventually found their target site Waun Mawn (after many claims that other sites were “the one we have been looking for” to eventually find that the carbon dating on these sites did not match the required date), they found just four bluestones, and so went on a stone hunt and found ten further stone HOLES! – This is clearly a sad attempt to fit a square peg into a round hole. The excavation was flawed as it only identified 14 possible stone locations and the remainder of the estimated 15 – 25 stones was a ‘guesstimation’ based on the known 14 holes – two of which had non-bluestone stones in situ.

Sadly, and not reported in the TV program, but within the Waun Mawn excavation report, there were not one OSL samples taken but 18, which gave results in the range of 6980+/- 2120 BCE to AD 1900 +/- 20. So, 17 dating sample did not verify MPP’s Hypothesis ONLY a single one which was dated 3530 +/- 330 (with that date range, the probability its 3300 BCE is slim!!). In fact, the OSL data in the review document suggested “removal of the stones” 2120 +/-520 BCE, long after Stonehenge phase I. (Archaeological ‘pulp fiction’ – has archaeology turned from science?)

The program never went in to any detail of the OTHER carbon dates found at Waun Mawn, which would allow a balanced scientific program enabling the viewer to decide whether MPP’s hypothesis was feasible? It dictated speculation as fact justified by a number of site workers and the presenter agreeing on MPP’s ideas, without question or qualification – this is commonly known as ‘propaganda’ and not scientific methodology.  Moreover, the REAL evidence CAN be found in the report and shows that the carbon dating evidence at Waun Mawn (the OSL data was excluded from the report except a small paragraph without all data!) shows that of the 43 samples taken:

1 – sample were of 9th Millennium BCE

3 – samples were of the 8th Millennium BCE

8 – samples were of the 7th Millennium BCE

4 – samples were of the 6th Millennium BCE

10 – samples were of the 5th Millennium BCE

6 – samples were of the 4th Millennium BCE

11- samples after 4th Millennium BCE up to 17 AD.

It seems that the BBC has produced a nice piece of archaeological propaganda that supports the current false ‘archaeological narrative’ of mythology and speculation, rather than tested and qualified scientific fact. This lack of ‘critical analysis’ is a clear indication of why the ‘science’ of archaeology has not progressed much over the last 50 years, even with modern technology, which it has incorporated to minimal success.

More information can be found about Waun Mawn can be found on this website and on this video channel. (Archaeological ‘pulp fiction’ – has archaeology turned from science?)

Conclusion

We have sadly seen this kind of censorship and banal attitude to knowledge and education before in pre-enlightenment Europe, with the dominance of the Christian church as a fundamental feature of the establishment

It is also a reminder of a world, just 350 years ago, that used ‘suppression’ to control the thoughts of the mass population against any kind of ‘original thought’ or ideas.  Galileo Galilei; (15 February 1564 – 8 January 1642), was an Italian physicist, mathematician, astronomer, and philosopher who played a major role in the Scientific Revolution. His achievements include improvements to the telescope and consequent astronomical observations and support for Copernicanism. Galileo has been called the “father of modern observational astronomy”, the “father of modern physics”, the “father of science”, and “the Father of Modern Science”. (Archaeological ‘pulp fiction’ – has archaeology turned from science?)

Galileo on Trial - Archaeological 'pulp fiction' - has archaeology turned from science?
Galileo on Trial – archaeological ‘pulp fiction’

Three hundred and fifty years ago, he was not a father to anything, and he was a ‘heretic’ as he believed that the earth went around the sun, contrary to the bible (a peer-reviewed book).  Galileo did not have the internet to promote his hypothesis, and the church had a complete monopoly over ideas and the print industry at that time.  Moreover, even after verification of his evidence and the acceptance of his theories, it still took another fifty years for the ‘Inquisition’s ban’ on printing Galileo’s works to be lifted in 1718 – when permission was finally granted to publish an edition of his works (it had to exclude the ‘condemned’ Dialogue’s) – the church finally lifted this partial ban in 1835, just 178 years ago and 193 years after his premature death.

This kind of institutional censorship still survives today but in a different form.  The print industry in the last century, through books, used to (and in some instances still do) publish ideas through ‘accredited’ authors only (Professors and some PhD’s, within the subject matter).  But this is not the censorship of ideology, and it is censorship through publishing editorial ignorance!

I was at a journalist workshop the other day at the Guardian Newspaper (one would imagine a safe liberal-minded audience); the science writer confessed that most of the new books and articles under review were written in such convoluted scientific language that most people, including the editors of scientific journals, had no idea if the content was true of false, so they had to rely on ‘peer review’ for its accuracy.  The problem with this system is that is fraught with significant concerns, as your peer may be either your competitor or rival.  The long-term effect of this ignorance is the stagnation and dismissal of new ideas (even if there is overwhelming evidence), just like we have seen with Galileo’s life. Not because he was wrong, but because if he is right – his (so-called) peers would be shown to be wrong and their credibility questioned. (Archaeological ‘pulp fiction’ – has archaeology turned from science?)

Archaeological 'pulp fiction' - has archaeology turned from science?
Academic Censorship in the 21st century – (Archaeological ‘pulp fiction’ – has archaeology turned from science?)

The church was brought down by science in what is termed the ‘enlightenment period’ where truth overcome ignorance.  Sadly, what we have seen since is the replacement of the church with academia, who use the same propaganda and discrediting tactics to maintain their cultural dominance. 

Science was revolutionary as it questioned authority and demanded qualified answers (speak truth to power) – but that methodology and philosophy is missing from academia today.  Universities do not teach knowledge to their students they instead teach conformity and censorship using exclusion as a weapon of choice. For if you dare questioning the so-called facts at University, you will fail to obtain the grades as punishment and consequently, the chances of any financially successful career in the future, forcing you to live a life of poverty and suppression. (Archaeological ‘pulp fiction’ – has archaeology turned from science?)

PodCast

Author’s Biography

Robert John Langdon, a polymathic luminary, emerges as a writer, historian, and eminent specialist in LiDAR Landscape Archaeology.

His intellectual voyage has interwoven with stints as an astute scrutineer for governmental realms and grand corporate bastions, a tapestry spanning British Telecommunications, Cable and Wireless, British Gas, and the esteemed University of London.

A decade hence, Robert’s transition into retirement unfurled a chapter of insatiable curiosity. This phase saw him immerse himself in Politics, Archaeology, Philosophy, and the enigmatic realm of Quantum Mechanics. His academic odyssey traversed the venerable corridors of knowledge hubs such as the Museum of London, University College London, Birkbeck College, The City Literature Institute, and Chichester University.

In the symphony of his life, Robert is a custodian of three progeny and a pair of cherished grandchildren. His sanctuary lies ensconced in the embrace of West Wales, where he inhabits an isolated cottage, its windows framing a vista of the boundless sea – a retreat from the scrutinous gaze of the Her Majesty’s Revenue and Customs, an amiable clandestinity in the lap of nature’s embrace.

Exploring Prehistoric Britain: A Journey Through Time

My blog delves into the fascinating mysteries of prehistoric Britain, challenging conventional narratives and offering fresh perspectives based on cutting-edge research, particularly using LiDAR technology. I invite you to explore some key areas of my research. For example, the Wansdyke, often cited as a defensive structure, is re-examined in light of new evidence. I’ve presented my findings in my blog post Wansdyke: A British Frontier Wall – ‘Debunked’, and a Wansdyke LiDAR Flyover video further visualizes my conclusions.

My work also often challenges established archaeological dogma. I argue that many sites, such as Hambledon Hill, commonly identified as Iron Age hillforts are not what they seem. My posts Lidar Investigation Hambledon Hill – NOT an ‘Iron Age Fort’ and Unmasking the “Iron Age Hillfort” Myth explore these ideas in detail and offer an alternative view. Similarly, sites like Cissbury Ring and White Sheet Camp, also receive a re-evaluation based on LiDAR analysis in my posts Lidar Investigation Cissbury Ring through time and Lidar Investigation White Sheet Camp, revealing fascinating insights into their true purpose. I have also examined South Cadbury Castle, often linked to the mythical Camelot56.

My research also extends to the topic of ancient water management, including the role of canals and other linear earthworks. I have discussed the true origins of Car Dyke in multiple posts including Car Dyke – ABC News PodCast and Lidar Investigation Car Dyke – North Section, suggesting a Mesolithic origin2357. I also explore the misidentification of Roman aqueducts, as seen in my posts on the Great Chesters (Roman) Aqueduct. My research has also been greatly informed by my post-glacial flooding hypothesis which has helped to inform the landscape transformations over time. I have discussed this hypothesis in several posts including AI now supports my Post-Glacial Flooding Hypothesis and Exploring Britain’s Flooded Past: A Personal Journey

Finally, my blog also investigates prehistoric burial practices, as seen in Prehistoric Burial Practices of Britain and explores the mystery of Pillow Mounds, often mistaken for medieval rabbit warrens, but with a potential link to Bronze Age cremation in my posts: Pillow Mounds: A Bronze Age Legacy of Cremation? and The Mystery of Pillow Mounds: Are They Really Medieval Rabbit Warrens?. My research also includes the astronomical insights of ancient sites, for example, in Rediscovering the Winter Solstice: The Original Winter Festival. I also review new information about the construction of Stonehenge in The Stonehenge Enigma.

Further Reading

For those interested in British Prehistory, visit www.prehistoric-britain.co.uk, a comprehensive resource featuring an extensive collection of archaeology articles, modern LiDAR investigations, and groundbreaking research. The site also includes insights and extracts from the acclaimed Robert John Langdon Trilogy, a series of books exploring Britain during the Prehistoric period. Titles in the trilogy include The Stonehenge Enigma, Dawn of the Lost Civilisation, and The Post Glacial Flooding Hypothesis, offering compelling evidence about ancient landscapes shaped by post-glacial flooding.

To further explore these topics, Robert John Langdon has developed a dedicated YouTube channel featuring over 100 video documentaries and investigations that complement the trilogy. Notable discoveries and studies showcased on the channel include 13 Things that Don’t Make Sense in History and the revelation of Silbury Avenue – The Lost Stone Avenue, a rediscovered prehistoric feature at Avebury, Wiltshire.

In addition to his main works, Langdon has released a series of shorter, accessible publications, ideal for readers delving into specific topics. These include:

For active discussions and updates on the trilogy’s findings and recent LiDAR investigations, join our vibrant community on Facebook. Engage with like-minded enthusiasts by leaving a message or contributing to debates in our Facebook Group.

Whether through the books, the website, or interactive videos, we aim to provide a deeper understanding of Britain’s fascinating prehistoric past. We encourage you to explore these resources and uncover the mysteries of ancient landscapes through the lens of modern archaeology.

For more information, including chapter extracts and related publications, visit the Robert John Langdon Author Page. Dive into works such as The Stonehenge Enigma or Dawn of the Lost Civilisation, and explore cutting-edge theories that challenge traditional historical narratives.

Other Blogs

s

t

Prehistoric Canals – Wansdyke

Promotional Video – Ancient Prehistoric Canals (Dykes) – Wansdyke

Chapter 1 – Dykes, Ditches and Earthworks

Start of Wansdyke East  -Prehistoric Canals - Wansdyke 2
Start of Wansdyke East – Prehistoric Canals – Wansdyke

The modern word dike or Dyke most likely derives from the Dutch word “dijk”, with the construction of dikes in the Netherlands well attested as early as the 12th century. The 126 kilometres (78 mi) long Westfriese Omringdijk was completed by 1250 and was formed by connecting existing older dikes. The Roman chronicler Tacitus even mentions that the rebellious Batavi pierced dikes to flood their land and protect their retreat (AD 70).  The word dijk initially indicated both the trench and the bank.– Wikipedia

If you study archaeology at university or even on an ordinance survey map at length, you will notice strange earthworks on the sides of hills of Britain, with no rational explanation as to why they are there and for what reason.  These features are mostly ignored at university, or an excuse is made for their construction.  The reality is that these features do not make any sense unless there are other factors in operation which have been ignored.

The first thing to notice is that the word ‘Dyke’ is associated with water.  It does seem strange you would call an earthwork on top of a hill a Dyke, unless there was some history passed down through the years to its actual use.  If we look at the most famous Dyke in Britain, ‘Offa’, we notice that it is attributed to a Saxon King and, therefore, could not be prehistoric.   Or is this a clear indication of how archaeologists find excuses for these features rather than factual, empirical evidence?

“Offa’s Dyke (Welsh: Clawdd Offa) is a massive linear earthwork, roughly followed by some of the current borders between England and Wales. In places, it is up to 65 feet (19.8 m) wide (including its flanking ditch) and 8 feet (2.4 m) in height.  In the 8th century, it formed some kind of delineation between the Anglian kingdom of Mercia and the Welsh kingdom of Powys.” – Wikipedia

At face value, this explanation seems to answer all the questions about Dykes (except the water connection).  But suppose you delve further down to look at the evidence, such as findings from the Dyke and any written history. In that case, you get a different version for the Roman historian Eutropius in his book, Historiae Romanae Breviarium, written around 369 AD, mentions the Wall of Severus, a structure built by Septimius Severus who was Roman Emperor between 193 AD and 211 AD:

He had his most recent war in Britain, and to fortify the conquered provinces with all security; he built a wall for 133 miles from sea to sea. He died at York, a reasonably old man, in the sixteenth year and third month of his reign.” – Eutropius (369 AD)

This ‘wall’ need not be made of stone as we know from their Scottish endeavours that the first structure as a defence was usually a bank and a ditch – just like a Dyke!!

The problem with this account is that none of the known Roman defences are 133 miles long – Harridan’s Wall is only 70 miles, so are they talking about Offa’s Dyke, which is much longer?

Chapter 2 – The Post-Glacial Flooding Hypothesis

Rise of Sea Levels - Prehistoric Canals - Wansdyke 2
Rise of Sea Levels – Prehistoric Canals – Wansdyke 2

Before we show you what these ‘Linear Earthworks‘ were used for in prehistoric times.  We need to give you an idea of how the environment was at the time of construction and why it is so different today.

In ‘The Post-Glacial Flooding Hypothesis,’ we looked at the new mathematical models that allowed us to calculate the amount of water released during and after the Last Glacial Maximum just over ten thousand years ago.

If the Dykes of Britain are canals (and not markers or defensive ditches), we must prove that the water table was higher in the past than today (otherwise, they would still be flooded).

The models contained in the PGFH showed us that a minimum of 8.42 quadrillion tonnes of water was released on the UK at the end of the last ice age.  This is equivalent to 98425.2 inches of rain falling on every square inch of Britain’s landmass or the same as – One Inch of rain steadily falling every day for the next 270 years

The worst known flooding in British history occurred in 1947 when just six inches of rain (149mm) fell on up to 12″ of snow (so a maximum of 15″ of rain if melted) over three months. The flooding, which inundated nearly all the main rivers in the South, Midlands, and the Northeast of England, was notable for its origins, geographical extent, and duration.

It impacted thirty out of the forty English counties over two weeks, when around 700,000 acres of land flooded. As a result, tens of thousands of people were temporarily displaced from their homes, and thousands of acres of crops were lost; and this was just 15 of the estimated equivalent of 98,425 inches of water that was shed on the British landscape after the last Ice Age. 

Raised Water Table

According to William Donn (Donn et al., 1962). The Fennoscandian and Great Britain ice sheet covered 4.7 106 km2, which is equivalent to: 

•          8.42 106 Gigatonnes of water / 4.7 106 km2, which gives     us 1.79 Gt per km2

•          1.79 Gt of water at a penetration rate of 43%, give us   0.77 Gt of water per km2

•          0.77 Gigatonnes of water by UK landmass 242,495 km² give us 186,804 Gt of groundwater

This water will be released at a rate of 1 – 12mm per annum and possibly at a depth of 75km. Therefore, to release groundwater at a depth of 75km at an average rate of 6mm per annum would take 12,500 years – not the 1,200 years previously believed, which is just the surface water from the last stages of the meltwater ice.

This is why rivers (like the Thames) still flow even after months of drought, as the groundwater is constantly leaking into the river, which was at its highest rate at the start of the Mesolithic, just after the great meltwater floods.

Sea-Level Changes

If this model is correct, we should be able to get verification via other empirical evidence, as shown in sea level water rises, to see if it has been constant over the last 12,500 years.

Most geologists and paleoclimatologists, when talking about the end of the last ice age, refer people to the phenomenon called the ‘Meltwater Pulse’ – which is the rapid rise in sea level (20m) between 13,500 and 14,700 years before present, over a 400 – 500 year period. Although it is a tremendous value, it should be recognised that this ‘pulse’ as only 16% of the total sea rise since the end of the last ice age.

Chapter 3 – Hydrology 101

Groundwater Sources - Prehistoric Canals - Wansdyke 2
Groundwater Sources – Prehistoric Canals – Wansdyke

When it comes to the use of ‘linear earthworks’ (we call ‘Dykes’), there is massive confusion amongst both professionals and amateur archaeologists about how such structures could function when they are dry today?

The incorrect perception of these ‘Dykes’ is either they are ‘rivers’ (like the Thames) that flow uphill or Victorian Canals with locks and wooden gates regulating the flow of the water – which are equally nonsensical as a prehistoric structures. Basic Hydrology that most people (should be but not necessarily ALL) learnt at school is that water is under the ground – not just a little water but 30% of all the fresh water on the planet.

This abundance of ‘groundwater’ is evident as it is the source of ALL rivers and supplies the Wells that have been dug since the beginning of time when rivers were absent. Even today, if you go into your garden and dig a hole, it will eventually fill with groundwater, whether in a valley or on top of a hill or mountain.

How and why water is on hills is very challenging for individuals as most people have a simplistic view of water being flat and sitting at ground level – but the earth is a far more complicated structure as this is the reason that it took centuries for people to recognise that we lived on a sphere and not a ‘flat-earth’ as such complex concepts such as gravity are hard to comprehend.

The reality is that ‘streams’ of water are encapsulated within the bedrock allowing ‘springs’ to start rivers at a great height as the groundwater is under pressure and erupts to the surface from BELOW and does not flow up or down the hill internally – but can flow downhill AFTER it escapes from the soil, because at the point of escape gravity then becomes the greater force overcoming the water pressure when within the bedrock – which stops it flowing down the landscape and can push it up to the top of hills and mountains.

Consequently, wells work even on hills as the groundwater is encapsulated in the bedrock and soil. The above illustration shows that if wells are dug halfway up a hill where there is a groundwater pocket, they will fill – if we join up these wells, the entire ditch will also fill with water – sourced from the ground.

The central aspect that must be remembered when considering the reasons behind the construction and maintenance of these earthworks (Dykes) is that the environment was so much different in the Mesolithic Period, which changed rapidly when entering the Neolithic and then even more changes in the Bronze and Iron Ages.

Once the ice sheets had melted and the climate began to warm, the landscape gradually changed from open tundra to dense woodland. By around 8000 BC, pine and birch dominated the woodland cover. These were slowly replaced by lime, elm and oak with some hazel. By 6500 BC, pine and birch woodland would only have been found on the thinner limestone soils of the uplands.

2025 Update – A Quantified Groundwater Decline Model for Stonehenge/Wansdyke/Avebury

Using Radiocarbon-Anchored Hydrological Markers from the Chalk Aquifer

Abstract

This paper presents a quantified model of post-glacial groundwater decline for the Stonehenge–Durrington–Wansdyke chalk block, expressed as groundwater height relative to the modern aquifer baseline.

The model integrates borehole stratigraphy, hydrologically constrained radiocarbon samples, and lateral aquifer continuity to produce a monotonic height–time curve from the early Mesolithic to the Bronze Age. Crucially, the radiocarbon samples used do not date human activity or construction phases, but instead function as groundwater elevation markers, constraining minimum or maximum water levels through time.

This approach resolves long-standing contradictions in the Stonehenge landscape chronology and supersedes interpretive models reliant on typology or isolated C14 dates.

1. Introduction: why groundwater, not monuments

Traditional Stonehenge chronologies rely on radiocarbon dates obtained from pits, artefacts, or infilled features and then interpreted as construction or usage phases. In hydrologically active chalk landscapes, this approach is fundamentally flawed: most dated material records post-formational infilling, not the conditions under which a feature was cut or a landscape functioned.

Instead, this study treats groundwater height as the primary controlling variable. In a laterally continuous chalk aquifer, groundwater level is a regional physical property that constrains what landscapes can exist, what features can function, and when construction is even possible.

The question addressed here is therefore not “when was Stonehenge built?” but:

When did groundwater fall below the elevations required for Stonehenge Bottom, Durrington palaeochannels, and Wansdyke to function as dry features?

2. Methodological principles

2.1 Aquifer continuity

The Upper Chalk beneath Stonehenge, Durrington Walls, and Wansdyke forms a single hydraulically continuous unit. Large-scale groundwater changes are therefore regional, not local. A groundwater level reconstructed at one site applies across the chalk block, adjusted only for topography.

2.2 What radiocarbon dates can and cannot do

Radiocarbon dates are not used here as construction dates. Instead, they are used only where they satisfy all three of the following criteria:

  1. In-situ organic material (preferably plant macrofossils)
  2. Hydrologically controlled context (palaeochannel base, waterlogged organic horizon, peat lens)
  3. Known or stated elevation (OD)

Such samples provide minimum groundwater heights at known times. Samples that fail these criteria (bulk humic sediments, disturbed fills, rootlet-contaminated samples) are explicitly excluded.

3. Data sources

3.1 Borehole stratigraphy (Stonehenge & surrounds)

Borehole logs beneath Stonehenge Bottom and adjacent areas record:

  • Water-derived sediments
  • Solution voids
  • Shell-bearing horizons
  • Prolonged saturation indicators

These demonstrate sustained groundwater levels significantly above modern values during the early Holocene, forming the physical basis of the model.

3.2 Radiocarbon samples used as groundwater markers

The following samples are extracted from the English Heritage Radiocarbon Database and associated ALSF projects. They are not Stonehenge construction dates, but hydrological constraints.

SUERC-10037

  • Date: 8445 ± 40 BP (≈ 7550–7500 cal BC)
  • Material: Waterlogged sediment (humic acid fraction)
  • Context: Gravel-bottomed palaeochannel with organic infill
  • Elevation: +49.55 m OD
  • Interpretation: Early Mesolithic wet ground with persistent saturation

    09d789aa-9fd6-4816-8220-5ac1e62…

SUERC-10038

  • Date: 8575 ± 35 BP (≈ 7600–7580 cal BC)
  • Material: Waterlogged sediment (humin fraction)
  • Context: Same sealed palaeochannel horizon as SUERC-10037
  • Elevation: +49.55 m OD
  • Notes: Minimal reservoir effect; consistent with pollen evidence

    09d789aa-9fd6-4816-8220-5ac1e62…

OxA-15972

  • Date: 7300 ± 40 BP (≈ 6240–6060 cal BC)
  • Material: Waterlogged sediment
  • Context: Palaeochannel infill
  • Interpretation: Channel already inactive; date reflects groundwater fall below channel base

    09d789aa-9fd6-4816-8220-5ac1e62…

OxA-15931

  • Date: 4334 ± 30 BP (≈ 2550–2290 cal BC)
  • Material: Waterlogged sediment (bulk sample)
  • Context: Early infilling after palaeochannel abandonment
  • Interpretation: Minimum age for sustained groundwater decline

    09d789aa-9fd6-4816-8220-5ac1e62…

OxA-15886 (preferred material)

  • Date: 3410 ± 60 BP (≈ 1890–1530 cal BC)
  • Material: Waterlogged plant macrofossil (monocot fragments)
  • Context: Sealed palaeochannel base
  • Significance: Highest-quality hydrological marker in the dataset

    09d789aa-9fd6-4816-8220-5ac1e62…

4. Construction of the H(t) groundwater curve

Groundwater height is expressed relative to today’s mean groundwater level, which already incorporates seasonal variability. This removes the need for uncertainty envelopes and isolates the long-term signal.

The curve is anchored by:

  • A calculated groundwater height of +22.6 m above modern at ~10,300 BP, derived from the linked Stonehenge–Wansdyke hydrological solution
  • Radiocarbon-anchored minimum groundwater levels at successive times

The resulting curve shows:

  • Rapid drawdown during the early Holocene
  • A long, shallow decline through the Mesolithic and Neolithic
  • Final stabilisation near modern levels in the Bronze Age

This curve is monotonic and physically constrained.

5. Results and implications

5.1 Stonehenge Bottom

At groundwater levels ≥ +10 m above modern, Stonehenge Bottom cannot function as a dry landscape. Borehole evidence, molluscs, pollen, and palaeochannels are all consistent with this state during the Mesolithic.

5.2 Durrington Walls

Palaeochannels dated using infill material record the decline of groundwater, not monument construction. When correctly interpreted, these dates support prolonged wet conditions rather than late dryland activity.

5.3 Wansdyke

The groundwater differential observed at Wansdyke is consistent with the same regional water table reconstructed at Stonehenge, reinforcing aquifer continuity and validating the linked model.

6. Why this supersedes traditional models

This approach differs fundamentally from conventional archaeology:

Traditional modelGroundwater model

Isolated C14 dates

Integrated hydrological curve

Interpretive phases

Physically constrained thresholds

Typology-driven

Mathematics-driven

Site-specific

Regionally continuous

Once groundwater height is constrained, many archaeological interpretations become physically impossible, regardless of cultural preference.

7. Conclusion

By treating radiocarbon samples as hydrological markers rather than construction dates, and by anchoring them to a laterally continuous chalk aquifer, it is possible to construct a robust, testable groundwater height–time curve for the Stonehenge landscape.

This model explains:

  • Borehole evidence
  • Molluscan and pollen preservation
  • Palaeochannel persistence
  • Chronological inconsistencies in monument interpretation

The burden of proof now lies not in reinterpretation, but in producing contradictory groundwater mathematics.

Until that is done, the dry-chalk Neolithic model for Stonehenge is not debated — it is superseded.

Case Study Wansdyke – Morgan’s Hill West

The steepest aspect of Wansdyke is the rise over Morgan’s Hill, which is an incline from 182m OD to 252m OD.

Figure 34 - Morgan Hill West (Wansdyke)  - Prehistoric Canals - Wansdyke 2
Figure 34 – Morgan Hill West (Wansdyke) – Prehistoric Canals – Wansdyke 2

If we are correct with our assumption, we need to show that you can transverse this massive incline using natural springs and basic wooden weirs.  If we split the gradient into four parts, we can see better the profile and problems our ancestors faced.

Prehistoric Canals - Wansdyke 2
Figure 35 Morgan’s Hill West in Sections – Prehistoric Canals – Wansdyke

Section A – 0 to 300 downhill

Length is 300m, and the inclination lowers from 251m OD to 242m OD at a ratio of 3% or 1:33 – If we accept that within this section, we had four cat A ‘springs’ that would release 11.2 cu. metres of water PER SECOND (11,200 litres per second) would fill a 10m ditch that is 1.5 deep by one-metre width of the Dyke’s ditch every SECOND.

According to the mathematical formula (v = k * C * R0.63 * S0.54 ), water at the end of section A would be travelling at 5 MPH – the speed of the Thames at Henley (so quite navigable) and, therefore, no need for any Weirs to reduce the water flow.

Section B – 300 to 800m downhill

This section would receive water at one metre per second from Section A, travelling at 5 MPH – The length of this section is 500m in length, and the inclination lowers from 242m OD to 200m at a ratio of 8% or 1:12 this would accelerate the water to 15 mph which is too fast the navigate uphill. Therefore, a series of weirs would have been placed either under the water or, as the early Victorians achieved, by a paddle weir or both.

An underwater weir (blocking 50% of the water but allowing boats to move over the top without hindrance) would reduce the flow by 50% – so if placed at the End of Section A (at 5 MPH) would reduce the water flow to 2.5 MPH and down to 12.5 MPH at the End of Section B. Consequently, if we place one of these 50% reduction weirs at 100m intervals the water flow would not go over the 5-mph mark and would probably be in the region of 3 – 5 MPH which again is easily navigable.

Chapter 4 – Wansdyke

Wansdyke v Avon and Kennet Canal  - Prehistoric Canals - Wansdyke 2
Wansdyke v Avon and Kennet Canal – Prehistoric Canals – Wansdyke

According to Wikipedia, “Wansdyke consists of two sections of 14 and 19 kilometres (9 and 12 mi) long with some gaps in between. East Wansdyke is an impressive linear earthwork, consisting of a ditch and bank running approximately east-west, between Savernake Forest and Morgan’s Hill. West Wansdyke is also a linear earthwork, running from Monkton Combe south of Bath to Maes Knoll south of Bristol, but less impressive than its eastern counterpart. The middle section, 22 kilometres (14 mi) long, is sometimes referred to as ‘Mid Wansdyke’ but is formed by the remains of the London to Bath Roman road. It used to be thought that these sections were all part of one continuous undertaking, especially during the Middle Ages when the pagan name Wansdyke was applied to all three parts.

East Wansdyke in Wiltshire, on the south of the Marlborough Downs, has been less disturbed by later agriculture and building and remains more clearly traceable on the ground than the western part. Here the bank is up to 4 m (13 ft) high with a ditch up to 2.5 m (8.2 ft) deep. Wansdyke’s origins are unclear, but archaeological data shows that the eastern part was probably built during the 5th or 6th century. That is after the withdrawal of the Romans and before the takeover by Anglo-Saxons. The ditch is on the north side, so presumably it was used by the British as a defence against West Saxons encroaching from the upper Thames Valley westward into what is now the West Country.

West Wansdyke, although the antiquarians like John Collinson considered West Wansdyke to stretch from south East of Bath to the west of Maes Knoll, a review in 1960 considered that there was no evidence of its existence to the west of Maes Knoll.   Keith Gardner refuted this with newly discovered documentary evidence.  In 2007 a series of sections were dug across the earthwork which showed that it had existed where there are no longer visible surface remains.

It was shown that the earthwork had a consistent design, with stone or timber revetment. There was little dating evidence, but it was consistent with either a late Roman or post-Roman date. A paper in “The Last of the Britons” conference in 2007 suggests that the West Wansdyke continues from Maes Knoll to the hill forts above the Avon Gorge and controls the crossings of the river at Saltford and Bristol as well as at Bath.

As there is little archaeological evidence to date the western Wansdyke, it may have marked a division between British Celtic kingdoms or have been a boundary with the Saxons. The evidence for its western extension is earthworks along the north side of Dundry Hill, its mention in a charter and a road name.

Sections covered in the Book - Prehistoric Canals - Wansdyke 2
Sections covered in the Book – Prehistoric Canals – Wansdyke

Section 1

HE:1003784 Wansdyke: section 610yds (560m) NW of Wernham Farm to 250yds (230m) SW of New Buildings (560m = 1680 working days – 20 men taking 84 days to complete)

Figure 44 Wansdyke NW of Wernham (with added water levels)  - Prehistoric Canals - Wansdyke 2
Figure 44 Wansdyke NW of Wernham (with added water levels) – Prehistoric Canals – Wansdyke


No, HE Historic Details or Excavations Registered

OS Map

1800 OS Map -Prehistoric Canals - Wansdyke 2
Prehistoric Canals – Wansdyke

1800 OS Map

OS Map -Prehistoric Canals - Wansdyke 2
Prehistoric Canals – Wansdyke

LiDAR Map

LiDAR Map -Prehistoric Canals - Wansdyke 2
Prehistoric Canals – Wansdyke

LiDAR (with Mesolithic water levels)

Prehistoric Canals - Wansdyke 2
Prehistoric Canals – Wansdyke

A feature called ‘firs’ is a gap on the OS Map – there is a strange quarry pit (no relevant substances under the surface to quarry?) – this pit is two metres deep and probably built later to the original ditch.


Are we looking for a hole to find the groundwater to keep the canal working with fresh water? As we will discover, this is not the first pit cut deep on the line of Wansdyke.


The Mesolithic water levels certainly explain the strange start of Wansdyke and the unexplained gaps (if it’s not a canal) in the Dyke.


Notice on the LiDAR maps the extensive ‘pits’ surrounding the Dyke, which are not below the Mesolithic river shoreline and are 14m in diameter.

Figure 45 - Quarry pits found in Paleochannels  - Prehistoric Canals - Wansdyke 2
Figure 45 – Quarry pits found in Paleochannels – Prehistoric Canals – Wansdyke

These features seem to be connected to even larger quarry holes (some under the Mesolithic shoreline), indicating that minerals have been extracted here for thousands of years and may be the reason for the Dykes construction to take minerals away – as have also found these pits in other mineral-rich areas of Britain such as Hadrian’s Wall.


Durrington Walls


The pits are about 20m in diameter and up to 5m deep, as revealed by further geophysical surveys using ground-penetrating radar and mechanical coring around Durrington Walls. Small quantities of struck flint, shell, and animal bone have been recovered from them, with the bone providing radiocarbon dates from about 2500 BC to 1200 BC.

Prehistoric Canals - Wansdyke 2
Prehistoric Canals – Wansdyke

What we see is that this type of quarrying was commonplace in the past and has confused archaeologists – but as this was a trading nation, the solution is evident and straightforward. 


Gap in the Dyke route

At the end of Section 1, we find the first gap (if you exclude the massive gap at the start of the Dyke) – this gap appears as the Dyke dips into a paleochannel. The obvious conclusion for the break in Wansdyke is that it must have been full of water at the construction time.

Prehistoric Canals - Wansdyke 2
Prehistoric Canals – Wansdyke
Figure 46 - Mesolithic Water levels show gap disappears - Prehistoric Canals - Wansdyke 2
Figure 46 – Mesolithic Water levels show gap disappears – Prehistoric Canals – Wansdyke
Ancient Prehistoric Canals - Wansdyke (The Book) -Prehistoric Canals - Wansdyke 2
Ancient Prehistoric Canals – Wansdyke (The Book) – Prehistoric Canals – Wansdyke 2

This was an extracts from the NEW Book Ancient Prehistoric Canals (Dykes) – Wansdyke available on Amazon as a FULL COLOUR HARD BACK (£19.95) or a ECONOMY (£4.99) SOFTBACK black and white VERSION – it is also available as a KINDLE (£1.99) book. For further information about our work on Prehistoric Britain visit our WEBSITE or VIDEO CHANNEL.

Book Details

  • ASIN ‏ : ‎ B0BF31GQKC
  • Publisher ‏ : ‎ Independently published (18 Sept. 2022)
  • Language ‏ : ‎ English
  • Hardcover ‏ : ‎ 134 pages
  • ISBN-13 ‏ : ‎ 979-8353488897
  • Dimensions ‏ : ‎ 15.24 x 1.3 x 22.86 cm
  • Illustrations: 85
  • Customer reviews: 5.0 out of 5 stars    1 rating

Podcast

Author’s Biography

Robert John Langdon, a polymathic luminary, emerges as a writer, historian, and eminent specialist in LiDAR Landscape Archaeology.

His intellectual voyage has interwoven with stints as an astute scrutineer for governmental realms and grand corporate bastions, a tapestry spanning British Telecommunications, Cable and Wireless, British Gas, and the esteemed University of London.

A decade hence, Robert’s transition into retirement unfurled a chapter of insatiable curiosity. This phase saw him immerse himself in Politics, Archaeology, Philosophy, and the enigmatic realm of Quantum Mechanics. His academic odyssey traversed the venerable corridors of knowledge hubs such as the Museum of London, University College London, Birkbeck College, The City Literature Institute, and Chichester University.

In the symphony of his life, Robert is a custodian of three progeny and a pair of cherished grandchildren. His sanctuary lies ensconced in the embrace of West Wales, where he inhabits an isolated cottage, its windows framing a vista of the boundless sea – a retreat from the scrutinous gaze of the Her Majesty’s Revenue and Customs, an amiable clandestinity in the lap of nature’s embrace.

Exploring Prehistoric Britain: A Journey Through Time

My blog delves into the fascinating mysteries of prehistoric Britain, challenging conventional narratives and offering fresh perspectives based on cutting-edge research, particularly using LiDAR technology. I invite you to explore some key areas of my research. For example, the Wansdyke, often cited as a defensive structure, is re-examined in light of new evidence. I’ve presented my findings in my blog post Wansdyke: A British Frontier Wall – ‘Debunked’, and a Wansdyke LiDAR Flyover video further visualizes my conclusions.

My work also often challenges established archaeological dogma. I argue that many sites, such as Hambledon Hill, commonly identified as Iron Age hillforts are not what they seem. My posts Lidar Investigation Hambledon Hill – NOT an ‘Iron Age Fort’ and Unmasking the “Iron Age Hillfort” Myth explore these ideas in detail and offer an alternative view. Similarly, sites like Cissbury Ring and White Sheet Camp, also receive a re-evaluation based on LiDAR analysis in my posts Lidar Investigation Cissbury Ring through time and Lidar Investigation White Sheet Camp, revealing fascinating insights into their true purpose. I have also examined South Cadbury Castle, often linked to the mythical Camelot56.

My research also extends to the topic of ancient water management, including the role of canals and other linear earthworks. I have discussed the true origins of Car Dyke in multiple posts including Car Dyke – ABC News PodCast and Lidar Investigation Car Dyke – North Section, suggesting a Mesolithic origin2357. I also explore the misidentification of Roman aqueducts, as seen in my posts on the Great Chesters (Roman) Aqueduct. My research has also been greatly informed by my post-glacial flooding hypothesis which has helped to inform the landscape transformations over time. I have discussed this hypothesis in several posts including AI now supports my Post-Glacial Flooding Hypothesis and Exploring Britain’s Flooded Past: A Personal Journey

Finally, my blog also investigates prehistoric burial practices, as seen in Prehistoric Burial Practices of Britain and explores the mystery of Pillow Mounds, often mistaken for medieval rabbit warrens, but with a potential link to Bronze Age cremation in my posts: Pillow Mounds: A Bronze Age Legacy of Cremation? and The Mystery of Pillow Mounds: Are They Really Medieval Rabbit Warrens?. My research also includes the astronomical insights of ancient sites, for example, in Rediscovering the Winter Solstice: The Original Winter Festival. I also review new information about the construction of Stonehenge in The Stonehenge Enigma.

Further Reading

For those interested in British Prehistory, visit www.prehistoric-britain.co.uk, a comprehensive resource featuring an extensive collection of archaeology articles, modern LiDAR investigations, and groundbreaking research. The site also includes insights and extracts from the acclaimed Robert John Langdon Trilogy, a series of books exploring Britain during the Prehistoric period. Titles in the trilogy include The Stonehenge Enigma, Dawn of the Lost Civilisation, and The Post Glacial Flooding Hypothesis, offering compelling evidence about ancient landscapes shaped by post-glacial flooding.

To further explore these topics, Robert John Langdon has developed a dedicated YouTube channel featuring over 100 video documentaries and investigations that complement the trilogy. Notable discoveries and studies showcased on the channel include 13 Things that Don’t Make Sense in History and the revelation of Silbury Avenue – The Lost Stone Avenue, a rediscovered prehistoric feature at Avebury, Wiltshire.

In addition to his main works, Langdon has released a series of shorter, accessible publications, ideal for readers delving into specific topics. These include:

For active discussions and updates on the trilogy’s findings and recent LiDAR investigations, join our vibrant community on Facebook. Engage with like-minded enthusiasts by leaving a message or contributing to debates in our Facebook Group.

Whether through the books, the website, or interactive videos, we aim to provide a deeper understanding of Britain’s fascinating prehistoric past. We encourage you to explore these resources and uncover the mysteries of ancient landscapes through the lens of modern archaeology.

For more information, including chapter extracts and related publications, visit the Robert John Langdon Author Page. Dive into works such as The Stonehenge Enigma or Dawn of the Lost Civilisation, and explore cutting-edge theories that challenge traditional historical narratives.

Other Blogs

s

t

Rivers of the Past Were Higher: A Fresh Perspective on Prehistoric Hydrology

Introduction

A Revolutionary Perspective on Archaeology and Hydrology

Fifteen years ago, I introduced an idea that some might consider revolutionary—an insight born from my archaeological investigations. A clear pattern emerged through the detailed graphical analysis of 50 sites around Stonehenge and its surrounding barrows: these locations consistently occupied elevated positions within the upper 30th percentile of the landscape. (The Rivers of the Past were Higher)

The Rivers of the Past were Higher – an idiot’s guide
The Raised Waters of the River Avon brought first the Bluestones from Wales to Stonehenge and then the Sarsens from nr Avebury – (The Rivers of the Past were Higher)

This observation was more than coincidental. It pointed to a critical hydrological phenomenon: rivers during the post-glacial period were far more expansive than today. Surprisingly, this idea had not been explored within archaeological circles. I embarked on years of meticulous research to address this gap, culminating in a 50,000-word thesis titled “The Post-Glacial Flooding Hypothesis.” The thesis, supported by 125 peer-reviewed references, explored the interplay between mathematics, hydrology, and archaeology to propose a groundbreaking hypothesis: the elevated placement of ancient sites correlates with the past’s larger, more powerful rivers.

By analyzing major rivers, including the Thames and the Avon, I demonstrated that these waterways were shaped by the glacial meltwaters of the last ice age, and their ongoing diminution reflects millennia of hydrological evolution. This thesis challenged traditional archaeological assumptions about ancient landscapes and human settlement patterns. (The Rivers of the Past were Higher)

Britain's Flooded Past
Stonehenge Bottom was once part of the Avon – (The Rivers of the Past were Higher)

The Challenge of Being Heard

Despite publishing over 250 essays, producing over 100 videos, and fostering discussion among 5,000+ community members, I still encounter the same basic misconceptions and questions. Many of these queries could be answered with a brief engagement with the material—something even a curious six-year-old might accomplish if they took the time to delve beyond the surface.

This blog addresses the ten most common questions sceptics and enthusiasts pose. For those who have already grasped the fundamentals, feel free to move on. But I invite you to engage with the answers below for those who remain perplexed or unconvinced. Let’s unravel the science, revisit the evidence, and explore the transformative role of hydrology in reshaping our understanding of ancient human landscapes. (The Rivers of the Past were Higher)

Empirical Proof of Higher Waters in the Past

The “Post-Glacial Flooding Hypothesis,” proposed by Robert John Langdon, suggests that rivers in Britain and Europe were significantly larger after the last Ice Age due to higher water. This hypothesis posits that the landscape remained flooded for thousands of years after the ice caps melted, with water persisting in enlarged rivers. The sources highlight several lines of empirical evidence that are interpreted to support this assertion, drawing on geological, hydrological, and archaeological data.

One key piece of evidence cited is the steady rise in sea levels over the last ten thousand years, proving that water continued to occupy the land as enlarged rivers after the ice caps melted. Beyond this general trend, studies focusing on river activity provide more direct support. A scientific paper by Lewis & Macklin (2003) indicates that rivers in Britain experienced over 100 flooding events in the last ten thousand years, some of which lasted for hundreds of years. Another review of radiocarbon-dated fluvial deposits in the UK suggests up to twenty flooding episodes in lowland rivers between 11,190 and 390 cal B.P.20. These numerous flood events are presented as evidence of a significantly higher water table in the past.

Britain's Flooded Past
Flloding of sites like Avebury as shown on BGS maps – (The Rivers of the Past were Higher)

Geological formations such as peat deposits are also considered empirical evidence. Peat forms in wet, marshy ground, and its presence and dating are proof of the extent of the Post-Glacial Flooding and the timing of these episodes. Peat growth is shown to have peaked about 4000 years after the Last Glacial Maximum (LGM), which is interpreted as indicating that rivers remained high and flowing until the Neolithic Period. Modern peatlands are even described as old river beds.

 (The Rivers of the Past were Higher)eat coverage due to flooding
The reason we have more Peat than most countries is that we had more bogland in the past due to the raised river levels – (The Rivers of the Past were Higher)

River terraces, remnants of former floodplains, offer further geological insights. The sources note that in the Avon Valley, the terraces between T7 and T10 consist of river silt. Optical Stimulated Luminescence (OSL) dating indicates they are “out of sequence” compared to the traditional geological model. This chronological discrepancy is suspected to result from the numerous flooding events during the Holocene, which would have affected and redeposited sediments on older terraces. Recent OSL dating research in the Avon Valley supports the deposition of T10-7 during or before MIS10/9 (including the LGM).

Avon Terrances
River Avon Flood Terrances accepted by Geologists – (The Rivers of the Past were Higher)

Analysis of the scale of past river systems provides quantitative evidence. Based on sedimentary data and borehole samples, a case study on the Thames River concluded that its current average discharge rate was potentially increased by 3723% during the Mesolithic and Neolithic periods, reaching a peak discharge of 2450 m³/s. This rate was comparable to smaller North American rivers during the same epoch. Similarly, the Mississippi River’s discharge is noted to have increased from its present rate of 16,790 m³/s to a considerable 160,000 m³/s just after the LGM, an 853% rise indicative of significant augmentation in river height and discharge. Globally, river volumes and heights are estimated to have been, on average, around 941% greater towards the end of the last ice age due to extra water washed down existing terrestrial rivers. Evidence from river terraces, sediment deposits, and paleohydrology supports the idea that rivers were more extensive in the post-glacial period, with major rivers like the Thames and Severn having broader and more dynamic channels.

 (The Rivers of the Past were Higher)
Thames is on a flood plain that was active in the Mesolithic period – (The Rivers of the Past were Higher)

Archaeological sites and features are also interpreted as providing empirical evidence for past higher water levels. The strategic positioning of many prehistoric settlements on higher ground is seen as aligning with the edges of floodplains or higher terraces that would have offered safety from the elevated river levels. The history of sites like Old Sarum is presented as evidence of fluctuating water levels, thriving for approximately 5,000 years (or 4,000) and showing the impact of environmental changes, with its initial abundance of water supporting the notion of much higher levels in prehistoric times. The fact that the Norman well at Old Sarum is now dry is proof of changes in groundwater levels over time. Excavations at Old Sarum also revealed a raised platform and pathway through the outer bank, suggesting the site was accessed by boats on a higher water table during the Neolithic period. Further excavation evidence from the Avebury ditch in 1914, which had to be stopped due to groundwater flooding it and turning it into a moat, is considered a “smoking gun” proving that higher river levels indicated in geological maps would have flooded the ditch. Similarly, an excavation at Hornchurch Marsh, on the edge of the British Geological Survey (BGS) superficial Alluvium flood map, revealed radiocarbon-dated evidence of inundation during the early Holocene, supporting the model of past higher river levels and periodic flooding.

Old Saum
The Wells of Old Sarum are below the Ditch level – so they must have been flooded (moat)

Linear earthworks, commonly known as dykes, are another category of archaeological features offering potential evidence. While traditionally interpreted as boundaries or defensive structures, emerging evidence suggests they may have functioned as prehistoric canals designed for water management and transport within a water-rich landscape. Research indicates that these earthworks can significantly hold and manage water, impacting hydrological connectivity and promoting localized water retention.. An analysis using AI is mentioned, concluding that 8 out of the 10 longest dykes in Britain show empirical evidence of water retainment. Specifically, Wansdyke is noted to incorporate earthworks with right-angled ditches that resemble Roman cross-regulators used for water management, seen at sites like Rybury Camp and Tan Hill. The discrepancy in ditch dimensions between East and West Wansdyke suggests sequential construction linked to changing water levels. Gaps in dykes like Wansdyke and Offa’s Dyke are interpreted as points where ancient, higher rivers coursed through, necessitating a break in the earthwork or requiring boat travel. Excavations by Pitt Rivers are said to reveal that water once flowed through the ditches of Wansdyke. Even Roman structures like Hadrian’s Wall and the Vallum are interpreted as providing evidence; their disappearance for stretches where the landscape would have been flooded by rivers 8m higher than today suggests the structures were routed around these bodies of water, indicating a higher water table even during the Roman period. LiDAR analysis is used to show how structures like henges and potential canals align with past river shorelines or paleochannels associated with higher water levels.

(Britain's Giant Prehistoric Waterways)
The Vallum at Hadrian’s Wall still retains its water – (The Rivers of the Past were Higher)

In conclusion, the body of empirical evidence drawn from geological features like peat and river terraces, hydrological data indicating increased river discharge rates, and the characteristics and placement of archaeological sites and linear earthworks (dykes), which are interpreted as supporting the hypothesis of significantly raised river levels in Britain and potentially wider Europe during the Mesolithic and Neolithic periods and extending into later epochs. This perspective challenges traditional archaeological interpretations and suggests a need for re-evaluating ancient landscapes in light of past hydrological conditions. While acknowledging that scientific evidence is always open to reinterpretation, the proponents argue that the collected evidence provides compelling support for this view.

Case Study: Dykes Follow Water: The 68.6% Aquifer Overlap Nobody’s Talking About

Across Britain, prehistoric dykes have long been dismissed as little more than defensive ramparts or mystical boundary markers. But what if we’ve been looking at them through the wrong lens entirely? A new GIS-based study we conducted earlier this year, integrating official British Geological Survey aquifer maps with the known alignments of ancient linear earthworks, reveals something astonishing: 68.6% of dyke segments intersect directly with mapped aquifer zones. That’s not a loose correlation — that’s a direct, measurable pattern that begs for re-evaluation.

Aquafer showing heights of 256m

This level of overlap seriously undermines the tired narratives of ritual and fortification. Instead, it points to a far more practical purpose — one rooted in hydrology, not mysticism. These dykes, including major features like Offa’s Dyke and Wansdyke, may have been strategically aligned along natural underground water fractures or aquifer boundaries. In this light, their purpose shifts dramatically: from symbolic markers to functioning elements of a water-based transport or irrigation system. Seasonal canal usage, trade facilitation, or even simple water management may have played a central role in their placement.

Aquafers showing at a height of 370m

Overlaying hydrogeological data on ancient dyke networks reveals geometric precision that’s impossible to ignore. These earthworks don’t meander aimlessly — they often shadow aquifer flows, spring lines, and fracture zones. Whether this was achieved through environmental observation, empirical trial and error, or even primitive water divining, it’s clear that prehistoric builders had a working knowledge of what lay beneath their feet. The alignment with hydrological structures is too deliberate to be accidental.

Aquafers showing at a height of 490m

It’s time to abandon the chalky clichés of ritualistic ditches and Saxon scare-lines. This isn’t about spiritual symbolism or defensive paranoia — it’s about engineering, observation, and control of a life-sustaining resource: water. The idea that prehistoric Britons built with such hydrological insight isn’t fantastical — it’s the most logical interpretation of the data. If we start following the water, we might finally start understanding what the dykes were really for.

Case Study: Piercebridge Roman Bridge & the Ancient Tees – A Post-Glacial Perspective

Rivers of the past were higher
(The Rivers of the Past were Higher)

Ever wondered why the Roman bridge at Piercebridge is stranded in a field, far from today’s riverbank?

The answer lies in one of the clearest pieces of physical evidence supporting the Post-Glacial Hypothesis — that Britain’s ancient rivers were not briefly swollen by seasonal flooding but remained massively elevated for thousands of years due to glacial melt, lack of drainage, and a saturated prehistoric climate.

🧱 Roman Engineering Reveals Ancient Water Levels

  • Bridge foundations: 58m OD (Ordnance Datum)
  • Original bridge deck: likely 6–10m above this = ~64–68m OD
  • Standard Roman river clearance: 2–3m ➜ River level: ~61–65m OD

Today, the Tees flows at just ~55m OD, meaning a drop of 6–10m since the Roman era.

But that’s just the start.

Rivers of the past were higher
(The Rivers of the Past were Higher)

🕰️ Rolling Back Time to the Mesolithic (~8000–4000 BC)

With:

  • No flood defences
  • Heavy glacial runoff
  • Slow-draining forested valleys

A conservative model of ~5m drop every 2000 years means the Tees in the Mesolithic likely flowed at ~70–75m OD — up to 20m higher than today.

Piercebridge
LiDAR Map of the River and the Position of the Bridge – (The Rivers of the Past were Higher)

💡 What It All Proves

This isn’t just a minor fluctuation.

It’s geological proof that prehistoric rivers were immense — wide, high, and capable of supporting boat-based transport across much of Britain. That changes how we interpret:

  • “Hillforts” (which may have been river-edge settlements)
  • Prehistoric trade and transport networks
  • Sites like Stonehenge, where the River Avon (currently at 68m OD) was likely much higher — supporting the theory of bluestone delivery by boat

Piercebridge is no anomaly — it’s a smoking gun.

Case Study – The Thames

The Lower Thames sequence has been thoroughly studied not only because it is one of the largest river systems in the country but also because of its fortuitous exposure in many of the quarries and recent development programmes in and around London. The Thames was diverted into its current valley during the Anglian period where it proceeded to lay down extensive gravel deposits before reaching the sea. Archaeological interest in the Thames alluvial deposits and the raised beaches of the south-east coast is also due to the presence of significant Lower, and Middle Palaeolithic artefacts and hominin remains within these deposits.

The depositional chronology of the Thames gravel terraces has yet to be universally accepted, and the two significant sequences have been proposed by Gibbard (1985) and Bridgland (1994).  This is because the terraces are dated by the artefacts found within them which are archaeologically dated and not carbon dated.  The problem with this method is that if the area flooded after the original deposits were laid down, the artefacts could have been washed down from upstream and embedded at random.

(The Thames through time)
Traditional View of the Thames River terraces
(The Thames through time)

The modern floodplain of the Lower Thames, downstream of central London, is bounded either by older Pleistocene sands or gravels at the higher levels or by bedrock. The depositional chronology of the Thames gravel terraces has yet to be universally accepted, and the two significant sequences have been proposed by (Gibbard, 1985).

The SBAB model of floodplain evolution proposes that during the early Holocene multi-channel braided systems stabilised with the narrowing and deepening of some channels, and the progressive abandonment of others over the course of the Holocene (Brown et al. 1994).

The Lower Thames saw a rise of about 15m in relative sea level between c. 10,000, and c. 6000 BP (Rackham and Sidell, 2000; Sidell 2003b). This would have had a significant effect upon settlement of the outer and mid estuary floodplain. It has been suggested, for example, that settlement areas along the river margin progressively moved to higher ground as the land below was overtaken by the rising water levels (Rackham and Sidell 2000).

During the early Holocene, the Lower Thames floodplain was a complex environment of peat-forming areas, migrating channels and raised eyots (Sidell 2003a). Often these eyots were the focus of prehistoric occupation, for example, Runnymede (Needham 1991; 1992), Westminster, Southwark (Bowsher 1991; Dillion et al. 1991; Merriman 1992) and Bermondsey (Sidell et al. 2002). These areas tended to lie at the junction between the higher ground on the edge of an island and the adjacent peat and alluvium, which preserved the evidence of human activity that took place when the river levels were lower (Merriman 1992; Sidell et al. 2002).

The investigations carried out for the Jubilee Line extension have suggested that the sand eyots of Westminster and north Southwark did not complete their formation by the early Holocene as initially believed. Still, instead, they formed in the mid-Neolithic (c. 3500 cal B.C.). This could help explain why there is a lack of Early Neolithic occupation in the floodplain (Sidell 2003b).

An extensive number of boreholes (> 1100) have allowed the British Geological Society to map the extent of flooding in the early Holocene period as it left extensive alluvium up to 10m deep in places showing the vast duration of the raised water levels.

(The Thames through time)
BGS Map of London showing in blue the Alluvium deposited at the end of the LGM.  We have sectioned off A- G areas to look at their cross-sections. 
(The Thames through time)

If we section off (A to G) the Thames and look at the volume and width of the Holocene Thames in comparison to today, we can get an estimation of the discharge of water at its peak during this period.

Increased discharge levels during the Holocene

Cross- SectionCurrent WidthHolocene WidthWidth Increase %Volume Increase – (Holo. – Present =) Cu.m3Increase in Volume
A400m4,425m1,10071,724 – 800 = 70,9248,866%
B650m7,725m1,18871,950 – 1950 = 70,0003,590%
C731m8,450m1,156128,430 – 2924 = 125,5064,292%
D965m7,644m79260,348 – 4825 = 55,5231,151%
E1,207m11,265m93390,122 – 7274 = 82,8807,367%
F1,125m5,230m46538,622 – 7875 = 30,747390%
G1,448m7,242m50058,902 – 11584 = 47318408%
Average932m7426m797% 3723%
(The Thames through time)
Thames River Cross-Sections A – G
(The Thames through time)

The current average discharge is 65.8 m³/s and therefore with a 3723% increase in the watershed area we can estimate that at its peak the Thames River discharged 2450 m3/s (0.0025 Gt /s or 1314 Gt per annum). 

About the same rate of one of the smaller rivers ‘Susquehanna/Chesapeake River’ (Table 5) in North America – which is minor, in comparison to the eight North American river discharge ratios, which begs the question as the Thames is the largest river in the country, would it not be affected mostly by the meltwater at the end of the last ice age – so, have the scientists got the extent of the alluvium flooding correct?

To investigate further, we need to look at a detailed excavation undertaken at the edge of the BGS superficial Alluvium flood map to get some real evidence of dates and clues about what sediments are present in comparison to the ages suggested in the past publications.

‘Holocene environmental changes in the Lower Thames Valley’ (Branch et al.,2012) excavated parts of Hornchurch marsh at the edge of the BSG alluvium deposit (Cross-Section D). 

The paper suggests that “Palaeoenvironmental data (publicly or in the form of commercial archaeological reports) on these near-surface sediments indicate that following the end of the last glaciation, the lower reaches of the Thames Valley and its tributaries were inundated by the sea, and marine and estuarine sediments accumulated. Since that time, the evidence suggests that sea level continued to rise at a much slower rate as a response to either glacio-eustatic or sedimentary processes”.  But the idea of any recent “inundation by the sea” can now be easily rebuked.

The reason for this incorrect interpretation of sediments was that past Geologists believed that the LGM was much smaller than previous ice ages – this has now been disproved by new research at sea level data from the Mediterranean (Rohling et al., 2017) as they could only measure by observation the extent of the ice sheets on the surface of the landmass and took for granted the greater the area, the larger the ice mass by estimation.

The conclusion of this study is to show that the last Ice Age was far more significant than previously maximum (PCM) as illustrated below in table 6 and Fig. 30)

Ten  Frequently Asked Questions

1. If the sea level was so high, wouldn’t people in the past have drowned?

This question reflects a misunderstanding of hydrology. The elevation of a river is not directly linked to sea level. Rivers flow primarily from aquifers—water reservoirs embedded within bedrock—not from just rainfall as commonly taught in schools. These aquifers dictate water flow through natural springs, independent of sea level.

Unfortunately, even prominent figures in archaeology have misunderstood this principle. For instance, one well-known archaeologist dismissed my findings by dubbing the book the “Stonehenge on Sea” hypothesis – based solely on the book’s cover. This misinterpretation highlights the importance of engaging with the underlying science rather than relying on superficial impressions. (The Rivers of the Past were Higher)

(The Rivers of the Past were Higher)
Fifteen years on and still people refuse to read the literature and ask foolish questions as a consequence -(The Rivers of the Past were Higher)

2. If sea levels in the past were lower, how could rivers be higher?

During the last ice age, sea levels were approximately 65 meters lower than today. However, the colder climate meant precipitation fell as snow, forming massive glaciers. These glaciers trapped vast amounts of water, preventing it from flowing into rivers.

When the glaciers began to melt, the water released caused rivers to swell dramatically. This wasn’t a quick process. Recent models show that sea levels rose over 7,000 years after the initial melt, transforming landscapes like Doggerland—a land bridge connecting Britain to Europe—into the North Sea. This extended period of flooding explains how rivers could have been significantly larger in the past, despite lower sea levels.

(The Rivers of the Past were Higher)
People don’t understand the difference between sea level and river levels – (The Rivers of the Past were Higher)

3. Why aren’t all rivers and tributaries the same height in this area?

The simplistic notion that water “always seeks a common level” misrepresents the complexities of hydrology. Multiple aquifers at varying elevations feed rivers, and their flow mirrors the contours of the landscape. This intricate system ensures that rivers don’t conform to a uniform height.

For instance, rivers like the Thames have multiple sources that contribute to their flow. Even when rainfall is scarce, aquifers release water at different elevations, sustaining the river. This dynamic interplay explains why rivers don’t follow a universal level and why one river may sit higher than another in the same region.

(The Rivers of the Past were Higher)
It took 15 thousand years for the ice water to melt – where did you think it was before it entered the sea? – (The Rivers of the Past were Higher)

4. Is this hypothesis based on fact or just speculation?

The hypothesis is firmly grounded in decades of research and fieldwork. It builds on three decades of academic study and exploration, culminating in an academic thesis supported by 125 peer-reviewed references.

(The Rivers of the Past were Higher)
The Book – (The Rivers of the Past were Higher)

5. I’ve walked these routes and found no water. How do you explain that?

Landscapes are dynamic, not static. Ten thousand years ago, the Sahara was a lush rainforest filled with elephants and lions. Similarly, Britain’s east coast was once a verdant plain connecting it to Europe. Over millennia, these landscapes changed dramatically due to shifting climates and sea levels.

Rivers that once flowed abundantly have since diminished as aquifers dried up. For example, the North Sea, Irish Sea, and English Channel gradually drained the rivers that fed them, lowering water tables and drying out springs in elevated areas. Today, you see a shadow of the ancient hydrological systems that once defined these regions.

(The Rivers of the Past were Higher)
When it overly rains only the old rivers of the past overflow – guess what happened when the ice melted 10k years ago – (The Rivers of the Past were Higher)

6. Why would people push boats to the top of a hillfort?

The idea that ancient people moved boats uphill reflects a misunderstanding of how rivers once shaped the landscape. According to the hypothesis, ancient rivers like the Thames were vastly larger—potentially 3,000 times their current size. What we perceive as hills today would have appeared as islands within these expansive waterways.

Earthworks along these rivers likely defined the edges of these elevated landforms, making them accessible by boat. This perspective challenges modern assumptions about the topography of the past and highlights the transformative role of ancient hydrological systems.

(The Rivers of the Past were Higher)
Dykes connecting to Hillforts – (The Rivers of the Past were Higher)

7. Where is the evidence for larger rivers in the past?

British Geological Survey maps provide compelling evidence of ancient, larger rivers. These maps detail the extent of superficial deposits that mark the waterways’ historical boundaries. Features like river terraces further support this evidence.

For instance, the River Avon has ten terraces, indicating its past size and elevation. At one time, this river spanned tens of kilometres in width and was over 100 meters above current sea level. These geological features attest to the dynamic nature of rivers throughout history. (The Rivers of the Past were Higher)

(The Rivers of the Past were Higher)
These BGS Maps grossly under estimated deposits as they are based on bore holes that are few and far between – (The Rivers of the Past were Higher)

8. I have a PhD in archaeology—why wasn’t I taught this?

Archaeological education has traditionally focused on specific methodologies while neglecting interdisciplinary approaches. In the 21st century, good archaeology requires integrating hydrology, dating methods, and advanced mapping techniques like LiDAR.

LiDAR, for instance, allows us to reconstruct ancient landscapes with remarkable precision. Yet, many archaeologists lack the training to interpret raw LiDAR data or understand its full potential. The absence of such knowledge limits their ability to engage with complex hypotheses like the one presented here. Archaeology must evolve into a more scientifically robust discipline to address this gap. (The Rivers of the Past were Higher)

(The Rivers of the Past were Higher)
Empirical evidence shows that once the rivers were much higher in the past – the only question is when? – (The Rivers of the Past were Higher)

9. Water can’t flow uphill, for the gradients are too high

This question reflects a common misconception about the nature and purpose of prehistoric linear earthworks, or “dykes,” in a flooded prehistoric landscape. Many people mistakenly interpret these structures through the lens of Victorian canals, imagining them as continuous waterways designed to transport goods over long distances in a single, uninterrupted flow. This comparison oversimplifies the engineering principles and functional realities of prehistoric dykes. (The Rivers of the Past were Higher)

(The Rivers of the Past were Higher)
Today we have the lowest water table in history – hence the dry landsacpe on hills – (The Rivers of the Past were Higher)
(The Rivers of the Past were Higher)
But in prehistory the water table was much higher so flooded often – (The Rivers of the Past were Higher)

In prehistory, river levels were significantly higher than today, which meant that the distances goods needed to travel over land were much shorter. Prehistoric dykes were not designed as continuous waterways; instead, they were engineered to serve as efficient connections between rivers or to transport raw materials from quarries to waterways. These materials could then be transported by boat to trading sites or processing locations.

A key feature of these dykes is their adaptability to the landscape. Unlike Victorian canals, which relied on a continuous channel of water and locks to maintain flow, prehistoric dykes often utilized natural springs at the tops of hills. These springs could provide water that flowed down both sides of a hill, enabling transport without the need to “go over” the hill itself. This ingenious use of natural water sources allowed for movement between points A and B most efficiently, considering the terrain and hydrology of the time. (The Rivers of the Past were Higher)

10. How can you connect to other rivers as you need to go over the hill?

(The Rivers of the Past were Higher)
Prehistoric ‘cross-dykes’ were used to drag boats from once water source to another – (The Rivers of the Past were Higher)

In cases where goods or people needed to traverse a hill with water flowing down both sides, the solution was remarkably straightforward and practical. A boat or barge, naturally floating in the water and much lighter to manage than carrying goods or loads overland, could be dragged uphill using workforce or, more efficiently, animal power. Oxen, for example, would have been ideal for towing boats up gradients along the dyke.

Once the summit was reached, the natural downhill flow of water could take over, allowing the boat to continue its journey easily. Using animal power to drag boats uphill echoes practices seen in early Victorian canal systems. During this period, weirs were often constructed to slow water flow in downhill rivers, facilitating the towing of barges and boats uphill. The principle was straightforward: use animal power for uphill transport and natural flow for downhill movement, ensuring efficiency and minimizing the physical burden on workers.

This method would have effectively transported goods or people over varied terrain in a prehistoric context, leveraging both natural hydrology and available resources like animal labour. The adaptability of this system highlights the innovative and pragmatic approaches of ancient societies to overcome challenges posed by their environment.

By viewing prehistoric dykes through this lens, we can better appreciate their functionality and the ingenuity of those who designed them. Modern assumptions of continuous waterways did not limit these structures but reflected a deep understanding of the landscape and the tools available to navigate it. (The Rivers of the Past were Higher)

Conclusion

The Post-Glacial Flooding Hypothesis challenges conventional wisdom about ancient landscapes and hydrology. It invites us to reconsider the evidence and embrace a more interdisciplinary approach to archaeology. While the journey to broader acceptance has been fraught with resistance and misunderstanding, the evidence speaks for itself.

For those willing to engage deeply, the hypothesis offers a transformative lens to understand the past—a perspective rooted in science, shaped by rigorous research, and open to thoughtful debate.

Scientific progress begins with hypotheses. I welcome questions and challenges, but they must be substantiated with evidence. The burden of proof lies with those who disagree, requiring more than opinion; it demands well-referenced counterarguments. This process of scrutiny and debate is the essence of scientific advancement.

The landscape has changed — but the clues are still there, in stone, in soil, and in elevation maps. It’s time archaeology stopped ignoring the water and started reimagining the prehistoric world from the riverbed up. (The Rivers of the Past were Higher)

(The Rivers of the Past were Higher)
The Hypothesis of 50K words with 125 peer-reviewed references – three times larger that a PhD thesis -(The Rivers of the Past were Higher)

(The Rivers of the Past were Higher)

Exploring Prehistoric Britain: A Journey Through Time

My blog delves into the fascinating mysteries of prehistoric Britain, challenging conventional narratives and offering fresh perspectives based on cutting-edge research, particularly using LiDAR technology. I invite you to explore some key areas of my research. For example, the Wansdyke, often cited as a defensive structure, is re-examined in light of new evidence. I’ve presented my findings in my blog post Wansdyke: A British Frontier Wall – ‘Debunked’, and a Wansdyke LiDAR Flyover video further visualizes my conclusions.

My work also often challenges established archaeological dogma. I argue that many sites, such as Hambledon Hill, commonly identified as Iron Age hillforts are not what they seem. My posts Lidar Investigation Hambledon Hill – NOT an ‘Iron Age Fort’ and Unmasking the “Iron Age Hillfort” Myth explore these ideas in detail and offer an alternative view. Similarly, sites like Cissbury Ring and White Sheet Camp, also receive a re-evaluation based on LiDAR analysis in my posts Lidar Investigation Cissbury Ring through time and Lidar Investigation White Sheet Camp, revealing fascinating insights into their true purpose. I have also examined South Cadbury Castle, often linked to the mythical Camelot56.

My research also extends to the topic of ancient water management, including the role of canals and other linear earthworks. I have discussed the true origins of Car Dyke in multiple posts including Car Dyke – ABC News PodCast and Lidar Investigation Car Dyke – North Section, suggesting a Mesolithic origin2357. I also explore the misidentification of Roman aqueducts, as seen in my posts on the Great Chesters (Roman) Aqueduct. My research has also been greatly informed by my post-glacial flooding hypothesis which has helped to inform the landscape transformations over time. I have discussed this hypothesis in several posts including AI now supports my Post-Glacial Flooding Hypothesis and Exploring Britain’s Flooded Past: A Personal Journey

Finally, my blog also investigates prehistoric burial practices, as seen in Prehistoric Burial Practices of Britain and explores the mystery of Pillow Mounds, often mistaken for medieval rabbit warrens, but with a potential link to Bronze Age cremation in my posts: Pillow Mounds: A Bronze Age Legacy of Cremation? and The Mystery of Pillow Mounds: Are They Really Medieval Rabbit Warrens?. My research also includes the astronomical insights of ancient sites, for example, in Rediscovering the Winter Solstice: The Original Winter Festival. I also review new information about the construction of Stonehenge in The Stonehenge Enigma.

(The Rivers of the Past were Higher)

Further Reading

For those interested in British Prehistory, visit www.prehistoric-britain.co.uk, a comprehensive resource featuring an extensive collection of archaeology articles, modern LiDAR investigations, and groundbreaking research. The site also includes insights and extracts from the acclaimed Robert John Langdon Trilogy, a series of books exploring Britain during the Prehistoric period. Titles in the trilogy include The Stonehenge Enigma, Dawn of the Lost Civilisation, and The Post Glacial Flooding Hypothesis, offering compelling evidence about ancient landscapes shaped by post-glacial flooding.

To further explore these topics, Robert John Langdon has developed a dedicated YouTube channel featuring over 100 video documentaries and investigations that complement the trilogy. Notable discoveries and studies showcased on the channel include 13 Things that Don’t Make Sense in History and the revelation of Silbury Avenue – The Lost Stone Avenue, a rediscovered prehistoric feature at Avebury, Wiltshire.

In addition to his main works, Langdon has released a series of shorter, accessible publications, ideal for readers delving into specific topics. These include:

For active discussions and updates on the trilogy’s findings and recent LiDAR investigations, join our vibrant community on Facebook. Engage with like-minded enthusiasts by leaving a message or contributing to debates in our Facebook Group.

Whether through the books, the website, or interactive videos, we aim to provide a deeper understanding of Britain’s fascinating prehistoric past. We encourage you to explore these resources and uncover the mysteries of ancient landscapes through the lens of modern archaeology.

For more information, including chapter extracts and related publications, visit the Robert John Langdon Author Page. Dive into works such as The Stonehenge Enigma or Dawn of the Lost Civilisation, and explore cutting-edge theories that challenge traditional historical narratives.

(The Rivers of the Past were Higher)

Other Blogs

s

t

(The Rivers of the Past were Higher)

Hidden Sources of Ancient Dykes: Tracing Underground Groundwater Fractals

Introduction

This blog re-examines Britain’s ancient linear earthworks, such as Offa’s Dyke and Wansdyke, through the lens of hydrology and groundwater science, proposing that these structures were not ritual boundaries or defensive embankments, but part of a sophisticated, prehistoric mining and transport network. By tracing their unusual paths and comparing them with aquifer data, the post makes a compelling case: these dykes were built to move minerals via water—not soldiers.(Hidden Purpose of Ancient Dykes)

Contrary to the long-held belief that these features served military or symbolic functions, their actual design raises major questions. Many dykes are non-continuous, curve unpredictably, and pass through remote, uninhabited areas, far from any strategic stronghold or settlement. Instead of defending anything, they seem to follow the landscape’s natural water flow—especially the edges of aquifers and groundwater discharge zones.

 Hidden Purpose of Ancient Dykes
Wansdyke is on the edge of one of Britains largest Aquifers – Hidden Sources of Ancient Dykes – Source BGS

By overlaying dyke locations onto hydrogeological maps, a pattern emerges: nearly every major dyke in Britain correlates with aquifer systems or zones of high groundwater productivity. This includes saturated mineral-bearing soils, limestone and chalk formations, and ancient springs—features critical not for spiritual rituals, but for extracting and transporting resources. These dykes, the blog suggests, were likely built to channel groundwater seasonally or year-round, enabling flat-bottomed boats to move ore, stone, and other extracted materials from inland mining zones to major river systems for wider distribution.

The wibbly-wobbly routes of these earthworks make far more sense when viewed through this lens. Rather than being arbitrarily drawn or spiritually significant, they seem to trace fractally distributed groundwater flow patterns—the same paths water would naturally take through porous rock and sediment. By tapping into these natural routes, prehistoric engineers could move heavy materials across considerable distances without the need for roads or pack animals.

 Hidden Purpose of Ancient Dykes
The Vallum at Hadrian’s Wall is on a major Aquifer – Hidden Sources of Ancient Dykes – Source BGS

Sites along these dykes often yield clues of quarrying, digging pits, or early metallurgy, further suggesting an industrial—not ritualistic—function. Combined with LiDAR mapping and terrain modelling, many of these ancient dykes also show characteristics of canal-like trenching, including embankments, towpaths, and level gradients consistent with water management rather than warfare.

Importantly, the blog challenges modern archaeology’s tendency to label such constructions as “ritual” simply because their purpose is not immediately understood. By reframing these dykes as functional infrastructure, it positions prehistoric Britons not as superstitious monument builders, but as skilled engineers, capable of manipulating water to serve economic and industrial goals—centuries, perhaps millennia, before similar systems appeared in written history.

 Hidden Purpose of Ancient Dykes
Offa’s Dyke is on the edge of THREE major Aquifers – Hidden Sources of Ancient Dykes – Source BGS
Hidden Purpose of Ancient Dykes - Source BGS
Hidden Sources of Ancient Dykes – Source BGS
- Hidden Purpose of Ancient Dykes - Source BGS
Hidden Sources of Ancient Dykes – Source BGS

In conclusion, the blog argues that Britain’s ancient dykes were part of a hydrological logistics network designed for resource movement and mining operations, aligning deliberately with groundwater systems and aquifer boundaries. These were routes of commerce and industry, not symbols or borders. It’s time to stop viewing them as mysterious relics—and start seeing them as evidence of a forgotten era of practical innovation and environmental mastery.

Dykes Follow Water: The 68.6% Aquifer Overlap Nobody’s Talking About

In a GIS-based analysis of prehistoric dyke placements across Britain, using official aquifer mapping from the British Geological Survey, we found that over two-thirds (68.6%) of dyke segments intersect directly with known aquifer zones.

This finding severely undermines the long-standing assumption that dykes were purely ritual or defensive. Instead, it supports a far more practical theory: these features may have followed underground water fractures or aquifer boundaries — possibly to aid water transport, trade, or seasonal canal usage.

When linear earthworks like Offa’s Dyke and Wansdyke are mapped alongside hydrogeological data, patterns emerge that are too precise to be coincidental. Whether through environmental observation or water dowsing, the builders clearly knew something about the ground beneath their feet.

Forget chalk and ritual. This is water engineering.

AI’s Take

1. Introduction: Revisiting the Landscape Through Water

Across Britain, a network of ancient linear earthworks—often labelled dykes—traverse the landscape in puzzling patterns. Traditionally interpreted as defensive structures, many of these dykes do not conform to military logic. They often wind across hills, valleys, and open terrain in apparently arbitrary routes. However, by examining these features through the lens of hydrology, particularly groundwater distribution and fractal flow paths, an alternative explanation emerges: these ancient monuments may have been constructed in response to the hidden patterns of water beneath our feet.

Hidden Purpose of Ancient Dykes
Ancient dykes like Offa’s Dyke snake across the landscape with no obvious military logic.- Hidden Purpose of Ancient Dykes

2. The Science of Groundwater Flow

Groundwater moves beneath the Earth’s surface through porous materials like gravel, sand, and fractured rock. Governed by the laws of hydrogeology—most notably Darcy’s Law—its movement follows gradients in pressure and elevation. Contrary to the perception of random underground seepage, groundwater flow is directional, structured, and often forms recognizable spatial patterns when viewed over time.

Hidden Purpose of Ancient Dykes

3. Hydrological Predictability and Fractal Geometry

Groundwater doesn’t spread uniformly. Instead, it forms branching, tree-like pathways that closely resemble fractal geometry—irregular yet mathematically structured patterns found in nature. These fractal patterns can be seen in river systems, lightning strikes, and even blood vessels. When mapped in detail, groundwater follows similar structures: splitting, rejoining, and fanning out with a logic dictated by rock permeability and hydraulic gradients.

Hidden Purpose of Ancient Dykes
Groundwater often follows fractal patterns, mirroring trees, veins, and rivers. – Hidden Purpose of Ancient Dykes

4. The Role of Aquifers

An aquifer is a body of rock or sediment that holds usable groundwater. Britain’s principal aquifers—such as the Chalk Aquifer of southeast England or the Triassic sandstones in Wales and the Midlands—are well-documented by the British Geological Survey. These aquifers are not just water sources; they shape ecosystems, influence agriculture, and determine human settlement patterns over millennia.

Hidden Purpose of Ancient Dykes
Britain’s major aquifers form the nation’s underground reservoirs. – Hidden Purpose of Ancient Dykes

5. Linear Earthworks: Not So Linear in Purpose

Earthworks like Offa’s Dyke, Wansdyke, and Grim’s Ditch often deviate from straight lines, curving and looping across the countryside. Many historians and archaeologists have noted this “wibbly-wobbly” quality and chalked it up to terrain negotiation. But what if these bends follow not just topography, but subterranean water flows?

 Hidden Purpose of Ancient Dykes
Dykes appear “linear” in name only—many follow winding, unpredictable paths.- Hidden Purpose of Ancient Dykes

6. Evidence of Groundwater-Aware Design

Recent overlays of dyke paths on hydrogeological maps reveal compelling alignments. Dykes often trace the edges of aquifers, follow groundwater discharge zones (where springs emerge), or align with the boundaries between permeable and impermeable strata. These alignments are unlikely to be accidental, particularly when they persist across multiple sites.

Hidden Purpose of Ancient Dykes
Car Dyke aligns with underground water flow zones and aquifer edges which are still flowing..- Hidden Purpose of Ancient Dykes

7. Mapping the Invisible: Fractals in the Field

Using LiDAR data, some researchers have started mapping the subtle undulations in landscape that coincide with earthworks. When these are overlaid with known groundwater discharge points and aquifer margins, a fractal pattern begins to emerge. The ancient builders, whether consciously or through long experience, appear to have traced these subtle cues in the environment—potentially to access, mark, or manage water resources.

.- Hidden Purpose of Ancient Dykes
LiDAR data reveals invisible patterns matching ancient earthworks and water flows..- Hidden Purpose of Ancient Dykes

8. Offa’s Dyke and the Welsh Aquifers

One of the most prominent linear monuments in Britain, Offa’s Dyke, cuts through a landscape rich in aquifers. From the carboniferous limestone of the Brecon Beacons to the sandstones of the Cheshire Basin, the dyke’s route seems to skim or run adjacent to many known water-bearing formations. While once considered a boundary between Anglo-Saxon and Welsh territories, it now appears the dyke might also be a hydrological boundary marker.

 Hidden Purpose of Ancient Dykes
Hidden Purpose of Ancient Dykes

9. Wansdyke and Water Corridors

Wansdyke in southern England similarly defies defensive logic. Its route is discontinuous and loops across high ridges with no clear military advantage. However, much of it aligns with chalk geology—a major aquifer type in the UK. The chalk aquifer not only stores groundwater but releases it gradually into the landscape through springs, many of which lie near or along Wansdyke’s path.

Hidden Purpose of Ancient Dykes

10. Dyke Placement and the Absence of Settlements

Another clue lies in what’s not present. Many dykes pass through areas far from settlements, agriculture, or known defensive frontiers. These otherwise “inconvenient” locations begin to make sense when viewed hydrologically: they traverse zones of high groundwater potential, or cross landscape features connected to seasonal flooding and spring emergence.

Hidden Purpose of Ancient Dykes
Most Dykes are in the middle of nowhere and small – Hidden Purpose of Ancient Dykes

11. Ancient Hydroengineering?

Alternatively, these dykes may represent early attempts at hydrological management—channeling water, controlling flood plains, or marking safe grazing zones. If water was seasonally abundant or scarce, understanding its patterns would have been vital. Building linear earthworks along aquifer boundaries could have allowed communities to delineate water-rich areas from drier zones without modern instrumentation.

 Hidden Purpose of Ancient Dykes
Durrington Walls kept the water but adding a Dyke when the River water levels fell – Hidden Purpose of Ancient Dykes

12. Mathematical Validation of Dyke Placement

Using fractal analysis and mathematical modelling tools (like GIS or QGIS), modern researchers can now test the statistical probability of dyke placement aligning with hydrological features. Preliminary data suggests a non-random correlation—that is, dykes are significantly more likely to intersect aquifer boundaries or discharge zones than random lines across the same landscape would.

- Hidden Purpose of Ancient Dykes
Fractal flow modeling suggests non-random alignment of dykes and water.- Hidden Purpose of Ancient Dykes

13. A Landscape Language We’re Only Starting to Understand

Our ancestors may not have used scientific terminology, but they read the land through observation, oral tradition, and environmental memory. Dykes may have formed part of this unspoken language of the landscape—an early cartography of water, built in earth and stone. Rediscovering this language could reshape not only our understanding of earthworks, but of ancient Britain itself.

- Hidden Purpose of Ancient Dykes
Dykes may be part of an ancient “language” that mapped water underground.- Hidden Purpose of Ancient Dykes

14. Conclusion: From Defensive Lines to Water Lines

What appears as haphazard or defensive may, in fact, be ecological and intentional. Groundwater distribution patterns—fractal, functional, and factual—offer a powerful lens through which to reinterpret the placement and purpose of Britain’s linear earthworks. These dykes might not be walls at all—but lines drawn in reverence to the veins of the Earth, acknowledging the life-giving force of water hidden just beneath the surface.

Hidden Purpose of Ancient Dykes

Further Reading

For information about British Prehistory, visit www.prehistoric-britain.co.uk for the most extensive archaeology blogs and investigations collection, including modern LiDAR reports.  This site also includes extracts and articles from the Robert John Langdon Trilogy about Britain in the Prehistoric period, including titles such as The Stonehenge Enigma, Dawn of the Lost Civilisation and the ultimate proof of Post Glacial Flooding and the landscape we see today.

Robert John Langdon has also created a YouTube web channel with over 100 investigations and video documentaries to support his classic trilogy (Prehistoric Britain). He has also released a collection of strange coincidences that he calls ‘13 Things that Don’t Make Sense in History’ and his recent discovery of a lost Stone Avenue at Avebury in Wiltshire called ‘Silbury Avenue – the Lost Stone Avenue’.

(Maritime Diffusion Model for Megaliths in Europe)

Langdon has also produced a series of ‘shorts’, which are extracts from his main body of books:

The Ancient Mariners

Stonehenge Built 8300 BCE

Old Sarum

Prehistoric Rivers

Dykes ditches and Earthworks

Echoes of Atlantis

Homo Superior

(https://bloggers.feedspot.com/uk_archaeology_blogs/)

Other Blogs

s

t