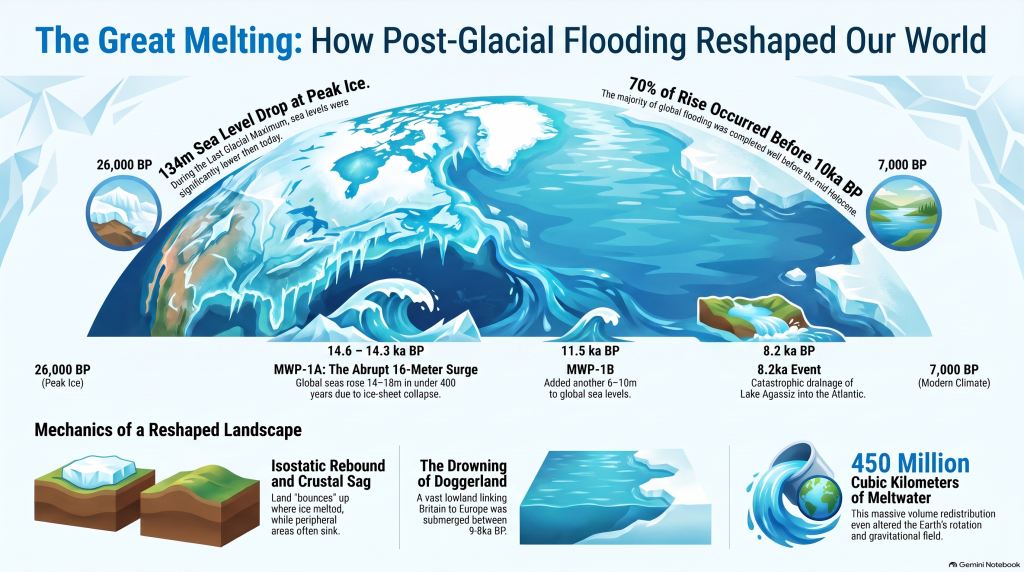
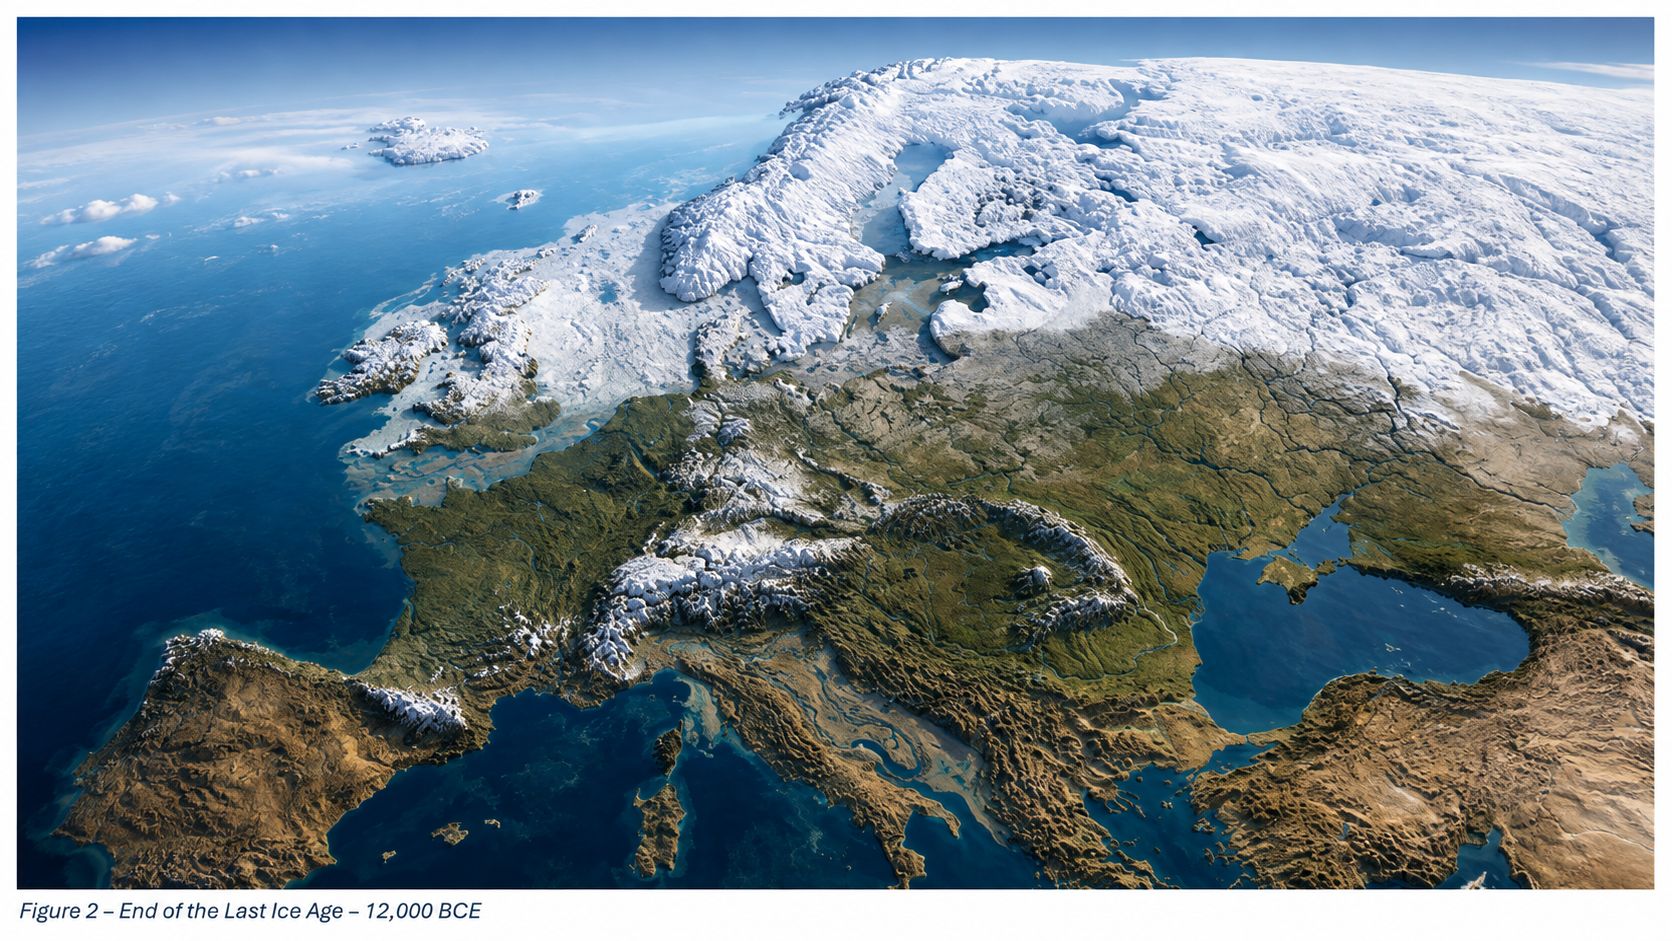
Roughly twenty-six thousand years ago, the Earth entered the final phase of the last ice age, when more than 30 million square kilometres of the northern continents were mantled by ice. Sea level dropped by over a hundred metres, continents expanded, and the atmosphere became drier and dustier. When the climate warmed, that frozen water returned to the ocean basins, transforming every river and shoreline on the planet. Understanding the magnitude and tempo of this transition is fundamental to reconstructing the landscapes that Holocene societies inherited. (The Post-Glacial Flooding Hypothesis)
The scientific history of sea-level research stretches back more than a century. Fairbridge (1961) first proposed that global “drowned terraces” recorded former sea levels. Oxygen-isotope analysis later provided a direct measure of global ice volume (Shackleton & Opdyke 1973; Chappell & Shackleton 1986). By the 1990s, uranium-thorium dating of coral reefs (Bard et al., 1990) and glacio-isostatic models (Lambeck & Chappell 2001) produced continuous global sea-level curves for the late Quaternary. Satellite altimetry and GRACE gravimetry now track present-day mass exchange between ice sheets and oceans with millimetre precision (Watkins et al., 2015; Cazenave et al., 2018).
These cumulative datasets reveal that the transformation from the Last Glacial Maximum (LGM) to the modern interglacial was neither instantaneous nor globally uniform. The following sections examine the evidence for the magnitude of the LGM, the deglacial rise in sea level, and the feedbacks that coupled ice, ocean, and atmosphere into a single dynamic system.
The Post-Glacial Flooding Hypothesis
2. The Last Glacial Maximum
The LGM, dated between ~26 000 and 19 000 years BP, represents the maximum combined extent of Northern Hemisphere ice sheets. Reconstructions by Ehlers et al. (2018) show the Laurentide Ice Sheet extending south of the Great Lakes, the Fennoscandian complex covering Scandinavia, northern Britain, and the Baltic, and separate domes over the Barents and Kara Seas. In the Southern Hemisphere, the Patagonian, New Zealand, and Antarctic ice sheets expanded simultaneously. Global mean air temperature was about 5–6 °C lower than today (Tierney et al., 2020).
Cosmogenic-nuclide dating of moraines indicates near-synchronous maxima in both hemispheres within 1–2 kyr (Balco et al., 2009). Ice cores from Antarctica record atmospheric CO₂ concentrations of only ~190 ppm, the lowest of the last 800 kyr (Lüthi et al., 2008). The increased planetary albedo and reduced greenhouse forcing locked the Earth into a radiative imbalance until orbital precession increased summer insolation at high latitudes around 21 ka BP, initiating melting.
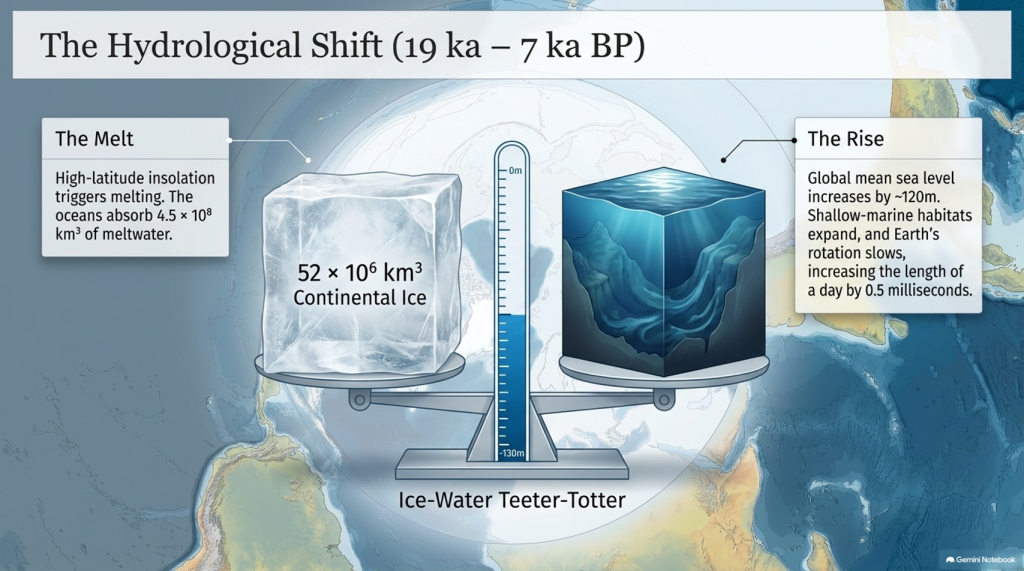
Sea level at the LGM stood 134 ± 5 m below present (Rohling et al., 2009; Lambeck et al., 2014), implying an extra ~52 × 10⁶ km³ of continental ice—roughly triple modern Antarctic volume. The load depressed the lithosphere by up to a kilometre and generated a peripheral forebulge hundreds of kilometres wide. When deglaciation began, these distortions created regional variations in relative sea level (RSL) of tens of metres—a problem that still complicates correlation between sites.
The Post-Glacial Flooding Hypothesis
3. Quantifying Global Ice and Sea-Level Change
High-resolution oxygen-isotope records from the Red Sea (Rohling et al., 2009) and global benthic stacks (Lisiecki & Raymo, 2005) define the eustatic component of sea-level change. Grant et al. (2014) extended the Red Sea curve to 500 kyr BP and confirmed an approximately linear relation between δ¹⁸O and global mean sea level within ±140 m. Combined with coral-reef U/Th dates (Peltier & Fairbanks 2006) and glacio-isostatic modelling (ICE-6G v2; Peltier et al., 2015), these data yield the following deglacial sequence:
The Post-Glacial Flooding Hypothesis
Stable minimum (26–19 ka) — Sea level constant near −130 m; ice volume at maximum.
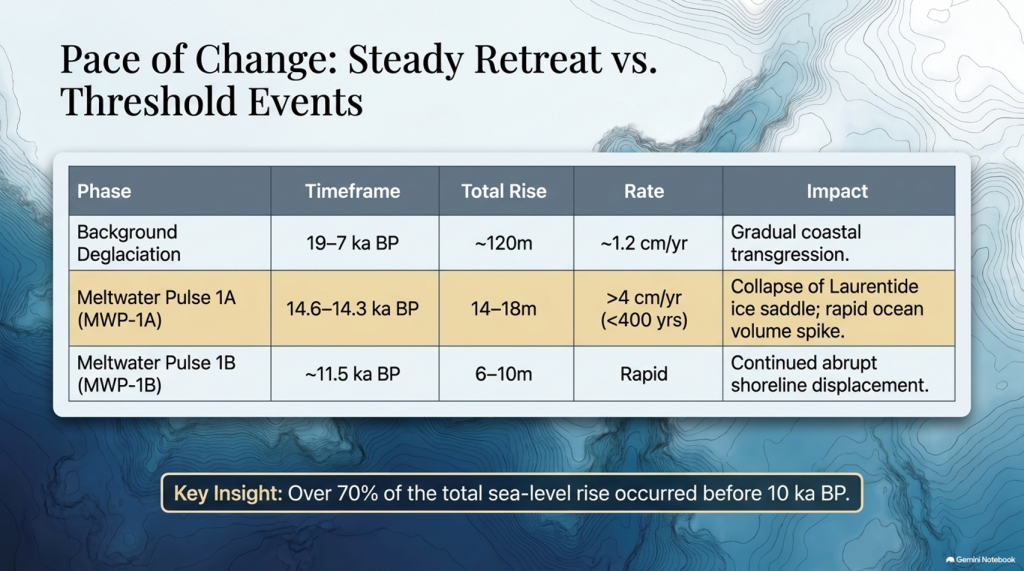
Deglacial rise (19–7 ka) — Global mean increase ~120 m; average rate ~1.2 cm yr⁻¹.
Waelbroeck et al. (2019) and Gowan et al. (2021) further improved resolution, showing that roughly 70% of the total rise occurred before 10 ka BP and that rates exceeded 4 cm yr⁻¹ during short meltwater pulses. These figures quantify the pace of global hydrological reorganisation that followed the LGM.
The Post-Glacial Flooding Hypothesis
4. Meltwater Pulses and Deglacial Chronology
Superimposed on the long-term trend are several abrupt accelerations known as Meltwater Pulses (MWPs). MWP-1A (14.6–14.3 ka BP) raised global sea level by 14–18 m in < 400 years (Deschamps et al., 2012). Coral cores from Tahiti and Barbados capture the event as a distinct change in growth depth and isotope composition. MWP-1B, centred near 11.5 ka BP, added another 6–10 m (Liu et al., 2019). A later, smaller pulse (~8.2 ka BP) corresponded to catastrophic drainage of pro-glacial Lake Agassiz into the North Atlantic (Teller et al., 2002).
Numerical models (Gregoire et al., 2012) indicate that collapse of the Laurentide ice saddle triggered MWP-1A, releasing freshwater at ~0.3 Sverdrups—enough to disrupt the Atlantic Meridional Overturning Circulation (AMOC) and cause short-lived cooling across the Northern Hemisphere (Liu et al., 2009). Geomorphic evidence of megafloods, such as the Missoula outburst channels in North America (Bretz 1969; Baker 2013), provides analogues for the required discharge scale.
MWPs demonstrate that deglaciation was a series of threshold events rather than a steady retreat. The timing of pulses aligns closely with abrupt climatic shifts seen in Greenland ice cores (NGRIP Members 2004), underscoring the tight coupling between ice dynamics and global climate.
5. Isostatic Rebound and Crustal Adjustment
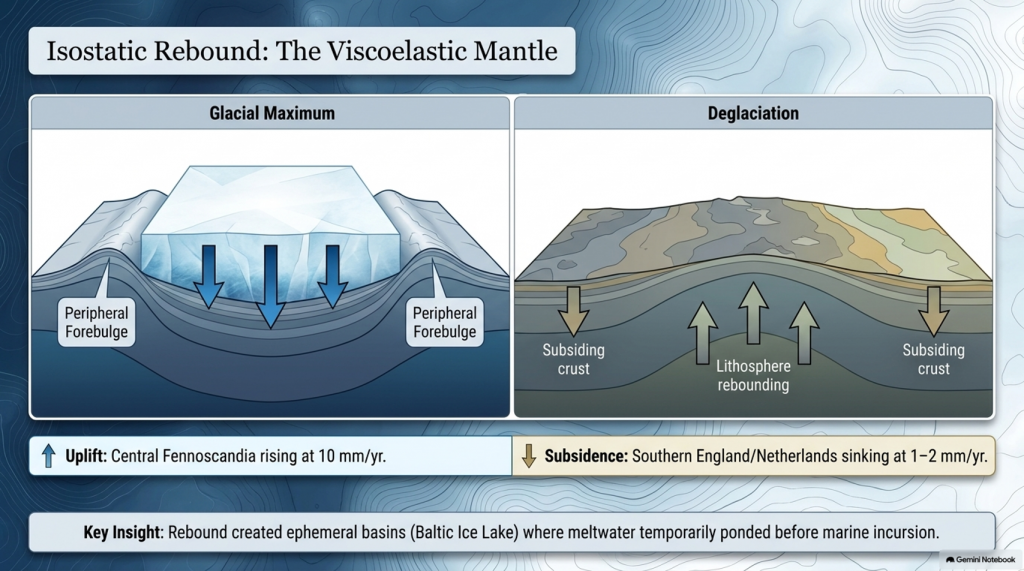
Once surface loads were removed, the lithosphere began to rebound. The process is governed by viscoelastic relaxation of the mantle with characteristic times of 1–5 kyr (Milne et al., 2006). Modern GPS and tide-gauge data show uplift of 10 mm yr⁻¹ in central Fennoscandia and subsidence of 1–2 mm yr⁻¹ in southern England and the Netherlands—the collapsing forebulge. Modelling (Lambeck et al., 2014; Peltier et al., 2015) reproduces these patterns when mantle viscosities of 3–5 × 10²¹ Pa s are used.
Rebound created ephemeral basins along glacial margins where meltwater ponded before marine incursion. The Baltic Ice Lake and the Champlain Sea are classic examples, forming as differential uplift temporarily dammed drainage routes (Saarnisto & Salonen 1995; Parent & Occhietti 1999). Many present-day estuaries owe their origins to these basins. Sediment cores from the Humber, Thames, and Rhine estuaries contain alternating freshwater and brackish layers that track the balance between isostasy and eustasy (Shennan et al., 2018).
The Post-Glacial Flooding Hypothesis
6. The Rebirth of the Oceans
Between 19 ka and 7 ka BP, the oceans absorbed roughly 4.5 × 10⁸ km³ of meltwater, raising mean sea level by ~120 m. Coral records from Tahiti, Huon Peninsula, and the Sunda Shelf show a remarkably consistent transgression curve (Deschamps et al., 2012; Hanebuth et al., 2000). By 7 ka BP, sea level stabilised within a few metres of the modern datum.
The redistribution of this mass altered Earth’s rotation and gravitational field, increasing the length of day by 0.5 milliseconds (Mitrovica & Munk 2003) and displacing the geoid by several decimetres. More tangibly, flooding of continental shelves expanded shallow-marine habitats and enhanced nutrient exchange between land and sea, fuelling mid-Holocene marine productivity (Haug et al., 2001). The creation of new estuarine and lagoonal systems also provided nursery grounds for species that later became critical to human subsistence.
7. Climate Feedbacks During Deglaciation
Ice-core and modelling studies reveal that the deglacial rise in greenhouse gases both responded to and accelerated warming. CO₂ increased from 190 ppm at the LGM to 270 ppm by 11 ka BP (Lüthi et al., 2008). Methane doubled from 350 to 700 ppb (Loulergue et al., 2008). The combined radiative forcing of ~2.5 W m⁻² produced a global temperature increase of ~4 °C (IPCC AR6 2021). Shakun et al. (2012) demonstrated that Antarctic warming led the CO₂ rise by several centuries, implying that oceanic outgassing initiated the feedback loop.
Freshwater discharges into the North Atlantic weakened the AMOC and triggered millennial-scale climate reversals. The Younger Dryas (12.9–11.7 ka BP) involved a 5–7 °C drop in Greenland temperatures followed by rapid recovery within a few decades (Severinghaus et al., 1998). Numerical experiments show that such shifts require freshwater fluxes of 0.05–0.1 Sverdrups (Liu et al., 2009). Once meltwater routing shifted southward and AMOC strength recovered, interglacial stability was achieved.
The Post-Glacial Flooding Hypothesis
8. The Transformation of North-West Europe
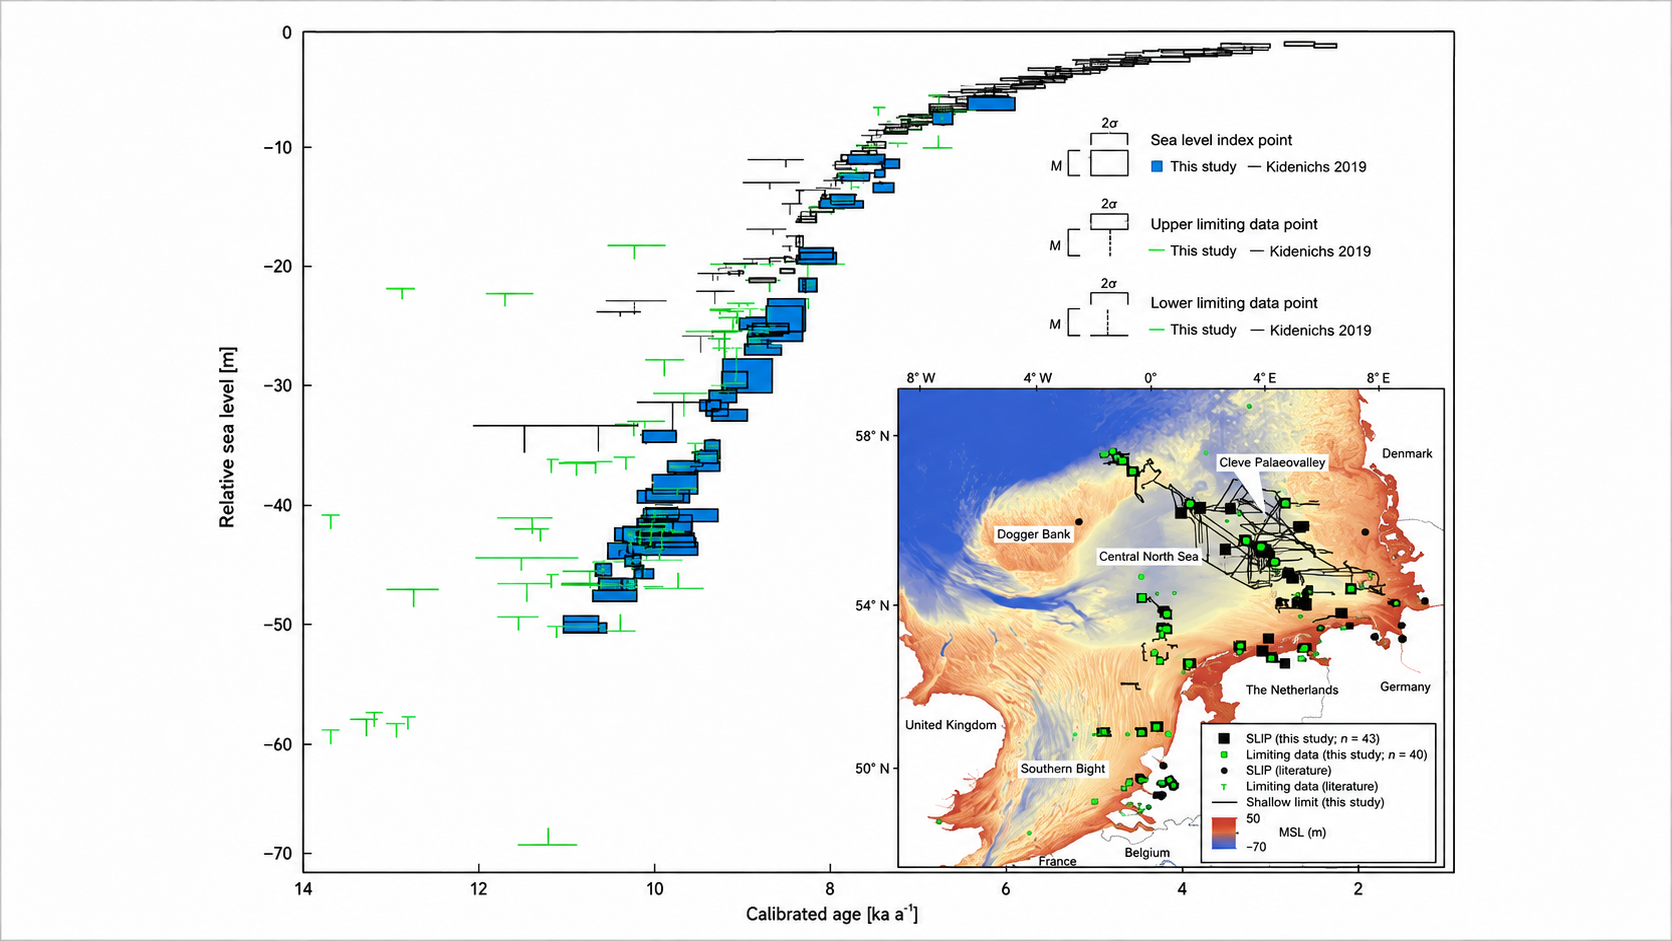
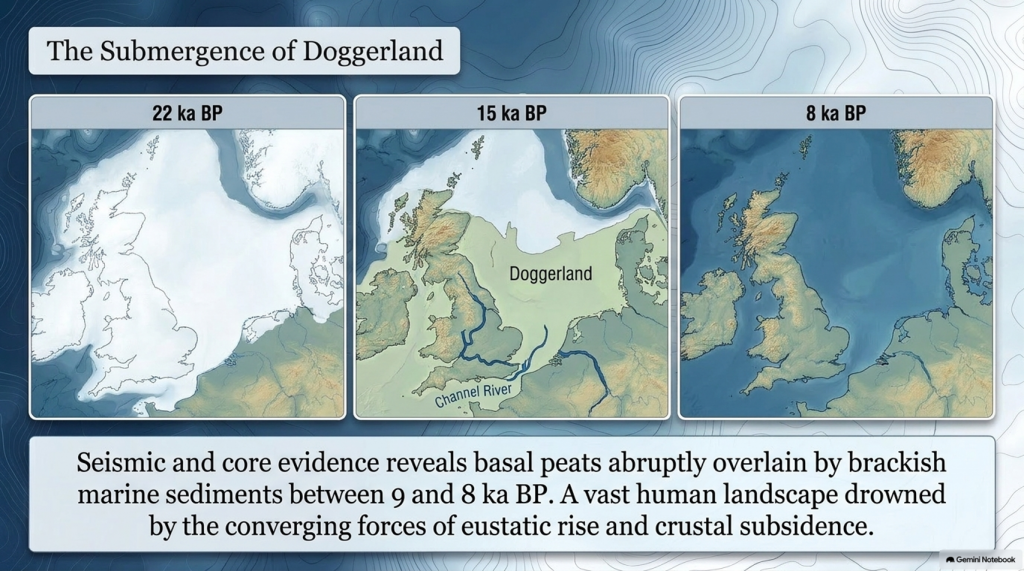
Retreat of the British–Irish Ice Sheet began near 22 ka BP and concluded by 15 ka BP (Clark et al., 2012). Deglaciation exposed outwash plains and periglacial lakes that evolved into estuaries and wetlands as sea level rose. Seismic and core evidence from the southern North Sea shows basal peats overlain by brackish and marine sediments between 9 and 8 ka BP (Hijma & Cohen 2011). These sequences chart the drowning of Doggerland—a vast lowland linking Britain to Europe. Pollen and macrofossil data indicate temperate woodland colonisation prior to submergence (Gaffney et al., 2009).
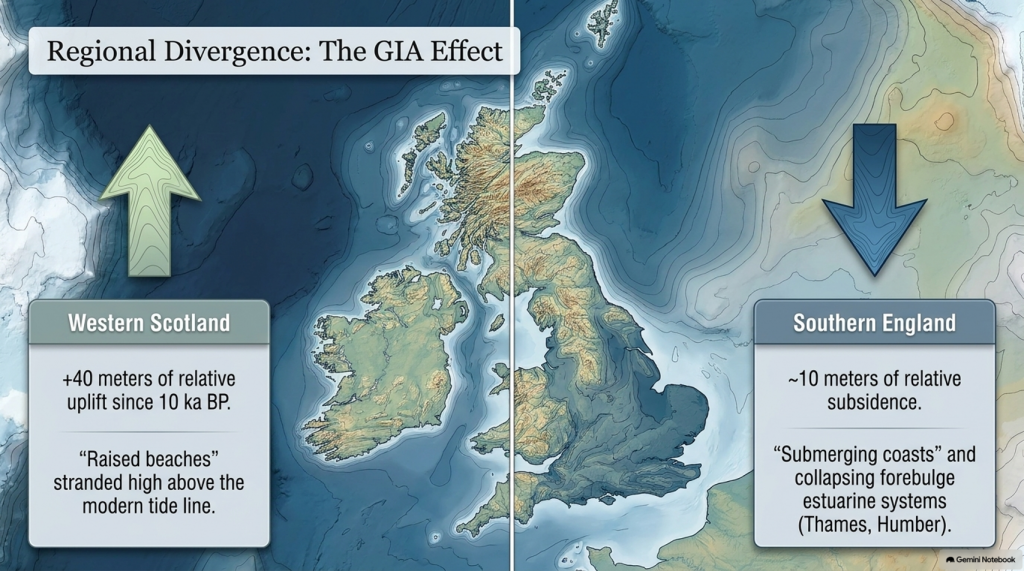
Regional RSL curves diverge sharply due to GIA: western Scotland has risen > 40 m since 10 ka, while southern England has subsided by ~10 m (Bradley et al., 2020). Raised beaches in the north and submerged forests in the south reflect this differential motion. In the English Channel, fluvial erosion during early deglaciation carved the “Channel River,” later flooded by 8 ka (Mellett et al., 2013). Similar sequences occur along the Irish and Danish coasts, documenting the progressive marine transgression of northwest Europe.
The Post-Glacial Flooding Hypothesis
9. Towards a Global–Regional Synthesis
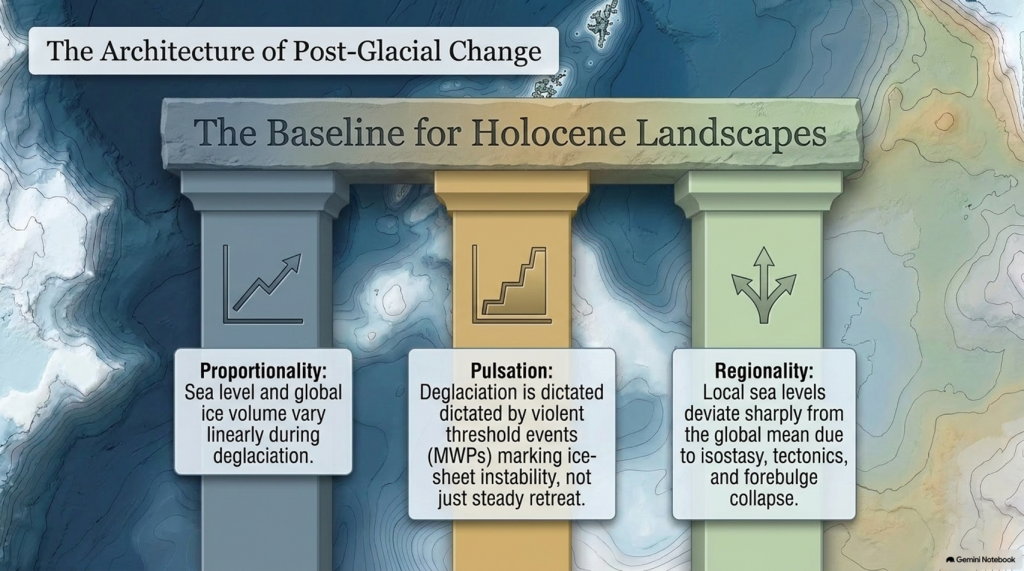
By combining isotopic, coral, and geodetic datasets, modern reconstructions achieve decimetre precision for Holocene sea level (Gowan et al., 2021). Three principles emerge:
Proportionality — Sea level and global ice volume vary linearly during deglaciation.
Pulsation — Superimposed meltwater pulses mark thresholds in ice-sheet stability.
Regionality — Local deviations result from isostasy, tectonics, and sediment compaction.
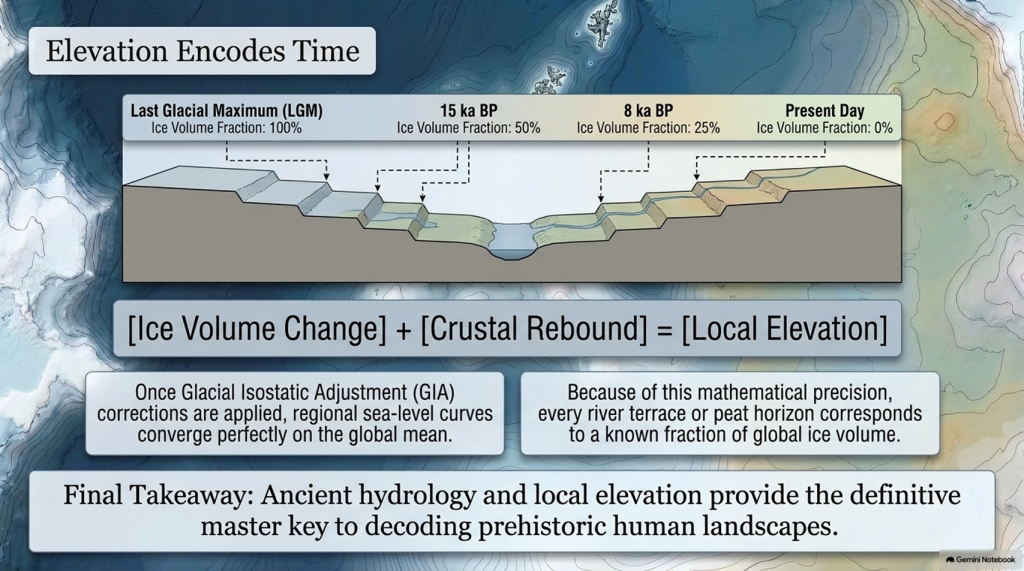
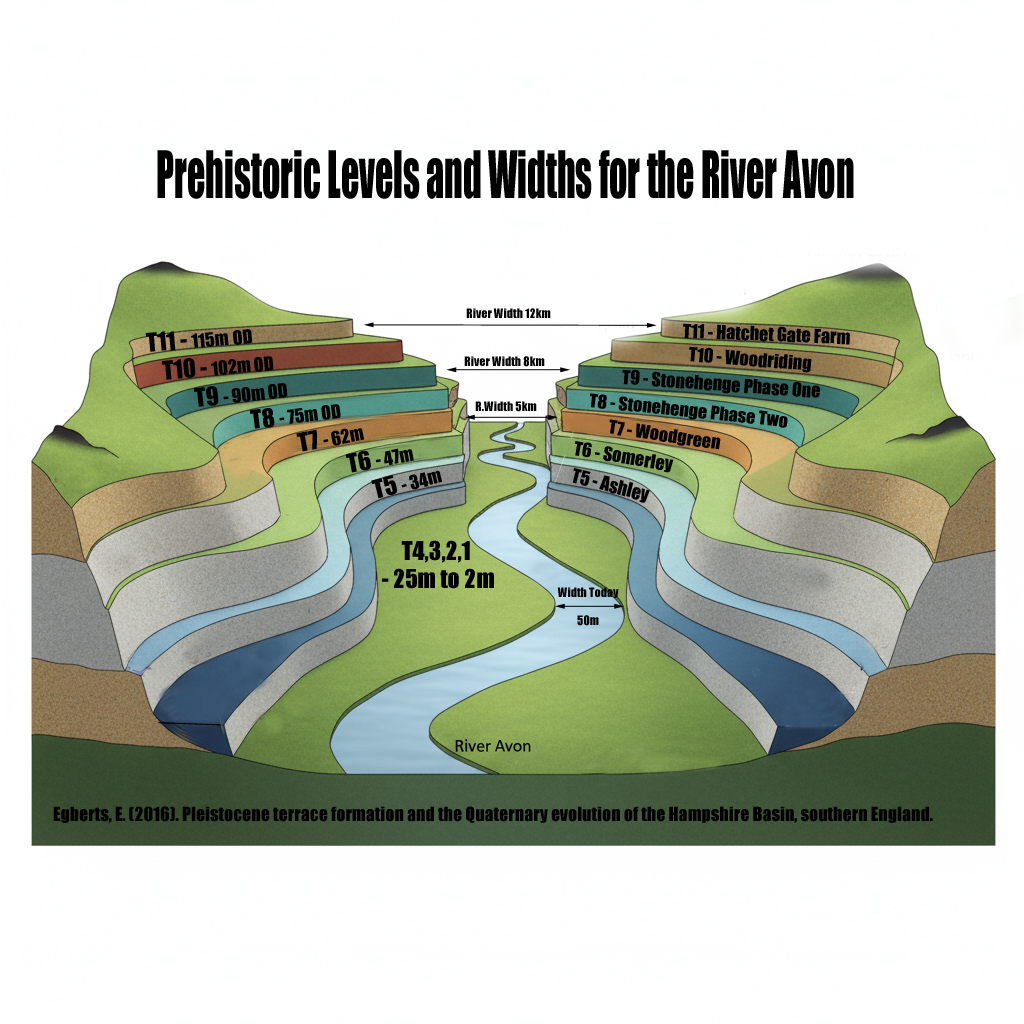
Shennan et al. (2018) synthesised over 500 Holocene RSL indicators for the British Isles, demonstrating that once GIA corrections are applied, regional curves converge on the global mean within analytical error. These findings provide a quantitative baseline for analysing river-terrace altitudes and groundwater histories in later chapters.
Equally important, comparison with modern sea-level observations highlights the extraordinary pace of contemporary change. Satellite altimetry records a mean rise of 3.4 ± 0.4 mm yr⁻¹ since 1993 (Cazenave et al., 2018)—an order of magnitude faster than the late-Holocene background rate (Kopp et al., 2016). The processes that ended the last ice age therefore remain relevant to current climate dynamics.
The Post-Glacial Flooding Hypothesis
10. Conclusion
The end of the last ice age was a planetary event in which ice, water, and rock interacted on colossal scales. Between 26 ka and 7 ka BP, sea level rose more than 120 m, ice sheets vanished from most temperate latitudes, and the hydrological cycle intensified. The evidence—oxygen-isotope curves, coral terraces, basal peats, and glacio-isostatic models—forms a coherent narrative of gradual yet punctuated change.
These quantitative reconstructions define the environmental backdrop for all Holocene landscapes. They also establish a principle crucial to later chapters: that elevation within fluvial and coastal systems encodes time, because each terrace or peat horizon corresponds to a known fraction of global ice volume. The following chapter therefore turns from global physics to the mathematical description of flooding itself—the equations that translate ice-volume change into measurable hydrological response.
Plain-Language Conclusion
The ice age was like the planet putting a huge amount of the world’s water into giant freezers on land. When those freezers started to melt:
All that stored water went back into the oceans.
The seas rose by about 120 metres.
The weight of the ice came off the land, so some places bounced up, others sagged down.
Scientists can see this story in:
tiny shells on the sea floor,
old coral reefs now sitting at the “wrong” depths,
layers of mud and peat around coasts.
Put simply:
We froze the oceans on land, then poured them back in. The combination of rising seas and bouncing crust rearranged coastlines everywhere, and we can measure it.
Robert John Langdon, a polymathic luminary, emerges as a writer, historian, and eminent specialist in LiDAR Landscape Archaeology.
His intellectual voyage has been interwoven with stints as an astute scrutineer in government and grand corporate bastions, a tapestry spanning British Telecommunications, Cable and Wireless, British Gas, and the esteemed University of London.
A decade hence, Robert’s transition into retirement unfurled a chapter of insatiable curiosity. This phase saw him immerse himself in Politics, Archaeology, Philosophy, and the enigmatic realm of Quantum Mechanics. His academic odyssey traversed the venerable corridors of knowledge hubs such as the Museum of London, University College London, Birkbeck College, The City Literature Institute, and Chichester University.
In the symphony of his life, Robert is a custodian of three progeny and a pair of cherished grandchildren. His sanctuary lies ensconced in the embrace of West Wales, where he inhabits an isolated cottage, its windows framing a vista of the boundless sea – a retreat from the scrutinising gaze of Her Majesty’s Revenue and Customs, an amiable clandestinity in the lap of nature.
Exploring Prehistoric Britain: A Journey Through Time
My blog delves into the fascinating mysteries of prehistoric Britain, challenging conventional narratives and offering fresh perspectives grounded in cutting-edge research, particularly LiDAR technology. I invite you to explore some key areas of my research. For example, the Wansdyke, often cited as a defensive structure, is re-examined in light of new evidence. I’ve presented my findings in my blog post Wansdyke: A British Frontier Wall – ‘Debunked’, and a Wansdyke LiDAR Flyover video further visualises my conclusions.
My work also often challenges established archaeological dogma. I argue that many sites, such as Hambledon Hill, commonly identified as Iron Age hillforts, are not what they seem. My posts Lidar Investigation Hambledon Hill – NOT an ‘Iron Age Fort’ and Unmasking the “Iron Age Hillfort” Myth explore these ideas in detail and offer an alternative view. Similarly, sites like Cissbury Ring and White Sheet Camp receive re-evaluations based on LiDAR analysis in my posts “Lidar Investigation Cissbury Ring through time”and “Lidar Investigation White Sheet Camp,“ revealing fascinating insights into their true purpose. I have also examined South Cadbury Castle, often linked to the mythical Camelot56.
My research also extends to ancient water management, including the role of canals and other linear earthworks. I have discussed the true origins of Car Dyke in multiple posts, including Car Dyke – ABC News Podcast and Lidar Investigation Car Dyke – North Section, which suggest a Mesolithic origin 2357. I also explore the misidentification of Roman aqueducts, as seen in my posts on the Great Chesters (Roman) Aqueduct. My research has also been greatly informed by my post-glacial flooding hypothesis, which has helped explain landscape transformations over time. I have discussed this hypothesis in several posts, including AI now supports my Post-Glacial Flooding Hypothesis and Exploring Britain’s Flooded Past: A Personal Journey
For those interested in British Prehistory, visit www.prehistoric-britain.co.uk, a comprehensive resource featuring an extensive collection of archaeology articles, modern LiDAR investigations, and groundbreaking research. The site also includes insights and excerpts from the acclaimed Robert John Langdon Trilogy, a series of books that explore Britain during the Prehistoric period. Titles in the trilogy include The Stonehenge Enigma, Dawn of the Lost Civilisation, and The Post-Glacial Flooding Hypothesis, which offer compelling evidence of ancient landscapes shaped by post-glacial flooding.
To further explore these topics, Robert John Langdon has developed a dedicated YouTube channel featuring over 100 video documentaries and investigations that complement the trilogy. Notable discoveries and studies showcased on the channel include 13 Things that Don’t Make Sense in History and the revelation of Silbury Avenue – The Lost Stone Avenue, a rediscovered prehistoric feature at Avebury, Wiltshire.
In addition to his main works, Langdon has released a series of shorter, accessible publications, ideal for readers delving into specific topics. These include:
For active discussions and updates on the trilogy’s findings and recent LiDAR investigations, join our vibrant community on Facebook. Engage with like-minded enthusiasts by leaving a message or contributing to debates in our Facebook Group.
Whether through the books, the website, or interactive videos, we aim to provide a deeper understanding of Britain’s fascinating prehistoric past. We encourage you to explore these resources and uncover the mysteries of ancient landscapes through the lens of modern archaeology.
For more information, including chapter extracts and related publications, visit the Robert John Langdon Author Page. Dive into works such as The Stonehenge Enigma or Dawn of the Lost Civilisation, and explore cutting-edge theories that challenge traditional historical narratives.
This article was first written as a critique of the 2020 television interpretation of the Durrington Walls “mega-monument” — the claim that a broken arc of large pits around Durrington Walls represented a vast Late Neolithic ceremonial structure. (The Durrington Mega-Monument Hoax: What Lies Beneath? – Debunked)
At the time, the central problem was already clear: the programme and the published interpretation began with monuments, alignments and ritual meaning, when they should have begun with the physical landscape.
That criticism has now become much stronger.
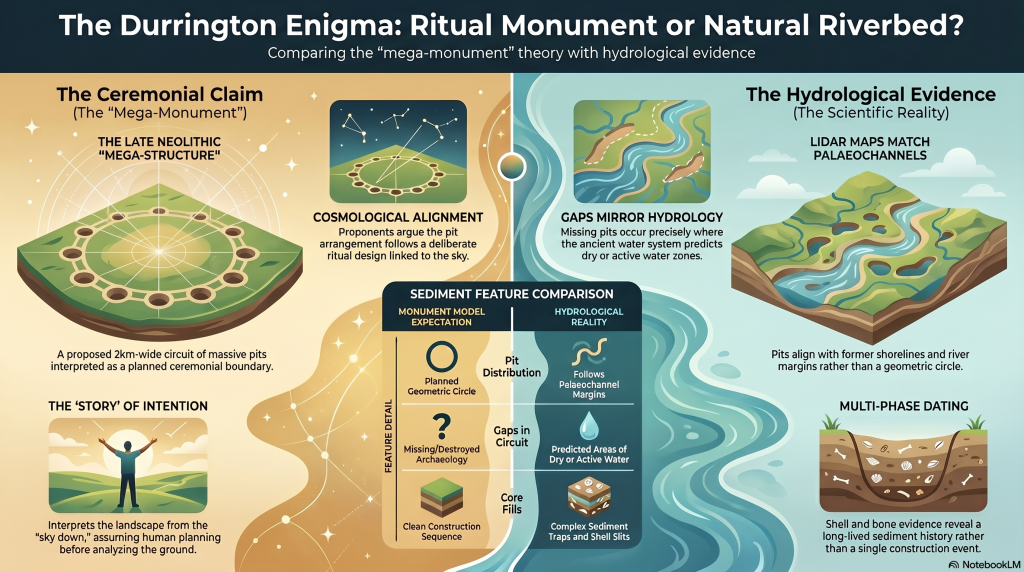
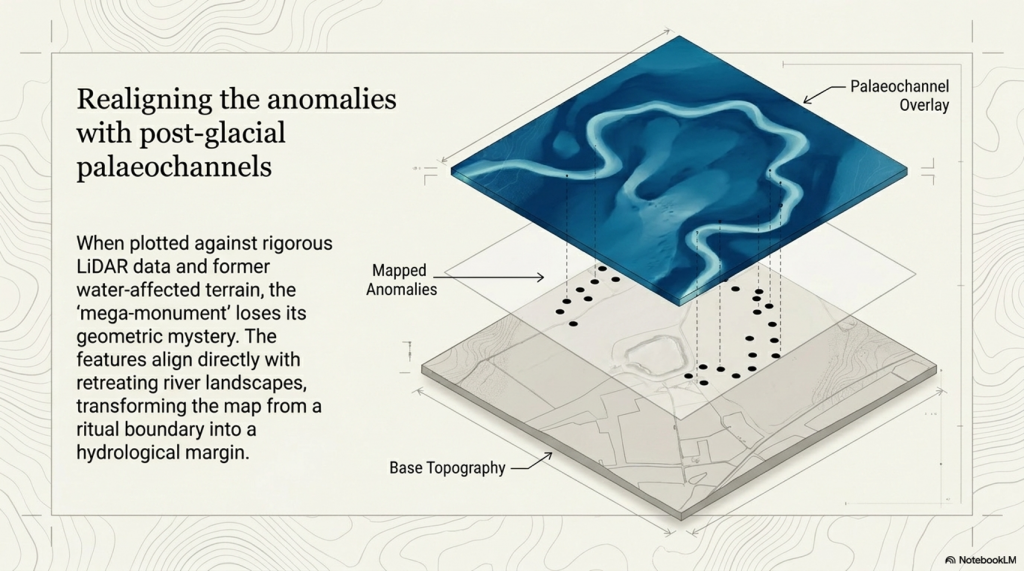
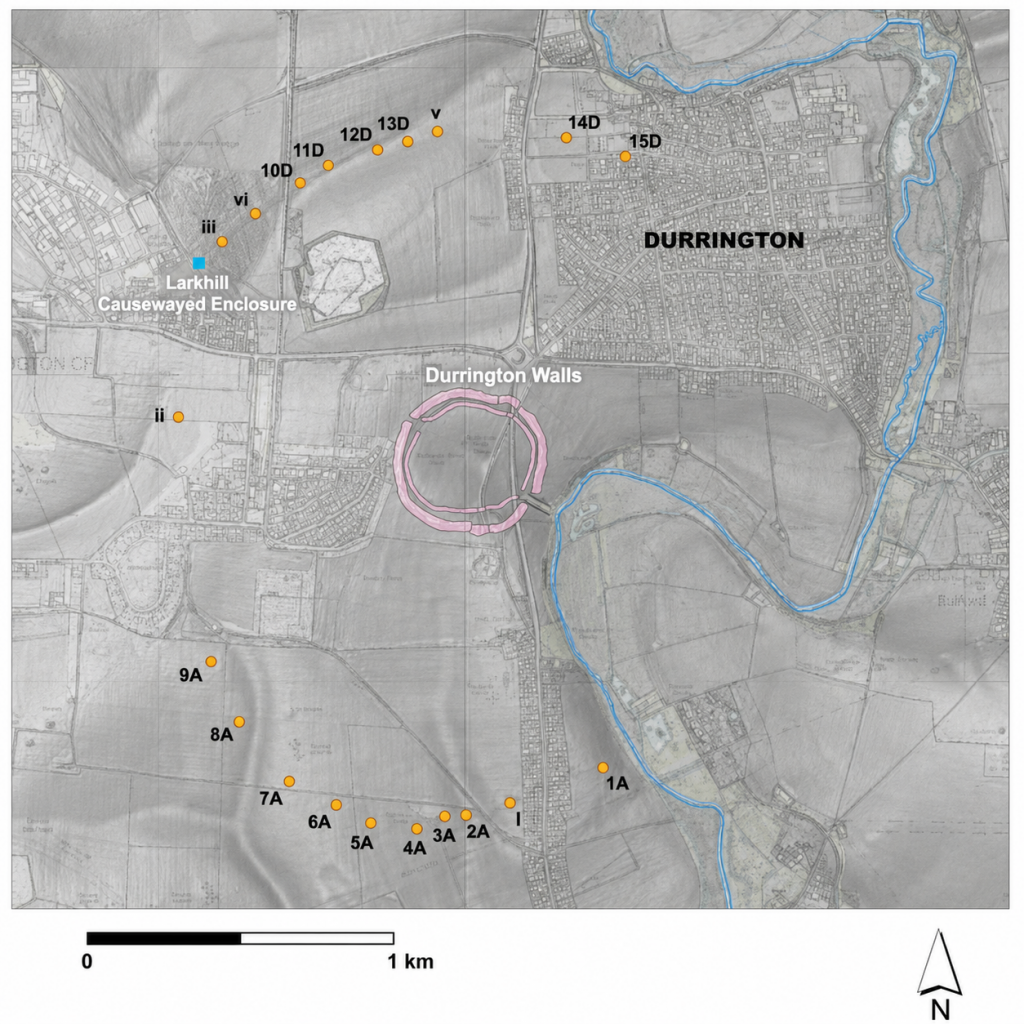
The Durrington pits have now been plotted against LiDAR data, palaeochannels, and former water-affected terrain. That changes the question completely. The issue is no longer simply whether large pits exist around Durrington Walls. Some clearly do. The question is whether those pits form a single planned monument — or whether they are large pits, hollows, modified natural features and sediment traps sitting along former river margins.
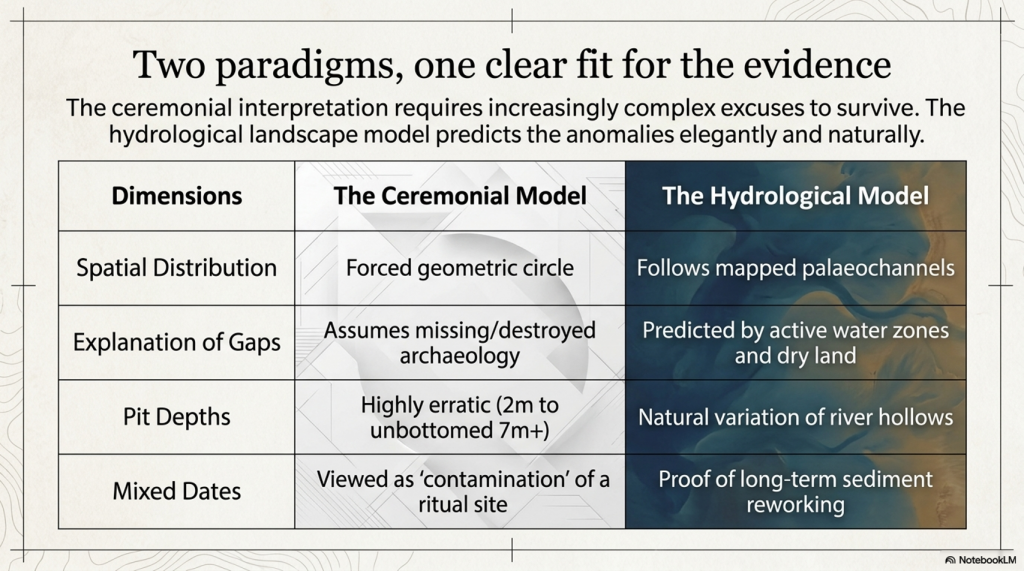
Once the credible pits are mapped against the hydrological landscape, the strange broken “circle” begins to look very different. The pits appear to fit former palaeochannel and shoreline zones. The gaps in the supposed monument are not mysterious missing sections. They are exactly what a water-margin model would predict: areas that were either dry ground outside the former water system, or areas that were once active water where pits would not be dug, would not survive, or would be hidden beneath later river deposits.
This is the key point missed in the original interpretation.
A broken ring of pits does not automatically become a monument because it can be drawn as a circle on a map. A line of holes does not automatically become ritual because it can be linked to the sky. Archaeology has to explain the ground first.
(The Durrington Mega-Monument Hoax: What Lies Beneath? – Debunked)
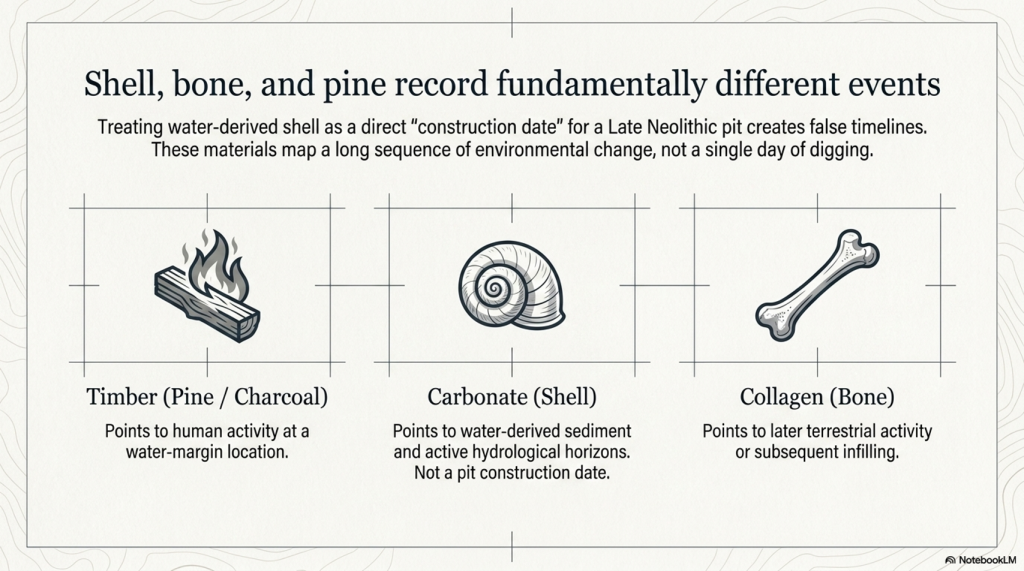
The dating evidence also needs to be understood correctly. The Stonehenge Mesolithic post-hole evidence comes from pine wood or charcoal. The Durrington evidence includes shell-bearing deposits from a water-affected chalk landscape. These are different types of material, and they should not be treated as if they all give the same kind of direct construction date.
But that is not the argument being made here.
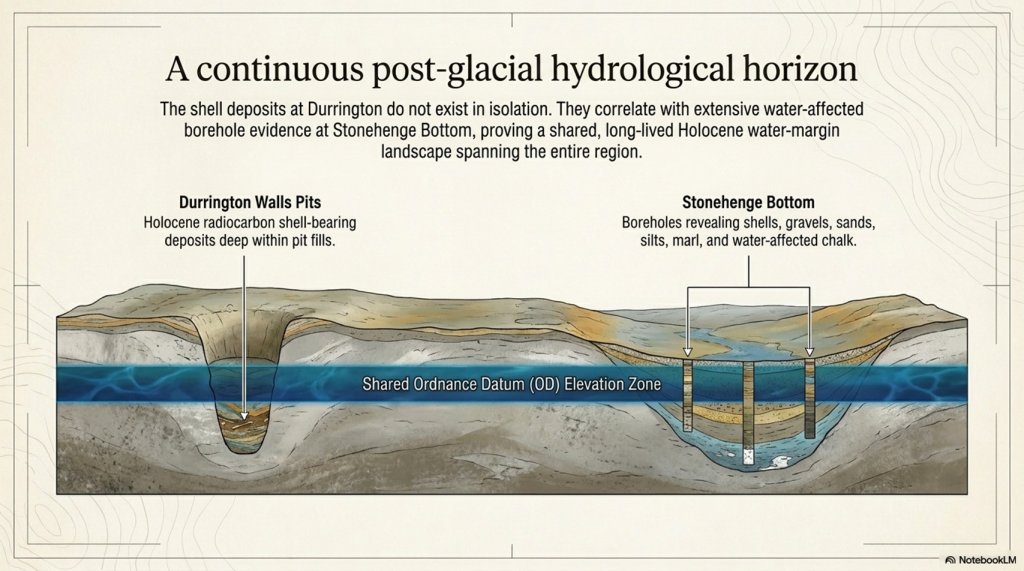
The point is not that every date is exact, identical or directly comparable. The point is that dated and datable evidence appears repeatedly within the same hydrological elevation band. The Stonehenge post-hole evidence shows early Mesolithic activity at a water-margin level. The Durrington shell-bearing horizons show water-derived material at comparable OD levels in the wider landscape. The Stonehenge Bottom boreholes show the same broader pattern of shells, gravels, silts, organic matter, and water-affected deposits.
Taken together, these are not isolated oddities.
They suggest a long-lived water-margin landscape.
This is why the Durrington shell-bearing deposits are so important. They should not be forced into the role of simple “construction dates” for a Late Neolithic monument. Their greater value lies in their ability to record water-derived material at measurable depths and OD levels within the pit system. When those levels correspond with the Stonehenge Bottom borehole evidence and the wider Mesolithic activity horizon, the pattern becomes hydrological rather than ceremonial.
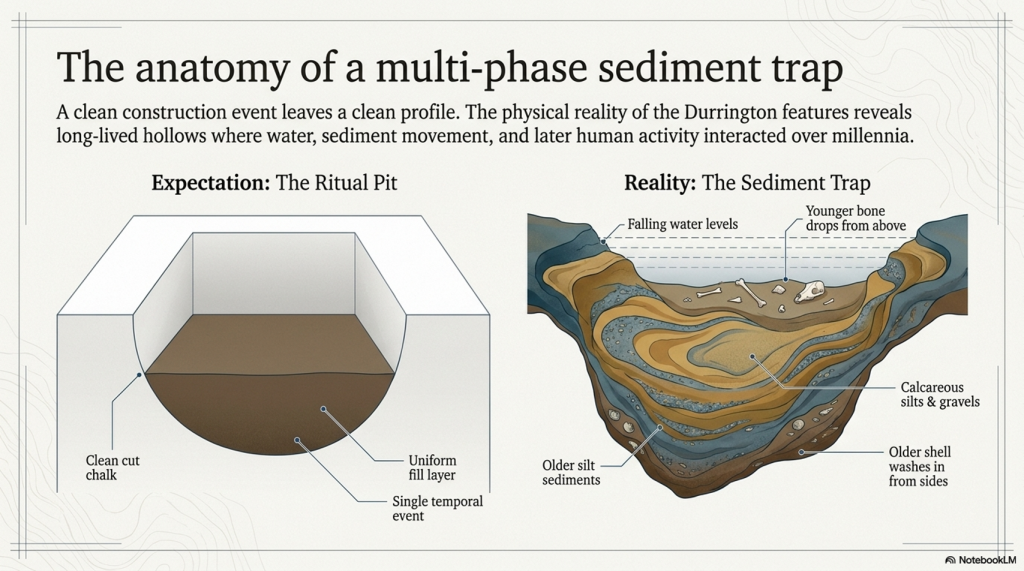
The core evidence is equally awkward for the monument model. Several of the Durrington features contain complex sediments, shell-bearing deposits, calcareous silts, bone, charcoal, flint and reworked material. One of the major features was not even bottomed at seven metres. This is not the clean profile of a single, uniform ceremonial construction event. It is the profile of a long-lived and repeatedly altered landscape.
The 2025 reassessment added more scientific techniques, including further geophysics, boreholes, chemostratigraphy, OSL work and environmental analysis. But the central interpretive problem remains. The new science still has not properly tested the simplest physical explanation: that the pit distribution follows former water margins better than it follows an idealised ritual circle.
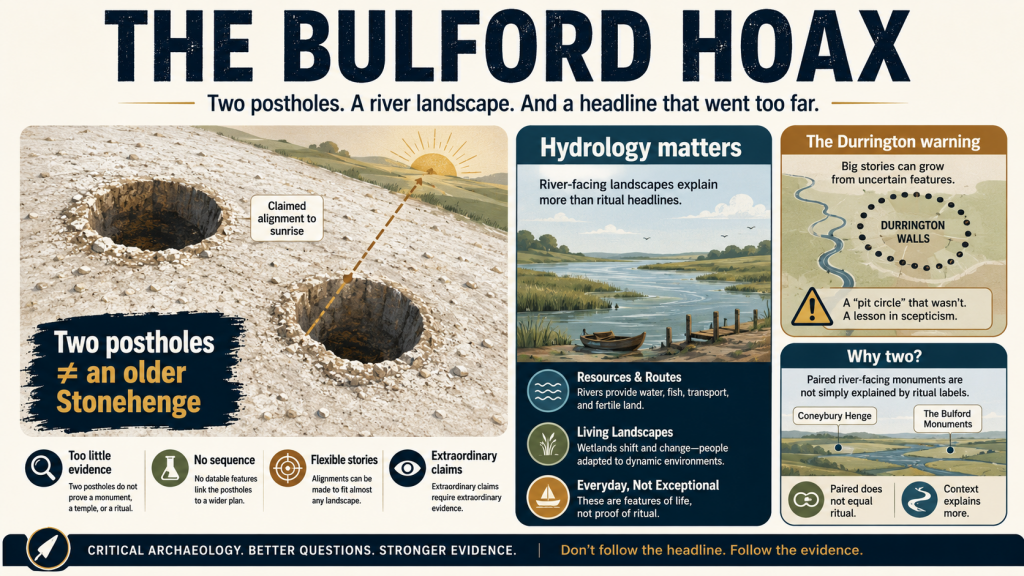
This matters because the same interpretive failure has now reappeared at Bulford. There, two postholes have been promoted as evidence for solar alignment and an “older Stonehenge” style monument before the river-facing landscape, palaeochannels, hydrology and full dating evidence have been properly tested. Durrington and Bulford are not separate mistakes. They are examples of the same problem: pits and postholes are being turned into cosmology before the landscape beneath them has been understood.
This article has therefore been rewritten.
The aim is no longer simply to debunk a television programme. It is to show that the Durrington “mega-monument” may be a classic case of archaeological over-interpretation: a hydrological landscape misread as a ritual structure.
What lies beneath Stonehenge is not just ceremony.
It is water, sediment, shoreline, retreating rivers, buried soils, shell-bearing deposits and a post-glacial landscape that archaeology has still not properly faced.
(The Durrington Mega-Monument Hoax: What Lies Beneath? – Debunked)
1. The Claim Sold to the Public
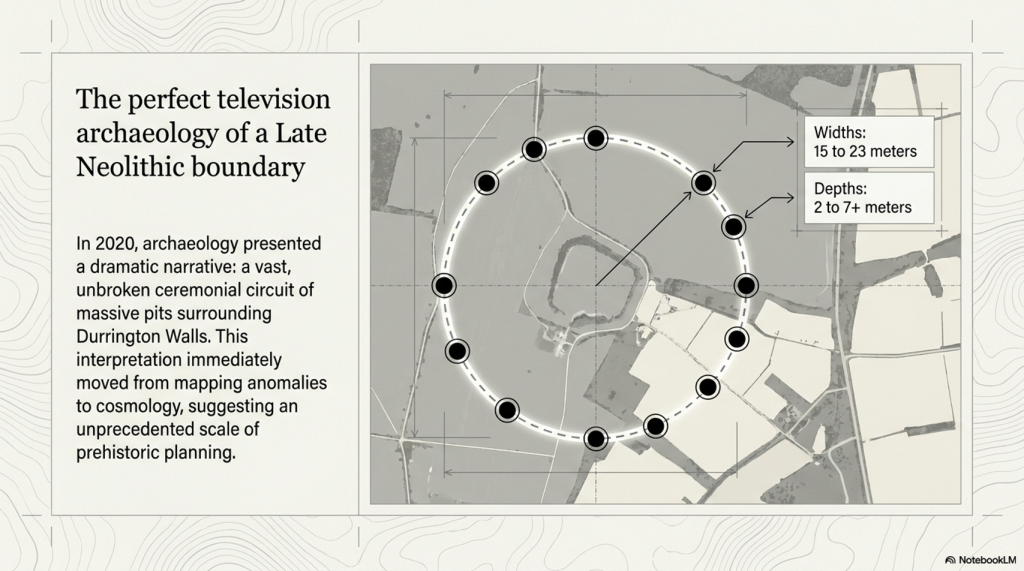
In 2020, the public was presented with one of the most dramatic claims about the Stonehenge landscape in years: a vast circle or circuit of massive pits surrounding Durrington Walls.
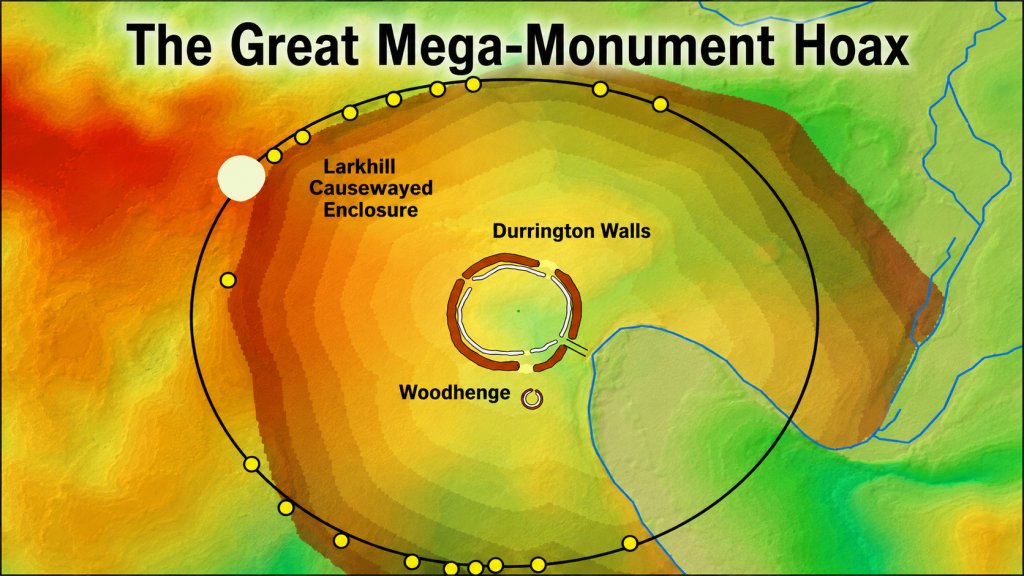
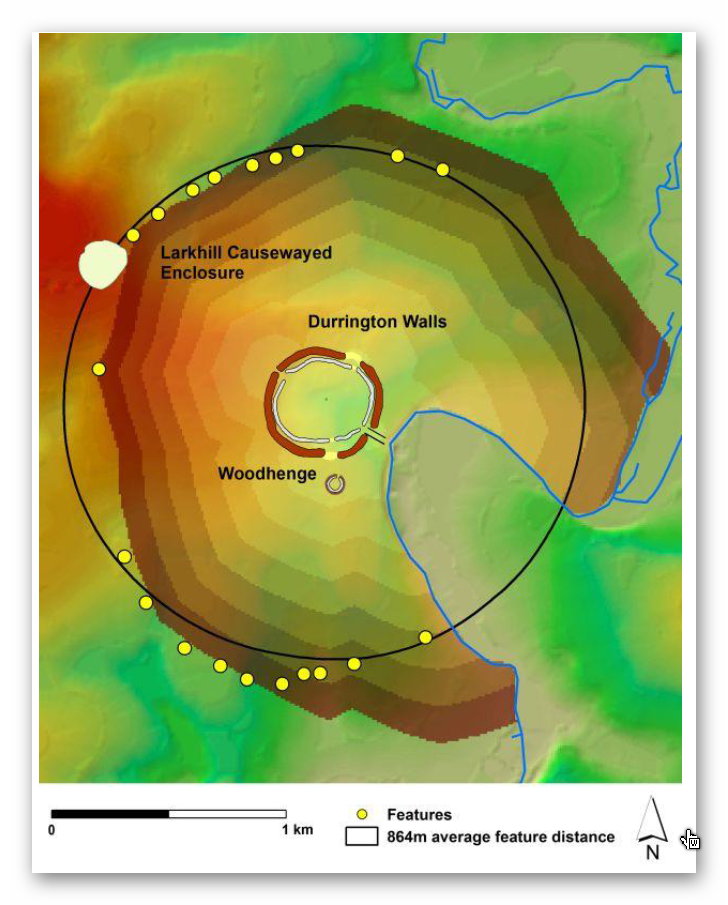
The story was simple and powerful. Large pits, some around twenty metres wide and several metres deep, appeared to form a broken arc around Durrington Walls henge. Larkhill causewayed enclosure seemed to sit within the wider arrangement. The pattern was then interpreted as a huge Late Neolithic structure: a boundary, a ceremonial landscape marker, perhaps even a cosmological monument on a scale previously unrecognised in Britain.
It was perfect television archaeology.
There were hidden features beneath the fields. There was a giant lost monument. There was Stonehenge nearby. There were alignments, boundaries, ritual landscapes and the suggestion that Neolithic people had organised the land at an almost unimaginable scale.
But the problem was not the discovery of the pits.
The problem was the story built around them.
A group of large pits does not automatically prove the existence of a single monument. A broken arc does not automatically prove a planned circle. A pattern on a map does not become ceremonial simply because it can be drawn neatly around a famous henge.
Before the pits are turned into cosmology, the landscape itself has to be explained.
That is where the 2020 interpretation failed.
The 2020 paper presents the features as large pits/anomalies forming arcs around Durrington Walls, and offers a broader interpretation that leans toward a large-pit structure or boundary around the henge.
(The Durrington Mega-Monument Hoax: What Lies Beneath? – Debunked)
2. The First Problem: Spatial Pattern Is Not a Construction Event
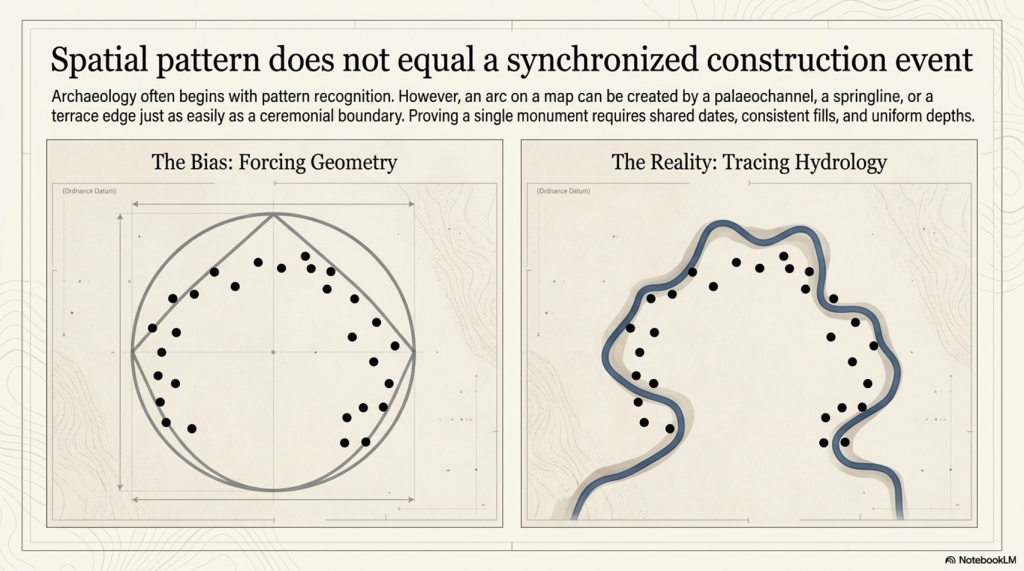
The first problem with the Durrington “mega-monument” interpretation is simple: a spatial pattern is not the same thing as a construction event.
Archaeology often begins with pattern recognition. That is fair enough. If a group of large features appears to form an arc, a circle or a boundary, it deserves investigation. But pattern recognition is only the beginning of analysis. It is not the conclusion.
To prove that the Durrington pits formed a single planned monument, we would need more than a broken arrangement on a map. We would need evidence that the pits were made as part of the same project.
That means asking basic questions.
Were they dug at the same time?
Were they made by the same method?
Do they have consistent dimensions?
Do they have consistent depths?
Do they contain comparable fills?
Do they share the same dating horizon?
Do they show the same construction sequence?
Do they have a clear structural purpose?
Do they relate to posts, banks, ditches or entrances in a consistent way?
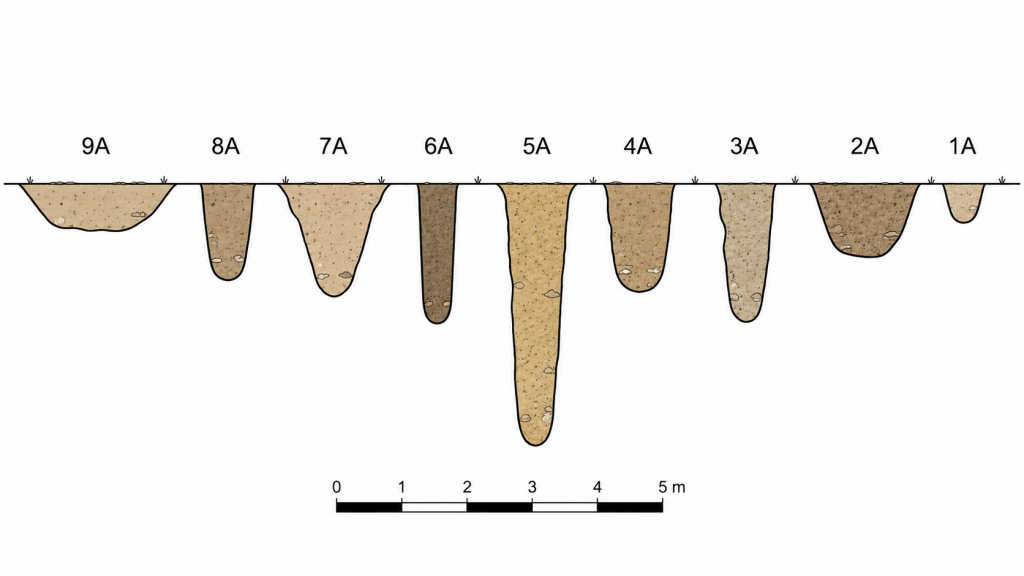
The variuos sized pit shapes and depths is a very clear indication they are not connected – (The Durrington Mega-Monument Hoax: What Lies Beneath? – Debunked)
Without that evidence, the “mega-monument” remains an interpretation placed over a group of features, not a demonstrated construction event.
The published evidence does not show a neat, uniform monument. It shows a mixed landscape of large anomalies, pits, probable pits, possible modified natural features, post alignments, uncertain features, different survey methods, varying levels of excavation, different dates, and varying degrees of confidence.
Some features are known mainly from geophysics. Some were partly excavated. Some were cored. Some were not bottomed. Some were originally interpreted as natural sinkholes or solution hollows. Some have Late Neolithic evidence. Others have Bronze Age, Iron Age, Romano-British or even later material. Feature ii remains particularly weak and should not be used as a secure part of any argument.
This is not how a clean single-event monument should behave.
The dimensions also vary. The published tables show upper diameters ranging from roughly fifteen to twenty-three metres. Depths vary from around two metres to more than seven metres, with several features not bottomed. That is a major problem if the claim is a single designed monument with a shared purpose.
Variation is not fatal by itself. Ancient monuments do not have to be machine-perfect. But variation in size, depth, date, evidence type, fill history, and certainty must be explained before the features are treated as a single structure.
The Durrington interpretation moves too quickly from “these features appear to form arcs” to “these features form a monumental circuit”.
That leap is the problem.
A shoreline can create an arc.
A palaeochannel can create an arc.
A terrace edge can create an arc.
A springline can create an arc.
A former river margin can result in a broken, irregular distribution of large water-affected features.
So, before the pits are treated as a planned ritual boundary, the physical landscape must be tested first. If the same pattern can be explained by palaeochannels, former shorelines and falling water levels, then the monument interpretation is no longer the simplest explanation.
It becomes more complicated.
(The Durrington Mega-Monument Hoax: What Lies Beneath? – Debunked)
3. The 2026 LiDAR Test: The Pits Fit Palaeochannels
The most important new evidence is not another theory.
It is the map.
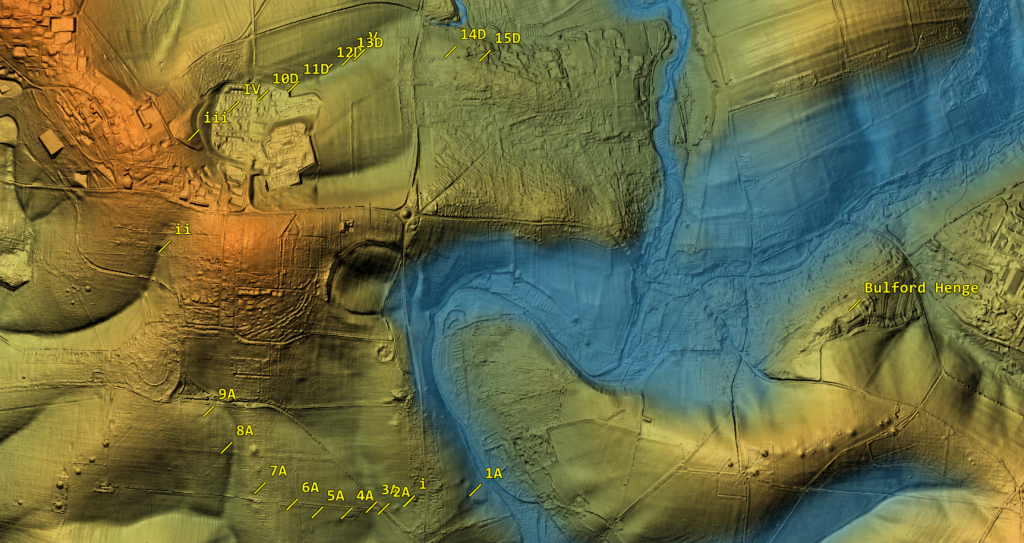
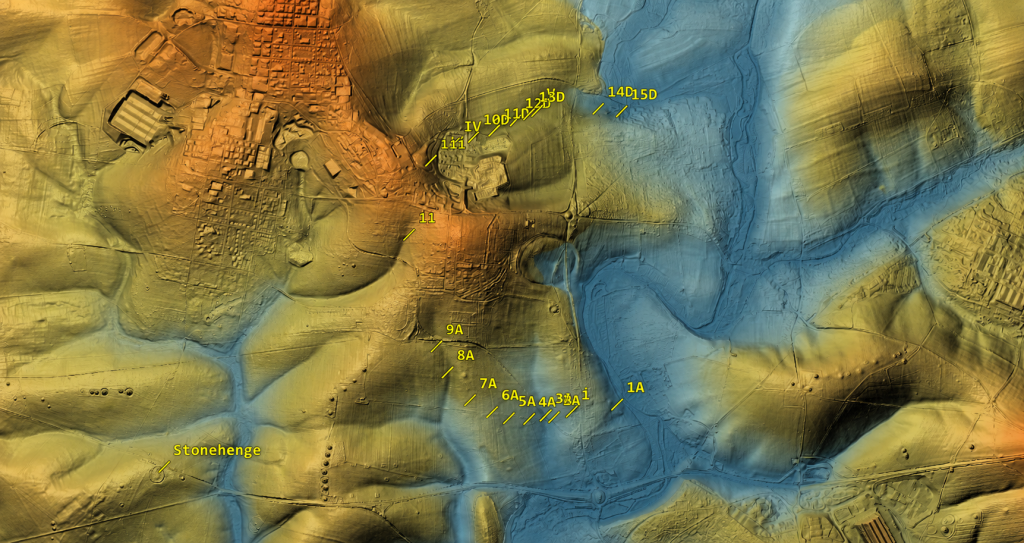
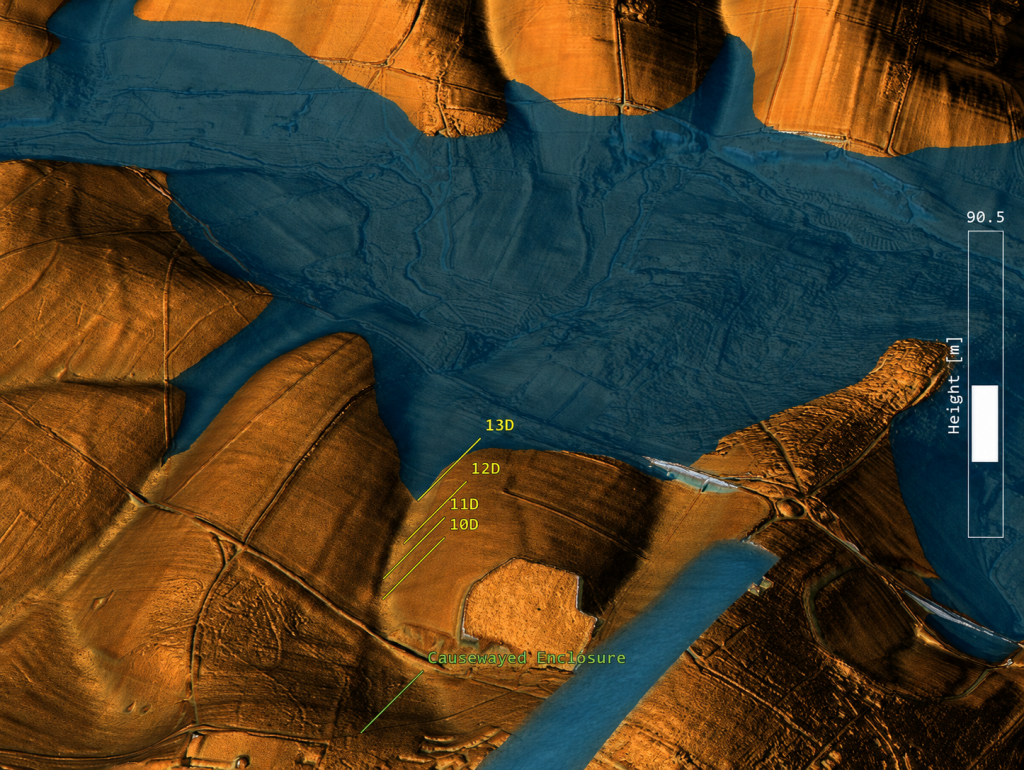
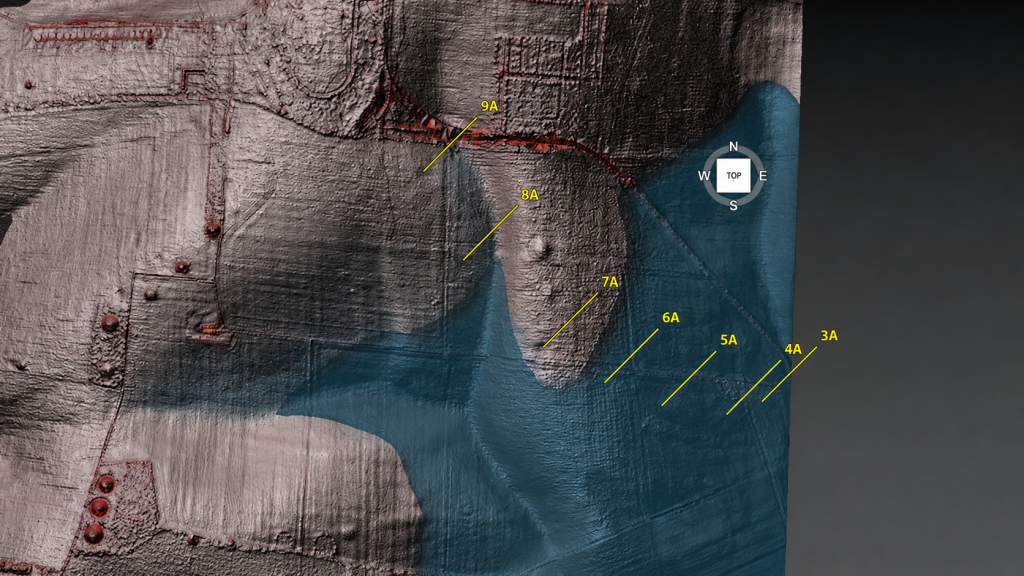
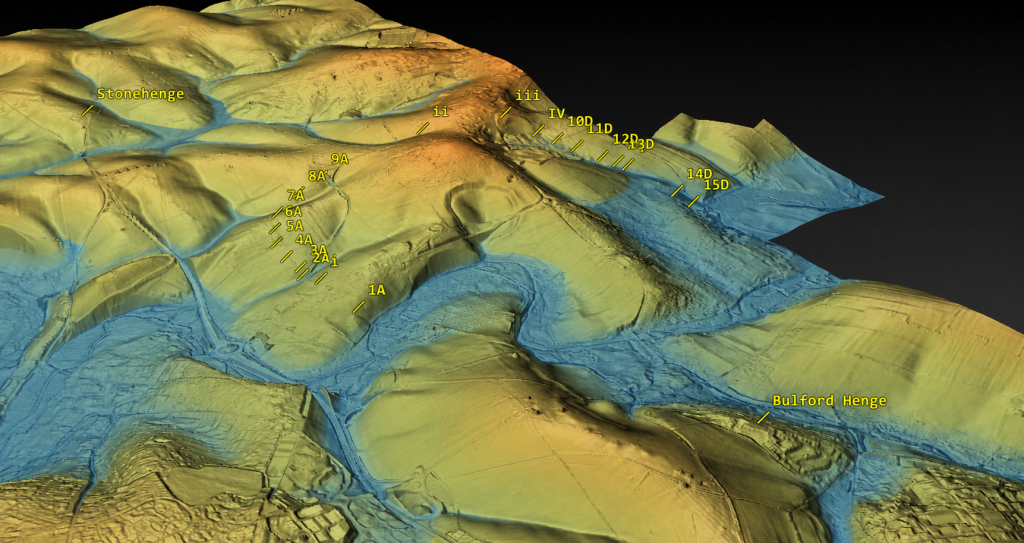
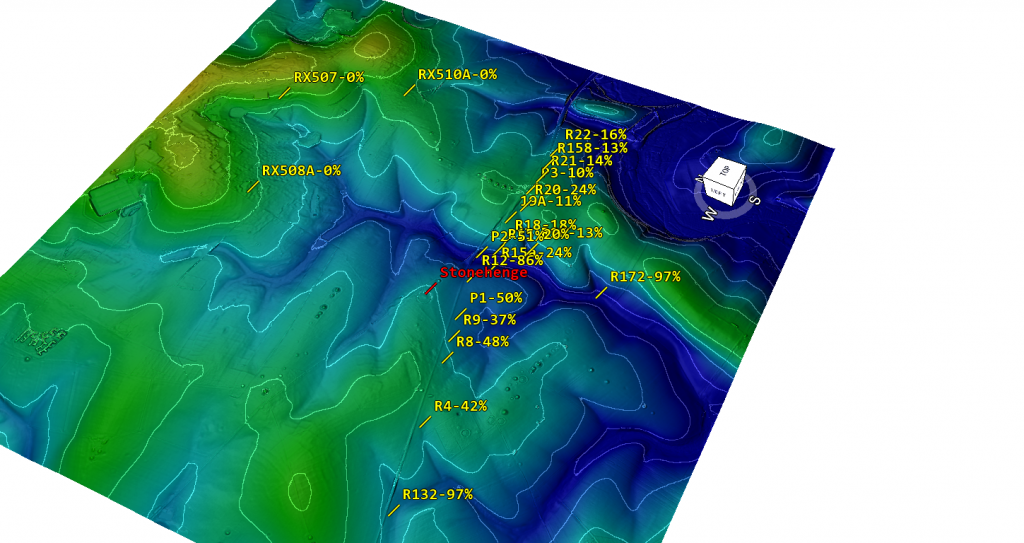
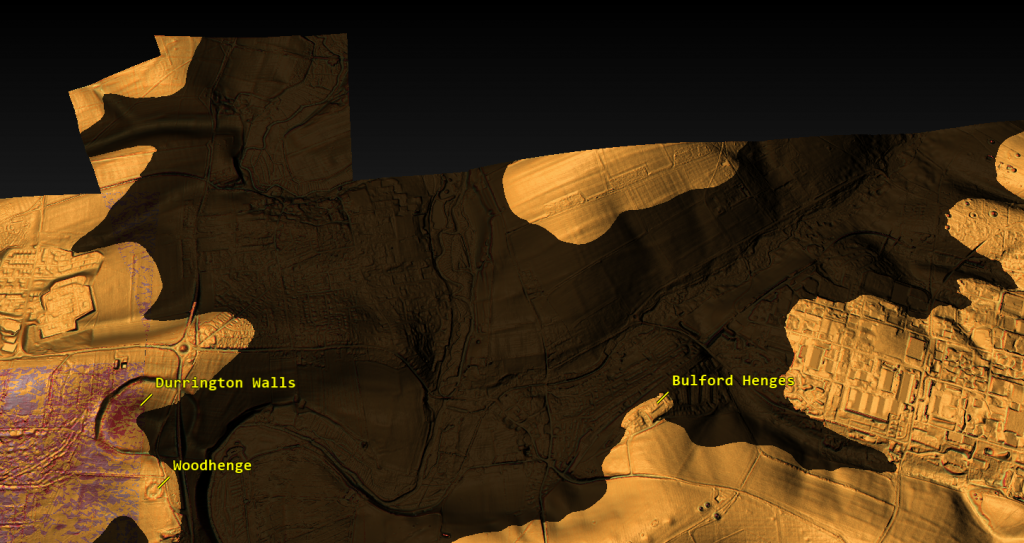
When the Durrington pits are plotted against LiDAR data, palaeochannels, and former water-affected terrain, the supposed “mega-monument” begins to lose its mystery. The pattern no longer looks like a clean, planned circle around Durrington Walls. It looks like a broken distribution of large features sitting on, beside, or within former water-margin terrain.
That changes the interpretation completely.
The credible pits appear to follow palaeochannels and former shoreline zones. They do not need to be forced into a ceremonial circuit to make sense. They make sense as features associated with a changing river landscape.
(The Durrington Mega-Monument Hoax: What Lies Beneath? – Debunked)
This also explains the gaps.
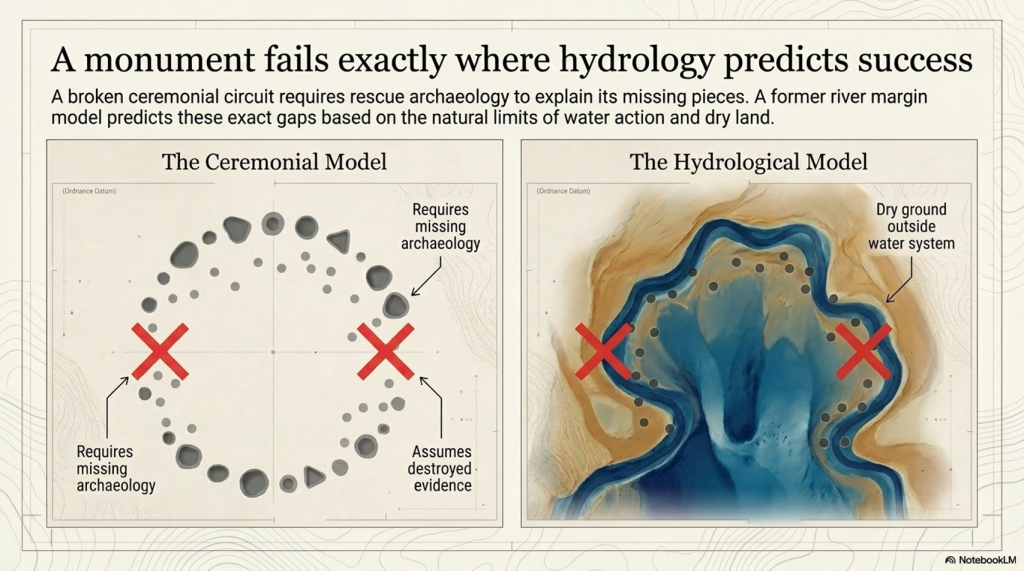
In the monument model, the gaps are awkward. A huge ceremonial circle with missing sections needs an explanation: lost archaeology, unsurveyed areas, incomplete construction, later destruction, or symbolic absence.
In the hydrological model, the gaps are expected.
Where the land was not affected by the former water system, there is no reason to expect shoreline pits or water-margin sediment traps. Where the ground was once active water, there is also no reason to expect the same kind of pit survival. Features could have been unnecessary, impossible to dig, scoured away, buried beneath later alluvium, or masked by later river change.
So the gaps are not a weakness in the hydrological model.
They are one of its strongest predictions.
This is the point missed by the 2020 interpretation. The question should never have been simply, “Can these features be drawn as a circuit?” The proper question was, “Do these features fit the former river landscape better than they fit an idealised monument?”
Once that test is applied, the answer becomes difficult to ignore.
The pits fit the palaeochannels.
The gaps fit the palaeochannels.
The strange distribution fits the palaeochannels.
Feature ii remains questionable and should not be used to hold the model together. But once that weak outlier is removed, the remaining pattern becomes clearer. The credible features sit where a water-margin model would expect them to sit, while the missing sections occur where a water-margin model would expect them to be missing.
That is not a coincidence. That is landscape logic.
This does not mean every pit must have had the same origin or function. Some may be cut features. Some may be modified natural hollows. Some may be sediment traps. Some may have been reused. Some may have begun naturally and later acquired cultural material. That is exactly what we should expect in a complex river-edge landscape active over long periods.
What it does mean is that the “single mega-monument” interpretation is no longer the simplest explanation.
A ritual circle has to explain why the pits vary so much, why some are doubtful, why the dates are mixed, why several fills look reworked, why the circuit is broken, and why the missing parts occur where the hydrology predicts absence.
The palaeochannel model explains all of that more naturally.
The Durrington pits are not just dots around a henge.
They are features in a post-glacial river landscape.
Until the published interpretation can show that the pit distribution is better explained by monument geometry than by palaeochannels and former shorelines, the “mega-monument” claim remains unproven.
(The Durrington Mega-Monument Hoax: What Lies Beneath? – Debunked)
4. The Gap Problem: A Monument Fails Where Hydrology Predicts Success
The gaps in the Durrington pit distribution are not a minor detail.
They are the test.
If the pits are interpreted as a single planned monument, the missing sections become a problem. A vast ceremonial circuit should have a clear design logic. If large parts of that circuit are absent, the explanation has to be added afterwards: perhaps the pits were destroyed, perhaps they were never found, perhaps they were not visible to survey, perhaps the monument was incomplete, or perhaps the gaps had some symbolic meaning.
That is not evidence.
That is rescue archaeology for a weak interpretation.
In the hydrological model, the gaps do not need to be rescued. They are predicted by the landscape.
Where the former water system did not reach, there is no reason to expect water-margin pits, shoreline hollows, sediment traps or shell-bearing deposits. Where the former water zone was active, unstable or actually underwater, there is also no reason to expect the same type of pit survival. Features could have been impossible to dig, unnecessary, eroded, buried, masked, or replaced by later river deposits.
(The Durrington Mega-Monument Hoax: What Lies Beneath? – Debunked)
This is why the broken pattern matters.
The apparent gap on one side of the supposed circuit corresponds with land that does not fit the former water-margin model. No shoreline, no pits.
The apparent gap on the other side corresponds with ground that was once within the active Avon/water system. Active water does not preserve a neat ceremonial pit circuit. It cuts, scours, silts, masks and moves.
So what looks like a failed monument becomes a successful hydrological prediction.
The monument model has to explain why the circuit is missing where it is missing.
The water model already explains it.
This is the central weakness of the “mega-monument” claim. The interpretation begins by drawing a circle and then struggles to explain the broken evidence. But if the pits are plotted against palaeochannels and former shorelines first, the broken pattern is no longer broken. It is exactly what a changing river-edge landscape should produce.
The gaps are not missing archaeology.
They are the landscape telling us that the original interpretation started in the wrong place.
(The Durrington Mega-Monument Hoax: What Lies Beneath? – Debunked)
5. The Dating Problem: Shell, Bone and Pine Are Not the Same Evidence
The dating evidence at Stonehenge and Durrington must be handled carefully because not all radiocarbon samples date the same event.
This is where confusion can easily enter the argument.
The Mesolithic post-hole evidence at Stonehenge is associated with pine wood or charcoal. That kind of sample dates human activity involving timber. It does not date the river directly. It tells us that people were active at that location, at that period, and within that landscape setting.
The Durrington shell evidence is different. Shell is not timber. Shell is a carbonate material from a water-affected environment. It is therefore more useful here as evidence for shell-bearing, water-derived sediment at a particular depth and OD level than as a simple “construction date” for a pit.
That distinction matters.
The argument being made here is not that pine charcoal, shell and bone are all identical samples giving identical meanings. They are not.
The argument is that different kinds of dated and datable evidence repeatedly occur within a coherent hydrological landscape.
Pine or charcoal can show human activity at a water-margin location.
Shell can show water-derived material within a specific sediment horizon.
Bone can provide a terrestrial date for later activity, deposition or infilling within the same feature.
These are different kinds of evidence, but together they help build a landscape sequence.
This is why the Durrington shell dates should not be dismissed simply because they differ from bone dates. The report itself recognised that the shell dates do not behave like simple construction dates. That is true. But that does not make the shells meaningless. It means they are telling us something different.
They are not necessarily dating the moment a pit was dug.
(The Durrington Mega-Monument Hoax: What Lies Beneath? – Debunked)
They are dating, or at least period-associating, shell-bearing material within the water-affected sediment system.
For a dry-land monument model, that is awkward.
For a hydrological model, it is exactly the kind of evidence we would expect.
The Durrington shell horizons occur within deep, complex, calcareous and reworked deposits. Their value is not that they provide a neat construction date for a Late Neolithic monument. Their value lies in their placement of shell-bearing, water-derived material at measurable depths within the pit system. Once those depths are converted to OD levels and compared with Stonehenge Bottom, the pattern becomes more important than any single date.
Bone dates have a different role. Bone collagen is a terrestrial sample and is generally more useful for dating later activity or fill events within the pits. But a later bone date does not cancel the hydrological meaning of an earlier shell-bearing horizon. It simply shows that the feature or sediment system remained open, active, reused, reworked or infilled over a long period.
That is the key point.
If a pit contains older shell-bearing material and later bone-bearing deposits, the correct response is not to force the whole feature into one tidy construction date. The correct response is to recognise a multi-phase sediment sequence.
That is exactly what a water-margin landscape should produce.
Material can be washed in.
Older sediment can be reworked.
Shells can be redeposited.
Bone can enter later.
Charcoal can be introduced by human activity.
Silts, gravels and calcareous sediments can accumulate through repeated environmental change.
The dates are therefore not a weakness in the hydrological interpretation. They are part of the reason the dry “single monument” interpretation is so vulnerable.
A single construction event should produce a cleaner chronological pattern.
The Durrington evidence does not.
The shell evidence points to water-derived deposits.
The bone evidence points to later activity or infilling.
The Stonehenge pine evidence points to earlier human activity at a comparable water-margin landscape.
The important connection is not that every sample gives the same date.
It is that the evidence repeatedly appears within the same kind of hydrological setting.
That is why this article does not treat the Durrington shell dates as simple proof that a pit was dug at one exact moment. Instead, they are used as part of a wider hydrological sequence: dated shell-bearing horizons, measurable OD levels, evidence from the Stonehenge Bottom borehole, Mesolithic activity at Stonehenge, and a falling river system that could remain active for centuries or millennia.
This is the difference between dating a monument and dating a landscape.
The 2020 interpretation tried to use the dating evidence to support a Late Neolithic pit structure.
The hydrological interpretation asks a better question:
What do the dates, materials, depths and OD levels tell us about the former river landscape?
Once that question is asked, the evidence stops looking like a problem.
It starts looking like the answer.
(The Durrington Mega-Monument Hoax: What Lies Beneath? – Debunked)
6. The C14 Sequence Does Not Behave Like a Simple Dry Pit
The radiocarbon sequence at Durrington does not behave like a clean, sealed, dry-land pit sequence.
That is a major problem for the “single monument” interpretation.
In a simple dry pit, the dating pattern should normally be fairly straightforward: lower material is generally older. Higher material should generally be younger. If the pit was dug and filled as part of one construction event, the dating should cluster around that event or its immediate aftermath.
That is not what we see.
The Durrington dates are mixed, multi-phase and materially different. They include shells from water-derived deposits and bones from later terrestrial/cultural deposits. That alone should prevent anyone from treating the whole pit system as a simple one-date construction event.
The first issue is the labelling problem.
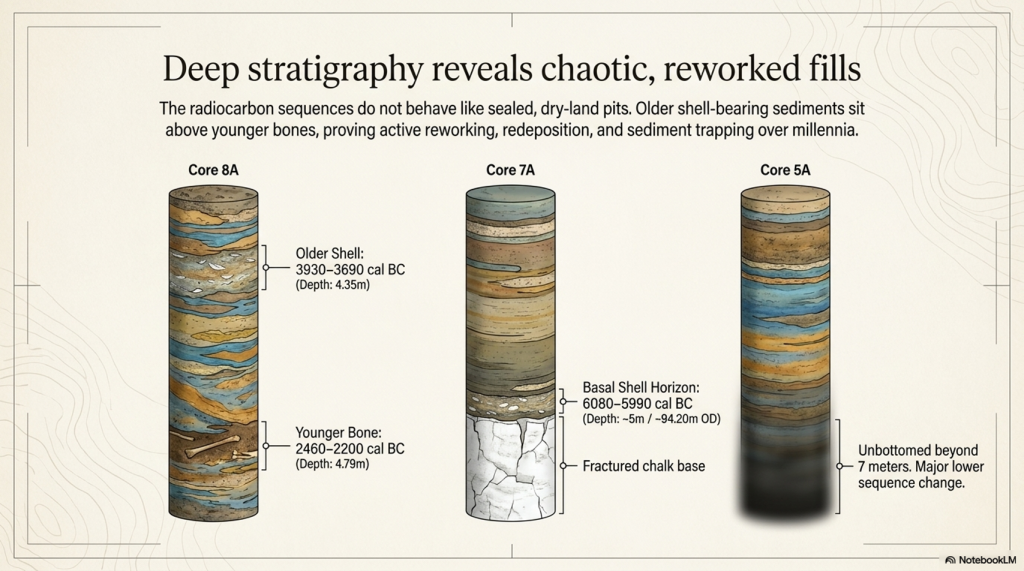
One shell sample, SUERC-92464, is listed from a depth of 4.80–4.85m below ground level and produced a published calibrated date of 6080–5990 cal BC. The feature label is not straightforward. The main paper and core sequence associate BH1 with 7A, while one supplementary radiocarbon listing appears to create a 9A / BH1 confusion.
That matters for database accuracy, but it does not destroy the hydrological argument.
The secure data are the lab number, material, depth and calculated OD horizon. If the surface height used in the LiDAR model is approximately 99m OD, then a sample at 4.80–4.85m below ground sits at about 94.15–94.20m OD. That is the important point. The sample belongs to a shell-bearing horizon at a measurable elevation within the Durrington pit system.
The argument should therefore be anchored to the sample, not the disputed label:
SUERC-92464 shell 4.80–4.85m below ground published date 6080–5990 cal BC approximate modelled horizon c.94.15–94.20m OD feature label requires caution because of the 7A / 9A inconsistency
That is how the evidence should be handled scientifically.
The second issue is 8A.
(The Durrington Mega-Monument Hoax: What Lies Beneath? – Debunked)
Here, the dating sequence is even more revealing.
8A contains a shell date from 1.50–1.55m below ground, published at 4710–4550 cal BC. It also contains a deeper shell date from 4.35–4.40m below ground, published at 3930–3690 cal BC. Then, near the base, bone from around 4.79m produced a much later date, published at 2460–2200 cal BC.
That is not a simple dry-pit sequence.
A neat monument model would struggle with that order. Older shell-bearing material sits above or within a sequence that later includes much younger bone. The fills are not behaving like a single clean construction deposit.
But a water-margin model does not struggle with this.
In a river-edge or palaeochannel landscape, older shell-bearing sediment can be reworked, washed, slumped or redeposited into later features. As water levels fall, channels shift, margins retreat, sediment is disturbed, and older material can be incorporated into younger fills. Later bone, charcoal, flint, or cultural debris can then enter the same feature during subsequent use, collapse, silting, or reworking.
That is not contamination in the casual sense.
It is a landscape process.
The Durrington evidence makes far more sense if the pits are not treated as sealed ceremonial holes but as complex sediment traps within a changing water-margin landscape.
This also explains why shell evidence should not be dismissed simply because it does not match the bone’s date. The shell is not trying to date the pit as a monument. It records shell-bearing, water-derived material within the pit fill. The bone is recording a later terrestrial or cultural event within the same complex sequence.
Those are different facts.
Both matter.
The real problem is the attempt to compress them into one monument story.
The C14 evidence instead points to a long and complex landscape history. Shell-bearing horizons, later bone deposits, reworked sediments, and deep unbottomed features do not support a simple dry-land construction event. They support a multi-phase environment in which water, sediment and later human activity interacted over long periods.
That is exactly what the LiDAR and palaeochannel model predicts.
The dates do not break the hydrological interpretation.
They break the tidy monument story.
(The Durrington Mega-Monument Hoax: What Lies Beneath? – Debunked)
7. The OSL Problem: Where Is the Full Chronology?
The OSL evidence is another major weakness in the Durrington “mega-monument” interpretation.
In the 2020 paper, the luminescence work was not presented as a complete, fully resolved OSL dating model for the pit system. What was published was mainly luminescence stratigraphy: OSL and IRSL signal profiling through selected cores, especially 8A and 5A. That is useful, but it is not the same thing as publishing a full chronological model with all age estimates, dose rates, rejected samples, uncertainty ranges and reasons for exclusion.
That distinction matters.
Luminescence stratigraphy can show changes in sediment packages. It can show reworking. It can show breaks. It can show whether lower deposits have a different depositional history from upper deposits. But unless the full dating dataset is published, it cannot be independently tested as a complete chronology.
This is especially important at Durrington because the luminescence evidence was not simple.
In 8A, the signal pattern suggested redeposited material through part of the sequence. That is already significant, because redeposition is exactly what a water-margin or palaeochannel model would predict.
In 5A, the problem becomes even bigger. The feature was not bottomed at seven metres, and the luminescence profile indicated a major change in the lower sequence. There was also a light-exposed section of core, which limited normal OSL sampling. That is not a minor technical detail. It affects how confidently the lower deposits can be understood.
So the question is obvious:
Where is the full chronology?
(The Durrington Mega-Monument Hoax: What Lies Beneath? – Debunked)
If the interpretation is going to claim a massive Late Neolithic pit structure, then every dating line matters. The full OSL evidence should be available for scrutiny, including:
all sampled depths all accepted OSL ages all rejected OSL ages all dose-rate data all equivalent-dose estimates all uncertainty ranges all light-exposed intervals all failed or unsuitable samples all reasons for excluding samples from the final model all links between OSL samples, core depths, sediment units and OD levels
Without that, the reader is asked to accept the interpretation without being able to properly test its chronological foundations.
This matters because inconvenient dates are not noise if the real question is hydrology.
A date that does not fit a neat Late Neolithic monument story may still be extremely important. It may date an older sediment package. It may identify redeposited water-margin material. It may show that a pit was cut into a much older palaeochannel fill. It may prove that the feature has a longer landscape history than the monument model allows.
In a purely ceremonial interpretation, awkward dates can be labelled residual, redeposited, contaminated or irrelevant.
In a hydrological interpretation, those same dates may be the evidence.
That is why the OSL problem is so important. The 2020 report already showed that the sediment history was complex, but it did not publish a full OSL chronological archive sufficient to test the hydrological alternative. Later work added more OSL dating and environmental analysis, but the same interpretive assumption remained: the features were still being pulled back into the pit-structure model.
That is not good enough.
If these pits are sitting on palaeochannels and former river margins, then the lower, older, reworked or awkward sediment packages are not side issues. They are central to understanding the site.
The full chronology should decide the interpretation.
The interpretation should not decide which chronology matters.
(The Durrington Mega-Monument Hoax: What Lies Beneath? – Debunked)
8. The Core Logs: These Are Sediment Traps, Not Simple Ritual Holes
The core logs are among the most important pieces of evidence in the entire Durrington debate.
They show that the features are not simple, clean, ceremonial holes with a straightforward construction story. They are deep, complex sediment sequences.
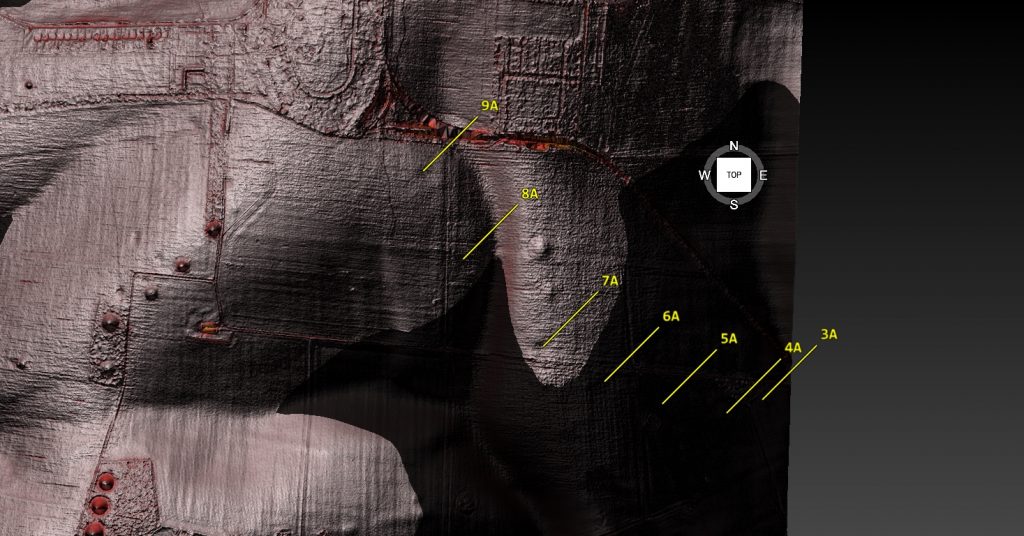
Feature 7A reached fractured chalk at around five metres. Immediately above that lower chalk horizon was a shell / mollusc-bearing sample. That matters because it places water-related material close to the base of the feature, not merely as a casual surface intrusion.
Feature 8A is even more important. Its lower fills contained grey calcareous silts, molluscs, bone fragments and a struck flint. The mollusc-bearing sediment was not an incidental find sitting at the top of the feature. It formed part of a deeper calcareous sequence. That is exactly the sort of deposit expected in a water-affected landscape where older shell-bearing material, silt and cultural debris can be trapped, reworked or redeposited.
Feature 5A is different again. It was cored to seven metres and still not bottomed. Its sequence included bone, charcoal, flint-rich material, fragmentary lower deposits and a major change beneath the upper dated levels. That is not the profile of a simple, uniform pit dug and filled in a single neat event. It is a deep and unresolved sediment archive.
These three cores alone should have stopped the interpretation from becoming too tidy.
7A gives a basal shell-bearing horizon.
8A gives calcareous silts and molluscs within a deeper reworked sequence.
5A gives a deep, unbottomed, and complex fill with bone-, charcoal-, and flint-rich material.
(The Durrington Mega-Monument Hoax: What Lies Beneath? – Debunked)
Taken together, they point to a landscape of sediment movement, water action, reworking and later activity. They do not point clearly to a single ritual construction event.
This is the difference between seeing the pits as “monumental holes” and seeing them as part of a former river-edge landscape.
A ceremonial interpretation looks at the size of the holes and asks what symbolic boundary they might have formed.
A hydrological interpretation looks at the fills and asks what processes created, altered or filled them.
The core logs favour the second question.
They show that the Durrington features are not just empty spaces in the chalk. They are sediment traps. They contain the history of the landscape that filled them.
That history includes water.
(The Durrington Mega-Monument Hoax: What Lies Beneath? – Debunked)
9. The Stonehenge Bottom Connection
The Durrington evidence matters because it does not stand alone.
Stonehenge Bottom has long been treated as if its water-affected deposits could be dismissed as background geology, chalk solution, ancient fossil material, or an irrelevant natural disturbance. That position is no longer safe.
The Durrington pits show that shell-bearing, calcareous, and water-affected deposits occur within the wider Stonehenge landscape in contexts that yield Holocene radiocarbon dates. That does not mean every shell at Stonehenge Bottom is the same age as every shell at Durrington. It does not mean that every shell records the same event. It does not mean every deposit belongs to a single flood.
That is not the argument.
The point is simpler and stronger.
Shell-bearing deposits in this landscape cannot just be waved away.
(The Durrington Mega-Monument Hoax: What Lies Beneath? – Debunked)
They must be tested.
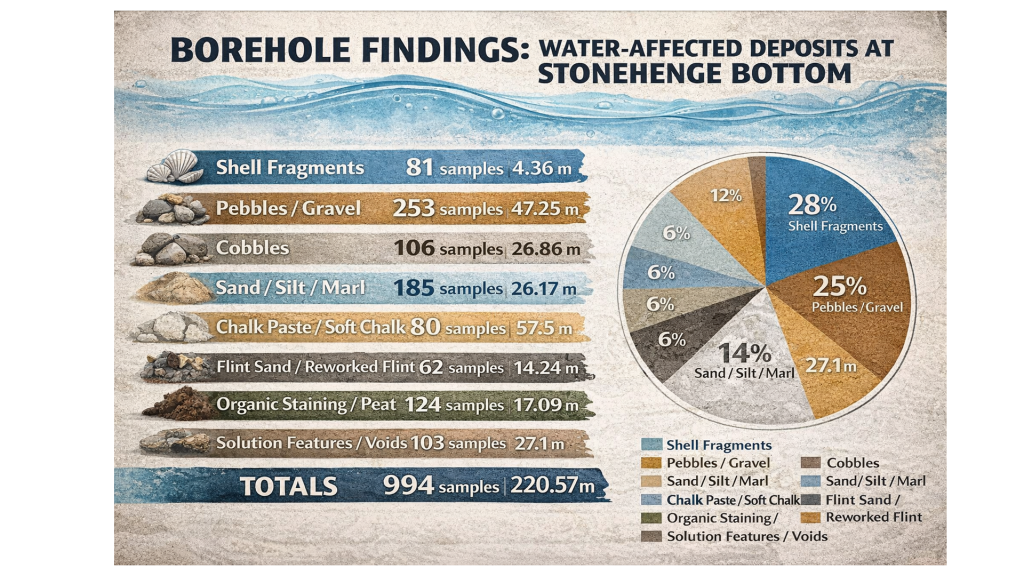
At Stonehenge Bottom, the borehole evidence records repeated water-related material: shells, gravels, sands, silts, marl, organics, peat-like staining, solution features and water-affected chalk. These are not isolated oddities. They occur across multiple boreholes and repeatedly within the same hydrological elevation band.
At Durrington, shell-bearing horizons occur inside deep, complex pit fills associated with calcareous silts, reworked sediments and later material. Again, the correct response is not to dismiss the shells because they complicate the monument’s story. The correct response is to ask what hydrological system placed shell-bearing material at those depths and OD levels.
That is where the connection becomes important.
Durrington proves that shell-bearing deposits within the Stonehenge landscape can be part of the Holocene sedimentary record. Stonehenge Bottom shows that similar water-affected material occurs repeatedly across a wider borehole system. Together, they point to a landscape where water, sediment, shells, organics and human activity interacted over long periods.
This does not prove that every feature was flooded at the same time.
It proves that the dry-land assumption is no longer good enough.
If shells at Durrington can be dated, then shells at Stonehenge Bottom should be dated.
If calcareous silts at Durrington can be analysed, then silts and marl at Stonehenge Bottom should be analysed.
(The Durrington Mega-Monument Hoax: What Lies Beneath? – Debunked)
If Durrington’s deposits require OSL, radiocarbon, sedimentology and environmental testing, then Stonehenge Bottom deserves the same treatment.
The scientific response is obvious:
date the shells identify the species test the carbonate source analyse the sediment calculate the OD levels compare the horizons model the hydrology
Anything less is not science. It is an assumption.
The Durrington evidence, therefore, strengthens the Stonehenge Bottom argument. It shows that shell-bearing, water-affected deposits in this landscape are not archaeological background noise. They may be the record of the landscape itself.
And that is exactly what the “mega-monument” interpretation failed to consider.
The pits were not sitting in an abstract ceremonial diagram.
They were sitting in the same wider post-glacial water landscape that shaped Stonehenge Bottom.
(The Durrington Mega-Monument Hoax: What Lies Beneath? – Debunked)
10. The 2025 Reassessment: More Science, Same Assumption
The 2025 reassessment is important because it added more evidence.
The new work incorporated additional geophysics, including magnetometry, ground-penetrating radar, electromagnetic ground conductivity, and electrical resistivity tomography. It also added drone survey, boreholes, core analysis, geochemistry, chemostratigraphy, OSL profiling and dating, and sedimentary ancient DNA.
That sounds impressive.
And in one sense, it is. More data is always better than less data.
But more science does not automatically mean a better interpretation.
The problem with the 2025 reassessment is that the additional techniques were still largely used to test and defend the pit-structure interpretation, rather than to properly test the competing hydrological explanation. The paper continued to treat the features as a large prehistoric pit structure surrounding Durrington Walls, even while acknowledging variable features, possible natural origins, unproven anomaly ii, differing depths, complex fills and multiple sediment histories.
That is the central weakness.
The new work improved the description of the pits, but it did not break free from the original assumption.
(The Durrington Mega-Monument Hoax: What Lies Beneath? – Debunked)
If the features sit on palaeochannels and former water margins, then the correct test is not simply whether they resemble other pits. The correct test is whether their distribution is better explained by hydrology than by monument geometry.
Do the pits follow former river margins?
Do the gaps correspond with dry land outside the water system?
Do the missing sections correspond with former active water?
Do the depths and OD levels match falling water horizons?
Do shell-bearing layers, calcareous silts and reworked sediments align with palaeochannel positions?
Do the dated horizons behave like shoreline deposits rather than construction deposits?
These are the questions that should have been placed at the centre of the reassessment.
Instead, the interpretation still moves back toward monumentality. The features are repeatedly pulled into the language of arcs, alignments, pit structures, boundaries, Durrington Walls and Larkhill. The landscape is still being organised around a ceremonial model rather than a water model.
This is why the 2025 paper does not close the debate.
It actually strengthens the hydrological critique.
The more sediment evidence is added, the less convincing a simple ritual pit-circuit becomes. Boreholes, chemostratigraphy, OSL and sedaDNA are not just tools for confirming monumentality. They are tools for reconstructing the landscape process. They can show reworking, environmental change, sediment movement, palaeoecology, water-derived material and long-term infilling.
That is exactly why the hydrological model must be tested.
The 2025 reassessment shows that the pits are complex. It shows that they contain layered environmental histories. It shows that no recorded pit has been totally excavated. It shows that individual cores cannot provide full geometry. It shows that remote sensing alone cannot completely define these features.
Those admissions matter.
They mean the interpretation should become more cautious, not more confident.
If the features have not been fully excavated, if the lower sequences remain complex, if some pits are unbottomed, if natural origins remain possible, and if the spatial distribution has not been tested against former water margins, then the “mega-monument” claim remains unproven.
The 2025 reassessment added more science.
But it did not ask the most important question:
Are these really the remains of a planned ceremonial pit structure, or are they the archaeological trace of a changing Avon river landscape?
Until that test is done, the extra science has not solved the problem.
It has simply given us more evidence that the original interpretation may have been based on the wrong assumption.
(The Durrington Mega-Monument Hoax: What Lies Beneath? – Debunked)
11. The Bulford Repeat: Same Mistake, Smaller Site
The Durrington problem is not an isolated case.
The same interpretive failure has now reappeared at Bulford.
At Durrington, large pits, hollows and uncertain features were drawn into a vast “mega-monument” story. The pattern was pushed toward boundary, ceremony, cosmology and large-scale Neolithic planning before the hydrological landscape was properly tested.
At Bulford, the scale is smaller, but the method is familiar.
Two postholes have been promoted as evidence for solar alignment, with suggestions of an earlier Stonehenge-style monument. Once again, the story moves quickly from holes in the ground to sunrise, ritual and Stonehenge.
The problem is not the archaeology.
The problem is the interpretation.
Real features exist at Bulford. Real features exist at Durrington. But real features do not automatically prove the story being built around them.
At Durrington, pits became cosmology.
At Bulford, two postholes became an older Stonehenge.
In both cases, the same method appears:
select a limited number of features draw a line or circuit notice a sunrise or horizon relationship invoke ritual or ceremonial meaning connect it to Stonehenge treat the physical landscape as background scenery
That is backwards.
The correct order should be:
landscape first hydrology second dating third interpretation last
Before Bulford is turned into a solar monument, the river-facing landscape must be tested. Its relationship to the Nine Mile River, the Avon, local topography, former water levels, routeways, palaeochannels and sediment history must come first.
(The Durrington Mega-Monument Hoax: What Lies Beneath? – Debunked)
Before Durrington is turned into a cosmological pit circle, the same test must be applied there. Do the pits form a monument, or do they fit former palaeochannels and shoreline zones? Do the gaps prove missing ceremony, or do they mark areas of dry land and former active water?
That is why the Bulford case matters.
It shows that the same mistake is still being made.
The Stonehenge landscape is being read from the sky down, when it should be read from the ground up.
This is not how science should work. Two points always make a line. Some lines will point at the sun. A broken arc can always be turned into a symbolic circle if the missing parts are explained away. But that does not prove prehistoric intention.
It proves only that modern interpreters are very good at drawing patterns.
The Bulford Hoax article deals with that problem directly. It shows how quickly a limited set of features can be turned into a headline claim before the full landscape evidence has been published and tested.
Durrington is the larger version of the same failure.
At both sites, the archaeology should have been tested against water, terrain, sediment, dating and palaeochannels before it was dressed up as monumentality.
Until that happens, the lesson is simple:
Stop turning holes into cosmology before the landscape has been understood.
(The Durrington Mega-Monument Hoax: What Lies Beneath? – Debunked)
12. What Proper Science Would Test
The Durrington debate does not need more storytelling.
It needs a proper test.
If the pits are indeed a planned Late Neolithic monument, then that interpretation should withstand comparison with the physical landscape. If the hydrological model is wrong, then the evidence should show that too. But that requires testing the two models against each other, not simply assuming the monument model from the start.
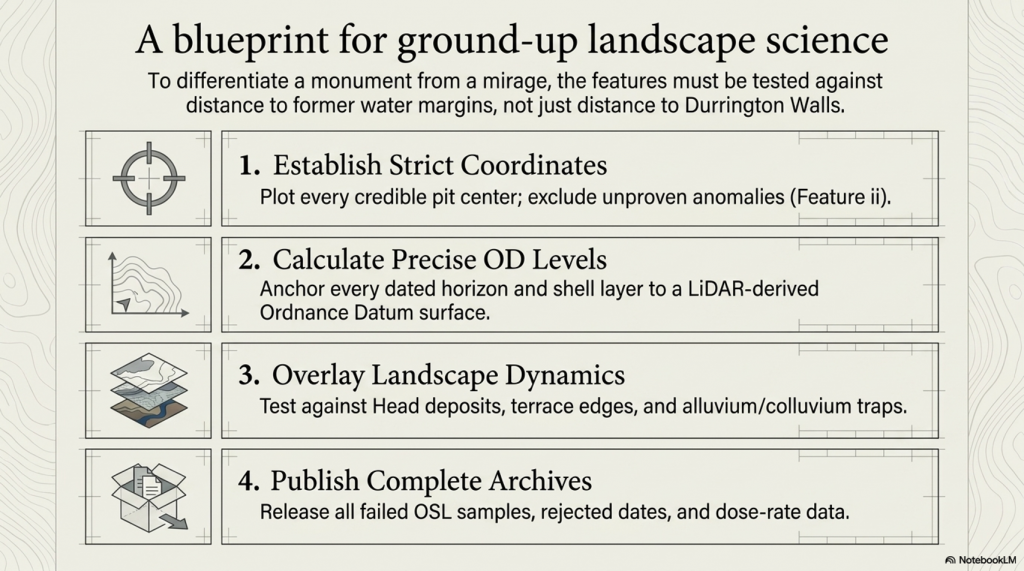
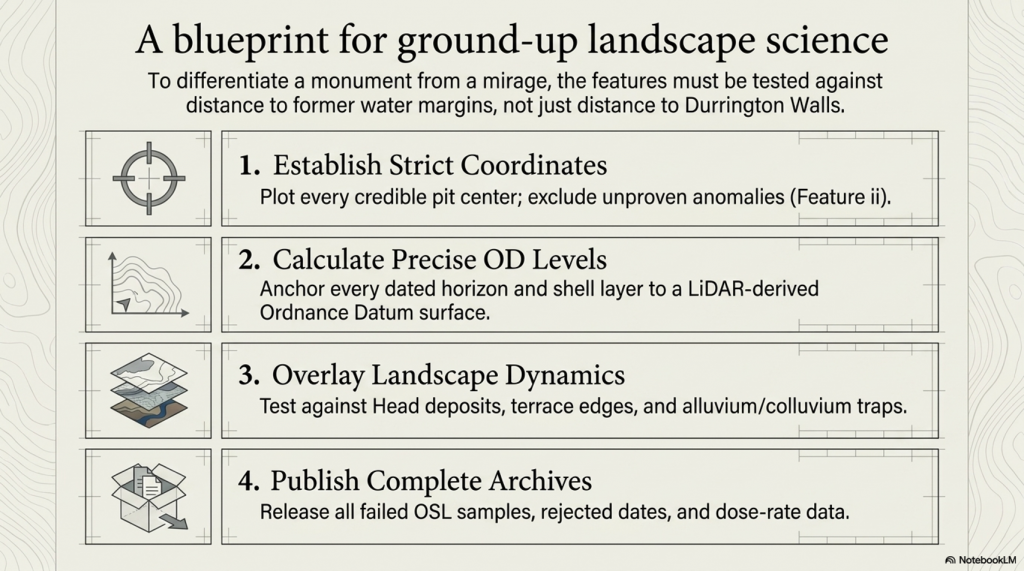
The first requirement is simple: plot every credible pit centre accurately.
Not approximate dots.
Not symbolic positions.
Not selected examples.
Every credible feature needs a fixed coordinate, a confidence rating and a source trail. Questionable features, especially ii, should be excluded from the main model unless they are independently proved.
The second requirement is elevation.
Each pit needs a LiDAR-derived surface OD. Each dated or sampled horizon then needs its own calculated OD, based on depth below ground. The same applies to bases, basal chalk contacts, shell-bearing layers, bone horizons, OSL samples, calcareous silts and lower sediment breaks.
Without OD levels, there is no real hydrological test.
The third requirement is a landscape overlay.
The pit map must be tested against:
palaeochannels former Avon water levels former shoreline margins Head deposits dry valleys flow accumulation slope breaks terrace edges springline potential alluvium and colluvium sediment traps and solution features
Only then can the interpretation be tested properly.
(The Durrington Mega-Monument Hoax: What Lies Beneath? – Debunked)
The key comparison is not whether the pits can be drawn around Durrington Walls. We already know they can be made to look like arcs. The real question is whether their distribution is better predicted by distance from Durrington Walls or by distance from former water margins.
That is the test.
If the pits cluster more strongly by distance to Durrington Walls, then the monument model gains strength.
If the pits cluster more strongly by palaeochannel edges, shoreline zones, OD bands and former water levels, then the hydrological model gains strength.
At the moment, the hydrological explanation has not been properly falsified.
That is the failure.
The same applies to the dating evidence. All dating data should be published or archived for scrutiny: radiocarbon lab numbers, material type, sample depths, calibration curves, rejected dates, OSL age estimates, dose-rate data, light-exposed intervals, equivalent-dose values, failed samples and reasons for exclusion.
A scientific chronology does not hide awkward results.
It explains them.
This is especially important because inconvenient dates are not noise if the real question is hydrology. An old shell date, a reworked sediment signal, a light-exposed lower unit, or a mixed fill may be awkward for a simple monument story, but it may be exactly the evidence needed to reconstruct a former river landscape.
The proper test is therefore straightforward.
Plot the pits.
Calculate the OD levels.
Map the palaeochannels.
Overlay the former water levels.
Publish the full dating archive.
Remove unproven ii from the core model.
Then compare two explanations:
Do the pits form a planned monument around Durrington Walls?
Or do they fit a former Avon shoreline and palaeochannel system?
Until that test is done, the “mega-monument” is not a proven archaeological conclusion.
It is an interpretation awaiting landscape review.
(The Durrington Mega-Monument Hoax: What Lies Beneath? – Debunked)
13. Conclusion: What Really Lies Beneath?
The Durrington “mega-monument” has not been proved by the pits.
It is an interpretation placed over a broken pattern.
Large pits exist. That is not in dispute. Some are deep. Some are impressive. Some contain important archaeological and environmental evidence. But none of that automatically proves a single planned Late Neolithic ceremonial circuit.
The monument interpretation depends on treating a scattered, uneven and incomplete distribution of features as if it were a designed whole. It takes arcs and turns them into a circle. It takes gaps and explains them away. It takes complex fills and pulls them back into a single story. It treats water-affected sediment as background rather than evidence.
That is the failure.
Once the same features are plotted against LiDAR, palaeochannels, former water margins and dated water-derived deposits, the pattern looks very different.
It no longer looks like a sacred circle.
It looks like a river landscape.
(The Durrington Mega-Monument Hoax: What Lies Beneath? – Debunked)
The credible pits sit where a changing water-margin landscape would predict them. The gaps occur where a hydrological model would expect gaps: dry ground outside the former water system, or active water zones where pits would not be dug, would not survive, or would be hidden beneath later deposits.
The dating evidence does not rescue the monument model. It exposes its weakness. Shell, bone, charcoal, OSL signals and sediment layers do not form a clean single construction sequence. They point to a longer, messier and more realistic landscape history — one involving water, reworking, sediment movement, later activity and repeated environmental change.
That is what the original interpretation failed to face.
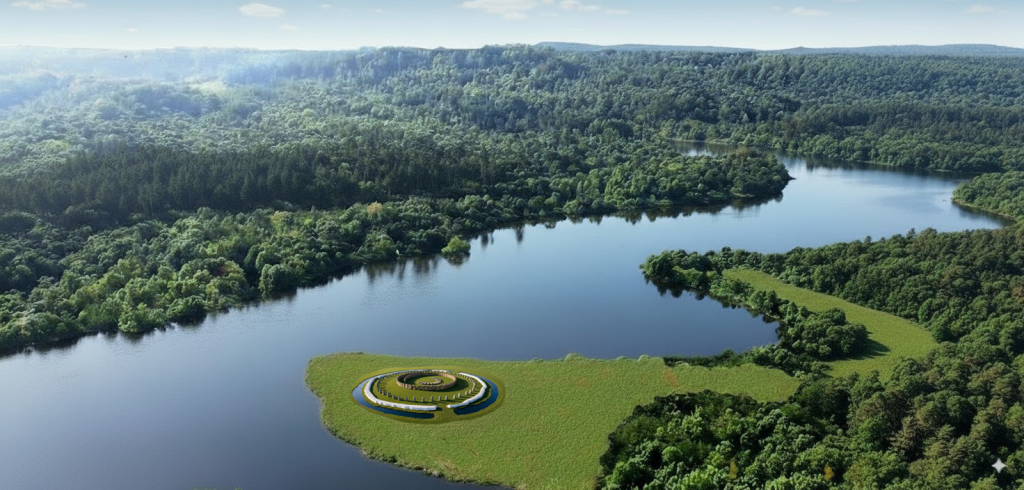
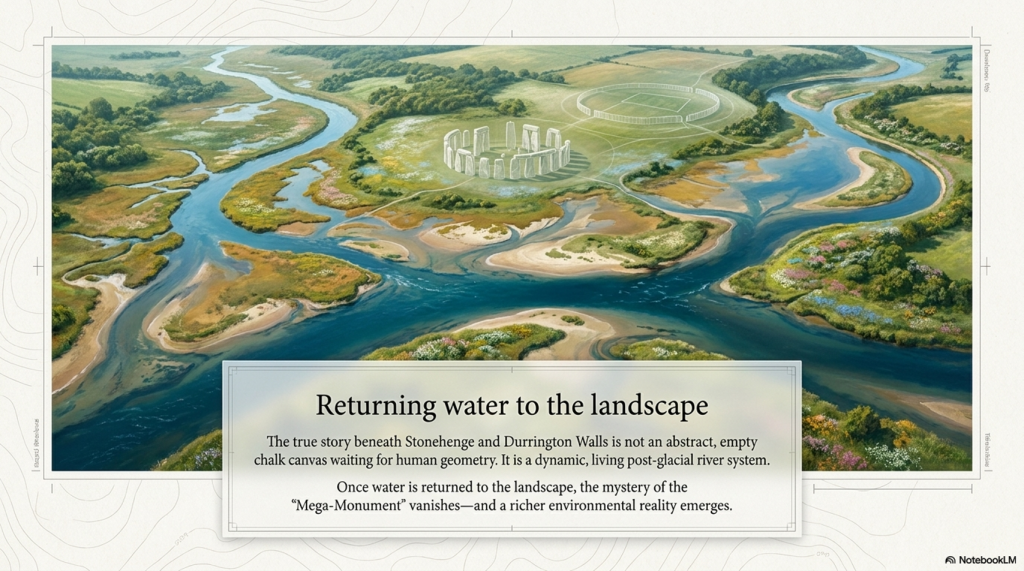
The Stonehenge landscape was not an abstract ceremonial diagram waiting to be decoded from the sky. It was a post-glacial landscape of rivers, springs, palaeochannels, shorelines, gravels, silts, shells, buried soils and changing water levels.
Durrington was part of that landscape.
Stonehenge Bottom was part of that landscape.
Bulford was part of that landscape.
And until archaeological tests of that landscape are conducted, every new “ritual monument”, every sunrise alignment, and every sacred circle should be treated with extreme caution.
The real question is not whether prehistoric people had beliefs, rituals or ceremonies. Of course they did.
The question is whether modern archaeology is mistaking the physical remains of a hydrological landscape for ceremonial architecture.
At Durrington, that is exactly what appears to have happened.
The “mega-monument” may not be a monument at all.
It may be the archaeological shadow of a former Avon river system — a broken pattern of pits, hollows, sediment traps and modified features surviving along palaeochannels and retreating shorelines.
What really lies beneath Stonehenge is not just ritual.
It is water.
And once water is returned to the landscape, the Durrington mystery stops looking mysterious.
It starts looking obvious.
(The Durrington Mega-Monument Hoax: What Lies Beneath? – Debunked)
Old Article for Reference
How Durrington Walls, Larkhill and the “Mega-Monument” Forgot the Water (2020)
The fundamental problem with the modern interpretation of Stonehenge and its wider landscape is simple.
Archaeologists still do not understand the basic infrastructure of prehistoric society.
They look at pits, ditches, earthworks, dry valleys and monument alignments, but too often interpret them as ritual, ceremonial or symbolic before asking the more important question:
What did the landscape actually look like when these features were built?
Imagine a future historian trying to understand our society without knowing what roads were. They might find motorways, lanes, junctions, roundabouts, bridges and service roads confusing. Some roads are straight. Some curve. Some are wide. Some are narrow. Some stop suddenly. Some have been widened, reused, bypassed or abandoned. Without understanding transport, that historian would never understand the structure of our world.
The same mistake is being made with prehistoric Britain.
The infrastructure was not roads.
It was water.
Rivers, palaeochannels, marshes, flooded valleys, landing places, shoreline routes and dykes were the transport system of early Britain. If that is not understood, then the archaeology becomes distorted before interpretation even begins.
This is precisely the problem with Channel 5’s documentary, The Stonehenge Enigma: What Lies Beneath? The title was cheekily close to my own Stonehenge work, but the interpretation repeated the same old archaeological problem: it treated a changing post-glacial landscape as if it were a mostly dry modern chalkland.
Once that assumption is made, the rest of the story goes wrong.
The programme promoted the idea that new research had identified a huge arc or ring of massive pits beneath fields near Durrington Walls. These were said to form part of a two-kilometre-wide structure, with the great Neolithic settlement of Durrington Walls at its centre.
The popular version was dramatic.
Durrington Walls became a “party city”.
The pits became a monumental boundary.
The wider landscape became part of a sacred ceremonial system.
The implication was that archaeologists had found another giant prehistoric structure in the Stonehenge landscape.
The programme synopsis presented this as another remarkable addition to the Stonehenge mystery. The pits, it suggested, formed part of a huge ring around Durrington Walls, perhaps enclosing or defining a special landscape used during seasonal gatherings.
The academic paper behind the claim, A Massive, Late Neolithic Pit Structure associated with Durrington Walls, argued that the surviving pits might represent an elaboration of the monument complex at a massive and unexpected scale. It also suggested that the pits may have been laid out with respect to the recently discovered Larkhill causewayed enclosure, and that some evidence might even show maintenance of the structure into the Middle Bronze Age.
That sounds impressive.
But it only works if the environmental assumptions are correct.
They are not.
The Landscape Is the Missing Evidence
The interpretation assumes that these pits, hollows, and alignments primarily belong to a monumental or ceremonial system.
But if the landscape were water-active, the same evidence would look very different.
Dry valleys were not always dry.
Palaeochannels were not irrelevant background geology.
Ditches were not automatically symbolic.
Pits were not automatically ritual.
Linear earthworks were not automatically boundaries.
And river-facing monuments were not necessarily ceremonial theatres.
They may have been part of a practical water-based landscape of access, movement, drainage, supply, landing, extraction and trade.
That is the missing context in the Durrington interpretation.
The modern Stonehenge landscape is relatively dry. The prehistoric landscape was not. During the Mesolithic and Neolithic, rivers and groundwater systems were operating under very different post-glacial conditions. Water tables were higher. Valleys were wetter. Springs and seasonal channels were more active. Palaeochannels continued to hold environmental significance long after their formation.
If archaeologists ignore this, they will continue to turn working landscapes into sacred fantasies.
Larkhill: The Supposed Boundary That Follows Water
The Larkhill causewayed enclosure is crucial because it was used in the argument for the Durrington pit structure.
But when we examine the site with LiDAR, the landscape tells a different story.
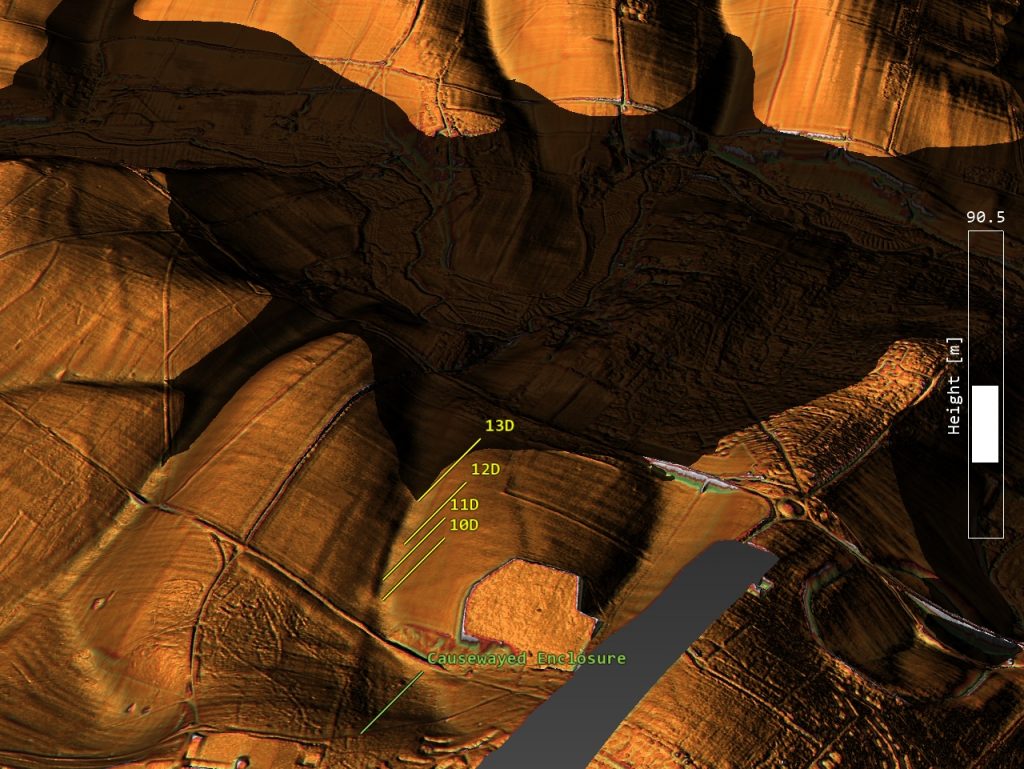
The supposed northern section of the Durrington pit-circle does not behave like part of a neat circular boundary. It sits within and follows a palaeochannel or dry valley system. These features form a line connected with the ancient water landscape rather than a convincing monumental ring.
That matters.
If the pits are aligned within a palaeochannel, then they are not simply arbitrary points on a ceremonial circle. They may be following the physical logic of an earlier watercourse.
The Larkhill causewayed enclosure itself sits in relation to this water system. It is not isolated on empty chalkland. It is positioned where a water-linked route would have mattered.
This supports a very different interpretation.
Causewayed enclosures may not have been mysterious ceremonial camps. They may have functioned as trading and gathering sites positioned on water-connected routes. Their interrupted ditches make far more sense if we understand them as moated or water-fed enclosures rather than simply symbolic boundaries.
Boats could approach.
Goods could be exchanged.
People could gather.
The enclosure could be supplied, defended, accessed and identified from the water.
That is a practical explanation rooted in landscape use.
The Dyke Problem
The Durrington and Larkhill interpretation also ignores one of the most important but least understood prehistoric feature-types in Britain:
the dyke.
Linear earthworks are everywhere in the British landscape. There are more than 1,500 scheduled sections of dykes and linear earthworks across Britain and Ireland. My own LiDAR research has identified thousands more that remain unclassified or misunderstood. If correct, Britain may contain more than 2,000 miles of ancient dyke systems — a greater total length than the known Roman road network in Britain.
Yet archaeology still struggles to explain them.
Some are called defensive.
Some are called territorial.
Some are called boundaries.
Some are called lynchets.
Some are simply ignored.
But the word dyke itself is water-related. A dyke is a water-management feature. In many cases, that older meaning may be the clue archaeologists have missed.
At Larkhill, the linear earthwork associated with the palaeochannel makes far more sense as part of a water-management or water-supply system than as a symbolic boundary.
At Durrington Walls, the same problem appears again.
The Durrington “Lynchet” That Runs the Wrong Way
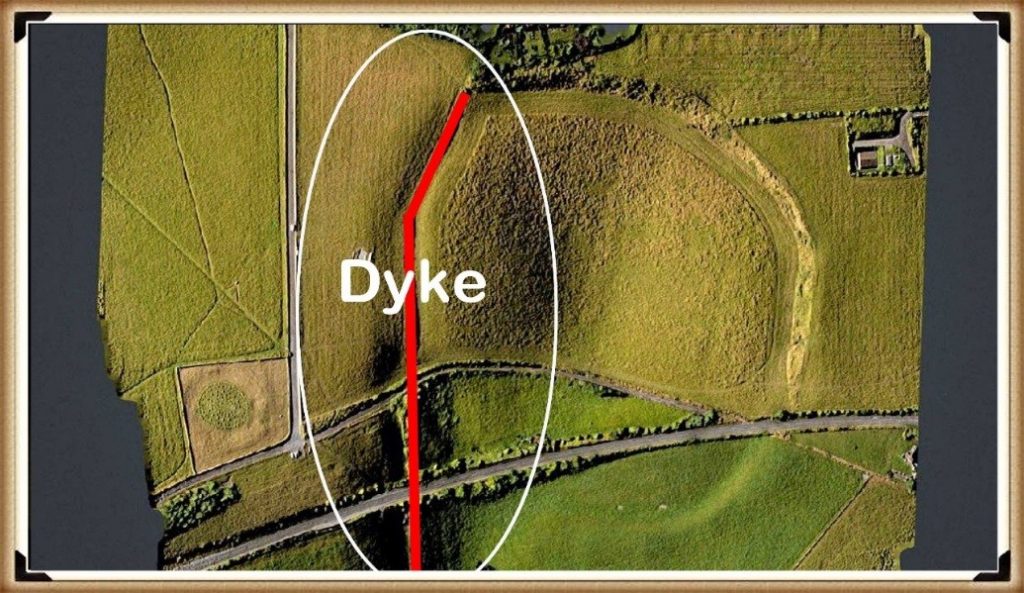
Within the Durrington Walls landscape, there is a linear earthwork that once connected the River Avon to the henge’s ditch or moat.
In the report, this feature was described as a modern lynchet.
That interpretation is weak.
Durrington Walls ‘DYKE’ – see LiDAR Video for more details – The Stonehenge Enigma: What Lies Beneath? – Debunked
A lynchet is normally an agricultural feature formed by ploughing across a slope. Lynchets generally run along the contour of a hillside.
This feature does the opposite.
It runs down the slope towards the River Avon, some 30 metres below.
That is not how a typical lynchet behaves.
It is exactly how a water-linked dyke, channel or supply feature would behave.
LiDAR shows this clearly. The feature is not simply a random agricultural scar. It connects the monument to the river system. If Durrington Walls had a water-fed ditch or moat, it would be logical.
Again, the problem is not a lack of evidence.
The problem is the interpretive framework.
If archaeologists expect ritual, they see ritual.
If they expect agriculture, they see lynchets.
If they begin with hydrology, the landscape suddenly makes more sense.
Removing the Northern Section
Once the northern “pit-circle” elements are understood as features associated with a palaeochannel and possible dyke system linked to Larkhill, the supposed two-kilometre circle begins to weaken.
The “monument” is no longer a clean ring.
It becomes a mixed landscape of natural hollows, palaeochannels, pits, reused features, dykes and water-related deposits.
That does not make the archaeology unimportant.
It makes it more interesting.
But it is no longer the simple story sold to the public: a giant sacred boundary surrounding Durrington Walls.
The remaining southern features then need to be assessed on their own terms. When examined against LiDAR, topography and reconstructed Mesolithic/Neolithic water levels, many of them appear to relate more logically to the raised shoreline and hydrological history of the River Avon than to a single monumental circuit.
Some of these features sit at levels that would have been strongly affected by earlier water regimes.
That brings us to the dating evidence.
The C14 Dates Do Not Support a Simple Monument
The radiocarbon dates associated with these features are not neat.
They range across a long period.
Larkhill Causewayed Camp and its paleochannel with pits – The Stonehenge Enigma: What Lies Beneath? – Debunked
Some of the most important dates come from shell and bone material recovered from the Durrington features. The shell samples are especially important because they produced Holocene dates rather than meaningless ancient fossil ages.
Feature 7A produced a shell date around 6080–5990 cal BC.
Feature 8A produced another shell date around 4710–4550 cal BC.
A further shell date from feature 8A produced a result around 3930–3690 cal BC.
Feature 5A produced later material, with dates reaching into the Bronze Age.
That is not a single construction event.
That is a long-lived, water-affected landscape sequence.
Southern Pits reflect the post-glacial flooding in the area – Stonehenge enigma
The original authors were cautious about the shell dates, suggesting they may be affected by geological calcium or reservoir effects and therefore should not be used as direct dates for the pits’ excavation.
That caution is reasonable.
But it also proves the point.
If shell carbonate is affected by geological calcium or reservoir effects, then hydrology is not a side issue.
It is the issue.
Reservoir effects are hydrological evidence.
Carbonate movement is hydrological evidence.
Shell-bearing sediments are hydrological evidence.
Water-affected pits are hydrological evidence.
The shell dates should not be dismissed. They should force a proper environmental reconstruction of the entire Stonehenge landscape.
The Core Logs Show More Than Three Shell Dates
The Durrington evidence is even stronger when the core logs are examined in detail. The important point is not simply that three shell samples were radiocarbon dated. The sediment descriptions themselves show that these features were water-affected environmental deposits.
In pit 7A, the mollusc sample came from 4.80–4.85m, immediately above fractured chalk bedrock. Above it lay loose, unconsolidated, chalky silts with clasts of flint and chalk. That is not the description of a clean, dry, sealed ritual feature. It is a sediment sequence.
Pit 8A is even more significant. Between 2.60m and 4.35m, the core log records grey calcareous silts, described as structureless and massive, with molluscs present throughout. That is not one stray shell fragment. That is a thick mollusc-bearing calcareous silt deposit nearly two metres deep. Below it, the same feature produced grey silts, bone fragments and a flint artefact.
This matters because mollusc-bearing calcareous silts are environmental evidence. They point towards water, groundwater chemistry, slow silting, carbonate movement, ponding, palaeochannel activity or wet hollow conditions. Even if the shells are treated cautiously for dating purposes, their presence still demands a hydrological explanation.
Pit 5A adds another complication. It was cored to 7m without clearly reaching chalk bedrock. Its lower fills included brown clay silt with charcoal and bone, followed by flint gravel with many bone fragments, charcoal and burnt flints, and then possible bedding with darker horizons. That is a complex sediment trap, not a simple ceremonial hole.
So the Durrington evidence is not just three shell dates.
It is a wider pattern of grey silts, calcareous deposits, molluscs, bone-rich layers, unconsolidated sediments, gravel, possible bedding and deep unresolved stratigraphy.
That is exactly why the “mega-monument” interpretation is premature.
Before these features become a sacred boundary around Durrington Walls, they must first be understood as physical features within a water-shaped landscape.
The core logs do not weaken the hydrology argument.
They strengthen it.
The most remarkable weakness in the Durrington “mega-monument” claim is the mismatch between the scale of the interpretation and the scale of the physical testing.
The proposed monument includes numerous features arranged around a two-kilometre circuit, yet the core logs relate to only three sampled features: 7A, 8A and 5A. Those cores are important, but they cannot carry the whole interpretation. They show that selected features contained deep sediment sequences, molluscs, calcareous silts, bone, flint and complex fills. They do not prove that every anomaly in the proposed circuit was the same type of feature, dug at the same time, used for the same purpose, or maintained as part of one planned monument.
Three cores can ground-truth three features. They cannot prove a mega-monument.
The Stonehenge Bottom Connection
This is where the Durrington evidence becomes far more important.
At Stonehenge Bottom, the borehole evidence records a repeated cluster of water-related deposits: shell fragments, gravels, sands, silts, organic staining, chalk disturbance and other sediments sitting within a comparable elevation band. These deposits have been criticised as irrelevant, with the usual dismissal being that the shells are probably just ancient fossils from the chalk.
But the Durrington evidence now makes that dismissal much weaker.
The Durrington core logs do not simply record three isolated shell samples. They record a broader sedimentary pattern that closely resembles the material identified in the Stonehenge Bottom boreholes.
In pit 7A, the mollusc sample was taken from 4.80–4.85m, immediately above fractured chalk bedrock. Above it lay loose, unconsolidated, chalky silts with clasts of flint and chalk. This is not the description of a clean, dry, sealed ceremonial feature. It is a sediment sequence sitting directly over broken chalk.
In pit 8A, the evidence is even stronger. Between 2.60m and 4.35m, the core log records grey calcareous silts described as structureless and massive, with molluscs present throughout. That is not one stray shell fragment. It is a thick mollusc-bearing calcareous silt deposit nearly two metres deep. Below this, the same feature produced grey silts, bone fragments and a flint artefact.
In pit 5A, the borehole reached 7m without clearly reaching chalk bedrock. The lower fills included brown clay silts with charcoal and bone, flint gravel with many bone fragments, charcoal fragments, burnt flints and possible bedding with darker horizons. That is a complex, deep sediment trap, not a simple ritual pit.
These details matter because they show that the Durrington features were not just “holes”. They contained water-related sediment signatures: calcareous silts, molluscs, loose unconsolidated fills, gravels, bone-rich layers and possible bedding. These are precisely the kinds of deposits that require hydrological explanation.
That links directly to Stonehenge Bottom.
At Stonehenge Bottom, the boreholes identify shell fragments and water-laid or water-affected materials within a repeated elevation band. At Durrington, the core logs identify mollusc-bearing calcareous silts, grey silts, gravels and deep sediment sequences within major landscape features. In both cases, we are looking at subsurface deposits that make most sense within a water-shaped landscape.
The difference is that some of the Durrington shell material was radiocarbon dated.
And the results were not millions of years old.
They produced Holocene dates, including Mesolithic and Neolithic results.
That does not prove that every Stonehenge Bottom shell is the exact same age as the Durrington shells.
But it does prove something extremely important.
Shell-bearing deposits in the wider Stonehenge landscape can be Holocene environmental evidence. They cannot simply be dismissed as meaningless chalk fossils without testing.
The proper scientific response is obvious:
date them.
If the Stonehenge Bottom shells return Holocene dates, then the traditional dry-land interpretation of Stonehenge Bottom has a serious problem.
The Durrington evidence, therefore, supports the broader hydrological model in two ways.
First, the C14 shell results show that Holocene shell-bearing deposits exist within the wider Stonehenge landscape.
Second, the core logs show that these shells occur within grey calcareous silts, chalky silts, gravels, bone-rich layers and deep sediment sequences — exactly the kind of deposits expected in wet hollows, palaeochannels, ponded pits, groundwater-fed depressions or slow-silting water-affected features.
This means Stonehenge Bottom should no longer be treated as an isolated anomaly.
It sits within a wider pattern.
Durrington has mollusc-bearing calcareous silts.
Stonehenge Bottom has shell-bearing borehole horizons.
Durrington has grey silts, gravels, bone and deep unresolved sediment sequences.
Stonehenge Bottom has sands, gravels, silts, organic material and water-affected deposits.
Durrington has Holocene C14 shell dates.
Stonehenge Bottom has comparable shell-bearing deposits that now urgently require direct dating.
Together, these two datasets point towards the same conclusion: the Stonehenge landscape was hydrologically active, chemically complex and environmentally dynamic during the Mesolithic and Neolithic.
The shells are not the weakness in the argument.
They are the clue.
The real weakness lies in any interpretation of Stonehenge, Durrington or Larkhill that treats this landscape as dry ceremonial chalkland before first explaining the water.
The Real Shape of the Landscape
The Channel 5 documentary and the Durrington pit-circle claim both suffer from the same problem.
They start with monuments.
They should have started with water.
Once we properly reconstruct the landscape, the supposed mysteries become less mysterious.
Larkhill sits on a water-linked route.
Durrington Walls connect to the River Avon.
The so-called lynchet behaves more like a dyke.
The northern “pit-circle” follows a palaeochannel rather than a clean ceremonial boundary.
The southern pits correspond with changing water levels and long-term landscape activity.
The shell dates show Holocene environmental signals.
The Stonehenge Bottom boreholes record similar water-related signatures.
Together, these do not point towards a simple two-kilometre sacred ring.
They point towards a changing post-glacial river landscape.
Causewayed Enclosures as Trading Sites
This also changes how we view causewayed enclosures.
The traditional explanation treats them as ceremonial gathering places.
But their structure makes far more sense in a water-based economy.
Causewayed enclosures are often found in prominent landscape positions, near river systems, valleys, routeways or water access points. Their segmented ditches could control access, manage water, organise movement and define trading areas.
If boats were central to prehistoric transport, then causewayed enclosures were not isolated religious sites.
They were meeting points.
Markets.
Landing zones.
Exchange hubs.
Controlled spaces where goods, animals, people and information moved through the landscape.
This also explains why later communities reused and reinterpreted these places. Important practical sites often become important symbolic sites. The mistake is assuming they were symbolic from the start.
The Problem With “Ceremonial”
Modern archaeology often uses “ceremonial” when it cannot explain the function.
This is not good enough.
A pit is not ceremonial because it contains bone.
A ditch is not ceremonial because it surrounds space.
A line is not ceremonial because it can be drawn on a map.
A river-facing monument is not ceremonial because archaeologists have not reconstructed the water system.
The word ceremonial has become a dustbin for unresolved evidence.
The Durrington pit-circle claim is a perfect example.
Large features became pits.
Pits became a circuit.
The circuit became a boundary.
The boundary became sacred.
The sacred boundary became cosmology.
But each step required assumptions.
Once the hydrology is restored, those assumptions become much weaker.
The Failure of the Original Paper
The original Durrington pit-circle paper did not use LiDAR as it should have.
That is a serious weakness.
LiDAR is one of the most powerful tools available for understanding prehistoric landscapes. It reveals routeways, dykes, palaeochannels, earthworks, slope relationships, shoreline levels and subtle features that cannot be understood from geophysics alone.
If you are proposing a two-kilometre monumental structure across a complex chalk landscape, LiDAR should not be optional.
Without it, natural hollows, palaeochannels, dykes and landscape features can be misread as components of a monument.
That appears to be exactly what happened.
What the Evidence Actually Shows
The evidence does not show a simple sacred boundary.
It shows a complex, reused, water-shaped landscape.
It shows palaeochannels.
It shows pits.
It shows shell-bearing deposits.
It shows long-term activity from the Mesolithic through the Neolithic and into the Bronze Age.
It shows features connected to the River Avon.
It shows a possible dyke at Durrington misidentified as a lynchet.
It shows Larkhill linked to a water route rather than neatly incorporated into a circular monument.
It shows that dry valleys were still archaeologically active.
It shows that hydrology has been badly underestimated.
In other words, the Durrington pit structure may not be a giant monument at all.
It may be an archaeological misunderstanding of a water-shaped landscape.
Conclusion: What Really Lies Beneath?
What lies beneath Stonehenge and Durrington is not simply another sacred monument.
It is water.
Water shaped the landscape.
Water shaped movement.
Water shaped settlement.
Water shaped access.
Water shaped trade.
Water shaped where monuments were built.
Water shaped how pits filled.
Water shaped what survived.
Water shaped the dates.
And water has been largely ignored.
The problem with modern interpretations of Stonehenge is not that archaeologists lack data. They have excavation, geophysics, radiocarbon dates, boreholes, environmental samples, LiDAR and landscape surveys.
The problem is that the evidence is repeatedly forced through the same old interpretive filter:
ritual,
ceremony,
religion,
sacred landscape,
cosmology.
This has led archaeology away from physical explanation and towards storytelling.
The Durrington “mega-monument” is not proof of a vast sacred boundary.
It is proof of how easily a complex hydrological landscape can be turned into a headline.
Archaeology should not begin by asking what ancient people believed.
It should begin by asking how the landscape worked.
At Stonehenge, Durrington and Larkhill, the answer is clear.
The landscape worked through water.
Until that is understood, every documentary, every headline and every “new discovery” will continue making the same mistake.
They will keep finding sacred landscapes where they should have been finding shorelines.
PODCAST
Author’s Biography
Robert John Langdon, a polymathic luminary, emerges as a writer, historian, and eminent specialist in LiDAR Landscape Archaeology.
His intellectual voyage has been interwoven with stints as an astute scrutineer in government and grand corporate bastions, a tapestry spanning British Telecommunications, Cable and Wireless, British Gas, and the esteemed University of London.
A decade hence, Robert’s transition into retirement unfurled a chapter of insatiable curiosity. This phase saw him immerse himself in Politics, Archaeology, Philosophy, and the enigmatic realm of Quantum Mechanics. His academic odyssey traversed the venerable corridors of knowledge hubs such as the Museum of London, University College London, Birkbeck College, The City Literature Institute, and Chichester University.
In the symphony of his life, Robert is a custodian of three progeny and a pair of cherished grandchildren. His sanctuary lies ensconced in the embrace of West Wales, where he inhabits an isolated cottage, its windows framing a vista of the boundless sea – a retreat from the scrutinising gaze of Her Majesty’s Revenue and Customs, an amiable clandestinity in the lap of nature.
Exploring Prehistoric Britain: A Journey Through Time
My blog delves into the fascinating mysteries of prehistoric Britain, challenging conventional narratives and offering fresh perspectives grounded in cutting-edge research, particularly LiDAR technology. I invite you to explore some key areas of my research. For example, the Wansdyke, often cited as a defensive structure, is re-examined in light of new evidence. I’ve presented my findings in my blog post Wansdyke: A British Frontier Wall – ‘Debunked’, and a Wansdyke LiDAR Flyover video further visualises my conclusions.
My work also often challenges established archaeological dogma. I argue that many sites, such as Hambledon Hill, commonly identified as Iron Age hillforts, are not what they seem. My posts Lidar Investigation Hambledon Hill – NOT an ‘Iron Age Fort’ and Unmasking the “Iron Age Hillfort” Myth explore these ideas in detail and offer an alternative view. Similarly, sites like Cissbury Ring and White Sheet Camp receive re-evaluations based on LiDAR analysis in my posts “Lidar Investigation Cissbury Ring through time”and “Lidar Investigation White Sheet Camp,“ revealing fascinating insights into their true purpose. I have also examined South Cadbury Castle, often linked to the mythical Camelot56.
My research also extends to ancient water management, including the role of canals and other linear earthworks. I have discussed the true origins of Car Dyke in multiple posts, including Car Dyke – ABC News Podcast and Lidar Investigation Car Dyke – North Section, which suggest a Mesolithic origin 2357. I also explore the misidentification of Roman aqueducts, as seen in my posts on the Great Chesters (Roman) Aqueduct. My research has also been greatly informed by my post-glacial flooding hypothesis, which has helped explain landscape transformations over time. I have discussed this hypothesis in several posts, including AI now supports my Post-Glacial Flooding Hypothesis and Exploring Britain’s Flooded Past: A Personal Journey
For those interested in British Prehistory, visit www.prehistoric-britain.co.uk, a comprehensive resource featuring an extensive collection of archaeology articles, modern LiDAR investigations, and groundbreaking research. The site also includes insights and excerpts from the acclaimed Robert John Langdon Trilogy, a series of books that explore Britain during the Prehistoric period. Titles in the trilogy include The Stonehenge Enigma, Dawn of the Lost Civilisation, and The Post-Glacial Flooding Hypothesis, which offer compelling evidence of ancient landscapes shaped by post-glacial flooding.
To further explore these topics, Robert John Langdon has developed a dedicated YouTube channel featuring over 100 video documentaries and investigations that complement the trilogy. Notable discoveries and studies showcased on the channel include 13 Things that Don’t Make Sense in History and the revelation of Silbury Avenue – The Lost Stone Avenue, a rediscovered prehistoric feature at Avebury, Wiltshire.
In addition to his main works, Langdon has released a series of shorter, accessible publications, ideal for readers delving into specific topics. These include:
For active discussions and updates on the trilogy’s findings and recent LiDAR investigations, join our vibrant community on Facebook. Engage with like-minded enthusiasts by leaving a message or contributing to debates in our Facebook Group.
Whether through the books, the website, or interactive videos, we aim to provide a deeper understanding of Britain’s fascinating prehistoric past. We encourage you to explore these resources and uncover the mysteries of ancient landscapes through the lens of modern archaeology.
For more information, including chapter extracts and related publications, visit the Robert John Langdon Author Page. Dive into works such as The Stonehenge Enigma or Dawn of the Lost Civilisation, and explore cutting-edge theories that challenge traditional historical narratives.
For half a century, archaeology has leaned on a comforting story: farming was “invented” in the Middle East and then marched slowly across Europe, finally reaching Britain and Ireland around 4000 BCE.(Rising Evidence, Falling Rivers: The Real Story of Europe’s First Farmers)
This tidy picture—arrows on a map, farmers trudging northwest with seed bags and livestock—has been repeated for generations.
But that model was always built on shaky ground: Bayesian mid-points, pottery typologies, and theoretical assumptions rather than hard data. Today we can test it properly.
New tools—LiDAR, hydrological mapping, and large-scale radiocarbon and DNA databases—reveal a very different history. Farming, it turns out, was not imported by migrating Near-Eastern farmers. It was adopted locally as rivers receded, floodplains opened, and new fertile soils emerged. Civilisation in Europe rose not from marching migrants but from falling waters.
The Traditional Model
The “wave-of-advance” model first formalised by Ammerman & Cavalli-Sforza (1971) treats farming as a demographic front spreading outward from Anatolia at roughly 1 km per year. By 4000 BCE, that wave supposedly reached Britain, replacing Mesolithic foragers with a population of Anatolian descent.
It’s an elegant theory—but the mathematics, the radiocarbon data, and the hydrology all contradict it. What happens when we replace guesswork with measurement?
What the Radiocarbon Timelapse Reveals
Using the Hinz et al. (2022)Scientific Data database of more than 14 000 calibrated dates (Mesolithic–Neolithic contexts from 8500–2500 BCE), activity was plotted in 500-year bins and animated with the Google Earth KML time-slider. The resulting sequence turns the orthodox gradient upside-down.
Key Findings
NW Europe lights up earliest and densest. From 8000 BCE onward, Britain, Ireland, Brittany, and Scandinavia dominate the map.
The southeast stays sparse. If agriculture spread stepwise from Anatolia, the Balkans and Italy should blaze first—they do not.
Maritime corridors dominate. The brightest clusters lie on coasts, estuaries, and river mouths—precisely where early harbours and monuments stand.
Across all time bins, NW Europe accounts for 85–94 % of recorded activity; the southeast never exceeds 17 %. Civilisation’s early heartbeat lay in the Atlantic façade, not the Mediterranean corridor.
The Dataset
The analysis draws on the Radon-B radiocarbon database (Hinz et al., 2022, Nature Scientific Data 9: 166). Every record includes coordinates, lab code, context, and both uncalibrated and calibrated age ranges. Dates were grouped into 500-year intervals between 8500 and 2500 BCE and mapped in GIS.
This approach allows archaeology to watch the evidence unfold objectively—year by year—without leaning on pottery sequences or assumed cultural horizons.
The Mathematical Split: NW vs SE
To quantify the pattern, a diagonal line was drawn across Europe (30° N 0° E → 55° N 30° E), dividing the continent into north-west and south-east halves. Radiocarbon counts per half were tallied in 500-year bins.
Results
Period (BCE)
NW Count
SE Count
% NW Share
8500–8000
24
5
82.8 %
8000–7500
347
70
83.2 %
7500–7000
513
64
87.5 %
7000–6500
1054
112
90.4 %
6500–6000
2328
172
93.1 %
6000–5500
3098
272
91.9 %
5500–5000
3705
291
92.7 %
5000–4500
3060
207
93.7 %
4500–4000
2450
198
92.5 %
4000–3500
2100
180
92.1 %
3500–3000
1700
160
91.4 %
At no stage does the southeast even approach parity. If farming had advanced from Anatolia, the ratios should invert. Instead, the northwest dominates from the outset.
Why the Orthodoxy Persisted
So why did the overland diffusion model survive decades of contrary hints? A combination of factors:
Radiocarbon plateaus—notably around 8000 and 2400 BCE—blurred sequences, allowing mid-points to masquerade as precision.
Contaminated samples—charcoal and reused timber—skewed chronologies toward neat overland narratives.
Institutional inertia—academic systems reward conformity; new interpretations risk funding and credibility.
Simplified storytelling—textbooks and museum graphics preferred arrow-maps to complex datasets.
Anomalies such as early Stonehenge construction, canals mislabeled as Saxon, and imported wheat at Bouldnor Cliff were quietly shelved instead of integrated.
Testing the Diffusion Model Mathematically
To be fair, let’s calculate what the record should look like under the Ammerman–Cavalli-Sforza framework.
1️⃣ Wave speed and arrival time
Distance Anatolia → southern Britain ≈ 3000 km. At 1 km / year, the front takes ≈ 3000 years. If farming reaches Britain by 4000 BCE, migration must begin ≈ 7000 BCE.
2️⃣ Seeding Britain
To establish farming, ~5 000 individuals must reach Britain by 4000 BCE. With a growth rate of 1.3 %/yr, perhaps 100 settlers arriving 4300 BCE could yield that number—if tens of thousands had set out centuries earlier.
Even assuming only half settle every 500 km, survivors after 3 000 km = (0.5)^5 ≈ 3 %. Launch size ≈ 3 200. If two-thirds settle each 500 km, survivors = (1/3)^5 ≈ 0.4 %. Launch size ≈ 27 000.
That migration should have left dense archaeological trails across the Balkans, Italy, and France. It did not.
3️⃣ Expected Radiocarbon Gradient
The model predicts the SE flaring first, with the NW gradually catching up:
Period (BCE)
Expected % NW
8500–8000
20
8000–7500
20
7500–7000
21
7000–6500
25
6500–6000
44
6000–5500
43
5500–5000
44
5000–4500
43
4500–4000
43
4000–3500
43
3500–3000
45
The observed data—83 to 94 % NW across all bins—completely invert that expectation.
Case Study: Einkorn Wheat at Bouldnor Cliff
In 2015, marine archaeologists exploring the submerged site of Bouldnor Cliff, off the Isle of Wight, recovered sediment cores dated to around 6000 BCE containing DNA from einkorn wheat (Triticum monococcum) — a domesticated Near-Eastern crop.
At that date, Britain was still “Mesolithic” by textbook classification. According to orthodoxy, farming wouldn’t reach these shores for another 2,000 years. The implications were profound.
Key Observations
Trade before farming: The wheat was not locally grown — it was imported, most likely as a traded commodity. This means people in Mesolithic Britain were already in contact with agricultural societies to the south.
Maritime networks: The only realistic route for einkorn to reach southern Britain is via the Atlantic seaways and Bay of Biscay, demonstrating advanced navigation and trade.
Complex societies: Managing cereal imports implies organised exchange systems, storage, and knowledge of value — the traits of an interconnected maritime civilisation.
Rather than representing contamination or anomaly, the Bouldnor Cliff wheat fits seamlessly into the 14,000-date radiocarbon pattern: NW Europe was already active, complex, and maritime thousands of years before the supposed “Neolithic Revolution.”
Population Growth and Hydrology
Population Data (7000–4000 BCE)
Derived from the 14,000 calibrated C14 dates, population proxies show major growth concentrated in the west and north, not along the hypothesised Anatolian corridor.
Country
Estimated Increase
France
+60,200
Germany
+32,600
United Kingdom
+17,200
Poland
+14,600
Denmark
+12,900
If the Fertile Crescent migration model were correct, population booms should have appeared first in Turkey, Greece, and the Balkans. Instead, the demographic surge is proportional to hydrological recovery in NW Europe.
Hydrology: The Missing Variable
Around 3000 BCE, Europe’s swollen post-glacial rivers began to subside after millennia of high water. Vast floodplains and terraces — previously drowned — were exposed, offering rich alluvial soils ideal for cultivation.
Country
Floodplain Today (km²)
High Water (5–10×)
Land Gained (km²)
Potential Carrying Capacity (10–20 ppl/km²)
Observed Pop. Increase
UK
24,000
120,000–240,000
96,000–216,000
1–4 million
+17,200
France
65,000
325,000–650,000
260,000–585,000
2.6–11.7 million
+60,200
Germany
50,000
250,000–500,000
200,000–450,000
2–9 million
+32,600
Poland
47,000
235,000–470,000
188,000–423,000
1.8–8.5 million
+14,600
Denmark
4,000
20,000–40,000
16,000–36,000
0.16–0.72 million
+12,900
The correlation is direct and quantitative: as water levels fell and land was reclaimed, populations grew.
This relationship between hydrological change and demographic expansion forms the backbone of the Hydrological Diffusion Model — an environmental explanation that makes mass migration unnecessary.
Why Migration Isn’t Needed
The orthodox model claims:
Anatolian farmers marched across Europe.
They colonised the continent, replacing hunter-gatherers.
Britain was the final stop around 4000 BCE.
But the evidence says:
Population growth occurred in the west, not the “migration corridor.”
Farming knowledge arrived via trade (e.g. Bouldnor wheat) long before 4000 BCE.
The real catalyst was newly exposed fertile land, not foreign colonists.
In short: when the rivers fell, the locals farmed.
The Forest-Clearance Myth
For decades, British prehistory textbooks painted an epic picture: Neolithic pioneers hacking down the wildwood to carve out fields. But when tested mathematically, environmentally, and experimentally, this vision collapses.
Natural Land Recovery
8000 BCE – Mesolithic: 40% of Britain still flooded; minimal arable ground.
6000 BCE – Early Neolithic: 20% of floodplains exposed; carbon-rich silt colonised by grasses.
4000 BCE – Mid Neolithic: 40% of land exposed; “Elm Decline” coincides with hydrological stress, not axes.
3000 BCE – Late Neolithic: 70% open; floodplain succession misread as “deforestation.”
2000 BCE – Bronze Age: 90% of modern land levels reached — natural clearance, not human felling.
Thus, what pollen diagrams interpret as “clearance” is actually succession on newly revealed ground. Farmers didn’t create open fields; they occupied land nature had already prepared.
The Fertility Catch-22
Forest soils are nutrient-poor. Clearing trees produces exhausted earth. Burning gives only a brief potash spike before collapse. Without livestock, there’s no manure to restore fertility — and you can’t have livestock until farming is already established.
You can’t farm cleared forest until you’re already a farmer. Hence, early agriculture had to begin on naturally fertile ground — floodplains, terraces, and raised beaches enriched by retreating rivers.
Why Forest Clearance Was Physically Impossible
Experimental archaeology and demographic models make the “stone-axe clearance” scenario absurd.
Step 1 – The Farm Scale
Average Neolithic farm: ~10 ha (25 acres)
Tree density: ~300/ha → 3,000 trees
Felling time: 6–8 hrs/tree → ~24,000 hours = 12 years full-time labour
Stump removal adds another 6–8 years → ≈ 18–20 years just to clear 10 ha
Step 2 – National Scale
Reconstructing ~20% forest clearance (30,000 km² = 3 million ha):
24,000 man-hours / 10 ha = 2,400 hrs/ha → 3,000,000 ha × 2,400 hrs = 7.2 billion hours
With ~125,000 able-bodied adult males (half population female, quarter children/elderly) working 1,500 hrs/year:
7.2 billion ÷ 187.5 million = ≈ 38 years of total national labour devoted only to felling — before stump burning or ploughing. Adding those doubles the figure to ~75 years.
Step 3 – Geographic Reality
60% of Neolithic populations lived near coasts and rivers — meaning far fewer inland labourers available for clearance. Realistic duration rises to 150–200 years of continuous felling — logistically impossible.
Conclusion: the “axe-clearing farmers” never existed. Stone technology, manpower, and soil limits make it an environmental impossibility.
Reinterpreting the Pollen Record
Pollen spikes once attributed to burning are consistent with natural peat and lightning fires.
Charcoal layers correspond to wetland drying, not land management.
Elm decline fits disease and flooding stress.
Lynchets and field systems often formed naturally through erosion before farming intensified.
The real driver was hydrological succession, not Neolithic industry.
Genetic Evidence: What DNA Really Shows
Genetics is often presented as the “final proof” of migration — a neat story in which farmers from Anatolia replace foragers across Europe. Yet when the data are read closely, the picture dissolves into nuance.
The Early aDNA Framework
Two landmark studies — Lazaridis et al. (2014, Nature 513) and Haak et al. (2015, Nature 522) — defined three ancestral components in Europe:
Western Hunter-Gatherers (WHG)
Early European Farmers (EEF) from Anatolia
Ancient North Eurasians (ANE)
The key claim was that EEF ancestry spread northwest with agriculture. But in reality:
The EEF proportion in NW Europe is small, far below what mass migration would require.
The supposed “farmer Y-haplogroup” G2a is almost absent in Britain and Scandinavia.
Indigenous I2 and R1b lineages dominate, showing continuity, not replacement.
Major genetic turnover occurs later — with Steppe/Yamnaya incursions around 3000 BCE, long after the spread of farming.
Thus, DNA records interaction, not invasion.
The LaPolice et al. (2025) Study
A new Nature Communications paper (LaPolice, Williams & Huber 2025) modelled the spread of farming using 618 ancient genomes. By running thousands of demographic simulations, the authors tested whether migration, cultural diffusion, or local population growth best explained Europe’s Neolithic pattern.
Findings
“Even modest rates of local adoption can fully explain the archaeological front speed… front speed alone is not diagnostic of demic migration.”
Cultural transmission rate = 0.1 % per year — effectively zero mass exchange.
97 % of population growth occurred within existing groups.
Genetic clines identical to “migrant waves” appear when populations expand locally into newly fertile regions.
Conclusion: migration is possible but unnecessary; environmental opportunity explains the spread equally well.
Why DNA Alone Misleads
Genetic “ancestry” reflects reproduction, not behaviour. LaPolice et al. emphasise:
“Ancestry patterns do not always reflect the underlying behavioural mechanisms.”
Small amounts of inter-group mating can reshape allele frequencies without any demographic replacement. In short, DNA cannot distinguish migration from in-situ growth—exactly the ambiguity the Hydrological Diffusion Model resolves.
Peer-Reviewed Confirmations
Two independent studies now verify the environmental model:
1️⃣ Abraham et al. (2023) – Pollen No Longer Proves Clearance
Preslia 95: 385–411. Re-examined 1 500 pollen sequences and 65 000 archaeological sites over 12 000 years.
Human impact explains only 1–9 % (R² = 0.01–0.09) of variance.
Elevation and long-term vegetation trends dominate.
Many “cereal” grains are misidentified wild grasses.
Spatial resolution 15–40 km → too coarse to infer local clearance.
“Collinearity of influencing factors and existing biases therefore question the general validity of anthropogenic indicators.”
Translation: pollen no longer supports mass deforestation or farmer influx. Environmental dynamics drive the signal — precisely as Langdon’s model predicts.
2️⃣ LaPolice et al. (2025) – Migration Not Required
Already discussed above, but worth restating:
Front-speed modelling reproduces Europe’s Neolithic spread without migration.
Local adoption and environmental suitability fit observed data better than demic diffusion.
Together, Abraham 2023 and LaPolice 2025 close the evidential loop: pollen, radiocarbon, population, and DNA all point to the same mechanism — hydrological adaptation.
Integrating the Lines of Evidence
Dataset
Key Observation
Implication
Radiocarbon (Hinz 2022)
NW Europe active 83–94 % earliest → SE lagging
Farming didn’t diffuse from Anatolia
Bouldnor Cliff (2015)
Imported einkorn 6000 BCE in Britain
Maritime trade before farming
Population vs Hydrology
Land gain = population growth
Environmental cause of Neolithic transition
Pollen (Abraham 2023)
Human impact < 10 %
Clearance myth invalid
DNA (LaPolice 2025)
97 % local growth
Migration unnecessary
All lines converge on one conclusion: Europe’s first farmers were already here. They simply changed their economy when the rivers fell.
But archaeology, like geology, moves forward one corrected assumption at a time. Today, the data mountain is simply too high to ignore.
The Hydrological Diffusion Model
Langdon’s Post-Glacial Flooding Hypothesis explains the anomalies:
Stonehenge Phase 1 (8300 BCE) fits early NW activity.
Car Dyke and Wansdyke are prehistoric canals, not Saxon earthworks.
Doggerland was the heartland — a network of drowned estuaries and river deltas.
Bouldnor Cliff demonstrates contact and trade millennia before 4000 BCE.
When the waters fell, new land appeared — and with it, farming. The transition was ecological, not ethnographic.
The Great Neolithic Reset
Four independent datasets now align:
Radiocarbon: NW Europe dominant by 8000 BCE.
Hydrology: Falling water levels create fertile land.
Pollen: Vegetation change driven by environment.
DNA: Local continuity > 90 %.
The so-called “Farmer Migration” has no empirical footing left. Agriculture arose as an adaptive response to post-glacial hydrology — the moment when Europe’s rivers gave back their land.
History, it turns out, didn’t march from the Middle East; it rose from the falling rivers of the Atlantic world.
References
Abraham, V., et al. (2023). Pollen anthropogenic indicators revisited using large-scale pollen and archaeological datasets: 12 000 years of human–vegetation interactions in central Europe.Preslia 95, 385–411. https://doi.org/10.23855/preslia.2023.385
Ammerman, A. J., & Cavalli-Sforza, L. L. (1971). Measuring the rate of spread of early farming in Europe.Man, 6, 674–688.
Haak, W., et al. (2015). Massive migration from the steppe was a source for Indo-European languages in Europe.Nature, 522, 207–211.
Hinz, M., et al. (2022). Radon-B radiocarbon database for Mesolithic and Neolithic Europe.Scientific Data, 9, 166.
LaPolice, T. M., Williams, K., & Huber, B. (2025). Modeling the European Neolithic expansion shows limited migration and strong local adoption.Nature Communications, August 25 2025.
Lazaridis, I., et al. (2014). Ancient human genomes suggest three ancestral populations for present-day Europeans.Nature, 513, 409–413.
Pinhasi, R., et al. (2005). Tracing the origin and spread of agriculture in Europe.PNAS, 102(43), 15375–15380.
Whittle, A. (2011). The Neolithic: An archaeological perspective. Oxford University Press.
Shennan, S. (2013). Demographic continuity and change in the Neolithic of Europe.Antiquity, 87(338), 723–737.
Woodbridge, J., et al. (2018). Holocene landscape dynamics and woodland resilience in Britain.Quaternary Science Reviews, 190, 1–13.
Langdon, R. J. (2021). The Post-Glacial Flooding Hypothesis. Prehistoric Britain Press.
Podcast
Author’s Biography
Robert John Langdon, a polymathic luminary, emerges as a writer, historian, and eminent specialist in LiDAR Landscape Archaeology.
His intellectual voyage has interwoven with stints as an astute scrutineer for governmental realms and grand corporate bastions, a tapestry spanning British Telecommunications, Cable and Wireless, British Gas, and the esteemed University of London.
A decade hence, Robert’s transition into retirement unfurled a chapter of insatiable curiosity. This phase saw him immerse himself in Politics, Archaeology, Philosophy, and the enigmatic realm of Quantum Mechanics. His academic odyssey traversed the venerable corridors of knowledge hubs such as the Museum of London, University College London, Birkbeck College, The City Literature Institute, and Chichester University.
In the symphony of his life, Robert is a custodian of three progeny and a pair of cherished grandchildren. His sanctuary lies ensconced in the embrace of West Wales, where he inhabits an isolated cottage, its windows framing a vista of the boundless sea – a retreat from the scrutinous gaze of the Her Majesty’s Revenue and Customs, an amiable clandestinity in the lap of nature’s embrace.
Exploring Prehistoric Britain: A Journey Through Time
My blog delves into the fascinating mysteries of prehistoric Britain, challenging conventional narratives and offering fresh perspectives based on cutting-edge research, particularly using LiDAR technology. I invite you to explore some key areas of my research. For example, the Wansdyke, often cited as a defensive structure, is re-examined in light of new evidence. I’ve presented my findings in my blog post Wansdyke: A British Frontier Wall – ‘Debunked’, and aWansdyke LiDAR Flyover video further visualizes my conclusions.
For those interested in British Prehistory, visit www.prehistoric-britain.co.uk, a comprehensive resource featuring an extensive collection of archaeology articles, modern LiDAR investigations, and groundbreaking research. The site also includes insights and extracts from the acclaimed Robert John Langdon Trilogy, a series of books exploring Britain during the Prehistoric period. Titles in the trilogy include The Stonehenge Enigma, Dawn of the Lost Civilisation, and The Post Glacial Flooding Hypothesis, offering compelling evidence about ancient landscapes shaped by post-glacial flooding.
To further explore these topics, Robert John Langdon has developed a dedicated YouTube channel featuring over 100 video documentaries and investigations that complement the trilogy. Notable discoveries and studies showcased on the channel include 13 Things that Don’t Make Sense in History and the revelation of Silbury Avenue – The Lost Stone Avenue, a rediscovered prehistoric feature at Avebury, Wiltshire.
In addition to his main works, Langdon has released a series of shorter, accessible publications, ideal for readers delving into specific topics. These include:
For active discussions and updates on the trilogy’s findings and recent LiDAR investigations, join our vibrant community on Facebook. Engage with like-minded enthusiasts by leaving a message or contributing to debates in our Facebook Group.
Whether through the books, the website, or interactive videos, we aim to provide a deeper understanding of Britain’s fascinating prehistoric past. We encourage you to explore these resources and uncover the mysteries of ancient landscapes through the lens of modern archaeology.
For more information, including chapter extracts and related publications, visit the Robert John Langdon Author Page. Dive into works such as The Stonehenge Enigma or Dawn of the Lost Civilisation, and explore cutting-edge theories that challenge traditional historical narratives.