Roughly twenty-six thousand years ago, the Earth entered the final phase of the last ice age, when more than 30 million square kilometres of the northern continents were mantled by ice. Sea level dropped by over a hundred metres, continents expanded, and the atmosphere became drier and dustier. When the climate warmed, that frozen water returned to the ocean basins, transforming every river and shoreline on the planet. Understanding the magnitude and tempo of this transition is fundamental to reconstructing the landscapes that Holocene societies inherited. (The Post-Glacial Flooding Hypothesis)
The scientific history of sea-level research stretches back more than a century. Fairbridge (1961) first proposed that global “drowned terraces” recorded former sea levels. Oxygen-isotope analysis later provided a direct measure of global ice volume (Shackleton & Opdyke 1973; Chappell & Shackleton 1986). By the 1990s, uranium-thorium dating of coral reefs (Bard et al., 1990) and glacio-isostatic models (Lambeck & Chappell 2001) produced continuous global sea-level curves for the late Quaternary. Satellite altimetry and GRACE gravimetry now track present-day mass exchange between ice sheets and oceans with millimetre precision (Watkins et al., 2015; Cazenave et al., 2018).
These cumulative datasets reveal that the transformation from the Last Glacial Maximum (LGM) to the modern interglacial was neither instantaneous nor globally uniform. The following sections examine the evidence for the magnitude of the LGM, the deglacial rise in sea level, and the feedbacks that coupled ice, ocean, and atmosphere into a single dynamic system.
The Post-Glacial Flooding Hypothesis
2. The Last Glacial Maximum
The LGM, dated between ~26 000 and 19 000 years BP, represents the maximum combined extent of Northern Hemisphere ice sheets. Reconstructions by Ehlers et al. (2018) show the Laurentide Ice Sheet extending south of the Great Lakes, the Fennoscandian complex covering Scandinavia, northern Britain, and the Baltic, and separate domes over the Barents and Kara Seas. In the Southern Hemisphere, the Patagonian, New Zealand, and Antarctic ice sheets expanded simultaneously. Global mean air temperature was about 5–6 °C lower than today (Tierney et al., 2020).
Cosmogenic-nuclide dating of moraines indicates near-synchronous maxima in both hemispheres within 1–2 kyr (Balco et al., 2009). Ice cores from Antarctica record atmospheric CO₂ concentrations of only ~190 ppm, the lowest of the last 800 kyr (Lüthi et al., 2008). The increased planetary albedo and reduced greenhouse forcing locked the Earth into a radiative imbalance until orbital precession increased summer insolation at high latitudes around 21 ka BP, initiating melting.
Sea level at the LGM stood 134 ± 5 m below present (Rohling et al., 2009; Lambeck et al., 2014), implying an extra ~52 × 10⁶ km³ of continental ice—roughly triple modern Antarctic volume. The load depressed the lithosphere by up to a kilometre and generated a peripheral forebulge hundreds of kilometres wide. When deglaciation began, these distortions created regional variations in relative sea level (RSL) of tens of metres—a problem that still complicates correlation between sites.
The Post-Glacial Flooding Hypothesis
3. Quantifying Global Ice and Sea-Level Change
High-resolution oxygen-isotope records from the Red Sea (Rohling et al., 2009) and global benthic stacks (Lisiecki & Raymo, 2005) define the eustatic component of sea-level change. Grant et al. (2014) extended the Red Sea curve to 500 kyr BP and confirmed an approximately linear relation between δ¹⁸O and global mean sea level within ±140 m. Combined with coral-reef U/Th dates (Peltier & Fairbanks 2006) and glacio-isostatic modelling (ICE-6G v2; Peltier et al., 2015), these data yield the following deglacial sequence:
The Post-Glacial Flooding Hypothesis
Stable minimum (26–19 ka) — Sea level constant near −130 m; ice volume at maximum.
Deglacial rise (19–7 ka) — Global mean increase ~120 m; average rate ~1.2 cm yr⁻¹.
Waelbroeck et al. (2019) and Gowan et al. (2021) further improved resolution, showing that roughly 70% of the total rise occurred before 10 ka BP and that rates exceeded 4 cm yr⁻¹ during short meltwater pulses. These figures quantify the pace of global hydrological reorganisation that followed the LGM.
The Post-Glacial Flooding Hypothesis
4. Meltwater Pulses and Deglacial Chronology
Superimposed on the long-term trend are several abrupt accelerations known as Meltwater Pulses (MWPs). MWP-1A (14.6–14.3 ka BP) raised global sea level by 14–18 m in < 400 years (Deschamps et al., 2012). Coral cores from Tahiti and Barbados capture the event as a distinct change in growth depth and isotope composition. MWP-1B, centred near 11.5 ka BP, added another 6–10 m (Liu et al., 2019). A later, smaller pulse (~8.2 ka BP) corresponded to catastrophic drainage of pro-glacial Lake Agassiz into the North Atlantic (Teller et al., 2002).
Numerical models (Gregoire et al., 2012) indicate that collapse of the Laurentide ice saddle triggered MWP-1A, releasing freshwater at ~0.3 Sverdrups—enough to disrupt the Atlantic Meridional Overturning Circulation (AMOC) and cause short-lived cooling across the Northern Hemisphere (Liu et al., 2009). Geomorphic evidence of megafloods, such as the Missoula outburst channels in North America (Bretz 1969; Baker 2013), provides analogues for the required discharge scale.
MWPs demonstrate that deglaciation was a series of threshold events rather than a steady retreat. The timing of pulses aligns closely with abrupt climatic shifts seen in Greenland ice cores (NGRIP Members 2004), underscoring the tight coupling between ice dynamics and global climate.
5. Isostatic Rebound and Crustal Adjustment
Once surface loads were removed, the lithosphere began to rebound. The process is governed by viscoelastic relaxation of the mantle with characteristic times of 1–5 kyr (Milne et al., 2006). Modern GPS and tide-gauge data show uplift of 10 mm yr⁻¹ in central Fennoscandia and subsidence of 1–2 mm yr⁻¹ in southern England and the Netherlands—the collapsing forebulge. Modelling (Lambeck et al., 2014; Peltier et al., 2015) reproduces these patterns when mantle viscosities of 3–5 × 10²¹ Pa s are used.
Rebound created ephemeral basins along glacial margins where meltwater ponded before marine incursion. The Baltic Ice Lake and the Champlain Sea are classic examples, forming as differential uplift temporarily dammed drainage routes (Saarnisto & Salonen 1995; Parent & Occhietti 1999). Many present-day estuaries owe their origins to these basins. Sediment cores from the Humber, Thames, and Rhine estuaries contain alternating freshwater and brackish layers that track the balance between isostasy and eustasy (Shennan et al., 2018).
The Post-Glacial Flooding Hypothesis
6. The Rebirth of the Oceans
Between 19 ka and 7 ka BP, the oceans absorbed roughly 4.5 × 10⁸ km³ of meltwater, raising mean sea level by ~120 m. Coral records from Tahiti, Huon Peninsula, and the Sunda Shelf show a remarkably consistent transgression curve (Deschamps et al., 2012; Hanebuth et al., 2000). By 7 ka BP, sea level stabilised within a few metres of the modern datum.
The redistribution of this mass altered Earth’s rotation and gravitational field, increasing the length of day by 0.5 milliseconds (Mitrovica & Munk 2003) and displacing the geoid by several decimetres. More tangibly, flooding of continental shelves expanded shallow-marine habitats and enhanced nutrient exchange between land and sea, fuelling mid-Holocene marine productivity (Haug et al., 2001). The creation of new estuarine and lagoonal systems also provided nursery grounds for species that later became critical to human subsistence.
7. Climate Feedbacks During Deglaciation
Ice-core and modelling studies reveal that the deglacial rise in greenhouse gases both responded to and accelerated warming. CO₂ increased from 190 ppm at the LGM to 270 ppm by 11 ka BP (Lüthi et al., 2008). Methane doubled from 350 to 700 ppb (Loulergue et al., 2008). The combined radiative forcing of ~2.5 W m⁻² produced a global temperature increase of ~4 °C (IPCC AR6 2021). Shakun et al. (2012) demonstrated that Antarctic warming led the CO₂ rise by several centuries, implying that oceanic outgassing initiated the feedback loop.
Freshwater discharges into the North Atlantic weakened the AMOC and triggered millennial-scale climate reversals. The Younger Dryas (12.9–11.7 ka BP) involved a 5–7 °C drop in Greenland temperatures followed by rapid recovery within a few decades (Severinghaus et al., 1998). Numerical experiments show that such shifts require freshwater fluxes of 0.05–0.1 Sverdrups (Liu et al., 2009). Once meltwater routing shifted southward and AMOC strength recovered, interglacial stability was achieved.
The Post-Glacial Flooding Hypothesis
8. The Transformation of North-West Europe
Retreat of the British–Irish Ice Sheet began near 22 ka BP and concluded by 15 ka BP (Clark et al., 2012). Deglaciation exposed outwash plains and periglacial lakes that evolved into estuaries and wetlands as sea level rose. Seismic and core evidence from the southern North Sea shows basal peats overlain by brackish and marine sediments between 9 and 8 ka BP (Hijma & Cohen 2011). These sequences chart the drowning of Doggerland—a vast lowland linking Britain to Europe. Pollen and macrofossil data indicate temperate woodland colonisation prior to submergence (Gaffney et al., 2009).
Regional RSL curves diverge sharply due to GIA: western Scotland has risen > 40 m since 10 ka, while southern England has subsided by ~10 m (Bradley et al., 2020). Raised beaches in the north and submerged forests in the south reflect this differential motion. In the English Channel, fluvial erosion during early deglaciation carved the “Channel River,” later flooded by 8 ka (Mellett et al., 2013). Similar sequences occur along the Irish and Danish coasts, documenting the progressive marine transgression of northwest Europe.
The Post-Glacial Flooding Hypothesis
9. Towards a Global–Regional Synthesis
By combining isotopic, coral, and geodetic datasets, modern reconstructions achieve decimetre precision for Holocene sea level (Gowan et al., 2021). Three principles emerge:
Proportionality — Sea level and global ice volume vary linearly during deglaciation.
Pulsation — Superimposed meltwater pulses mark thresholds in ice-sheet stability.
Regionality — Local deviations result from isostasy, tectonics, and sediment compaction.
Shennan et al. (2018) synthesised over 500 Holocene RSL indicators for the British Isles, demonstrating that once GIA corrections are applied, regional curves converge on the global mean within analytical error. These findings provide a quantitative baseline for analysing river-terrace altitudes and groundwater histories in later chapters.
Equally important, comparison with modern sea-level observations highlights the extraordinary pace of contemporary change. Satellite altimetry records a mean rise of 3.4 ± 0.4 mm yr⁻¹ since 1993 (Cazenave et al., 2018)—an order of magnitude faster than the late-Holocene background rate (Kopp et al., 2016). The processes that ended the last ice age therefore remain relevant to current climate dynamics.
The Post-Glacial Flooding Hypothesis
10. Conclusion
The end of the last ice age was a planetary event in which ice, water, and rock interacted on colossal scales. Between 26 ka and 7 ka BP, sea level rose more than 120 m, ice sheets vanished from most temperate latitudes, and the hydrological cycle intensified. The evidence—oxygen-isotope curves, coral terraces, basal peats, and glacio-isostatic models—forms a coherent narrative of gradual yet punctuated change.
These quantitative reconstructions define the environmental backdrop for all Holocene landscapes. They also establish a principle crucial to later chapters: that elevation within fluvial and coastal systems encodes time, because each terrace or peat horizon corresponds to a known fraction of global ice volume. The following chapter therefore turns from global physics to the mathematical description of flooding itself—the equations that translate ice-volume change into measurable hydrological response.
Plain-Language Conclusion
The ice age was like the planet putting a huge amount of the world’s water into giant freezers on land. When those freezers started to melt:
All that stored water went back into the oceans.
The seas rose by about 120 metres.
The weight of the ice came off the land, so some places bounced up, others sagged down.
Scientists can see this story in:
tiny shells on the sea floor,
old coral reefs now sitting at the “wrong” depths,
layers of mud and peat around coasts.
Put simply:
We froze the oceans on land, then poured them back in. The combination of rising seas and bouncing crust rearranged coastlines everywhere, and we can measure it.
Robert John Langdon, a polymathic luminary, emerges as a writer, historian, and eminent specialist in LiDAR Landscape Archaeology.
His intellectual voyage has been interwoven with stints as an astute scrutineer in government and grand corporate bastions, a tapestry spanning British Telecommunications, Cable and Wireless, British Gas, and the esteemed University of London.
A decade hence, Robert’s transition into retirement unfurled a chapter of insatiable curiosity. This phase saw him immerse himself in Politics, Archaeology, Philosophy, and the enigmatic realm of Quantum Mechanics. His academic odyssey traversed the venerable corridors of knowledge hubs such as the Museum of London, University College London, Birkbeck College, The City Literature Institute, and Chichester University.
In the symphony of his life, Robert is a custodian of three progeny and a pair of cherished grandchildren. His sanctuary lies ensconced in the embrace of West Wales, where he inhabits an isolated cottage, its windows framing a vista of the boundless sea – a retreat from the scrutinising gaze of Her Majesty’s Revenue and Customs, an amiable clandestinity in the lap of nature.
Exploring Prehistoric Britain: A Journey Through Time
My blog delves into the fascinating mysteries of prehistoric Britain, challenging conventional narratives and offering fresh perspectives grounded in cutting-edge research, particularly LiDAR technology. I invite you to explore some key areas of my research. For example, the Wansdyke, often cited as a defensive structure, is re-examined in light of new evidence. I’ve presented my findings in my blog post Wansdyke: A British Frontier Wall – ‘Debunked’, and a Wansdyke LiDAR Flyover video further visualises my conclusions.
My work also often challenges established archaeological dogma. I argue that many sites, such as Hambledon Hill, commonly identified as Iron Age hillforts, are not what they seem. My posts Lidar Investigation Hambledon Hill – NOT an ‘Iron Age Fort’ and Unmasking the “Iron Age Hillfort” Myth explore these ideas in detail and offer an alternative view. Similarly, sites like Cissbury Ring and White Sheet Camp receive re-evaluations based on LiDAR analysis in my posts “Lidar Investigation Cissbury Ring through time”and “Lidar Investigation White Sheet Camp,“ revealing fascinating insights into their true purpose. I have also examined South Cadbury Castle, often linked to the mythical Camelot56.
My research also extends to ancient water management, including the role of canals and other linear earthworks. I have discussed the true origins of Car Dyke in multiple posts, including Car Dyke – ABC News Podcast and Lidar Investigation Car Dyke – North Section, which suggest a Mesolithic origin 2357. I also explore the misidentification of Roman aqueducts, as seen in my posts on the Great Chesters (Roman) Aqueduct. My research has also been greatly informed by my post-glacial flooding hypothesis, which has helped explain landscape transformations over time. I have discussed this hypothesis in several posts, including AI now supports my Post-Glacial Flooding Hypothesis and Exploring Britain’s Flooded Past: A Personal Journey
For those interested in British Prehistory, visit www.prehistoric-britain.co.uk, a comprehensive resource featuring an extensive collection of archaeology articles, modern LiDAR investigations, and groundbreaking research. The site also includes insights and excerpts from the acclaimed Robert John Langdon Trilogy, a series of books that explore Britain during the Prehistoric period. Titles in the trilogy include The Stonehenge Enigma, Dawn of the Lost Civilisation, and The Post-Glacial Flooding Hypothesis, which offer compelling evidence of ancient landscapes shaped by post-glacial flooding.
To further explore these topics, Robert John Langdon has developed a dedicated YouTube channel featuring over 100 video documentaries and investigations that complement the trilogy. Notable discoveries and studies showcased on the channel include 13 Things that Don’t Make Sense in History and the revelation of Silbury Avenue – The Lost Stone Avenue, a rediscovered prehistoric feature at Avebury, Wiltshire.
In addition to his main works, Langdon has released a series of shorter, accessible publications, ideal for readers delving into specific topics. These include:
For active discussions and updates on the trilogy’s findings and recent LiDAR investigations, join our vibrant community on Facebook. Engage with like-minded enthusiasts by leaving a message or contributing to debates in our Facebook Group.
Whether through the books, the website, or interactive videos, we aim to provide a deeper understanding of Britain’s fascinating prehistoric past. We encourage you to explore these resources and uncover the mysteries of ancient landscapes through the lens of modern archaeology.
For more information, including chapter extracts and related publications, visit the Robert John Langdon Author Page. Dive into works such as The Stonehenge Enigma or Dawn of the Lost Civilisation, and explore cutting-edge theories that challenge traditional historical narratives.
This article was first written as a critique of the 2020 television interpretation of the Durrington Walls “mega-monument” — the claim that a broken arc of large pits around Durrington Walls represented a vast Late Neolithic ceremonial structure. (The Durrington Mega-Monument Hoax: What Lies Beneath? – Debunked)
At the time, the central problem was already clear: the programme and the published interpretation began with monuments, alignments and ritual meaning, when they should have begun with the physical landscape.
That criticism has now become much stronger.
The Durrington pits have now been plotted against LiDAR data, palaeochannels, and former water-affected terrain. That changes the question completely. The issue is no longer simply whether large pits exist around Durrington Walls. Some clearly do. The question is whether those pits form a single planned monument — or whether they are large pits, hollows, modified natural features and sediment traps sitting along former river margins.
Once the credible pits are mapped against the hydrological landscape, the strange broken “circle” begins to look very different. The pits appear to fit former palaeochannel and shoreline zones. The gaps in the supposed monument are not mysterious missing sections. They are exactly what a water-margin model would predict: areas that were either dry ground outside the former water system, or areas that were once active water where pits would not be dug, would not survive, or would be hidden beneath later river deposits.
This is the key point missed in the original interpretation.
A broken ring of pits does not automatically become a monument because it can be drawn as a circle on a map. A line of holes does not automatically become ritual because it can be linked to the sky. Archaeology has to explain the ground first.
(The Durrington Mega-Monument Hoax: What Lies Beneath? – Debunked)
The dating evidence also needs to be understood correctly. The Stonehenge Mesolithic post-hole evidence comes from pine wood or charcoal. The Durrington evidence includes shell-bearing deposits from a water-affected chalk landscape. These are different types of material, and they should not be treated as if they all give the same kind of direct construction date.
But that is not the argument being made here.
The point is not that every date is exact, identical or directly comparable. The point is that dated and datable evidence appears repeatedly within the same hydrological elevation band. The Stonehenge post-hole evidence shows early Mesolithic activity at a water-margin level. The Durrington shell-bearing horizons show water-derived material at comparable OD levels in the wider landscape. The Stonehenge Bottom boreholes show the same broader pattern of shells, gravels, silts, organic matter, and water-affected deposits.
Taken together, these are not isolated oddities.
They suggest a long-lived water-margin landscape.
This is why the Durrington shell-bearing deposits are so important. They should not be forced into the role of simple “construction dates” for a Late Neolithic monument. Their greater value lies in their ability to record water-derived material at measurable depths and OD levels within the pit system. When those levels correspond with the Stonehenge Bottom borehole evidence and the wider Mesolithic activity horizon, the pattern becomes hydrological rather than ceremonial.
The core evidence is equally awkward for the monument model. Several of the Durrington features contain complex sediments, shell-bearing deposits, calcareous silts, bone, charcoal, flint and reworked material. One of the major features was not even bottomed at seven metres. This is not the clean profile of a single, uniform ceremonial construction event. It is the profile of a long-lived and repeatedly altered landscape.
The 2025 reassessment added more scientific techniques, including further geophysics, boreholes, chemostratigraphy, OSL work and environmental analysis. But the central interpretive problem remains. The new science still has not properly tested the simplest physical explanation: that the pit distribution follows former water margins better than it follows an idealised ritual circle.
This matters because the same interpretive failure has now reappeared at Bulford. There, two postholes have been promoted as evidence for solar alignment and an “older Stonehenge” style monument before the river-facing landscape, palaeochannels, hydrology and full dating evidence have been properly tested. Durrington and Bulford are not separate mistakes. They are examples of the same problem: pits and postholes are being turned into cosmology before the landscape beneath them has been understood.
This article has therefore been rewritten.
The aim is no longer simply to debunk a television programme. It is to show that the Durrington “mega-monument” may be a classic case of archaeological over-interpretation: a hydrological landscape misread as a ritual structure.
What lies beneath Stonehenge is not just ceremony.
It is water, sediment, shoreline, retreating rivers, buried soils, shell-bearing deposits and a post-glacial landscape that archaeology has still not properly faced.
(The Durrington Mega-Monument Hoax: What Lies Beneath? – Debunked)
1. The Claim Sold to the Public
In 2020, the public was presented with one of the most dramatic claims about the Stonehenge landscape in years: a vast circle or circuit of massive pits surrounding Durrington Walls.
The story was simple and powerful. Large pits, some around twenty metres wide and several metres deep, appeared to form a broken arc around Durrington Walls henge. Larkhill causewayed enclosure seemed to sit within the wider arrangement. The pattern was then interpreted as a huge Late Neolithic structure: a boundary, a ceremonial landscape marker, perhaps even a cosmological monument on a scale previously unrecognised in Britain.
It was perfect television archaeology.
There were hidden features beneath the fields. There was a giant lost monument. There was Stonehenge nearby. There were alignments, boundaries, ritual landscapes and the suggestion that Neolithic people had organised the land at an almost unimaginable scale.
But the problem was not the discovery of the pits.
The problem was the story built around them.
A group of large pits does not automatically prove the existence of a single monument. A broken arc does not automatically prove a planned circle. A pattern on a map does not become ceremonial simply because it can be drawn neatly around a famous henge.
Before the pits are turned into cosmology, the landscape itself has to be explained.
That is where the 2020 interpretation failed.
The 2020 paper presents the features as large pits/anomalies forming arcs around Durrington Walls, and offers a broader interpretation that leans toward a large-pit structure or boundary around the henge.
(The Durrington Mega-Monument Hoax: What Lies Beneath? – Debunked)
2. The First Problem: Spatial Pattern Is Not a Construction Event
The first problem with the Durrington “mega-monument” interpretation is simple: a spatial pattern is not the same thing as a construction event.
Archaeology often begins with pattern recognition. That is fair enough. If a group of large features appears to form an arc, a circle or a boundary, it deserves investigation. But pattern recognition is only the beginning of analysis. It is not the conclusion.
To prove that the Durrington pits formed a single planned monument, we would need more than a broken arrangement on a map. We would need evidence that the pits were made as part of the same project.
That means asking basic questions.
Were they dug at the same time?
Were they made by the same method?
Do they have consistent dimensions?
Do they have consistent depths?
Do they contain comparable fills?
Do they share the same dating horizon?
Do they show the same construction sequence?
Do they have a clear structural purpose?
Do they relate to posts, banks, ditches or entrances in a consistent way?
The variuos sized pit shapes and depths is a very clear indication they are not connected – (The Durrington Mega-Monument Hoax: What Lies Beneath? – Debunked)
Without that evidence, the “mega-monument” remains an interpretation placed over a group of features, not a demonstrated construction event.
The published evidence does not show a neat, uniform monument. It shows a mixed landscape of large anomalies, pits, probable pits, possible modified natural features, post alignments, uncertain features, different survey methods, varying levels of excavation, different dates, and varying degrees of confidence.
Some features are known mainly from geophysics. Some were partly excavated. Some were cored. Some were not bottomed. Some were originally interpreted as natural sinkholes or solution hollows. Some have Late Neolithic evidence. Others have Bronze Age, Iron Age, Romano-British or even later material. Feature ii remains particularly weak and should not be used as a secure part of any argument.
This is not how a clean single-event monument should behave.
The dimensions also vary. The published tables show upper diameters ranging from roughly fifteen to twenty-three metres. Depths vary from around two metres to more than seven metres, with several features not bottomed. That is a major problem if the claim is a single designed monument with a shared purpose.
Variation is not fatal by itself. Ancient monuments do not have to be machine-perfect. But variation in size, depth, date, evidence type, fill history, and certainty must be explained before the features are treated as a single structure.
The Durrington interpretation moves too quickly from “these features appear to form arcs” to “these features form a monumental circuit”.
That leap is the problem.
A shoreline can create an arc.
A palaeochannel can create an arc.
A terrace edge can create an arc.
A springline can create an arc.
A former river margin can result in a broken, irregular distribution of large water-affected features.
So, before the pits are treated as a planned ritual boundary, the physical landscape must be tested first. If the same pattern can be explained by palaeochannels, former shorelines and falling water levels, then the monument interpretation is no longer the simplest explanation.
It becomes more complicated.
(The Durrington Mega-Monument Hoax: What Lies Beneath? – Debunked)
3. The 2026 LiDAR Test: The Pits Fit Palaeochannels
The most important new evidence is not another theory.
It is the map.
When the Durrington pits are plotted against LiDAR data, palaeochannels, and former water-affected terrain, the supposed “mega-monument” begins to lose its mystery. The pattern no longer looks like a clean, planned circle around Durrington Walls. It looks like a broken distribution of large features sitting on, beside, or within former water-margin terrain.
That changes the interpretation completely.
The credible pits appear to follow palaeochannels and former shoreline zones. They do not need to be forced into a ceremonial circuit to make sense. They make sense as features associated with a changing river landscape.
(The Durrington Mega-Monument Hoax: What Lies Beneath? – Debunked)
This also explains the gaps.
In the monument model, the gaps are awkward. A huge ceremonial circle with missing sections needs an explanation: lost archaeology, unsurveyed areas, incomplete construction, later destruction, or symbolic absence.
In the hydrological model, the gaps are expected.
Where the land was not affected by the former water system, there is no reason to expect shoreline pits or water-margin sediment traps. Where the ground was once active water, there is also no reason to expect the same kind of pit survival. Features could have been unnecessary, impossible to dig, scoured away, buried beneath later alluvium, or masked by later river change.
So the gaps are not a weakness in the hydrological model.
They are one of its strongest predictions.
This is the point missed by the 2020 interpretation. The question should never have been simply, “Can these features be drawn as a circuit?” The proper question was, “Do these features fit the former river landscape better than they fit an idealised monument?”
Once that test is applied, the answer becomes difficult to ignore.
The pits fit the palaeochannels.
The gaps fit the palaeochannels.
The strange distribution fits the palaeochannels.
Feature ii remains questionable and should not be used to hold the model together. But once that weak outlier is removed, the remaining pattern becomes clearer. The credible features sit where a water-margin model would expect them to sit, while the missing sections occur where a water-margin model would expect them to be missing.
That is not a coincidence. That is landscape logic.
This does not mean every pit must have had the same origin or function. Some may be cut features. Some may be modified natural hollows. Some may be sediment traps. Some may have been reused. Some may have begun naturally and later acquired cultural material. That is exactly what we should expect in a complex river-edge landscape active over long periods.
What it does mean is that the “single mega-monument” interpretation is no longer the simplest explanation.
A ritual circle has to explain why the pits vary so much, why some are doubtful, why the dates are mixed, why several fills look reworked, why the circuit is broken, and why the missing parts occur where the hydrology predicts absence.
The palaeochannel model explains all of that more naturally.
The Durrington pits are not just dots around a henge.
They are features in a post-glacial river landscape.
Until the published interpretation can show that the pit distribution is better explained by monument geometry than by palaeochannels and former shorelines, the “mega-monument” claim remains unproven.
(The Durrington Mega-Monument Hoax: What Lies Beneath? – Debunked)
4. The Gap Problem: A Monument Fails Where Hydrology Predicts Success
The gaps in the Durrington pit distribution are not a minor detail.
They are the test.
If the pits are interpreted as a single planned monument, the missing sections become a problem. A vast ceremonial circuit should have a clear design logic. If large parts of that circuit are absent, the explanation has to be added afterwards: perhaps the pits were destroyed, perhaps they were never found, perhaps they were not visible to survey, perhaps the monument was incomplete, or perhaps the gaps had some symbolic meaning.
That is not evidence.
That is rescue archaeology for a weak interpretation.
In the hydrological model, the gaps do not need to be rescued. They are predicted by the landscape.
Where the former water system did not reach, there is no reason to expect water-margin pits, shoreline hollows, sediment traps or shell-bearing deposits. Where the former water zone was active, unstable or actually underwater, there is also no reason to expect the same type of pit survival. Features could have been impossible to dig, unnecessary, eroded, buried, masked, or replaced by later river deposits.
(The Durrington Mega-Monument Hoax: What Lies Beneath? – Debunked)
This is why the broken pattern matters.
The apparent gap on one side of the supposed circuit corresponds with land that does not fit the former water-margin model. No shoreline, no pits.
The apparent gap on the other side corresponds with ground that was once within the active Avon/water system. Active water does not preserve a neat ceremonial pit circuit. It cuts, scours, silts, masks and moves.
So what looks like a failed monument becomes a successful hydrological prediction.
The monument model has to explain why the circuit is missing where it is missing.
The water model already explains it.
This is the central weakness of the “mega-monument” claim. The interpretation begins by drawing a circle and then struggles to explain the broken evidence. But if the pits are plotted against palaeochannels and former shorelines first, the broken pattern is no longer broken. It is exactly what a changing river-edge landscape should produce.
The gaps are not missing archaeology.
They are the landscape telling us that the original interpretation started in the wrong place.
(The Durrington Mega-Monument Hoax: What Lies Beneath? – Debunked)
5. The Dating Problem: Shell, Bone and Pine Are Not the Same Evidence
The dating evidence at Stonehenge and Durrington must be handled carefully because not all radiocarbon samples date the same event.
This is where confusion can easily enter the argument.
The Mesolithic post-hole evidence at Stonehenge is associated with pine wood or charcoal. That kind of sample dates human activity involving timber. It does not date the river directly. It tells us that people were active at that location, at that period, and within that landscape setting.
The Durrington shell evidence is different. Shell is not timber. Shell is a carbonate material from a water-affected environment. It is therefore more useful here as evidence for shell-bearing, water-derived sediment at a particular depth and OD level than as a simple “construction date” for a pit.
That distinction matters.
The argument being made here is not that pine charcoal, shell and bone are all identical samples giving identical meanings. They are not.
The argument is that different kinds of dated and datable evidence repeatedly occur within a coherent hydrological landscape.
Pine or charcoal can show human activity at a water-margin location.
Shell can show water-derived material within a specific sediment horizon.
Bone can provide a terrestrial date for later activity, deposition or infilling within the same feature.
These are different kinds of evidence, but together they help build a landscape sequence.
This is why the Durrington shell dates should not be dismissed simply because they differ from bone dates. The report itself recognised that the shell dates do not behave like simple construction dates. That is true. But that does not make the shells meaningless. It means they are telling us something different.
They are not necessarily dating the moment a pit was dug.
(The Durrington Mega-Monument Hoax: What Lies Beneath? – Debunked)
They are dating, or at least period-associating, shell-bearing material within the water-affected sediment system.
For a dry-land monument model, that is awkward.
For a hydrological model, it is exactly the kind of evidence we would expect.
The Durrington shell horizons occur within deep, complex, calcareous and reworked deposits. Their value is not that they provide a neat construction date for a Late Neolithic monument. Their value lies in their placement of shell-bearing, water-derived material at measurable depths within the pit system. Once those depths are converted to OD levels and compared with Stonehenge Bottom, the pattern becomes more important than any single date.
Bone dates have a different role. Bone collagen is a terrestrial sample and is generally more useful for dating later activity or fill events within the pits. But a later bone date does not cancel the hydrological meaning of an earlier shell-bearing horizon. It simply shows that the feature or sediment system remained open, active, reused, reworked or infilled over a long period.
That is the key point.
If a pit contains older shell-bearing material and later bone-bearing deposits, the correct response is not to force the whole feature into one tidy construction date. The correct response is to recognise a multi-phase sediment sequence.
That is exactly what a water-margin landscape should produce.
Material can be washed in.
Older sediment can be reworked.
Shells can be redeposited.
Bone can enter later.
Charcoal can be introduced by human activity.
Silts, gravels and calcareous sediments can accumulate through repeated environmental change.
The dates are therefore not a weakness in the hydrological interpretation. They are part of the reason the dry “single monument” interpretation is so vulnerable.
A single construction event should produce a cleaner chronological pattern.
The Durrington evidence does not.
The shell evidence points to water-derived deposits.
The bone evidence points to later activity or infilling.
The Stonehenge pine evidence points to earlier human activity at a comparable water-margin landscape.
The important connection is not that every sample gives the same date.
It is that the evidence repeatedly appears within the same kind of hydrological setting.
That is why this article does not treat the Durrington shell dates as simple proof that a pit was dug at one exact moment. Instead, they are used as part of a wider hydrological sequence: dated shell-bearing horizons, measurable OD levels, evidence from the Stonehenge Bottom borehole, Mesolithic activity at Stonehenge, and a falling river system that could remain active for centuries or millennia.
This is the difference between dating a monument and dating a landscape.
The 2020 interpretation tried to use the dating evidence to support a Late Neolithic pit structure.
The hydrological interpretation asks a better question:
What do the dates, materials, depths and OD levels tell us about the former river landscape?
Once that question is asked, the evidence stops looking like a problem.
It starts looking like the answer.
(The Durrington Mega-Monument Hoax: What Lies Beneath? – Debunked)
6. The C14 Sequence Does Not Behave Like a Simple Dry Pit
The radiocarbon sequence at Durrington does not behave like a clean, sealed, dry-land pit sequence.
That is a major problem for the “single monument” interpretation.
In a simple dry pit, the dating pattern should normally be fairly straightforward: lower material is generally older. Higher material should generally be younger. If the pit was dug and filled as part of one construction event, the dating should cluster around that event or its immediate aftermath.
That is not what we see.
The Durrington dates are mixed, multi-phase and materially different. They include shells from water-derived deposits and bones from later terrestrial/cultural deposits. That alone should prevent anyone from treating the whole pit system as a simple one-date construction event.
The first issue is the labelling problem.
One shell sample, SUERC-92464, is listed from a depth of 4.80–4.85m below ground level and produced a published calibrated date of 6080–5990 cal BC. The feature label is not straightforward. The main paper and core sequence associate BH1 with 7A, while one supplementary radiocarbon listing appears to create a 9A / BH1 confusion.
That matters for database accuracy, but it does not destroy the hydrological argument.
The secure data are the lab number, material, depth and calculated OD horizon. If the surface height used in the LiDAR model is approximately 99m OD, then a sample at 4.80–4.85m below ground sits at about 94.15–94.20m OD. That is the important point. The sample belongs to a shell-bearing horizon at a measurable elevation within the Durrington pit system.
The argument should therefore be anchored to the sample, not the disputed label:
SUERC-92464 shell 4.80–4.85m below ground published date 6080–5990 cal BC approximate modelled horizon c.94.15–94.20m OD feature label requires caution because of the 7A / 9A inconsistency
That is how the evidence should be handled scientifically.
The second issue is 8A.
(The Durrington Mega-Monument Hoax: What Lies Beneath? – Debunked)
Here, the dating sequence is even more revealing.
8A contains a shell date from 1.50–1.55m below ground, published at 4710–4550 cal BC. It also contains a deeper shell date from 4.35–4.40m below ground, published at 3930–3690 cal BC. Then, near the base, bone from around 4.79m produced a much later date, published at 2460–2200 cal BC.
That is not a simple dry-pit sequence.
A neat monument model would struggle with that order. Older shell-bearing material sits above or within a sequence that later includes much younger bone. The fills are not behaving like a single clean construction deposit.
But a water-margin model does not struggle with this.
In a river-edge or palaeochannel landscape, older shell-bearing sediment can be reworked, washed, slumped or redeposited into later features. As water levels fall, channels shift, margins retreat, sediment is disturbed, and older material can be incorporated into younger fills. Later bone, charcoal, flint, or cultural debris can then enter the same feature during subsequent use, collapse, silting, or reworking.
That is not contamination in the casual sense.
It is a landscape process.
The Durrington evidence makes far more sense if the pits are not treated as sealed ceremonial holes but as complex sediment traps within a changing water-margin landscape.
This also explains why shell evidence should not be dismissed simply because it does not match the bone’s date. The shell is not trying to date the pit as a monument. It records shell-bearing, water-derived material within the pit fill. The bone is recording a later terrestrial or cultural event within the same complex sequence.
Those are different facts.
Both matter.
The real problem is the attempt to compress them into one monument story.
The C14 evidence instead points to a long and complex landscape history. Shell-bearing horizons, later bone deposits, reworked sediments, and deep unbottomed features do not support a simple dry-land construction event. They support a multi-phase environment in which water, sediment and later human activity interacted over long periods.
That is exactly what the LiDAR and palaeochannel model predicts.
The dates do not break the hydrological interpretation.
They break the tidy monument story.
(The Durrington Mega-Monument Hoax: What Lies Beneath? – Debunked)
7. The OSL Problem: Where Is the Full Chronology?
The OSL evidence is another major weakness in the Durrington “mega-monument” interpretation.
In the 2020 paper, the luminescence work was not presented as a complete, fully resolved OSL dating model for the pit system. What was published was mainly luminescence stratigraphy: OSL and IRSL signal profiling through selected cores, especially 8A and 5A. That is useful, but it is not the same thing as publishing a full chronological model with all age estimates, dose rates, rejected samples, uncertainty ranges and reasons for exclusion.
That distinction matters.
Luminescence stratigraphy can show changes in sediment packages. It can show reworking. It can show breaks. It can show whether lower deposits have a different depositional history from upper deposits. But unless the full dating dataset is published, it cannot be independently tested as a complete chronology.
This is especially important at Durrington because the luminescence evidence was not simple.
In 8A, the signal pattern suggested redeposited material through part of the sequence. That is already significant, because redeposition is exactly what a water-margin or palaeochannel model would predict.
In 5A, the problem becomes even bigger. The feature was not bottomed at seven metres, and the luminescence profile indicated a major change in the lower sequence. There was also a light-exposed section of core, which limited normal OSL sampling. That is not a minor technical detail. It affects how confidently the lower deposits can be understood.
So the question is obvious:
Where is the full chronology?
(The Durrington Mega-Monument Hoax: What Lies Beneath? – Debunked)
If the interpretation is going to claim a massive Late Neolithic pit structure, then every dating line matters. The full OSL evidence should be available for scrutiny, including:
all sampled depths all accepted OSL ages all rejected OSL ages all dose-rate data all equivalent-dose estimates all uncertainty ranges all light-exposed intervals all failed or unsuitable samples all reasons for excluding samples from the final model all links between OSL samples, core depths, sediment units and OD levels
Without that, the reader is asked to accept the interpretation without being able to properly test its chronological foundations.
This matters because inconvenient dates are not noise if the real question is hydrology.
A date that does not fit a neat Late Neolithic monument story may still be extremely important. It may date an older sediment package. It may identify redeposited water-margin material. It may show that a pit was cut into a much older palaeochannel fill. It may prove that the feature has a longer landscape history than the monument model allows.
In a purely ceremonial interpretation, awkward dates can be labelled residual, redeposited, contaminated or irrelevant.
In a hydrological interpretation, those same dates may be the evidence.
That is why the OSL problem is so important. The 2020 report already showed that the sediment history was complex, but it did not publish a full OSL chronological archive sufficient to test the hydrological alternative. Later work added more OSL dating and environmental analysis, but the same interpretive assumption remained: the features were still being pulled back into the pit-structure model.
That is not good enough.
If these pits are sitting on palaeochannels and former river margins, then the lower, older, reworked or awkward sediment packages are not side issues. They are central to understanding the site.
The full chronology should decide the interpretation.
The interpretation should not decide which chronology matters.
(The Durrington Mega-Monument Hoax: What Lies Beneath? – Debunked)
8. The Core Logs: These Are Sediment Traps, Not Simple Ritual Holes
The core logs are among the most important pieces of evidence in the entire Durrington debate.
They show that the features are not simple, clean, ceremonial holes with a straightforward construction story. They are deep, complex sediment sequences.
Feature 7A reached fractured chalk at around five metres. Immediately above that lower chalk horizon was a shell / mollusc-bearing sample. That matters because it places water-related material close to the base of the feature, not merely as a casual surface intrusion.
Feature 8A is even more important. Its lower fills contained grey calcareous silts, molluscs, bone fragments and a struck flint. The mollusc-bearing sediment was not an incidental find sitting at the top of the feature. It formed part of a deeper calcareous sequence. That is exactly the sort of deposit expected in a water-affected landscape where older shell-bearing material, silt and cultural debris can be trapped, reworked or redeposited.
Feature 5A is different again. It was cored to seven metres and still not bottomed. Its sequence included bone, charcoal, flint-rich material, fragmentary lower deposits and a major change beneath the upper dated levels. That is not the profile of a simple, uniform pit dug and filled in a single neat event. It is a deep and unresolved sediment archive.
These three cores alone should have stopped the interpretation from becoming too tidy.
7A gives a basal shell-bearing horizon.
8A gives calcareous silts and molluscs within a deeper reworked sequence.
5A gives a deep, unbottomed, and complex fill with bone-, charcoal-, and flint-rich material.
(The Durrington Mega-Monument Hoax: What Lies Beneath? – Debunked)
Taken together, they point to a landscape of sediment movement, water action, reworking and later activity. They do not point clearly to a single ritual construction event.
This is the difference between seeing the pits as “monumental holes” and seeing them as part of a former river-edge landscape.
A ceremonial interpretation looks at the size of the holes and asks what symbolic boundary they might have formed.
A hydrological interpretation looks at the fills and asks what processes created, altered or filled them.
The core logs favour the second question.
They show that the Durrington features are not just empty spaces in the chalk. They are sediment traps. They contain the history of the landscape that filled them.
That history includes water.
(The Durrington Mega-Monument Hoax: What Lies Beneath? – Debunked)
9. The Stonehenge Bottom Connection
The Durrington evidence matters because it does not stand alone.
Stonehenge Bottom has long been treated as if its water-affected deposits could be dismissed as background geology, chalk solution, ancient fossil material, or an irrelevant natural disturbance. That position is no longer safe.
The Durrington pits show that shell-bearing, calcareous, and water-affected deposits occur within the wider Stonehenge landscape in contexts that yield Holocene radiocarbon dates. That does not mean every shell at Stonehenge Bottom is the same age as every shell at Durrington. It does not mean that every shell records the same event. It does not mean every deposit belongs to a single flood.
That is not the argument.
The point is simpler and stronger.
Shell-bearing deposits in this landscape cannot just be waved away.
(The Durrington Mega-Monument Hoax: What Lies Beneath? – Debunked)
They must be tested.
At Stonehenge Bottom, the borehole evidence records repeated water-related material: shells, gravels, sands, silts, marl, organics, peat-like staining, solution features and water-affected chalk. These are not isolated oddities. They occur across multiple boreholes and repeatedly within the same hydrological elevation band.
At Durrington, shell-bearing horizons occur inside deep, complex pit fills associated with calcareous silts, reworked sediments and later material. Again, the correct response is not to dismiss the shells because they complicate the monument’s story. The correct response is to ask what hydrological system placed shell-bearing material at those depths and OD levels.
That is where the connection becomes important.
Durrington proves that shell-bearing deposits within the Stonehenge landscape can be part of the Holocene sedimentary record. Stonehenge Bottom shows that similar water-affected material occurs repeatedly across a wider borehole system. Together, they point to a landscape where water, sediment, shells, organics and human activity interacted over long periods.
This does not prove that every feature was flooded at the same time.
It proves that the dry-land assumption is no longer good enough.
If shells at Durrington can be dated, then shells at Stonehenge Bottom should be dated.
If calcareous silts at Durrington can be analysed, then silts and marl at Stonehenge Bottom should be analysed.
(The Durrington Mega-Monument Hoax: What Lies Beneath? – Debunked)
If Durrington’s deposits require OSL, radiocarbon, sedimentology and environmental testing, then Stonehenge Bottom deserves the same treatment.
The scientific response is obvious:
date the shells identify the species test the carbonate source analyse the sediment calculate the OD levels compare the horizons model the hydrology
Anything less is not science. It is an assumption.
The Durrington evidence, therefore, strengthens the Stonehenge Bottom argument. It shows that shell-bearing, water-affected deposits in this landscape are not archaeological background noise. They may be the record of the landscape itself.
And that is exactly what the “mega-monument” interpretation failed to consider.
The pits were not sitting in an abstract ceremonial diagram.
They were sitting in the same wider post-glacial water landscape that shaped Stonehenge Bottom.
(The Durrington Mega-Monument Hoax: What Lies Beneath? – Debunked)
10. The 2025 Reassessment: More Science, Same Assumption
The 2025 reassessment is important because it added more evidence.
The new work incorporated additional geophysics, including magnetometry, ground-penetrating radar, electromagnetic ground conductivity, and electrical resistivity tomography. It also added drone survey, boreholes, core analysis, geochemistry, chemostratigraphy, OSL profiling and dating, and sedimentary ancient DNA.
That sounds impressive.
And in one sense, it is. More data is always better than less data.
But more science does not automatically mean a better interpretation.
The problem with the 2025 reassessment is that the additional techniques were still largely used to test and defend the pit-structure interpretation, rather than to properly test the competing hydrological explanation. The paper continued to treat the features as a large prehistoric pit structure surrounding Durrington Walls, even while acknowledging variable features, possible natural origins, unproven anomaly ii, differing depths, complex fills and multiple sediment histories.
That is the central weakness.
The new work improved the description of the pits, but it did not break free from the original assumption.
(The Durrington Mega-Monument Hoax: What Lies Beneath? – Debunked)
If the features sit on palaeochannels and former water margins, then the correct test is not simply whether they resemble other pits. The correct test is whether their distribution is better explained by hydrology than by monument geometry.
Do the pits follow former river margins?
Do the gaps correspond with dry land outside the water system?
Do the missing sections correspond with former active water?
Do the depths and OD levels match falling water horizons?
Do shell-bearing layers, calcareous silts and reworked sediments align with palaeochannel positions?
Do the dated horizons behave like shoreline deposits rather than construction deposits?
These are the questions that should have been placed at the centre of the reassessment.
Instead, the interpretation still moves back toward monumentality. The features are repeatedly pulled into the language of arcs, alignments, pit structures, boundaries, Durrington Walls and Larkhill. The landscape is still being organised around a ceremonial model rather than a water model.
This is why the 2025 paper does not close the debate.
It actually strengthens the hydrological critique.
The more sediment evidence is added, the less convincing a simple ritual pit-circuit becomes. Boreholes, chemostratigraphy, OSL and sedaDNA are not just tools for confirming monumentality. They are tools for reconstructing the landscape process. They can show reworking, environmental change, sediment movement, palaeoecology, water-derived material and long-term infilling.
That is exactly why the hydrological model must be tested.
The 2025 reassessment shows that the pits are complex. It shows that they contain layered environmental histories. It shows that no recorded pit has been totally excavated. It shows that individual cores cannot provide full geometry. It shows that remote sensing alone cannot completely define these features.
Those admissions matter.
They mean the interpretation should become more cautious, not more confident.
If the features have not been fully excavated, if the lower sequences remain complex, if some pits are unbottomed, if natural origins remain possible, and if the spatial distribution has not been tested against former water margins, then the “mega-monument” claim remains unproven.
The 2025 reassessment added more science.
But it did not ask the most important question:
Are these really the remains of a planned ceremonial pit structure, or are they the archaeological trace of a changing Avon river landscape?
Until that test is done, the extra science has not solved the problem.
It has simply given us more evidence that the original interpretation may have been based on the wrong assumption.
(The Durrington Mega-Monument Hoax: What Lies Beneath? – Debunked)
11. The Bulford Repeat: Same Mistake, Smaller Site
The Durrington problem is not an isolated case.
The same interpretive failure has now reappeared at Bulford.
At Durrington, large pits, hollows and uncertain features were drawn into a vast “mega-monument” story. The pattern was pushed toward boundary, ceremony, cosmology and large-scale Neolithic planning before the hydrological landscape was properly tested.
At Bulford, the scale is smaller, but the method is familiar.
Two postholes have been promoted as evidence for solar alignment, with suggestions of an earlier Stonehenge-style monument. Once again, the story moves quickly from holes in the ground to sunrise, ritual and Stonehenge.
The problem is not the archaeology.
The problem is the interpretation.
Real features exist at Bulford. Real features exist at Durrington. But real features do not automatically prove the story being built around them.
At Durrington, pits became cosmology.
At Bulford, two postholes became an older Stonehenge.
In both cases, the same method appears:
select a limited number of features draw a line or circuit notice a sunrise or horizon relationship invoke ritual or ceremonial meaning connect it to Stonehenge treat the physical landscape as background scenery
That is backwards.
The correct order should be:
landscape first hydrology second dating third interpretation last
Before Bulford is turned into a solar monument, the river-facing landscape must be tested. Its relationship to the Nine Mile River, the Avon, local topography, former water levels, routeways, palaeochannels and sediment history must come first.
(The Durrington Mega-Monument Hoax: What Lies Beneath? – Debunked)
Before Durrington is turned into a cosmological pit circle, the same test must be applied there. Do the pits form a monument, or do they fit former palaeochannels and shoreline zones? Do the gaps prove missing ceremony, or do they mark areas of dry land and former active water?
That is why the Bulford case matters.
It shows that the same mistake is still being made.
The Stonehenge landscape is being read from the sky down, when it should be read from the ground up.
This is not how science should work. Two points always make a line. Some lines will point at the sun. A broken arc can always be turned into a symbolic circle if the missing parts are explained away. But that does not prove prehistoric intention.
It proves only that modern interpreters are very good at drawing patterns.
The Bulford Hoax article deals with that problem directly. It shows how quickly a limited set of features can be turned into a headline claim before the full landscape evidence has been published and tested.
Durrington is the larger version of the same failure.
At both sites, the archaeology should have been tested against water, terrain, sediment, dating and palaeochannels before it was dressed up as monumentality.
Until that happens, the lesson is simple:
Stop turning holes into cosmology before the landscape has been understood.
(The Durrington Mega-Monument Hoax: What Lies Beneath? – Debunked)
12. What Proper Science Would Test
The Durrington debate does not need more storytelling.
It needs a proper test.
If the pits are indeed a planned Late Neolithic monument, then that interpretation should withstand comparison with the physical landscape. If the hydrological model is wrong, then the evidence should show that too. But that requires testing the two models against each other, not simply assuming the monument model from the start.
The first requirement is simple: plot every credible pit centre accurately.
Not approximate dots.
Not symbolic positions.
Not selected examples.
Every credible feature needs a fixed coordinate, a confidence rating and a source trail. Questionable features, especially ii, should be excluded from the main model unless they are independently proved.
The second requirement is elevation.
Each pit needs a LiDAR-derived surface OD. Each dated or sampled horizon then needs its own calculated OD, based on depth below ground. The same applies to bases, basal chalk contacts, shell-bearing layers, bone horizons, OSL samples, calcareous silts and lower sediment breaks.
Without OD levels, there is no real hydrological test.
The third requirement is a landscape overlay.
The pit map must be tested against:
palaeochannels former Avon water levels former shoreline margins Head deposits dry valleys flow accumulation slope breaks terrace edges springline potential alluvium and colluvium sediment traps and solution features
Only then can the interpretation be tested properly.
(The Durrington Mega-Monument Hoax: What Lies Beneath? – Debunked)
The key comparison is not whether the pits can be drawn around Durrington Walls. We already know they can be made to look like arcs. The real question is whether their distribution is better predicted by distance from Durrington Walls or by distance from former water margins.
That is the test.
If the pits cluster more strongly by distance to Durrington Walls, then the monument model gains strength.
If the pits cluster more strongly by palaeochannel edges, shoreline zones, OD bands and former water levels, then the hydrological model gains strength.
At the moment, the hydrological explanation has not been properly falsified.
That is the failure.
The same applies to the dating evidence. All dating data should be published or archived for scrutiny: radiocarbon lab numbers, material type, sample depths, calibration curves, rejected dates, OSL age estimates, dose-rate data, light-exposed intervals, equivalent-dose values, failed samples and reasons for exclusion.
A scientific chronology does not hide awkward results.
It explains them.
This is especially important because inconvenient dates are not noise if the real question is hydrology. An old shell date, a reworked sediment signal, a light-exposed lower unit, or a mixed fill may be awkward for a simple monument story, but it may be exactly the evidence needed to reconstruct a former river landscape.
The proper test is therefore straightforward.
Plot the pits.
Calculate the OD levels.
Map the palaeochannels.
Overlay the former water levels.
Publish the full dating archive.
Remove unproven ii from the core model.
Then compare two explanations:
Do the pits form a planned monument around Durrington Walls?
Or do they fit a former Avon shoreline and palaeochannel system?
Until that test is done, the “mega-monument” is not a proven archaeological conclusion.
It is an interpretation awaiting landscape review.
(The Durrington Mega-Monument Hoax: What Lies Beneath? – Debunked)
13. Conclusion: What Really Lies Beneath?
The Durrington “mega-monument” has not been proved by the pits.
It is an interpretation placed over a broken pattern.
Large pits exist. That is not in dispute. Some are deep. Some are impressive. Some contain important archaeological and environmental evidence. But none of that automatically proves a single planned Late Neolithic ceremonial circuit.
The monument interpretation depends on treating a scattered, uneven and incomplete distribution of features as if it were a designed whole. It takes arcs and turns them into a circle. It takes gaps and explains them away. It takes complex fills and pulls them back into a single story. It treats water-affected sediment as background rather than evidence.
That is the failure.
Once the same features are plotted against LiDAR, palaeochannels, former water margins and dated water-derived deposits, the pattern looks very different.
It no longer looks like a sacred circle.
It looks like a river landscape.
(The Durrington Mega-Monument Hoax: What Lies Beneath? – Debunked)
The credible pits sit where a changing water-margin landscape would predict them. The gaps occur where a hydrological model would expect gaps: dry ground outside the former water system, or active water zones where pits would not be dug, would not survive, or would be hidden beneath later deposits.
The dating evidence does not rescue the monument model. It exposes its weakness. Shell, bone, charcoal, OSL signals and sediment layers do not form a clean single construction sequence. They point to a longer, messier and more realistic landscape history — one involving water, reworking, sediment movement, later activity and repeated environmental change.
That is what the original interpretation failed to face.
The Stonehenge landscape was not an abstract ceremonial diagram waiting to be decoded from the sky. It was a post-glacial landscape of rivers, springs, palaeochannels, shorelines, gravels, silts, shells, buried soils and changing water levels.
Durrington was part of that landscape.
Stonehenge Bottom was part of that landscape.
Bulford was part of that landscape.
And until archaeological tests of that landscape are conducted, every new “ritual monument”, every sunrise alignment, and every sacred circle should be treated with extreme caution.
The real question is not whether prehistoric people had beliefs, rituals or ceremonies. Of course they did.
The question is whether modern archaeology is mistaking the physical remains of a hydrological landscape for ceremonial architecture.
At Durrington, that is exactly what appears to have happened.
The “mega-monument” may not be a monument at all.
It may be the archaeological shadow of a former Avon river system — a broken pattern of pits, hollows, sediment traps and modified features surviving along palaeochannels and retreating shorelines.
What really lies beneath Stonehenge is not just ritual.
It is water.
And once water is returned to the landscape, the Durrington mystery stops looking mysterious.
It starts looking obvious.
(The Durrington Mega-Monument Hoax: What Lies Beneath? – Debunked)
Old Article for Reference
How Durrington Walls, Larkhill and the “Mega-Monument” Forgot the Water (2020)
The fundamental problem with the modern interpretation of Stonehenge and its wider landscape is simple.
Archaeologists still do not understand the basic infrastructure of prehistoric society.
They look at pits, ditches, earthworks, dry valleys and monument alignments, but too often interpret them as ritual, ceremonial or symbolic before asking the more important question:
What did the landscape actually look like when these features were built?
Imagine a future historian trying to understand our society without knowing what roads were. They might find motorways, lanes, junctions, roundabouts, bridges and service roads confusing. Some roads are straight. Some curve. Some are wide. Some are narrow. Some stop suddenly. Some have been widened, reused, bypassed or abandoned. Without understanding transport, that historian would never understand the structure of our world.
The same mistake is being made with prehistoric Britain.
The infrastructure was not roads.
It was water.
Rivers, palaeochannels, marshes, flooded valleys, landing places, shoreline routes and dykes were the transport system of early Britain. If that is not understood, then the archaeology becomes distorted before interpretation even begins.
This is precisely the problem with Channel 5’s documentary, The Stonehenge Enigma: What Lies Beneath? The title was cheekily close to my own Stonehenge work, but the interpretation repeated the same old archaeological problem: it treated a changing post-glacial landscape as if it were a mostly dry modern chalkland.
Once that assumption is made, the rest of the story goes wrong.
The programme promoted the idea that new research had identified a huge arc or ring of massive pits beneath fields near Durrington Walls. These were said to form part of a two-kilometre-wide structure, with the great Neolithic settlement of Durrington Walls at its centre.
The popular version was dramatic.
Durrington Walls became a “party city”.
The pits became a monumental boundary.
The wider landscape became part of a sacred ceremonial system.
The implication was that archaeologists had found another giant prehistoric structure in the Stonehenge landscape.
The programme synopsis presented this as another remarkable addition to the Stonehenge mystery. The pits, it suggested, formed part of a huge ring around Durrington Walls, perhaps enclosing or defining a special landscape used during seasonal gatherings.
The academic paper behind the claim, A Massive, Late Neolithic Pit Structure associated with Durrington Walls, argued that the surviving pits might represent an elaboration of the monument complex at a massive and unexpected scale. It also suggested that the pits may have been laid out with respect to the recently discovered Larkhill causewayed enclosure, and that some evidence might even show maintenance of the structure into the Middle Bronze Age.
That sounds impressive.
But it only works if the environmental assumptions are correct.
They are not.
The Landscape Is the Missing Evidence
The interpretation assumes that these pits, hollows, and alignments primarily belong to a monumental or ceremonial system.
But if the landscape were water-active, the same evidence would look very different.
Dry valleys were not always dry.
Palaeochannels were not irrelevant background geology.
Ditches were not automatically symbolic.
Pits were not automatically ritual.
Linear earthworks were not automatically boundaries.
And river-facing monuments were not necessarily ceremonial theatres.
They may have been part of a practical water-based landscape of access, movement, drainage, supply, landing, extraction and trade.
That is the missing context in the Durrington interpretation.
The modern Stonehenge landscape is relatively dry. The prehistoric landscape was not. During the Mesolithic and Neolithic, rivers and groundwater systems were operating under very different post-glacial conditions. Water tables were higher. Valleys were wetter. Springs and seasonal channels were more active. Palaeochannels continued to hold environmental significance long after their formation.
If archaeologists ignore this, they will continue to turn working landscapes into sacred fantasies.
Larkhill: The Supposed Boundary That Follows Water
The Larkhill causewayed enclosure is crucial because it was used in the argument for the Durrington pit structure.
But when we examine the site with LiDAR, the landscape tells a different story.
The supposed northern section of the Durrington pit-circle does not behave like part of a neat circular boundary. It sits within and follows a palaeochannel or dry valley system. These features form a line connected with the ancient water landscape rather than a convincing monumental ring.
That matters.
If the pits are aligned within a palaeochannel, then they are not simply arbitrary points on a ceremonial circle. They may be following the physical logic of an earlier watercourse.
The Larkhill causewayed enclosure itself sits in relation to this water system. It is not isolated on empty chalkland. It is positioned where a water-linked route would have mattered.
This supports a very different interpretation.
Causewayed enclosures may not have been mysterious ceremonial camps. They may have functioned as trading and gathering sites positioned on water-connected routes. Their interrupted ditches make far more sense if we understand them as moated or water-fed enclosures rather than simply symbolic boundaries.
Boats could approach.
Goods could be exchanged.
People could gather.
The enclosure could be supplied, defended, accessed and identified from the water.
That is a practical explanation rooted in landscape use.
The Dyke Problem
The Durrington and Larkhill interpretation also ignores one of the most important but least understood prehistoric feature-types in Britain:
the dyke.
Linear earthworks are everywhere in the British landscape. There are more than 1,500 scheduled sections of dykes and linear earthworks across Britain and Ireland. My own LiDAR research has identified thousands more that remain unclassified or misunderstood. If correct, Britain may contain more than 2,000 miles of ancient dyke systems — a greater total length than the known Roman road network in Britain.
Yet archaeology still struggles to explain them.
Some are called defensive.
Some are called territorial.
Some are called boundaries.
Some are called lynchets.
Some are simply ignored.
But the word dyke itself is water-related. A dyke is a water-management feature. In many cases, that older meaning may be the clue archaeologists have missed.
At Larkhill, the linear earthwork associated with the palaeochannel makes far more sense as part of a water-management or water-supply system than as a symbolic boundary.
At Durrington Walls, the same problem appears again.
The Durrington “Lynchet” That Runs the Wrong Way
Within the Durrington Walls landscape, there is a linear earthwork that once connected the River Avon to the henge’s ditch or moat.
In the report, this feature was described as a modern lynchet.
That interpretation is weak.
Durrington Walls ‘DYKE’ – see LiDAR Video for more details – The Stonehenge Enigma: What Lies Beneath? – Debunked
A lynchet is normally an agricultural feature formed by ploughing across a slope. Lynchets generally run along the contour of a hillside.
This feature does the opposite.
It runs down the slope towards the River Avon, some 30 metres below.
That is not how a typical lynchet behaves.
It is exactly how a water-linked dyke, channel or supply feature would behave.
LiDAR shows this clearly. The feature is not simply a random agricultural scar. It connects the monument to the river system. If Durrington Walls had a water-fed ditch or moat, it would be logical.
Again, the problem is not a lack of evidence.
The problem is the interpretive framework.
If archaeologists expect ritual, they see ritual.
If they expect agriculture, they see lynchets.
If they begin with hydrology, the landscape suddenly makes more sense.
Removing the Northern Section
Once the northern “pit-circle” elements are understood as features associated with a palaeochannel and possible dyke system linked to Larkhill, the supposed two-kilometre circle begins to weaken.
The “monument” is no longer a clean ring.
It becomes a mixed landscape of natural hollows, palaeochannels, pits, reused features, dykes and water-related deposits.
That does not make the archaeology unimportant.
It makes it more interesting.
But it is no longer the simple story sold to the public: a giant sacred boundary surrounding Durrington Walls.
The remaining southern features then need to be assessed on their own terms. When examined against LiDAR, topography and reconstructed Mesolithic/Neolithic water levels, many of them appear to relate more logically to the raised shoreline and hydrological history of the River Avon than to a single monumental circuit.
Some of these features sit at levels that would have been strongly affected by earlier water regimes.
That brings us to the dating evidence.
The C14 Dates Do Not Support a Simple Monument
The radiocarbon dates associated with these features are not neat.
They range across a long period.
Larkhill Causewayed Camp and its paleochannel with pits – The Stonehenge Enigma: What Lies Beneath? – Debunked
Some of the most important dates come from shell and bone material recovered from the Durrington features. The shell samples are especially important because they produced Holocene dates rather than meaningless ancient fossil ages.
Feature 7A produced a shell date around 6080–5990 cal BC.
Feature 8A produced another shell date around 4710–4550 cal BC.
A further shell date from feature 8A produced a result around 3930–3690 cal BC.
Feature 5A produced later material, with dates reaching into the Bronze Age.
That is not a single construction event.
That is a long-lived, water-affected landscape sequence.
Southern Pits reflect the post-glacial flooding in the area – Stonehenge enigma
The original authors were cautious about the shell dates, suggesting they may be affected by geological calcium or reservoir effects and therefore should not be used as direct dates for the pits’ excavation.
That caution is reasonable.
But it also proves the point.
If shell carbonate is affected by geological calcium or reservoir effects, then hydrology is not a side issue.
It is the issue.
Reservoir effects are hydrological evidence.
Carbonate movement is hydrological evidence.
Shell-bearing sediments are hydrological evidence.
Water-affected pits are hydrological evidence.
The shell dates should not be dismissed. They should force a proper environmental reconstruction of the entire Stonehenge landscape.
The Core Logs Show More Than Three Shell Dates
The Durrington evidence is even stronger when the core logs are examined in detail. The important point is not simply that three shell samples were radiocarbon dated. The sediment descriptions themselves show that these features were water-affected environmental deposits.
In pit 7A, the mollusc sample came from 4.80–4.85m, immediately above fractured chalk bedrock. Above it lay loose, unconsolidated, chalky silts with clasts of flint and chalk. That is not the description of a clean, dry, sealed ritual feature. It is a sediment sequence.
Pit 8A is even more significant. Between 2.60m and 4.35m, the core log records grey calcareous silts, described as structureless and massive, with molluscs present throughout. That is not one stray shell fragment. That is a thick mollusc-bearing calcareous silt deposit nearly two metres deep. Below it, the same feature produced grey silts, bone fragments and a flint artefact.
This matters because mollusc-bearing calcareous silts are environmental evidence. They point towards water, groundwater chemistry, slow silting, carbonate movement, ponding, palaeochannel activity or wet hollow conditions. Even if the shells are treated cautiously for dating purposes, their presence still demands a hydrological explanation.
Pit 5A adds another complication. It was cored to 7m without clearly reaching chalk bedrock. Its lower fills included brown clay silt with charcoal and bone, followed by flint gravel with many bone fragments, charcoal and burnt flints, and then possible bedding with darker horizons. That is a complex sediment trap, not a simple ceremonial hole.
So the Durrington evidence is not just three shell dates.
It is a wider pattern of grey silts, calcareous deposits, molluscs, bone-rich layers, unconsolidated sediments, gravel, possible bedding and deep unresolved stratigraphy.
That is exactly why the “mega-monument” interpretation is premature.
Before these features become a sacred boundary around Durrington Walls, they must first be understood as physical features within a water-shaped landscape.
The core logs do not weaken the hydrology argument.
They strengthen it.
The most remarkable weakness in the Durrington “mega-monument” claim is the mismatch between the scale of the interpretation and the scale of the physical testing.
The proposed monument includes numerous features arranged around a two-kilometre circuit, yet the core logs relate to only three sampled features: 7A, 8A and 5A. Those cores are important, but they cannot carry the whole interpretation. They show that selected features contained deep sediment sequences, molluscs, calcareous silts, bone, flint and complex fills. They do not prove that every anomaly in the proposed circuit was the same type of feature, dug at the same time, used for the same purpose, or maintained as part of one planned monument.
Three cores can ground-truth three features. They cannot prove a mega-monument.
The Stonehenge Bottom Connection
This is where the Durrington evidence becomes far more important.
At Stonehenge Bottom, the borehole evidence records a repeated cluster of water-related deposits: shell fragments, gravels, sands, silts, organic staining, chalk disturbance and other sediments sitting within a comparable elevation band. These deposits have been criticised as irrelevant, with the usual dismissal being that the shells are probably just ancient fossils from the chalk.
But the Durrington evidence now makes that dismissal much weaker.
The Durrington core logs do not simply record three isolated shell samples. They record a broader sedimentary pattern that closely resembles the material identified in the Stonehenge Bottom boreholes.
In pit 7A, the mollusc sample was taken from 4.80–4.85m, immediately above fractured chalk bedrock. Above it lay loose, unconsolidated, chalky silts with clasts of flint and chalk. This is not the description of a clean, dry, sealed ceremonial feature. It is a sediment sequence sitting directly over broken chalk.
In pit 8A, the evidence is even stronger. Between 2.60m and 4.35m, the core log records grey calcareous silts described as structureless and massive, with molluscs present throughout. That is not one stray shell fragment. It is a thick mollusc-bearing calcareous silt deposit nearly two metres deep. Below this, the same feature produced grey silts, bone fragments and a flint artefact.
In pit 5A, the borehole reached 7m without clearly reaching chalk bedrock. The lower fills included brown clay silts with charcoal and bone, flint gravel with many bone fragments, charcoal fragments, burnt flints and possible bedding with darker horizons. That is a complex, deep sediment trap, not a simple ritual pit.
These details matter because they show that the Durrington features were not just “holes”. They contained water-related sediment signatures: calcareous silts, molluscs, loose unconsolidated fills, gravels, bone-rich layers and possible bedding. These are precisely the kinds of deposits that require hydrological explanation.
That links directly to Stonehenge Bottom.
At Stonehenge Bottom, the boreholes identify shell fragments and water-laid or water-affected materials within a repeated elevation band. At Durrington, the core logs identify mollusc-bearing calcareous silts, grey silts, gravels and deep sediment sequences within major landscape features. In both cases, we are looking at subsurface deposits that make most sense within a water-shaped landscape.
The difference is that some of the Durrington shell material was radiocarbon dated.
And the results were not millions of years old.
They produced Holocene dates, including Mesolithic and Neolithic results.
That does not prove that every Stonehenge Bottom shell is the exact same age as the Durrington shells.
But it does prove something extremely important.
Shell-bearing deposits in the wider Stonehenge landscape can be Holocene environmental evidence. They cannot simply be dismissed as meaningless chalk fossils without testing.
The proper scientific response is obvious:
date them.
If the Stonehenge Bottom shells return Holocene dates, then the traditional dry-land interpretation of Stonehenge Bottom has a serious problem.
The Durrington evidence, therefore, supports the broader hydrological model in two ways.
First, the C14 shell results show that Holocene shell-bearing deposits exist within the wider Stonehenge landscape.
Second, the core logs show that these shells occur within grey calcareous silts, chalky silts, gravels, bone-rich layers and deep sediment sequences — exactly the kind of deposits expected in wet hollows, palaeochannels, ponded pits, groundwater-fed depressions or slow-silting water-affected features.
This means Stonehenge Bottom should no longer be treated as an isolated anomaly.
It sits within a wider pattern.
Durrington has mollusc-bearing calcareous silts.
Stonehenge Bottom has shell-bearing borehole horizons.
Durrington has grey silts, gravels, bone and deep unresolved sediment sequences.
Stonehenge Bottom has sands, gravels, silts, organic material and water-affected deposits.
Durrington has Holocene C14 shell dates.
Stonehenge Bottom has comparable shell-bearing deposits that now urgently require direct dating.
Together, these two datasets point towards the same conclusion: the Stonehenge landscape was hydrologically active, chemically complex and environmentally dynamic during the Mesolithic and Neolithic.
The shells are not the weakness in the argument.
They are the clue.
The real weakness lies in any interpretation of Stonehenge, Durrington or Larkhill that treats this landscape as dry ceremonial chalkland before first explaining the water.
The Real Shape of the Landscape
The Channel 5 documentary and the Durrington pit-circle claim both suffer from the same problem.
They start with monuments.
They should have started with water.
Once we properly reconstruct the landscape, the supposed mysteries become less mysterious.
Larkhill sits on a water-linked route.
Durrington Walls connect to the River Avon.
The so-called lynchet behaves more like a dyke.
The northern “pit-circle” follows a palaeochannel rather than a clean ceremonial boundary.
The southern pits correspond with changing water levels and long-term landscape activity.
The shell dates show Holocene environmental signals.
The Stonehenge Bottom boreholes record similar water-related signatures.
Together, these do not point towards a simple two-kilometre sacred ring.
They point towards a changing post-glacial river landscape.
Causewayed Enclosures as Trading Sites
This also changes how we view causewayed enclosures.
The traditional explanation treats them as ceremonial gathering places.
But their structure makes far more sense in a water-based economy.
Causewayed enclosures are often found in prominent landscape positions, near river systems, valleys, routeways or water access points. Their segmented ditches could control access, manage water, organise movement and define trading areas.
If boats were central to prehistoric transport, then causewayed enclosures were not isolated religious sites.
They were meeting points.
Markets.
Landing zones.
Exchange hubs.
Controlled spaces where goods, animals, people and information moved through the landscape.
This also explains why later communities reused and reinterpreted these places. Important practical sites often become important symbolic sites. The mistake is assuming they were symbolic from the start.
The Problem With “Ceremonial”
Modern archaeology often uses “ceremonial” when it cannot explain the function.
This is not good enough.
A pit is not ceremonial because it contains bone.
A ditch is not ceremonial because it surrounds space.
A line is not ceremonial because it can be drawn on a map.
A river-facing monument is not ceremonial because archaeologists have not reconstructed the water system.
The word ceremonial has become a dustbin for unresolved evidence.
The Durrington pit-circle claim is a perfect example.
Large features became pits.
Pits became a circuit.
The circuit became a boundary.
The boundary became sacred.
The sacred boundary became cosmology.
But each step required assumptions.
Once the hydrology is restored, those assumptions become much weaker.
The Failure of the Original Paper
The original Durrington pit-circle paper did not use LiDAR as it should have.
That is a serious weakness.
LiDAR is one of the most powerful tools available for understanding prehistoric landscapes. It reveals routeways, dykes, palaeochannels, earthworks, slope relationships, shoreline levels and subtle features that cannot be understood from geophysics alone.
If you are proposing a two-kilometre monumental structure across a complex chalk landscape, LiDAR should not be optional.
Without it, natural hollows, palaeochannels, dykes and landscape features can be misread as components of a monument.
That appears to be exactly what happened.
What the Evidence Actually Shows
The evidence does not show a simple sacred boundary.
It shows a complex, reused, water-shaped landscape.
It shows palaeochannels.
It shows pits.
It shows shell-bearing deposits.
It shows long-term activity from the Mesolithic through the Neolithic and into the Bronze Age.
It shows features connected to the River Avon.
It shows a possible dyke at Durrington misidentified as a lynchet.
It shows Larkhill linked to a water route rather than neatly incorporated into a circular monument.
It shows that dry valleys were still archaeologically active.
It shows that hydrology has been badly underestimated.
In other words, the Durrington pit structure may not be a giant monument at all.
It may be an archaeological misunderstanding of a water-shaped landscape.
Conclusion: What Really Lies Beneath?
What lies beneath Stonehenge and Durrington is not simply another sacred monument.
It is water.
Water shaped the landscape.
Water shaped movement.
Water shaped settlement.
Water shaped access.
Water shaped trade.
Water shaped where monuments were built.
Water shaped how pits filled.
Water shaped what survived.
Water shaped the dates.
And water has been largely ignored.
The problem with modern interpretations of Stonehenge is not that archaeologists lack data. They have excavation, geophysics, radiocarbon dates, boreholes, environmental samples, LiDAR and landscape surveys.
The problem is that the evidence is repeatedly forced through the same old interpretive filter:
ritual,
ceremony,
religion,
sacred landscape,
cosmology.
This has led archaeology away from physical explanation and towards storytelling.
The Durrington “mega-monument” is not proof of a vast sacred boundary.
It is proof of how easily a complex hydrological landscape can be turned into a headline.
Archaeology should not begin by asking what ancient people believed.
It should begin by asking how the landscape worked.
At Stonehenge, Durrington and Larkhill, the answer is clear.
The landscape worked through water.
Until that is understood, every documentary, every headline and every “new discovery” will continue making the same mistake.
They will keep finding sacred landscapes where they should have been finding shorelines.
PODCAST
Author’s Biography
Robert John Langdon, a polymathic luminary, emerges as a writer, historian, and eminent specialist in LiDAR Landscape Archaeology.
His intellectual voyage has been interwoven with stints as an astute scrutineer in government and grand corporate bastions, a tapestry spanning British Telecommunications, Cable and Wireless, British Gas, and the esteemed University of London.
A decade hence, Robert’s transition into retirement unfurled a chapter of insatiable curiosity. This phase saw him immerse himself in Politics, Archaeology, Philosophy, and the enigmatic realm of Quantum Mechanics. His academic odyssey traversed the venerable corridors of knowledge hubs such as the Museum of London, University College London, Birkbeck College, The City Literature Institute, and Chichester University.
In the symphony of his life, Robert is a custodian of three progeny and a pair of cherished grandchildren. His sanctuary lies ensconced in the embrace of West Wales, where he inhabits an isolated cottage, its windows framing a vista of the boundless sea – a retreat from the scrutinising gaze of Her Majesty’s Revenue and Customs, an amiable clandestinity in the lap of nature.
Exploring Prehistoric Britain: A Journey Through Time
My blog delves into the fascinating mysteries of prehistoric Britain, challenging conventional narratives and offering fresh perspectives grounded in cutting-edge research, particularly LiDAR technology. I invite you to explore some key areas of my research. For example, the Wansdyke, often cited as a defensive structure, is re-examined in light of new evidence. I’ve presented my findings in my blog post Wansdyke: A British Frontier Wall – ‘Debunked’, and a Wansdyke LiDAR Flyover video further visualises my conclusions.
My work also often challenges established archaeological dogma. I argue that many sites, such as Hambledon Hill, commonly identified as Iron Age hillforts, are not what they seem. My posts Lidar Investigation Hambledon Hill – NOT an ‘Iron Age Fort’ and Unmasking the “Iron Age Hillfort” Myth explore these ideas in detail and offer an alternative view. Similarly, sites like Cissbury Ring and White Sheet Camp receive re-evaluations based on LiDAR analysis in my posts “Lidar Investigation Cissbury Ring through time”and “Lidar Investigation White Sheet Camp,“ revealing fascinating insights into their true purpose. I have also examined South Cadbury Castle, often linked to the mythical Camelot56.
My research also extends to ancient water management, including the role of canals and other linear earthworks. I have discussed the true origins of Car Dyke in multiple posts, including Car Dyke – ABC News Podcast and Lidar Investigation Car Dyke – North Section, which suggest a Mesolithic origin 2357. I also explore the misidentification of Roman aqueducts, as seen in my posts on the Great Chesters (Roman) Aqueduct. My research has also been greatly informed by my post-glacial flooding hypothesis, which has helped explain landscape transformations over time. I have discussed this hypothesis in several posts, including AI now supports my Post-Glacial Flooding Hypothesis and Exploring Britain’s Flooded Past: A Personal Journey
For those interested in British Prehistory, visit www.prehistoric-britain.co.uk, a comprehensive resource featuring an extensive collection of archaeology articles, modern LiDAR investigations, and groundbreaking research. The site also includes insights and excerpts from the acclaimed Robert John Langdon Trilogy, a series of books that explore Britain during the Prehistoric period. Titles in the trilogy include The Stonehenge Enigma, Dawn of the Lost Civilisation, and The Post-Glacial Flooding Hypothesis, which offer compelling evidence of ancient landscapes shaped by post-glacial flooding.
To further explore these topics, Robert John Langdon has developed a dedicated YouTube channel featuring over 100 video documentaries and investigations that complement the trilogy. Notable discoveries and studies showcased on the channel include 13 Things that Don’t Make Sense in History and the revelation of Silbury Avenue – The Lost Stone Avenue, a rediscovered prehistoric feature at Avebury, Wiltshire.
In addition to his main works, Langdon has released a series of shorter, accessible publications, ideal for readers delving into specific topics. These include:
For active discussions and updates on the trilogy’s findings and recent LiDAR investigations, join our vibrant community on Facebook. Engage with like-minded enthusiasts by leaving a message or contributing to debates in our Facebook Group.
Whether through the books, the website, or interactive videos, we aim to provide a deeper understanding of Britain’s fascinating prehistoric past. We encourage you to explore these resources and uncover the mysteries of ancient landscapes through the lens of modern archaeology.
For more information, including chapter extracts and related publications, visit the Robert John Langdon Author Page. Dive into works such as The Stonehenge Enigma or Dawn of the Lost Civilisation, and explore cutting-edge theories that challenge traditional historical narratives.
How a “Lost World” Beneath the North Sea Went from Marginal Theory to Accepted Fact
Introduction
In 1913, the British geologist Clement Reid published a remarkable book titled Submerged Forests. Within its pages, Reid proposed something extraordinary for the time: that Britain had once been connected to continental Europe by a vast prehistoric landscape now submerged beneath the North Sea. (Clement Reid, Doggerland, and the Archaeological Establishment)
Today, we call this drowned world Doggerland.
Modern archaeology now treats Doggerland as an established scientific reality. Universities reconstruct its rivers and forests in digital models. Television documentaries present it as one of the most important prehistoric landscapes ever discovered. Entire academic projects are devoted to mapping its vanished terrain.
Yet what is rarely discussed is that when Reid first proposed the idea, it sat largely outside accepted archaeological thinking. His conclusions were not embraced as visionary science. They were treated as speculative and peripheral because the evidence challenged the prevailing understanding of Britain’s prehistoric past.
The irony is remarkable.
(Clement Reid, Doggerland, and the Archaeological Establishment)
The same academic world that now speaks confidently about Doggerland only fully accepted its existence after industrial oil exploration in the 1960s and 1970s accidentally proved Reid correct through seabed mapping, seismic surveys, and offshore drilling.
Doggerland, therefore, represents far more than a lost landscape.
It represents a cautionary tale about academic certainty itself.
Without it, critics can say:
“Well, Reid was just speculating without evidence.”
But once you include the nineteenth-century finds, the situation changes dramatically.
Because then the historical sequence becomes:
Physical evidence was already being recovered from the North Sea.
Scientists already knew submerged land surfaces existed.
Reid synthesised this evidence into a coherent landscape model.
The implications were still not fully operationalised archaeologically.
Later marine geophysics confirmed the larger landscape physically.
That is a much stronger progression in history and science.
And critically, it reinforces your silence argument:
The evidence was not absent;
The implications simply were not fully pursued.
This section should probably go immediately before “The Britain Clement Reid Saw.”
The Evidence Existed Before Doggerland Had a Name
Long before the term “Doggerland” was ever coined, physical evidence was already emerging from the floor of the North Sea.
Throughout the nineteenth century, North Sea fishermen regularly recovered:
mammoth bones
antlers
peat deposits
submerged tree remains
and even worked flints
while trawling offshore waters.
These discoveries were not isolated curiosities. They demonstrated something fundamentally important:
Large areas beneath the North Sea had once been dry land.
(Clement Reid, Doggerland, and the Archaeological Establishment)
Peat could not form underwater. Trees could not grow on the seabed. Large terrestrial mammals could not inhabit a marine environment. The evidence, therefore, pointed directly toward a drowned prehistoric landscape connecting Britain to continental Europe.
This material heavily influenced early geologists and palaeoenvironmental researchers, including Clement Reid.
By the time Reid published Submerged Forests in 1913, the basic physical evidence for former land surfaces beneath the North Sea already existed. The real issue was not whether the land had once been exposed, but whether the scientific world was prepared to grasp the full implications of what that meant for prehistory, migration, and the ancient geography of Britain.
That distinction is crucial.
Doggerland was not suddenly invented by modern archaeology.
The evidence had been sitting in fishing nets for decades.
The Britain Clement Reid Saw
Reid was not a fantasist or fringe writer. He was a respected geologist with the Geological Survey who specialised in ancient landscapes, fossil plants, and environmental reconstruction.
While studying Britain’s coastlines, he repeatedly encountered strange evidence:
submerged forests exposed at low tide
drowned peat beds
ancient river sediments beneath the sea
tree stumps emerging from beaches
buried prehistoric land surfaces offshore
To Reid, the implications were obvious.
Britain had not always been an island.
Large parts of what is now the North Sea must once have been dry land occupied by forests, animals, and prehistoric people.
At the time, however, archaeology still operated within relatively rigid geographical assumptions. Britain was largely viewed as a peripheral island receiving cultural influence from continental Europe, rather than as part of a major prehistoric continental landscape in its own right.
Reid’s conclusions disrupted that simplicity.
(Clement Reid, Doggerland, and the Archaeological Establishment)
The Problem: Nobody Could See the North Sea Floor
The greatest obstacle Reid faced was technological.
In 1913, there was no practical way to visualise the submerged landscape beneath the North Sea on a continental scale.
There was:
no marine seismic imaging
no industrial offshore drilling
no sonar bathymetry
no digital seabed modelling
no large-scale geophysical mapping
Reid’s argument, therefore, relied primarily upon coastal geology, submerged forests, peat deposits, and deductive reasoning.
To many archaeologists, this made the hypothesis easy to marginalise.
This is important because modern archaeology often presents Doggerland as though it emerged naturally from gradual academic progress. In reality, the idea remained on the fringes largely because the physical landscape itself could not yet be properly mapped.
(Clement Reid, Doggerland, and the Archaeological Establishment)
Then Came the Oil Industry
Everything changed in the 1960s with the race to exploit North Sea oil and gas reserves.
Oil companies were not searching for archaeology.
They were searching for hydrocarbons.
To locate them, they began undertaking vast geological and seismic surveys across the North Sea basin. For the first time in human history, scientists could effectively peer beneath the seabed in detail.
And what did they find?
Exactly the kind of drowned landscape Reid had described half a century earlier.
The surveys revealed:
submerged river valleys
ancient coastlines
lake basins
estuarine systems
floodplains
peat deposits
glacial and post-glacial landscapes
Modern seismic data have conclusively demonstrated that a vast habitable lowland once connected Britain to continental Europe.
The “speculative” landscape had been there all along.
Why Doggerland Still Wasn’t Fully Understood in the 1980s and 1990s
Even after North Sea oil exploration began revealing enormous submerged landscapes beneath the seabed, Doggerland still did not immediately transform archaeology.
This raises an important question:
If the seismic evidence existed by the 1970s and 1980s, why did it take until the early twenty-first century for Doggerland to become a mainstream archaeological reality?
The answer lies in a combination of corporate secrecy, technological limitation, and disciplinary separation.
(Clement Reid, Doggerland, and the Archaeological Establishment)
1. The Data Was Effectively Locked Away
The seismic surveys were conducted by private oil and gas companies.
These corporations spent enormous sums collecting offshore geophysical data and treated it as commercially valuable intellectual property. Academic archaeologists generally had little or no access to the datasets.
More importantly, the oil industry had no interest in prehistoric landscapes.
Their objective was to find hydrocarbons buried kilometres beneath the seabed. The shallow upper layers, containing ancient river valleys, peat beds, and drowned terrain, were largely treated as geological overburden — background material that had to be filtered out to reach the economically important strata below.
As a result, some of the clearest evidence for Doggerland physically existed for decades before archaeology could meaningfully examine it.
2. The Computers Were Not Yet Powerful Enough
Modern reconstructions of Doggerland depend upon enormous quantities of three-dimensional seismic and bathymetric data stitched together across thousands of square kilometres.
In the 1980s and early 1990s, this was technologically extremely difficult.
Universities generally lacked:
the computing power,
data storage,
rendering capability,
and processing speed
required to integrate these vast offshore datasets into coherent prehistoric landscape models.
Only in the late 1990s and early 2000s did computing technology finally become capable of handling the scale of data required to reconstruct the drowned North Sea plain properly.
3. Geologists and Archaeologists Were Working in Isolation
Perhaps most importantly, the relevant disciplines were not communicating effectively.
Oil geologists viewed the shallow seabed primarily as a barrier obscuring deeper oil-bearing strata.
Archaeologists, meanwhile, understood that prehistoric populations had once occupied areas now submerged beneath the North Sea, but lacked the marine geophysical tools necessary to visualise the landscape itself.
The two fields largely operated independently of one another.
Only in the early 2000s did serious interdisciplinary collaboration begin, combining:
offshore seismic data,
marine geology,
palaeoenvironmental reconstruction,
and archaeology
into a unified model of the drowned prehistoric landscape.
By then, Clement Reid had been dead for almost a century.
(Clement Reid, Doggerland, and the Archaeological Establishment)
Doggerland Was Proven by Geology — Not Traditional Archaeology
This is the crucial point often overlooked.
Doggerland was not primarily discovered through excavation in the traditional archaeological sense.
Its existence was confirmed by:
marine geophysics
industrial seismic imaging
offshore geological surveys
sediment analysis
underwater mapping technologies
The archaeology followed afterwards.
This matters because it reveals an uncomfortable pattern that repeats throughout the history of archaeology:
A disruptive landscape theory is proposed.
It struggles against established narratives.
Independent sciences later produce overwhelming physical evidence.
Archaeology absorbs the new reality as an accepted fact.
Doggerland is therefore not merely a triumph of archaeology.
It is equally a triumph of geology, marine science, and technological surveying.
(Clement Reid, Doggerland, and the Archaeological Establishment)
Silence Is Not the Same as Acceptance
One of the most revealing aspects of Clement Reid’s work is not open hostility, but relative silence.
Modern archaeology often gives the impression that Reid’s submerged landscape ideas were gradually and quietly accepted by the scientific world. But in science, silence does not necessarily imply agreement or acceptance.
Quite often, it indicates something very different:
conceptual discomfort
technological limitation
disciplinary compartmentalisation
or an inability to integrate disruptive implications into existing frameworks.
If a scientific theory genuinely transforms a discipline, it normally generates:
debate
criticism
attempts at falsification
methodological expansion
and sustained investigation.
Had Albert Einstein published relativity only for physics to largely ignore it for decades, nobody would argue that relativity had therefore been “quietly accepted.” The opposite conclusion would be drawn — that the scientific world had not yet fully absorbed the implications of the theory.
The same pattern appears in the history of Doggerland.
Reid published Submerged Forests in 1913, the same year he retired from the Geological Survey after a distinguished scientific career. He died only three years later in 1916. During that short remaining period, his drowned landscape model did not trigger a major transformation in archaeology or prehistoric reconstruction.
There was:
no large-scale marine investigation programme
no major archaeological restructuring around submerged landscapes
no widespread mobilisation of prehistoric research into the North Sea basin
Instead, the idea remained scientifically peripheral for decades.
This is important because it suggests that the scientific world of the early twentieth century was not fully equipped — technologically or conceptually — to grasp the scale of what Reid was implying.
He had inferred the existence of a lost prehistoric landscape beneath the North Sea long before the technology existed to visualise it properly.
Only later did:
marine geophysics
seismic profiling
sonar mapping
offshore drilling
and North Sea oil exploration
Finally, transform Reid’s geological inference into a physically visible drowned world.
In this sense, the muted reception of Reid’s work may itself be evidence of how disruptive and difficult its implications truly were for the scientific establishment of the time to fully comprehend.
(Clement Reid, Doggerland, and the Archaeological Establishment)
The Archaeological Hypocrisy
Today, archaeologists speak with complete confidence about Doggerland.
It appears in textbooks, museums, documentaries, and university lectures as settled science.
Yet very few openly acknowledge that:
the original theory existed outside mainstream archaeological thinking
the idea was treated cautiously for decades
and it was only overwhelming physical evidence from external sciences that forced universal acceptance
This is not how science is supposed to operate.
Science advances by testing difficult ideas against evidence — not by protecting established narratives until technological advances make resistance impossible.
Doggerland demonstrates how institutional conservatism can delay acceptance even when the underlying reasoning is sound.
(Clement Reid, Doggerland, and the Archaeological Establishment)
The Same Pattern Appears Elsewhere
Doggerland is not an isolated example.
The same tendency toward premature certainty recurs throughout archaeology.
1. The Bluestone Debate
For decades, debate surrounded how the Stonehenge bluestones reached Salisbury Plain.
While their Welsh origin was widely accepted, archaeologists remained divided over whether the stones were deliberately transported by humans or partially carried by glacial processes.
Over time, quarry excavations in the Preseli Hills, associated hearths, and radiocarbon evidence increasingly strengthened the case for deliberate prehistoric quarrying and transport.
The important issue is not that archaeology asks questions — that is, healthy science.
The issue is how tentative interpretations are often presented publicly as settled certainty long before the evidence is complete.
2. The Sarsen Source Problem
For many years, Stonehenge narratives simplified the sarsens as broadly “local” materials derived from nearby Wiltshire landscapes.
More recent geochemical work has considerably complicated that picture.
While West Woods appears to have been a major source of many of the principal stones, the wider sarsen distribution across southern Britain indicates a far more extensive prehistoric stone landscape extending into Hampshire and Sussex.
The significance is not simply geological.
It demonstrates again how archaeology frequently compresses complex prehistoric systems into simplified narratives that later evidence must revise.
Doggerland followed exactly the same trajectory.
(Clement Reid, Doggerland, and the Archaeological Establishment)
3. The Prehistoric Dyke Problem
For generations, large linear earthworks such as:
Offa’s Dyke
Wansdyke
Car Dyke
and the Vallum
have been interpreted primarily as defensive or territorial boundaries.
Yet many of these structures display characteristics difficult to reconcile with simple military explanations:
inconsistent defensive logic
discontinuous alignments
relationships with wetlands and floodplains
hydraulic behaviour
and associations with water-retaining landscapes.
Increasingly, alternative interpretations suggest that at least some of these monumental earthworks may have functioned partly as:
canals,
water-management systems,
transport corridors,
or integrated hydrological infrastructure.
The important point is not that traditional archaeology asked questions.
The issue is that defensive interpretations often became entrenched long before large-scale hydrological modelling, lidar analysis, and landscape engineering perspectives were properly integrated into archaeological interpretation.
Once again, the pattern resembles Doggerland:
A landscape system existed physically in front of investigators for generations, yet the underlying functional logic remained poorly understood because the dominant interpretive framework constrained how the evidence was viewed.
4. Hydrology: The Missing Discipline
Perhaps the deepest parallel between Doggerland and wider prehistoric archaeology is hydrology itself.
Doggerland was ultimately misunderstood because archaeology failed to properly integrate changing sea levels, marine landscapes, river systems, and submerged environmental reconstruction into prehistoric interpretation.
But remarkably, a similar problem also appears across terrestrial archaeology.
For much of the twentieth century, archaeology often treated ancient landscapes as though modern drainage conditions broadly reflected prehistoric reality.
Yet post-glacial Britain was radically different:
groundwater levels were higher
floodplains were wetter
wetlands were more extensive
chalk aquifers behaved differently
rivers occupied larger channels
and seasonal inundation transformed movement and settlement patterns.
In many cases, archaeologists interpreted prehistoric structures without fully integrating the hydrological conditions under which they originally operated.
This may have profoundly affected interpretations of:
ditches
causeways
river transport
wetland occupation
monument placement
and large linear earthworks.
The irony is extraordinary.
In Doggerland studies, archaeology initially underestimated the role of marine hydrology and drowned landscapes.
In terrestrial archaeology, it may have simultaneously underestimated inland hydrology and water-dominated land environments.
The same disciplinary weakness appears in reverse.
In both cases, the result was similar: prehistoric landscapes were interpreted through modern environmental assumptions rather than reconstructed hydrological realities.
(Clement Reid, Doggerland, and the Archaeological Establishment)
Reid’s Other Problem: The Mystery of Rapid Plant Migration
Clement Reid’s importance to prehistoric science extends far beyond Doggerland.
In 1899, more than a decade before Submerged Forests, Reid published another remarkable work: The Origin of the British Flora. Within it, he identified a problem that still challenges ecology today — what later became known as Reid’s Paradox of Rapid Plant Migration.
The paradox is deceptively simple.
When scientists calculate how quickly plants naturally spread through seed dispersal alone, the results are extremely slow. Trees such as oak should have taken many thousands of years longer to recolonise Britain after the Ice Age than the archaeological and pollen evidence suggests.
Yet across Europe and Britain, plants repeatedly appear far earlier and spread far faster than traditional dispersal models predict.
Even modern ecology still struggles to explain this properly.
The standard explanation usually invokes vague concepts such as “long-distance dispersal,” but this often amounts to little more than admitting that the mathematics and the observed reality do not match.
But what if the problem is not botanical?
What if the problem is archaeological?
(Clement Reid, Doggerland, and the Archaeological Establishment)
The Hidden Assumption Inside Reid’s Paradox
Traditional dispersal models largely assume that prehistoric humans played only a minor role in environmental change.
Implicit within many calculations is an outdated image of Mesolithic people as:
sparse populations
isolated hunter-gatherers
technologically primitive
and largely disconnected from one another.
But the growing evidence from Doggerland and post-glacial Britain increasingly points toward something very different.
The Mesolithic world appears to have been highly mobile, river-based, and interconnected.
Once this possibility is introduced, Reid’s Paradox becomes far less mysterious.
(Clement Reid, Doggerland, and the Archaeological Establishment)
Rivers Were the Highways of the Mesolithic World
Under post-glacial conditions, Britain was not the dry landscape we know today.
Research into post-glacial hydrology increasingly suggests that:
rivers were larger
estuaries extended far inland
wetlands interconnected catchments
and water transport was likely easier and more efficient than overland movement.
If Mesolithic populations used rivers and coastlines as transport corridors, then humans themselves became major agents of ecological dispersal.
Seeds, spores, and plants could spread through:
food transport
reeds and basket materials
animal hides
timber movement
boat traffic
stored resources
and simple repeated human movement along waterways.
The consequences are profound.
A river-based exchange network could spread species hundreds of kilometres within only a few generations — vastly faster than traditional natural dispersal models allow.
What appears impossible under static ecological models becomes entirely plausible once prehistoric mobility is properly considered.
Doggerland Changes the Entire Context
This is where Doggerland becomes critically important.
A connected North Sea plain linking Britain to continental Europe would not merely have allowed human migration — it would have enabled continuous ecological exchange across vast interconnected river systems.
The prehistoric populations living within this landscape may have accelerated the spread of:
oak
hazel
edible plants
fungi
wetland species
and managed woodland environments
far beyond what purely natural dispersal models predict.
In this sense, Reid may have uncovered two related truths long before archaeology was prepared to accept either of them:
Britain was once connected to Europe by a vast lost landscape.
Mesolithic humans were likely far more mobile, interconnected, and environmentally influential than traditional archaeology once believed.
(Clement Reid, Doggerland, and the Archaeological Establishment)
The Real Lesson
The irony is remarkable.
Clement Reid identified both Doggerland and the plant migration paradox decades before the technologies or archaeological models existed to fully explain them.
In both cases, the underlying issue may have been the same:
Archaeology consistently underestimated the sophistication, mobility, and scale of prehistoric human systems.
Doggerland was not an empty wilderness at the edge of Europe.
It may have been part of a vast interconnected riverine world whose people reshaped landscapes, ecosystems, and biological dispersal patterns thousands of years before conventional history was prepared to recognise it.
(Clement Reid, Doggerland, and the Archaeological Establishment)
Conclusion
Doggerland now stands as one of the most important prehistoric discoveries in Europe.
But its history should also serve as a warning.
In 1913, Clement Reid proposed that a drowned prehistoric landscape once connected Britain to Europe. His conclusions were treated cautiously and remained outside mainstream archaeological thinking for decades.
Then, half a century later, oil companies searching for hydrocarbons accidentally proved him correct.
The tragedy is not that Reid was ahead of his time.
The tragedy is that archaeology required industrial geology and offshore oil exploration to finally accept what the evidence had already been suggesting for years.
Doggerland should therefore be remembered not only as a lost world beneath the North Sea —
But as a reminder that scientific progress depends upon questioning certainty, not protecting it.
(Clement Reid, Doggerland, and the Archaeological Establishment)
PODCAST
Author’s Biography
Robert John Langdon, a polymathic luminary, emerges as a writer, historian, and eminent specialist in LiDAR Landscape Archaeology.
His intellectual voyage has been interwoven with stints as an astute scrutineer in government and grand corporate bastions, a tapestry spanning British Telecommunications, Cable and Wireless, British Gas, and the esteemed University of London.
A decade hence, Robert’s transition into retirement unfurled a chapter of insatiable curiosity. This phase saw him immerse himself in Politics, Archaeology, Philosophy, and the enigmatic realm of Quantum Mechanics. His academic odyssey traversed the venerable corridors of knowledge hubs such as the Museum of London, University College London, Birkbeck College, The City Literature Institute, and Chichester University.
In the symphony of his life, Robert is a custodian of three progeny and a pair of cherished grandchildren. His sanctuary lies ensconced in the embrace of West Wales, where he inhabits an isolated cottage, its windows framing a vista of the boundless sea – a retreat from the scrutinising gaze of Her Majesty’s Revenue and Customs, an amiable clandestinity in the lap of nature.
Exploring Prehistoric Britain: A Journey Through Time
My blog delves into the fascinating mysteries of prehistoric Britain, challenging conventional narratives and offering fresh perspectives grounded in cutting-edge research, particularly LiDAR technology. I invite you to explore some key areas of my research. For example, the Wansdyke, often cited as a defensive structure, is re-examined in light of new evidence. I’ve presented my findings in my blog post Wansdyke: A British Frontier Wall – ‘Debunked’, and a Wansdyke LiDAR Flyover video further visualises my conclusions.
My work also often challenges established archaeological dogma. I argue that many sites, such as Hambledon Hill, commonly identified as Iron Age hillforts, are not what they seem. My posts Lidar Investigation Hambledon Hill – NOT an ‘Iron Age Fort’ and Unmasking the “Iron Age Hillfort” Myth explore these ideas in detail and offer an alternative view. Similarly, sites like Cissbury Ring and White Sheet Camp receive re-evaluations based on LiDAR analysis in my posts “Lidar Investigation Cissbury Ring through time”and “Lidar Investigation White Sheet Camp,“ revealing fascinating insights into their true purpose. I have also examined South Cadbury Castle, often linked to the mythical Camelot56.
My research also extends to ancient water management, including the role of canals and other linear earthworks. I have discussed the true origins of Car Dyke in multiple posts, including Car Dyke – ABC News Podcast and Lidar Investigation Car Dyke – North Section, which suggest a Mesolithic origin 2357. I also explore the misidentification of Roman aqueducts, as seen in my posts on the Great Chesters (Roman) Aqueduct. My research has also been greatly informed by my post-glacial flooding hypothesis, which has helped explain landscape transformations over time. I have discussed this hypothesis in several posts, including AI now supports my Post-Glacial Flooding Hypothesis and Exploring Britain’s Flooded Past: A Personal Journey
For those interested in British Prehistory, visit www.prehistoric-britain.co.uk, a comprehensive resource featuring an extensive collection of archaeology articles, modern LiDAR investigations, and groundbreaking research. The site also includes insights and excerpts from the acclaimed Robert John Langdon Trilogy, a series of books that explore Britain during the Prehistoric period. Titles in the trilogy include The Stonehenge Enigma, Dawn of the Lost Civilisation, and The Post-Glacial Flooding Hypothesis, which offer compelling evidence of ancient landscapes shaped by post-glacial flooding.
To further explore these topics, Robert John Langdon has developed a dedicated YouTube channel featuring over 100 video documentaries and investigations that complement the trilogy. Notable discoveries and studies showcased on the channel include 13 Things that Don’t Make Sense in History and the revelation of Silbury Avenue – The Lost Stone Avenue, a rediscovered prehistoric feature at Avebury, Wiltshire.
In addition to his main works, Langdon has released a series of shorter, accessible publications, ideal for readers delving into specific topics. These include:
For active discussions and updates on the trilogy’s findings and recent LiDAR investigations, join our vibrant community on Facebook. Engage with like-minded enthusiasts by leaving a message or contributing to debates in our Facebook Group.
Whether through the books, the website, or interactive videos, we aim to provide a deeper understanding of Britain’s fascinating prehistoric past. We encourage you to explore these resources and uncover the mysteries of ancient landscapes through the lens of modern archaeology.
For more information, including chapter extracts and related publications, visit the Robert John Langdon Author Page. Dive into works such as The Stonehenge Enigma or Dawn of the Lost Civilisation, and explore cutting-edge theories that challenge traditional historical narratives.
Over the past ten years, I’ve faced a constant uphill battle to establish what I consider a straightforward conclusion—that Linear Earthworks are not defensive structures or boundary markers but prehistoric canals. It’s a claim that’s been dismissed repeatedly, often without proper engagement, but that resistance never stopped the work.(Archaeology in the Post-Truth Era)
Instead, it pushed me further. I carried out a full survey of over 1,500 of Historic England’s Scheduled Linear Earthworks, systematically analysing their form, placement, and context. That work eventually led to the first book in what has now become a larger series, focusing specifically on the East Wansdyke area. For me, that publication wasn’t just another book—it was a milestone. It represents a level of detailed, landscape-wide analysis that, to date, no university or research team has attempted at this scale.
Archaeology in the Post-Truth Era
The book itself takes a forensic approach. Every aspect of East Wansdyke is examined and placed into a wider framework—what I define as an ancient prehistoric canal system. The aim is simple: to challenge the existing archaeological narrative, not with speculation, but with measurable, testable evidence. The traditional explanations—defensive lines, territorial markers—don’t hold up under scrutiny. They lack physical evidence, contradict their own logic, and fail to explain the most basic characteristics of these structures.
What emerges instead is something far more significant. If these earthworks are canals, then we are looking at a completely different level of engineering capability in prehistory. These were not crude societies marking out land or preparing for war—they were shaping landscapes, managing water, and building infrastructure on a national scale. This not only challenges the archaeological community but also opens the door to a broader re-evaluation of how prehistoric landscapes were understood and used.
Archaeology in the Post-Truth Era
Embarking on this journey was not without its challenges, especially in an era where scepticism often overshadows scientific evidence. The response to my publication, which I had hoped would ignite a meaningful academic debate, was instead largely silent. Despite the use of modern LiDAR technology and a dataset far beyond what had previously been attempted, the work was either ignored or dismissed as speculative.
This resistance was mirrored on social media, where entrenched views dominated discussion. Any attempt to challenge established narratives was met with denial rather than engagement. Peer review, rather than being treated as part of an evolving process, was often presented as a final and unquestionable authority.
Archaeology in the Post-Truth Era
This kind of blind adherence to established ideas is not unique to archaeology. It is a pattern repeated across disciplines, where existing frameworks are protected rather than tested. New evidence is not examined on its merits but rejected because it disrupts the accepted model.
That was the position in 2014.
Now, two years on, we can assess that position against new evidence—and, more importantly, against the predictions made at the time.
What has emerged since then is not a contradiction of the original work, but a direct reinforcement of it.
The borehole data, when analysed correctly using elevation rather than arbitrary depth, has revealed consistent clustering of water-related deposits at specific heights across multiple independent locations. Statistically, this pattern is highly unlikely to occur by chance and instead points to a structured, elevation-controlled hydrological system operating across the landscape.
Archaeology in the Post-Truth Era
At the same time, the mathematical framework behind the Post-Glacial Flooding Hypothesis has continued to develop. The mass-balance calculations, combined with ice-volume scaling and groundwater discharge modelling, demonstrate that Britain remained in a prolonged state of elevated water tables and enlarged river systems for thousands of years after the end of the last Ice Age.
This confirms a critical point:
The rivers of the past were higher than those we see today.
And once that is understood, the entire interpretation of Linear Earthworks shifts.
Archaeology in the Post-Truth Era
Because these structures are not randomly placed. They align with contours, connect basins, and sit within hydrological positions that make sense only under sustained high water levels. Their form, scale, and distribution are consistent with water management—not defence, not boundaries, but controlled flow.
In other words, the environmental conditions required for canals are now demonstrably present.
This is the key difference between 2014 and 2026.
In 2014, the argument was based on landscape logic, structural analysis, and comparative reasoning.
In 2026, that same argument is now supported by independent physical data and mathematical proof of the environmental conditions required for it to function.
The conclusion, however, has not changed.
Linear Earthworks were constructed in a landscape defined by elevated water tables and expanded river systems. Within that context, their most coherent and evidence-based interpretation remains exactly what was originally proposed.
They were canals.
Archaeology in the Post-Truth Era
And perhaps most importantly, this progression follows the correct scientific sequence.
The prediction came first.
The evidence followed.
And that is not speculation—that is validation.
Fundamentalist
Wansdyke
In my book, I meticulously addressed every single meter of East Wansdyke, providing compelling evidence that challenges the traditional interpretation of Wansdyke as either a defensive structure or a boundary marker. My research and analysis have convincingly demonstrated that East Wansdyke was, in fact, part of a prehistoric canal system, a finding that significantly alters our understanding of the landscape and the capabilities of the people who engineered it. This conclusion was reached through a combination of detailed survey work, the application of modern technologies such as LiDAR, and a critical review of the archaeological and historical records.
However, one critic, emblematic of the resistance I’ve encountered, sought to undermine my hypothesis by citing a site associated with West Wansdyke. This individual argued that because West Wansdyke was built on a ‘late Iron Age’ fortification, it must, therefore, be of Saxon origin, aiming to cast doubt on my entire thesis by focusing on this one aspect. It’s a classic example of attempting to discredit a comprehensive theory by finding fault with a single, arguably tangential, element.
Archaeology in the Post-Truth Era
In my response, I emphasised that this site, situated in West Wansdyke, falls outside the primary focus of my research on the East Wansdyke segment. More importantly, I had already anticipated such objections and addressed them directly in my book. I concluded that West Wansdyke, while geographically related, was connected to the original canal system at a later date, likely by the Romans. This connection was based on evidence suggesting that West Wansdyke is incomplete, sporadic, and differs in specification from East Wansdyke, indicating a distinct phase of construction and purpose.
The dismissal of West Wansdyke from my primary analysis was not arbitrary but a considered decision grounded in the evidence and the scope of my research. It reflects a methodological approach that prioritises coherence, specificity, and relevance in building a historical narrative. The critique of my work that focuses on West Wansdyke, therefore, misses the mark. It overlooks the rigour of my research process and the clear rationale provided for the conclusions drawn about East Wansdyke and its role within a broader prehistoric canal system.
Archaeology in the Post-Truth Era
This encounter serves as a reminder of the challenges inherent in advancing new theories in archaeology, especially those that significantly depart from established interpretations. It also underscores the importance of clarity, precision, and thoroughness in both research and communication, qualities I strived to embody in my work on East Wansdyke.
West Wansdyke
We have a problem with West Wansdyke – it’s not part of East Wansdyke. This has always been a historical debate over the last 100 years. If we look at the limited archaeological evidence, we find that although it may have been a much later Canal/Dyke it is not contemporary with the East Wansdyke canal and was not built at the same time.
Excavations conclusively show that the Ditches on the East side of Wansdyke are much more profound and twice as broad. In contrast, the Banks on the East Side are much wider. We see that East Dyke was built first, as our River height model shows that most of West Wansdyke would have been flooded or marshland at the time of use.
Location
Wansdyke
Bank
Ditch
Excavatornotes
Materials
Width
Height
Berm
Width
Depth
Counterscarp
EAST
Red Shore
Clay/Flints
9.5
2
N
10
3.9
Y
Green 1966
Sheppard’s shore
10
2.3
N
10
3.9
Y
Pitt Rivers 1888
Brown’s Barn
9
2.3
N
10
3.9
Y
Pitt Rivers 1891
WEST
Binces Lane West
Stoney
12.5
??
??
3.5
1.7
Y
Erskine 1990s
Binces Lane East
Stoney
?
5?
N
6
2.4
?
Erskine 1990s
Compton Green
Clay marl
13
0.8
Y
5.8
2.8
Y
Erskine 1990s
Blackrock Lane
Silty Clay
12.5
1.7
Y
4.8
2.7
?
Erskine 1990s
Park farm
Stones
10
0.4
Y
5.5
2.4
Y
Erskine 1990s
Fairy Hill
13
?
Y
6.5
?
Erskine 1990s
West Wansdyke Excavation
When the waters receded (possibly Early Iron Age period), it is possible that the Dyke was extended, or the more probable event of East Wansdyke after it dried up was turned into a roadway and what we see in West Wansdyke is the extension of the road, and hence it is wider than in the East.
Archaeology in the Post-Truth Era
We also see more shallow ditches as they were not used for water but to obtain soil for the walkway and become drainage ditches.
Indeed, we know the Romans used this as a road and always had drainage ditches, usually on both sides. This is supported by carbon dating at Erskine’s excavation at Blackrock Lane, where the section appeared to have been sealed by the primary bank material. One of these layers contained significant concentrations of woody oak charcoal.
Samples of this material were submitted to the Ancient Monuments Laboratory for radiocarbon dating to provide a possible construction of the bank. Unfortunately, as shown in the table below – sadly, as standard when scientific evidence disproves the current archaeological narrative – it is ignored and classified as an error.
Archaeology in the Post-Truth Era
Table 1. Erskine, Jonathan. (2007). The West Wansdyke: an appraisal of the dating, dimensions and construction techniques in the light of excavated evidence. Archaeological Journal. 164. 80-108.
The other missing aspect, shown in East Wansdyke but not in West Wansdyke, was the massive connection to Barrows and Flint Pits. Again, this connection is not seen on West Wansdyke, which may help date this monument, as the barrows were of the Bronze Age or earlier, and, as we have seen from the carbon dating evidence at Blackrock Lane, much earlier than its 1500 BCE date.
Statonbury Camp near Bath – an example of West Wansdyke
If we look at the Scheduled parts of the Wansdyke – we see that the East is very much intact, but the West is sporadic at best, and it’s hard to find a logical link to all the Dykes that seem to only appear over hills and not in the valley’s – which in my view would have been flooded in the Mesolithic and hence the west sections addition after East Wansdyke’s construction – probably by the roman’s who may have utilised the Dyke system for their own transportation reasons. But for the sake of scientific curiosity, let’s take a detailed look at Stantonbury Hill site, which is classified as an Iron Age Camp, with Wansdyke making up one of the defensive banks – but before we delve deeper into the field archaeology of the site – I feel I must clarify the use of the classification of ‘Iron Age Fort’ by archaeologists.
All sites that sit on top of hills and have ditches are called Iron Age Forts – sadly, I have yet to find a single location that is either ‘Iron Age’ or a ‘Fortification’, as not a single dead body from slaying has ever been found, and all the so-called defensive ditches EVER!! Yet the archaeological world continues to use this misleading classification, which confuses the public, as if it has been qualified and proven. So, back to Statonbury camp. The only investigation of this site was made by Fox and Fox in 1956 as part of their survey of Wansdyke in the publication ‘Wansdyke reconsidered.’ It should be noted that Historic England does not have an account with their scheduling as no excavation work has ever been undertaken, and so only field walking has been undertaken, and so the results are subject to the field walker.
Archaeology in the Post-Truth Era
In Fox’s publication, they also question the linkage of East and West Wansdyke through other, even older publications and field surveys, which call into question the logic of dating this linear earthwork. That great antiquary, Sir Richard Colt Hoare, had his doubts about the identification, which he endeavoured to suppress in his account of the earthwork in Ancient Wiltshire,
‘ Hitherto we have been enabled to trace the course of Wansdyke with certainty and success through Somersetshire, but on approaching the neighbouring county of Wiltshire we enter upon a new and doubtful field of inquiry respecting the direction as well as the formation of this celebrated rampart.’
His own observations in the field had shown him that in this central sector ‘ it bears the decided appearance of a Roman causeway, not of a Belgic or Saxon boundary and yet he felt obliged to support the current view that road and dyke were identical because he was convinced that the Wansdyke was continuous and he could find no alternative course for it in the area.Sir R. C. Hoare also observes that the camps appear to have been added to the Dyke, not the Dyke formed to connect the camps, which may be noticed especially at Stantonbury Camp, the second on the line of the course of Wansdyke through Somersetshire.
They continue……
General Pitt-Rivers, also had misgivings,‘ the Dyke he comments, in the Heddington region,’ is of very low relief everywhere on this line and it has often been questioned whether it is a dyke or a road’, and his suspicions were again aroused at a point west of Morgan’s Hill and on Bowden Hill near Lacock’.
Stanton Camp – Not Defensive
On Statonbury Camp, there are not very helpful and report that:
Stantonbury is a univallate Iron Age hill-fort enclosing some 30 acres on the crest of the hill : until very recently it was waste ground going back to thorn scrub and islanded in dense woodland, as can be seen on the air-photo (Pl. VIIIB). The hill top (580 ft.) commands a wide view : from here the whole of the countryside traversed by West Wansdyke can be seen, Maes Knoll to the west. Odd Down to the east, as well as an uninterrupted stretch northwards to the Avon valley and the Cotswolds beyond. From here, the major alignment was probably planned (fig. 19 and p. 37).
In 1956-7 the hill top has been ploughed again, and the much reduced Iron Age defences are visible on the edge of the cultivation. It appears to us that Wansdyke was not constructed along the north-facing hill slope, and that as at Old Oswestry hill-fort, on Wat’s Dyke in Montgomery, the Iron Age defences were deemed sufficient. There is, however, as General Pitt-River’s level section shows, a steep scarp below the traces of the ploughed-in Iron Age ditch, which may be artificial and post-date the hill-fort, but this is uncertain.East of the fort, in field 20, which is now occupied by a plantation and a pheasantry, the Dyke continues as a scarp for as far as we were able to trace it through the nettles and undergrowth. Below the 500 ft. contour, the large bank and ditch reappear in the dense woodland, and emerge beside the lane leading to the road to Stanton Prior, where the earthwork measures 75 ft. overall.
So, according to Fox and Fox, Wansdyke stops short and accepts the North Face is the Iron Age Site – therefore, if the Wansdyke had been cut to the north of the site, the Iron Age fort replaced it, which is not as the Jihad had claimed?
So where did he get this ‘ground-breaking’ revelation? For this, we must go not to a peer-reviewed book but a website ‘wansdyke21.org.uk’ by Robert Vermaat
He suggests that: It has been suggested by Fox & Fox that Wansdyke did not actually use Stantonbury Camp, the ditch stopping short of the Iron Age defences by several metres.However, Burrow showed in 1982 that this was incorrect.Although the western slope is much disturbed by quarrying and the lower slopes by cultivation, Wansdyke can still be traced quite well at several points on the hill.As with Maes Knoll, the northern defences are more prominent than those on the south side.As Wansdyke joins the defences here, it can be argued that, as was the case at Maes Knoll, the northern defences were refurbished when Wansdyke was constructed, neglecting the south side which was without use for the builders of Wansdyke.
Archaeology in the Post-Truth Era
If only we had £64 to see this so-called evidence from Field walking by burrows (as we know it was not excavated and LiDAR was not in use)!!
Fortunately, we have now obtained high-resolution LiDAR images of Statonbury Camp, and we can see that Wansdyke goes over the hill in a strange ‘wibbly wobbly’ way rather than a straight line – which we see on either side of the hill from much shallower ditches. This suggests that the area was not built entirely at the same time, and that the Hill Dyke is older than the flat ground levels surrounding the hill.
My estimate from the evidence in the smaller ditches is that they are Roman (and hence straight) in origin, which connects to the earlier prehistoric Dyke over Statonbury Hill, which the archaeologists call West Wansdyke (part of). The path over the hill indicates that the builders were attempting to locate natural springs as they built the Dyke to supply it with water, and hence the strange pathway.
Closer inspection of the Dyke as it approaches the ‘Iron Age Site’ suggests that it splits and shifts the bank from north-facing to south-facing, which Fox had seen as a terminus of the Dyke, for it reached the Fort. LiDAR clearly shows that the ditch moves to the south side of the bank and continues to create the East side of the fort, finally terminating in the South.
Also, the shape of the fort is not consistent, as it has rounded edges in the SE and SW regions but flat T-Junctions in the NE and NW, where it meets Wansdyke – indicating it was added to the existing Wansdyke canal either at the time of construction or a later date.
PodCast
Author’s Biography
Robert John Langdon, a polymathic luminary, emerges as a writer, historian, and eminent specialist in LiDAR Landscape Archaeology.
His intellectual voyage has been interwoven with stints as an astute scrutineer in government and grand corporate bastions, a tapestry spanning British Telecommunications, Cable and Wireless, British Gas, and the esteemed University of London.
A decade hence, Robert’s transition into retirement unfurled a chapter of insatiable curiosity. This phase saw him immerse himself in Politics, Archaeology, Philosophy, and the enigmatic realm of Quantum Mechanics. His academic odyssey traversed the venerable corridors of knowledge hubs such as the Museum of London, University College London, Birkbeck College, The City Literature Institute, and Chichester University.
In the symphony of his life, Robert is a custodian of three progeny and a pair of cherished grandchildren. His sanctuary lies ensconced in the embrace of West Wales, where he inhabits an isolated cottage, its windows framing a vista of the boundless sea – a retreat from the scrutinising gaze of Her Majesty’s Revenue and Customs, an amiable clandestinity in the lap of nature.
Exploring Prehistoric Britain: A Journey Through Time
My blog delves into the fascinating mysteries of prehistoric Britain, challenging conventional narratives and offering fresh perspectives grounded in cutting-edge research, particularly LiDAR technology. I invite you to explore some key areas of my research. For example, the Wansdyke, often cited as a defensive structure, is re-examined in light of new evidence. I’ve presented my findings in my blog post Wansdyke: A British Frontier Wall – ‘Debunked’, and a Wansdyke LiDAR Flyover video further visualises my conclusions.
My work also often challenges established archaeological dogma. I argue that many sites, such as Hambledon Hill, commonly identified as Iron Age hillforts, are not what they seem. My posts Lidar Investigation Hambledon Hill – NOT an ‘Iron Age Fort’ and Unmasking the “Iron Age Hillfort” Myth explore these ideas in detail and offer an alternative view. Similarly, sites like Cissbury Ring and White Sheet Camp receive re-evaluations based on LiDAR analysis in my posts “Lidar Investigation Cissbury Ring through time”and “Lidar Investigation White Sheet Camp,“ revealing fascinating insights into their true purpose. I have also examined South Cadbury Castle, often linked to the mythical Camelot56.
My research also extends to ancient water management, including the role of canals and other linear earthworks. I have discussed the true origins of Car Dyke in multiple posts, including Car Dyke – ABC News Podcast and Lidar Investigation Car Dyke – North Section, which suggest a Mesolithic origin 2357. I also explore the misidentification of Roman aqueducts, as seen in my posts on the Great Chesters (Roman) Aqueduct. My research has also been greatly informed by my post-glacial flooding hypothesis, which has helped explain landscape transformations over time. I have discussed this hypothesis in several posts, including AI now supports my Post-Glacial Flooding Hypothesis and Exploring Britain’s Flooded Past: A Personal Journey
For those interested in British Prehistory, visit www.prehistoric-britain.co.uk, a comprehensive resource featuring an extensive collection of archaeology articles, modern LiDAR investigations, and groundbreaking research. The site also includes insights and excerpts from the acclaimed Robert John Langdon Trilogy, a series of books that explore Britain during the Prehistoric period. Titles in the trilogy include The Stonehenge Enigma, Dawn of the Lost Civilisation, and The Post-Glacial Flooding Hypothesis, which offer compelling evidence of ancient landscapes shaped by post-glacial flooding.
To further explore these topics, Robert John Langdon has developed a dedicated YouTube channel featuring over 100 video documentaries and investigations that complement the trilogy. Notable discoveries and studies showcased on the channel include 13 Things that Don’t Make Sense in History and the revelation of Silbury Avenue – The Lost Stone Avenue, a rediscovered prehistoric feature at Avebury, Wiltshire.
In addition to his main works, Langdon has released a series of shorter, accessible publications, ideal for readers delving into specific topics. These include:
For active discussions and updates on the trilogy’s findings and recent LiDAR investigations, join our vibrant community on Facebook. Engage with like-minded enthusiasts by leaving a message or contributing to debates in our Facebook Group.
Whether through the books, the website, or interactive videos, we aim to provide a deeper understanding of Britain’s fascinating prehistoric past. We encourage you to explore these resources and uncover the mysteries of ancient landscapes through the lens of modern archaeology.
For more information, including chapter extracts and related publications, visit the Robert John Langdon Author Page. Dive into works such as The Stonehenge Enigma or Dawn of the Lost Civilisation, and explore cutting-edge theories that challenge traditional historical narratives.
For more than a century, Stonehenge has been interpreted as if it were constructed in a dry, stable chalk landscape, with water treated as peripheral or incidental. That assumption has never been tested against the subsurface record at the landscape scale. This blog presents the results of the first complete synthesis of borehole data from around Stonehenge Bottom, linking 21 historic boreholes into a single, quantitative framework. The outcome is neither interpretative nor theoretical. It is numerical. The subsurface record demonstrates repeated, extensive, and spatially constrained water activity throughout the Holocene, fundamentally incompatible with a dry-land model for early Stonehenge. What follows is not a reinterpretation of Stonehenge — it is a correction driven by data that has been available for decades but never assembled, counted, or tested as a system. (What Archaeology Missed Beneath Stonehenge)
Video showing the volume of River material as a percentage of the Borehole
1. Why This Blog Exists
From surface narratives to subsurface evidence
Stonehenge interpretation has long been dominated by surface observations: earthworks, stone settings, artefact distributions, and visual landscape relationships. These are valuable, but they are incomplete. Landscapes do not function at the surface alone, and water — in particular — leaves its most durable evidence below ground.
The central problem addressed here is simple: claims about a dry Stonehenge landscape have been made without reference to the subsurface record that would be required to support them. Boreholes have existed around Stonehenge for decades, logged by multiple contractors for engineering and infrastructure projects, yet they have almost never been synthesised or quantified in archaeological interpretation.
This blog exists because that synthesis has now been done.
By analysing boreholes not as isolated descriptions but as a connected dataset — counted, measured, and compared across topography — it becomes possible to test whether Stonehenge Bottom behaved as a dry chalk valley or as a water-dominated basin during the Holocene. Once that question is asked using arithmetic rather than narrative, the answer is no longer ambiguous.
(What Archaeology Missed Beneath Stonehenge)
2. The Data Nobody Had Ever Assembled
Linking 21 boreholes into one landscape system
Boreholes around Stonehenge Bottom are not new. Many were drilled decades ago for engineering, infrastructure, and site investigations. What is new is that they have now been brought together and analysed as a single landscape-scale dataset, rather than as isolated, descriptive records.
Historically, each borehole has been treated as local and incidental — a column of chalk, a few notes on gravel or marl, then filed away. No attempt was made to ask whether these records, taken together, described a coherent subsurface environment. As a result, interpretations of the Stonehenge landscape were based almost entirely on surface evidence, while the subsurface record remained fragmented and effectively invisible.
That fragmentation is the core problem this section resolves.
Twenty-one boreholes distributed around Stonehenge Bottom and the adjacent valley system have now been collated, normalised, and analysed together. They span the valley floor, margins, and surrounding uplands. They were logged by different contractors, at different times, for different purposes — which makes their convergence more significant, not less.
Crucially, the analysis does not rely on reinterpretation of the logs. No lithologies were renamed. No depths adjusted. No categories merged to strengthen an argument. Each borehole was taken exactly as recorded, then subjected to the same fixed rules for identifying water-related evidence.
When treated individually, these boreholes can be argued over. When treated collectively, they cannot.
Once counted, measured, and compared across topography, a clear and repeatable pattern emerges: water-related features are vertically stacked, repeatedly logged, and concentrated within the valley, while the surrounding high ground shows a fundamentally different subsurface character. That pattern only becomes visible when the data are assembled as a system.
This section establishes the foundation for everything that follows. The argument does not depend on a single “key” borehole, nor on selective examples. It rests on the behaviour of the dataset as a whole, which is precisely why it has such force.
Before any counting was undertaken, the rules had to be fixed. This matters because most disagreement in geo-archaeology does not arise from missing data, but from changing definitions once results are known.
In this analysis, a water-related occurrence is defined strictly as any logged interval that requires water to exist, or to have existed, in order to form or to be preserved. Nothing is inferred. Nothing is upgraded. Only what is explicitly recorded in the borehole logs is used.
The following categories are considered water-related evidence, with reasons provided.
Water-related sediment and alteration indicators
→ Rounded pebbles, gravel, and cobbles Rounded or sub-rounded clasts require transport. In chalk landscapes, this transport is hydraulic. Angular flint fragments may occur residually; rounded gravels and cobbles do not. Where gravels are logged as lenses, bands, or stacked horizons, they indicate repeated water movement, not isolated disturbance.
→ Flint gravel bands, flint lags, and sheeted flint horizons Flint concentrated into bands or sheets reflects winnowing, reworking, or lag formation by flowing or standing water. These features cannot be produced by in situ chalk decay alone and require hydraulic sorting.
→ Sand, silt, and marl seams Fine-grained sediments such as sand, silt, and marl are, by definition, water-laid. Their presence within chalk sequences indicates periods of low-energy flow, ponding, or suspension settling. Repeated marl seams imply repeated water presence over time, not a single episode.
→ Shell material (intact shells, fragments, and shell-rich horizons) Shells indicate habitable aquatic environments. They require sustained water conditions, not transient wetting. Their repeated occurrence at multiple depths is incompatible with surface wash or periglacial disturbance.
→ Shell impressions and moulds (dissolved shells) In chalk aquifers, shells dissolve readily under percolating freshwater, often leaving impressions rather than intact material. These impressions are direct evidence of former shell presence and, by extension, former water, even where the shell itself has been removed.
→ Organic staining and peat-like horizons Organic staining, darkened horizons, or peat-like material indicate stagnant or slow-moving water, waterlogging, or anoxic conditions. These features reflect prolonged saturation rather than brief exposure.
→ Chalk paste, softened chalk, and puttified chalk Where chalk is logged as paste, soft, weakened, or puttified, this reflects chemical dissolution and mechanical breakdown under sustained saturation. These textures are aqueous in origin and fundamentally different from blocky fracture produced by freeze–thaw.
→ Solution features, voids, and collapse structures Voids, cavities, and collapse features attributed to solution require long-term water circulation. They indicate groundwater flow paths, dissolution, and structural weakening — processes that cannot occur in dry chalk.
→ Repeated vertical alternation of the above Perhaps most critically, these features occur repeatedly and at different depths, separated by intact chalk. That vertical stacking is itself evidence of multiple water incursions over time.
(What Archaeology Missed Beneath Stonehenge)
What is explicitly excluded
To avoid exaggeration, the following are not counted:
→ drilling-induced fragments or artefacts → administrative gaps in logging → colour change or staining on its own → lithological labels without physical description → assumed processes not written in the log
Where an interval is ambiguous, it is excluded.
Additional safeguards
Two further safeguards are applied consistently:
→ Point observations (e.g. “shells noted”) are included in event counts (N) but not inflated in thickness totals (W). → Overlapping descriptions at the same depth are treated as a single water occurrence, not multiple events.
These rules are conservative by design. They bias the analysis toward undercounting, not exaggeration.
This matters because every total, percentage, and frequency that follows rests on these fixed definitions. They are stated here in advance and applied uniformly across all 21 boreholes.
What the data show under these constraints, therefore, is not interpretation.
It is arithmetic.
(What Archaeology Missed Beneath Stonehenge)
4. The Numbers That Break the Model
Counting replaces interpretation
Once the rules in Section 3 are fixed, the analysis becomes mechanical. There is no scope for reinterpretation, emphasis, or selective description. Each borehole is processed line by line, each qualifying interval counted once, and each thickness measured only where the log permits it.
When this is done across all 21 boreholes surrounding Stonehenge Bottom, the result is unambiguous.
Across the dataset, a total of 994 stratigraphically separate water-related bands are recorded. These bands represent discrete, depth-specific intervals in which water action is explicitly logged. They are not repeated descriptions of the same layer, not interpretive subdivisions, and not inferred events. Each band occupies its own position in the stratigraphic column.
The cumulative thickness of these water-affected intervals is 220.57 metres.
These two figures matter for different reasons:
→ The band count (994) captures frequency: how often water interacted with the subsurface at different times and depths. → The cumulative thickness (220.57 m) captures dominance: how much of the valley fill has been shaped by water processes rather than intact chalk.
Together, they describe both repetition and scale.
(What Archaeology Missed Beneath Stonehenge)
Distribution by material class
The 994 bands are not confined to a single sediment type. They are distributed across multiple, independent indicators of water action:
→ Shell material and shell-impression horizons → Pebble, gravel, and cobble bands → Sand, silt, and marl seams → Flint lags and reworked flint sands → Organic staining and peat-like deposits → Chalk paste, softened chalk, and solution zones → Voids and collapse features
This diversity matters. A single class could be argued away. A consistent pattern across many classes cannot.
Why this exceeds statistical uncertainty
In subsurface analysis, isolated occurrences can be dismissed as noise. Sparse events can be argued as anomalous. That logic fails completely at this scale.
Nearly one thousand independently logged water-related intervals, stacked vertically through the valley fill, represent a population-level signal. The probability that such a pattern arises from non-hydrological processes — or from mis-logging replicated hundreds of times across different boreholes, contractors, and decades — is vanishingly small.
At this point, the question is no longer whether water was present.
The only remaining questions are how persistent, how extensive, and how it structured the landscape.
What the numbers do not rely on
It is important to be explicit about what these totals are not dependent on:
→ they do not depend on a single “key” borehole → they do not rely on shell material alone → they are not driven by one sediment class → they are not sensitive to minor changes in definition
Even if the most conservative exclusions are applied, the order of magnitude does not change. The signal remains.
This section marks the point where the traditional dry-land model becomes mathematically indefensible. The remaining sections address what these numbers mean spatially, how they vary across the valley, and why they cannot be reproduced on the surrounding uplands.
Boreholes showing percentage of River fill – (What Archaeology Missed Beneath Stonehenge)
While the total of 994 water-related bands demonstrates how frequently water interacted with the subsurface, the proportion of each borehole affected shows something more important: whether water was a marginal influence or the dominant process shaping the valley fill.
In several boreholes within Stonehenge Bottom, water-related sediments do not appear as thin, occasional horizons. They make up the majority of the entire borehole profile.
In the most extreme cases, over 90% of the logged sequence, and in at least one borehole, approaching 97%, consists of water-laid or water-altered material.
That figure is not rhetorical. It is arithmetic: the summed thickness of water-affected intervals divided by total borehole depth.
Why percentage matters more than occurrence
A dry chalk landscape affected only incidentally by water would produce a very different subsurface signature:
→ thin, isolated water horizons → limited vertical extent → low proportional impact → intact chalk dominating the sequence
That is not what is observed.
Instead, in key valley-floor locations, intact chalk becomes the minority material, repeatedly interrupted or replaced by gravels, sands, marls, shell-bearing layers, softened chalk, and solution features. Water is not an episode in these boreholes. It is the defining condition.
This distinction is critical. A single water band can be debated. A high band count demonstrates persistence. But when water-related material accounts for nearly the entire stratigraphic record, the environment being recorded cannot reasonably be described as dry.
(What Archaeology Missed Beneath Stonehenge)
Why this cannot be dismissed as “local wet spots”
The percentage values are not confined to one anomalous borehole. They recur across multiple boreholes distributed through Stonehenge Bottom, while dropping rapidly toward the valley margins and disappearing entirely on surrounding high ground.
This spatial behaviour matters:
→ dominance in the valley floor → reduction upslope → absence on the interfluves
That pattern is exactly what a river basin and floodplain system produces. It is not consistent with surface runoff, rainwash, or shallow groundwater effects acting on an otherwise dry landscape.
What high percentages actually record
A borehole composed almost entirely of water-affected material records time, not drama.
It indicates long-term saturation, repeated deposition, reworking, dissolution, and sealing — processes that operate over extended periods. It does not imply catastrophic flooding. It implies a persistent water presence shaping the subsurface continuously.
In that context, the ~97% figure is not an outlier. It is a signal that, in parts of Stonehenge Bottom, the subsurface history is overwhelmingly aqueous.
(What Archaeology Missed Beneath Stonehenge)
6. Control Boreholes
Defining the maximum depth of non-aqueous disturbance
Any claim that Stonehenge Bottom has been substantially reworked by post-glacial water must first answer a simpler question: how deep does non-aqueous disturbance normally penetrate into chalk on local high ground?
That question cannot be answered with a single borehole. It requires a control group.
Three boreholes drilled on high ground around Stonehenge provide that control: RX507, RX508A, and RX510A.
These boreholes are located on interfluves outside the Stonehenge valley system, within the same chalk formation, under the same climatic history, and drilled for the same engineering purposes.
What the control boreholes show
Despite differences in total depth and drilling campaign, all three control boreholes record the same outcome:
→ near-surface disturbance confined to approximately 4.0–4.5 m → below this depth, structurally intact chalk → no progressive softening → no stacked gravel horizons → no shell material → no solution overprint extending downward
This convergence is critical. It shows that shallow disturbance is systematic and limited, not variable or arbitrarily deep.
The depths are consistent:
→ RX507: disturbance to ~4.0 m → RX508A: disturbance to ~4.0 m → RX510A: disturbance to ~4.5 m
These values define the maximum penetration of periglacial and near-surface processes — rainwash, frost action, soil development, and minor cryogenic disruption — on local high ground.
Why does the drilling method not undermine the control
RX507, RX508A, and RX510A include rotary open-hole drilling, which does not preserve fine sedimentary lamination. No claim is made that these boreholes provide detailed stratigraphic resolution.
Their purpose is different.
Open-hole drilling does not selectively erase:
→ deep gravel or cobble horizons → extensive softened or paste-like chalk → solution void systems → repeated vertical disruption
If such features were present below ~4–5 m, they would still manifest as changes in spoil character and lithological description. Their consistent absence across all three boreholes is therefore meaningful.
Why this recalibration matters
With three independent boreholes showing the same shallow disturbance limit, the analysis elsewhere can be recalibrated correctly:
→ the upper ~4–4.5 m is treated as surface / periglacial noise → everything below that depth is evaluated as core chalk behaviour
In the Stonehenge Bottom boreholes, water-related features occur well below this boundary, repeatedly and at multiple depths. That behaviour cannot be attributed to surface processes, periglacial activity, or drilling artefact.
(What Archaeology Missed Beneath Stonehenge)
What the control set proves
The control boreholes demonstrate that:
→ deep chalk disruption is not universal → it is not inherited from geological time → it is not an artefact of logging practice → it is spatially constrained to the valley system
Once this control is established, explanations based on dry chalk, preserved periglacial surfaces, or shallow seasonal wetting become untenable.
The contrast is no longer interpretative. It is geometric and measurable.
Control conclusion
RX507, RX508A, and RX510A together define the maximum depth of non-aqueous disturbance in the Stonehenge landscape.
Everything below that depth in the valley-floor boreholes records a different subsurface regime — one dominated by long-term water interaction.
That control underpins all subsequent sections.
7. Case Study: R16 Counted Properly
From description to arithmetic
To show exactly how the wider dataset was analysed, it is necessary to walk through one borehole in full, line by line, using the fixed rules set out in Section 3. Borehole R16 (SU14SW60) provides a clear example.
R16 is located within the Stonehenge landscape and was logged in detail as part of a British Geological Survey investigation. The borehole has a total depth of 36.57 m and a ground level of 79.50 m OD. No reinterpretation is applied here. Only what is explicitly written in the log is used.
(What Archaeology Missed Beneath Stonehenge)
Step 1: Fix the definitions (no flexibility)
A water-related occurrence is counted only where the log records features that require water to exist or to have existed. These include gravel or cobble bands, marl seams, flint lags, shell material or shell impressions, softened or paste-like chalk, and solution-related features.
Colour change alone is excluded. Drilling artefacts are excluded. Ambiguous notes are excluded.
Step 2: Count discrete water occurrences (N)
Working from the top of the borehole to the base, R16 records 23 separate water-related intervals, each at a different depth and separated by non-water intervals.
These are not subdivisions of a single layer. They are discrete stratigraphic horizons, logged independently, and occurring repeatedly through the sequence.
This means water interacted with the subsurface at least 23 separate times at different points in the borehole’s history.
Step 3: Measure total water-affected thickness (W)
Each interval that has a defined thickness is measured and summed. Point observations (such as single shell notes or thin marl seams) are included in the event count but are not inflated in the thickness total.
For R16, the summed thickness of all water-related intervals is:
W = 4.67 m
Out of a total borehole depth of 36.57 m.
Step 4: Convert thickness to percentage
Once thickness is measured, the proportion of the borehole affected by water can be calculated directly:
Water involvement = 4.67 ÷ 36.57 × 100 = 12.8%
Nearly 13% of the entire subsurface profile shows direct, logged interaction with water.
This figure is not inferred. It is not modelled. It is counted.
Step 5: Calculate frequency (events per metre)
A final metric captures how often water appears through the sequence:
Event density = 23 events ÷ 36.57 m = 0.63 water events per metre
In practical terms, R16 records water influence, on average, every 1.6 metres.
That is incompatible with a dry or stable chalk substrate.
(What Archaeology Missed Beneath Stonehenge)
8. Case Study: R18 and the Shoreline Signal
Why depth matters more than surface finds
If R16 demonstrates how water repeatedly interacted with the subsurface, R18 (SU14SW62) shows where that interaction stabilised within the landscape. This borehole does not simply record water presence — it records a persistent water level.
R18 is drilled into hard chalk beneath Stonehenge Bottom. As with R16, the analysis relies solely on what is explicitly logged, applying the same fixed rules. What distinguishes R18 is not just the number of water-related intervals, but their vertical organisation.
Within this single borehole, 135 distinct water-related sedimentary levels are recorded, comprising gravels, sands, shell material, organic staining, and solution-related chalk. The cumulative thickness of water-affected material is 9.21 m, representing 18.25% of the borehole.
These figures already place R18 well beyond incidental wetting. But the critical signal lies higher in the sequence.
The erosion boundary and what lies below it
Across multiple boreholes into hard chalk in the Stonehenge area, a consistent pattern emerges: natural surface processes — rainwash, frost action, soil formation, and minor periglacial disturbance — affect only the upper ~3.5 m of chalk. Below that depth, intact chalk is normally expected.
In R18, however, repeated shell-bearing and water-laid sediments occur well below this natural erosion boundary, clustered around approximately 92.6 m OD.
That single fact carries weight.
Below the surface-affected zone, chalk should be structurally intact unless acted upon by sustained subsurface water. Shell material at this depth cannot be explained by surface wash, slope creep, or freeze–thaw processes. Those mechanisms do not transport, preserve, or repeatedly introduce shell-bearing sediments into intact chalk tens of metres below ground.
What is being recorded here is not a transient event, but a stable hydrological condition.
Why this records a shoreline, not a flood
Shells require more than water. They require time, stability, and habitable conditions. A single flood might move gravels. It does not establish repeated shell-bearing horizons at the same elevation.
In R18, water-related sediments recur around a consistent vertical level, indicating that water returned to — or persisted at — approximately the same height over extended periods. That behaviour is characteristic of a shoreline or standing-water margin, not episodic inundation.
This distinction matters. A flood leaves chaos. A shoreline leaves repetition.
Spatial implication: beside the stones, not beneath them
The elevation of the highest repeated water-related horizons in R18 places the shoreline downslope from the later stone circle, in the area now occupied by the former Stonehenge car park and adjacent valley floor. The stones themselves sit slightly above this zone.
This spatial relationship is precisely what would be expected if early activity took place adjacent to persistent water, but deliberately positioned on ground that remained reliably dry.
At this point, the argument is no longer abstract. R18 ties water presence to a specific elevation and location within the landscape.
Why R18 matters beyond itself
R18 does not stand alone. Its shoreline signal aligns with:
→ repeated water dominance shown in the wider borehole matrix → high percentage water-affected sequences in nearby valley-floor boreholes → the absence of comparable features on surrounding high ground
Together, these strands converge on a single conclusion: Stonehenge Bottom was not merely wet at times. It contained a persistent water margin during the period when the earliest features in the landscape were established.
(What Archaeology Missed Beneath Stonehenge)
9. The Mesolithic Posts Reinterpreted
Infrastructure, not ritual
The Mesolithic post holes near Stonehenge have long been treated as anomalous. Dated to around 8300 BCE, they sit uncomfortably outside later monument narratives and are routinely described as symbolic, ritual, or inexplicable precursors to Stonehenge itself.
That framing has always depended on one assumption: that the surrounding landscape was dry.
Once that assumption is removed, the problem disappears.
The spatial problem that ritual never solved
The Mesolithic posts are:
→ located downslope from later monuments → positioned several metres above the inferred water level → set back from the valley floor → aligned along a natural route through the landscape
If these posts were ritual markers, their placement is awkward. They are not centred, not enclosed, and not associated with known ceremonial structures. Their position has always required special pleading.
In a water-dominated landscape, however, their location is exactly where it should be.
Posts above water make sense — posts below it do not
If Stonehenge Bottom contained a persistent water margin during the early Holocene, as the borehole evidence indicates, then the posts occupy a functionally optimal position:
→ safely above sustained water levels → close enough for access → far enough to avoid saturation → visible from the water’s edge
This is not where one places abstract symbols.
It is where one places infrastructure.
(What Archaeology Missed Beneath Stonehenge)
What tall timber posts do in watery landscapes
In riverine and floodplain settings, tall timber posts serve well-understood practical roles:
→ mooring points → landing markers → route indicators → boundary and access control → stable reference points in shifting terrain
None of these functions requires ceremonial explanation. They require water movement, repeated use, and practical need.
Once water is acknowledged as the dominant landscape factor, the Mesolithic posts cease to be mysterious. They become logical.
Chronology now works instead of fighting itself
The Mesolithic date of the posts is no longer a problem to be explained away. It becomes a key indicator of early engagement with a water-managed landscape.
Long before sarsens or bluestones, the valley was already being structured, navigated, and used. The posts mark activity responding to water, not anticipating monumentality.
In this context, Stonehenge does not begin as a symbolic construction placed into an abstract landscape. It emerges later within a landscape that was already organised around access, movement, and water.
From monument to harbour
This reinterpretation does not diminish Stonehenge. It grounds it.
The earliest activity in the valley is not ritual abstraction imposed on empty land. It is practical engagement with a flooded environment. The Mesolithic posts represent the first fixed points in that system.
Stonehenge, in this light, does not replace a dry ceremonial field.
It formalises a landscape that was already working.
10. The Periglacial Escape Route Fails
Why do the two explanations not coexist
Once extensive post-glacial water activity is demonstrated in the subsurface, a common fallback is to invoke preserved periglacial features at the surface — particularly along the Stonehenge Avenue — as evidence that the landscape must have remained largely untouched since the Late Pleistocene.
This argument fails on first principles.
Periglacial explanations and the documented subsurface record are mutually incompatible. They cannot both be true.
What preserved periglacial features require
For periglacial stripes, polygons, involutions, or solifluction features to survive as recognisable surface relics, several conditions must hold:
→ a relatively stable ground surface since the Late Pleistocene → structurally intact chalk beneath the surface → dominance of cryogenic fracture rather than chemical solution → minimal post-glacial groundwater circulation and reworking
These requirements are well established in periglacial geomorphology. Preservation depends on limited later disturbance, not simply on the prior existence of cold conditions.
Periglacial Lines – Borehole finds how they are not – (What Archaeology Missed Beneath Stonehenge)
What the boreholes actually show
The borehole record beneath Stonehenge Bottom and the Avenue corridor shows a very different subsurface reality:
→ repeated gravel, cobble, sand, and marl bands → shell material and shell-impression horizons at multiple depths → softened chalk, chalk paste, and solution features → voids and collapse structures → vertical repetition of water-affected horizons through tens of metres
This is not conjecture. It is logged geological data from multiple independent boreholes.
These features are diagnostic of long-term water circulation, saturation, and reworking. They are not produced by freeze–thaw processes.
Why freeze–thaw cannot explain what is observed
Periglacial processes fracture chalk. They do not:
→ dissolve chalk into paste → create solution voids and collapse features → repeatedly rework sediments vertically → introduce or preserve shell-bearing water horizons → generate stacked sequences of hydraulically sorted material
Freeze–thaw acts mechanically and near the surface. The features documented here are chemical, hydraulic, and vertically extensive.
Invoking periglacial processes in this context does not explain the data. It avoids it.
The fatal contradiction
A preserved periglacial surface requires subsurface stability. The boreholes demonstrate subsurface instability driven by water.
Once chalk has been repeatedly saturated, chemically dissolved, mechanically reworked, and overprinted by groundwater flow, the overlying surface cannot be treated as a pristine Ice-Age relic.
You cannot argue for intact periglacial features resting on a substrate that has been demonstrably broken down by post-glacial hydrology. The two interpretations cannot coexist.
Why surface analogy is no longer sufficient
Periglacial explanations for the Stonehenge Avenue rely almost entirely on surface morphology and analogy with other chalk landscapes. What they do not do is engage with the subsurface evidence directly beneath the features being interpreted.
That omission matters.
In modern geology, subsurface data overrides surface analogy. Where boreholes contradict a surface-based interpretation, the subsurface record must lead.
Here, it does—and it points unequivocally to a landscape that has been substantially reworked since the Ice Age.
(What Archaeology Missed Beneath Stonehenge)
11. Why the “Older Ice Age Valley Fill” Argument Also Fails
Predictions versus what is actually observed
When faced with extensive water-related deposits beneath Stonehenge Bottom, a common fallback explanation is to argue that these features represent an inherited Pleistocene valley fill — formed during an earlier Ice Age, then later frozen, stabilised, and preserved into the Holocene.
At first glance, this sounds plausible. In practice, it fails every test.
What an inherited Ice Age valley fill would predict
If the Stonehenge valley fill were primarily an older Pleistocene deposit, later left largely undisturbed, the subsurface record should show a consistent set of characteristics:
→ a coherent valley-fill unit with limited internal repetition → broad lithological continuity rather than frequent alternation → dominance of brecciation and blocky fracture over chemical solution → minimal vertical reworking once deposition ceased → a sealing palaeosurface separating Ice Age deposits from later soils
In short, the record should show one major depositional phase, followed by stability.
What the boreholes actually show
The borehole data beneath Stonehenge Bottom show the opposite:
→ multiple, discrete water-worked bands stacked vertically → repeated alternation between gravels, fines, organic horizons, and chalk → solution features cutting earlier deposits → shell material introduced at multiple depths, not confined to a single unit → no preserved palaeosurface sealing the sequence
This is not the signature of inherited stasis. It is the signature of repeated reworking.
Why freezing does not preserve this pattern
A frozen or periglacially stabilised valley fill would suppress further vertical reorganisation. It would lock sediments in place, fracture chalk mechanically, and reduce chemical solution.
What is observed instead is:
→ progressive chalk dissolution → formation of paste and softened zones → collapse and void development → repeated sediment input long after initial deposition
These processes require liquid water circulation, not frozen ground.
(What Archaeology Missed Beneath Stonehenge)
The shell problem (again)
Shell material is especially diagnostic here.
If the deposits were primarily inherited from an older Ice Age phase, shell-bearing horizons would be expected to occur once, or within a narrow stratigraphic range corresponding to that phase.
Instead, shells and shell-impression horizons recur at multiple depths, often separated by metres of sterile chalk or other deposits.
That pattern requires repeated habitable water conditions, not a single ancient episode.
Why this matters for chronology
An inherited Pleistocene fill would decouple the subsurface record from Holocene landscape use. It would allow water evidence to be dismissed as irrelevant to early Stonehenge.
The borehole data do not allow that move.
The vertical repetition, solution overprinting, and distribution of water-related features demonstrate ongoing Holocene hydrological activity rather than residual Ice Age sediment.
That means the subsurface conditions recorded are contemporary with early human activity in the valley, not a frozen relic beneath it.
The logical endpoint
Once the inherited Ice Age valley-fill model fails, there is no remaining geological mechanism that can explain:
→ hundreds of vertically stacked water-related horizons → deep penetration below the periglacial zone → dominance of water-affected material in valley-floor boreholes → absence of the same features on surrounding high ground
The only explanation that fits all observations is long-term post-glacial water activity confined to the Stonehenge valley system.
At this point, the question is no longer geological.
It is historical.
(What Archaeology Missed Beneath Stonehenge)
12. Locking into the Wider System
River terraces, meltwater volume, and scale
The borehole evidence beneath Stonehenge Bottom does not exist in isolation. Its significance only becomes fully apparent when it is placed back into the regional post-glacial hydrological system that governed southern Britain after the last Ice Age.
Once this wider context is restored, the Stonehenge record stops looking anomalous and instead becomes inevitable.
River terraces are volume records, not abstractions
River terraces are not symbolic features. They are physical records of water volume, discharge duration, and base-level control.
Each terrace represents a prolonged period during which: → meltwater input was sustained → base level stabilised long enough for lateral activity → rivers occupied a relatively fixed elevation
The Avon terrace staircase is therefore not a static landscape. It is a hydrological archive.
Why terrace height matters more than terrace age
Traditional interpretations tend to treat terraces primarily as chronological markers. In doing so, they obscure their more important function: recording the magnitude of water involved.
Higher terraces require: → greater meltwater volumes → longer durations of elevated discharge → sustained backing-up of inland valleys
This is not controversial. It is basic fluvial physics.
Re-evaluating Ice Age scale
The terrace staircase of the Avon has typically been explained using a model in which the most recent Ice Age contributed only a minor proportion of the total erosive and depositional work — often framed as being small compared to much earlier glacial phases.
The borehole evidence at Stonehenge Bottom contradicts this.
If meltwater volumes from the last glaciation were truly negligible, the valley would not record: → repeated Holocene water occupation → deep subsurface reworking below the periglacial zone → dominance of water-affected material in valley-floor boreholes
The only way to reconcile the terrace staircase with the borehole data is to accept that the most recent Ice Age contributed meltwater volumes large enough to drive active water levels up to at least Terrace T9.
Why Stonehenge Bottom sits where it does
Stonehenge Bottom occupies a low-gradient section of the Avon system, precisely where back-flooding, ponding, and stabilised water levels would be expected during periods of elevated base level.
The borehole record confirms this: → water-related horizons stack vertically at consistent elevations → disruption intensifies toward the valley floor → surrounding high ground remains dry and intact
This is not random. It is system behaviour.
(What Archaeology Missed Beneath Stonehenge)
Linking local depth to the regional scale
What the Stonehenge boreholes record is the local expression of a regional process.
The same meltwater that: → drove terrace formation downstream → sustained discharge into the North Sea → reconfigured river systems across southern Britain
…also occupied and re-occupied the Stonehenge valley.
The valley was not an exception. It was part of the system.
Why this matters for interpretation
Once Stonehenge is placed back into this wider hydrological framework, long-standing interpretive problems dissolve:
→ why early activity clusters near the valley → why features sit at specific elevations → why subsurface evidence contradicts “dry chalk” assumptions
The landscape was not marginally wet. It was structurally water-dominated during key periods.
Scale closes the loop.
Small explanations fail because the phenomenon is not small.
A handful of floods cannot produce: → hundreds of stratigraphically discrete water horizons → deep chalk reworking confined to a valley → terrace systems extending across catchments
Only long-duration, large-volume meltwater systems can do that.
Stonehenge Bottom records one node of that system.
And now, for the first time, the subsurface evidence allows that system to be traced — quantitatively, spatially, and historically.
(What Archaeology Missed Beneath Stonehenge)
13. What This Forces Archaeology and Geology to Confront
The borehole evidence beneath Stonehenge Bottom does not merely add detail to an existing narrative. It invalidates a foundational assumption shared by both archaeology and geology: that the Stonehenge landscape was fundamentally dry, stable chalk throughout the Holocene.
Once that assumption fails, a cascade of consequences follows.
Archaeology’s problem: interpretation without ground conditions
For decades, archaeological interpretation around Stonehenge has proceeded as if subsurface conditions were either irrelevant or already understood.
They were neither.
Ritual, symbolic, and cosmological explanations were layered onto features whose physical setting had never been tested against the subsurface record. Mesolithic posts became curiosities. Linear features became symbolic avenues. Landscape use was inferred without first establishing whether the ground itself was dry, wet, stable, or seasonally occupied.
The boreholes now show that this approach is untenable.
If water dominated the valley floor for prolonged periods: → site placement must be re-evaluated → access routes must be reconsidered → early structures must be understood as responses to water, not abstractions from it
This is not a reinterpretation of artefacts. It is a correction to the environmental framework in which they were placed.
Geology’s problem: description without measurement
Geology’s failure is quieter, but deeper.
The borehole logs contained the evidence all along: → gravels → marls → shell material → softened chalk → solution features → voids
But these were described qualitatively, isolated within individual logs, and never synthesised into a landscape-scale analysis.
Words replaced numbers. Confidence replaced calculation.
No one asked: → how many water-related horizons exist → how thick they are cumulatively → how frequently they occur with depth → how they vary spatially across the valley
Once those questions are asked, the “dry chalk” assumption collapses mathematically.
The disciplinary gap that allowed this to persist
Archaeology deferred to geology on ground conditions. Geology deferred to archaeology on relevance.
Between them, the subsurface record was never integrated.
This is how a landscape can be mischaracterised for decades despite the data being publicly available.
Why this is not an attack on expertise
This work does not argue that archaeologists or geologists were careless or incompetent. It argues something more uncomfortable:
They were working inside inherited models that were never quantitatively tested.
That is not a personal failure. It is a methodological one.
What changes from here on
The implications are straightforward and unavoidable:
→ subsurface data must precede interpretation → water involvement must be quantified, not described → control boreholes must be used to define disturbance limits → surface features cannot be interpreted independently of what lies beneath them
These are not radical demands. They are basic scientific ones.
Stonehenge as a test case, not an exception
Stonehenge is not unique because it is famous. It is unique because it is documented.
If this level of subsurface reworking can be demonstrated here, it raises obvious questions about other chalk landscapes that have never been tested at this resolution.
Stonehenge is simply where the failure becomes visible.
The final position
This work does not ask archaeology or geology to abandon their disciplines. It asks them to finish the job properly.
The ground has already recorded what happened.
All that remained was to count it.
Because of the huge amount of data and this blog being over 6000 words, PART II, with all the technical data, including all boreholes, will be published next week.
Podcast
Author’s Biography
Robert John Langdon, a polymathic luminary, emerges as a writer, historian, and eminent specialist in LiDAR Landscape Archaeology.
His intellectual voyage has interwoven with stints as an astute scrutineer for governmental realms and grand corporate bastions, a tapestry spanning British Telecommunications, Cable and Wireless, British Gas, and the esteemed University of London.
A decade hence, Robert’s transition into retirement unfurled a chapter of insatiable curiosity. This phase saw him immerse himself in Politics, Archaeology, Philosophy, and the enigmatic realm of Quantum Mechanics. His academic odyssey traversed the venerable corridors of knowledge hubs such as the Museum of London, University College London, Birkbeck College, The City Literature Institute, and Chichester University.
In the symphony of his life, Robert is a custodian of three progeny and a pair of cherished grandchildren. His sanctuary lies ensconced in the embrace of West Wales, where he inhabits an isolated cottage, its windows framing a vista of the boundless sea – a retreat from the scrutinous gaze of the Her Majesty’s Revenue and Customs, an amiable clandestinity in the lap of nature’s embrace.
Exploring Prehistoric Britain: A Journey Through Time
My blog delves into the fascinating mysteries of prehistoric Britain, challenging conventional narratives and offering fresh perspectives based on cutting-edge research, particularly using LiDAR technology. I invite you to explore some key areas of my research. For example, the Wansdyke, often cited as a defensive structure, is re-examined in light of new evidence. I’ve presented my findings in my blog post Wansdyke: A British Frontier Wall – ‘Debunked’, and aWansdyke LiDAR Flyover video further visualizes my conclusions.
For those interested in British Prehistory, visit www.prehistoric-britain.co.uk, a comprehensive resource featuring an extensive collection of archaeology articles, modern LiDAR investigations, and groundbreaking research. The site also includes insights and extracts from the acclaimed Robert John Langdon Trilogy, a series of books exploring Britain during the Prehistoric period. Titles in the trilogy include The Stonehenge Enigma, Dawn of the Lost Civilisation, and The Post Glacial Flooding Hypothesis, offering compelling evidence about ancient landscapes shaped by post-glacial flooding.
To further explore these topics, Robert John Langdon has developed a dedicated YouTube channel featuring over 100 video documentaries and investigations that complement the trilogy. Notable discoveries and studies showcased on the channel include 13 Things that Don’t Make Sense in History and the revelation of Silbury Avenue – The Lost Stone Avenue, a rediscovered prehistoric feature at Avebury, Wiltshire.
In addition to his main works, Langdon has released a series of shorter, accessible publications, ideal for readers delving into specific topics. These include:
For active discussions and updates on the trilogy’s findings and recent LiDAR investigations, join our vibrant community on Facebook. Engage with like-minded enthusiasts by leaving a message or contributing to debates in our Facebook Group.
Whether through the books, the website, or interactive videos, we aim to provide a deeper understanding of Britain’s fascinating prehistoric past. We encourage you to explore these resources and uncover the mysteries of ancient landscapes through the lens of modern archaeology.
For more information, including chapter extracts and related publications, visit the Robert John Langdon Author Page. Dive into works such as The Stonehenge Enigma or Dawn of the Lost Civilisation, and explore cutting-edge theories that challenge traditional historical narratives.
Durrington Walls has long been treated as a problem site. Despite decades of excavation, reinterpretation, and popular retelling, it has never settled comfortably into any single explanatory model. It is alternately described as a village, a ritual aggregation centre, a ceremonial counterpart to Stonehenge, or a symbolic landscape without a clear economic function. Each interpretation resolves one difficulty only by creating several others. The result is a site that is endlessly described, but never fully explained.
At the heart of this problem lies a single, rarely challenged assumption: that Durrington Walls was fundamentally a dry-land site.
Once this assumption is adopted, everything else follows automatically. Timber circles must be buildings. Ditches must be boundaries. Irregular features must be symbolic, incomplete, or poorly preserved. Water becomes incidental, a backdrop rather than an organising force. The site is then interpreted through analogy with later prehistoric monuments built on stable ground in fundamentally different environmental conditions.
But if that initial assumption is wrong, then the entire interpretive framework collapses.
This essay re-examines Durrington Walls not as a dry ceremonial complex, but as a managed wetland landscape, operating within a Mesolithic or early Neolithic hydrological regime characterised by elevated groundwater, seasonal flooding, and an expanded River Avon system. When water is treated as an active variable rather than an inconvenience, features that once appeared anomalous begin to behave coherently. Structures that resisted architectural explanation begin to make functional sense.
Crucially, this reassessment does not rely on speculation, symbolism, or ethnographic metaphor. It is driven by structure: by the physical geometry of post-holes, the mechanics of timber insertion and removal, the engineering logic of ditches, and the spatial relationships between features. The question throughout is not “what did this mean?” but “what does this do?”
Previous discussions have already demonstrated that the Southern Circle at Durrington Walls does not conform to the construction logic of a domestic “great house.” Its post-holes show evidence of driven piles rather than excavated sockets, repeated refitment, extraction scars, and maintenance over time—behaviour entirely inconsistent with a single-phase roofed structure, but entirely consistent with a load-bearing platform operating in wet or unstable ground. That argument will be summarised here, not repeated in full.
What has received far less attention, however, is the Northern Circle.
The North Circle has always been awkward for orthodox interpretations. It is irregular, incomplete, and structurally incoherent if treated as architecture. It lacks symmetry, closure, and any plausible roof logic. As a result, it has often been marginalised in discussion, treated as a secondary or failed monument, or folded into vague ceremonial narratives that demand little mechanical explanation.
This essay takes a different approach.
Instead of asking why the North Circle fails to resemble a building, it asks whether it was ever intended to be one.
When the North Circle post-hole pattern is examined without architectural preconceptions, a very different structure emerges. The arrangement is directional rather than radial. Post density varies by position rather than by ritual importance. Open-ended alignments replace enclosed rings. Linear elements appear that make no sense as walls, but perfect sense as access routes. In plan, the structure resembles neither a house nor a monument, but a capture and control system.
Specifically, it resembles a stake-built fish trap or weir, integrated into a seasonally flooded landscape and connected—directly or indirectly—to the Avon system.
This proposal is not based solely on analogy. Fish traps across riverine and wetland environments worldwide share a remarkably consistent structural logic: converging stake lines, funnel geometries, selective reinforcement, open ends, and maintenance walkways. These traits recur because they work. When these same traits appear at Durrington, they deserve to be evaluated functionally rather than dismissed symbolically.
The argument developed in the sections that follow is therefore straightforward, but far-reaching. Durrington Walls was not a village decorated with monuments. It was a working landscape, engineered to manage water, movement, and resources. The Southern Circle and Northern Circle were not paired symbols, but paired components within a single operational system: one concerned with capture and provisioning, the other with unloading, staging, and redistribution.
Once this is recognised, Durrington ceases to be enigmatic.
It becomes intelligible.
Durrington Walls Revisited
The Southern Circle Revisited: Why It Was Never a “Great House”
The interpretation of the Southern Circle at Durrington Walls as a monumental timber “great house” has become so familiar that it is rarely interrogated at a mechanical level. The idea is attractive: a vast roofed hall, domestic or ceremonial in nature, forming a symbolic counterpart to Stonehenge. Yet when the excavation evidence is examined in detail—particularly the published section drawings rather than the interpretive summaries—the great house model begins to fail almost immediately.
The most revealing comparison lies only a short distance away. Woodhenge provides a genuine example of dry-land timber construction in the same landscape. There, the post-holes behave exactly as expected for excavated sockets: bases are flat or gently scooped, profiles widen with depth, and the construction appears largely single-phase. There is no evidence for repeated refitment, no extraction scars, and no need for structural revision once the building was complete. This is what dry-ground timber architecture looks like.
The Southern Circle shows none of these characteristics.
Instead, a significant proportion of its post-holes display pointed or strongly convergent basal profiles. This is not a minor detail. In chalk geology, a pointed base cannot be created—or preserved—by excavation using antler picks or stone tools. Digging necessarily destroys such geometry almost immediately: chalk fractures, loosens, and collapses under levering action. The only reliable way to create and preserve a pointed basal profile in chalk is through percussive insertion—repeatedly driving a sharpened timber pole vertically into the ground.
In other words, these posts were driven, not dug.
This single observation has far-reaching consequences. Driven posts imply a construction method closer to pile-driving than pit excavation. They imply a concern with vertical load transfer rather than lateral stability. And they imply ground conditions in which excavation was either impractical or unnecessary—conditions consistent with saturated or semi-saturated substrates, not dry stable ground.
The Southern Circle also shows extensive evidence of refitment and maintenance. Many post-holes were re-cut, enlarged, or overlapped by later insertions. Some show multiple phases of intervention, with earlier sockets truncated or partially reused. This behaviour is incompatible with a roofed hall. Large timber buildings are constructed once, used for their lifespan, and then abandoned or dismantled. They are not repeatedly re-engineered at the level of individual load-bearing elements.
The Graet House – being constructed at the Stonehenge Visitors site – Durrington Walls Revisited
Platforms, by contrast, are.
A load-bearing platform operating in wet ground is subject to continual stress. Timber piles rot, shift, or fail below the waterline. Loads change seasonally. Maintenance is not optional; it is a structural necessity. The Southern Circle’s pattern of intervention fits this logic precisely. It behaves like a working structure that requires periodic repair, not like a symbolic or domestic building.
The so-called “ramps” associated with many of the Southern Circle post-holes reinforce this conclusion. These features have traditionally been interpreted as construction aids, used to insert large timbers into excavated pits. Mechanically, this interpretation is weak. A pointed timber pile does not require a ramp to be driven vertically. It does, however, require leverage and access when being removed—especially from wet or compacted ground.
The ramps at Durrington are irregular in orientation, inconsistent in form, and closely associated with refitment episodes. They make little sense as planned construction features. They make perfect sense as extraction scars, created when failing piles were levered out at oblique angles prior to replacement.
Water also resolves several subsidiary problems that have long accompanied the Southern Circle. The relative absence of charcoal, often cited as anomalous for a timber structure, is easily explained in wet conditions, where organic debris is floated away, oxidised, or redeposited elsewhere. The preservation of pointed basal profiles becomes more plausible when chalk fines slump and seal around driven posts in saturated ground. Even the subtlety of the ramps themselves is better explained by soft, infilling sediments than by erosion on dry surfaces.
Finally, the location of the Southern Circle is deeply uncomfortable for a “great house” interpretation. It sits at the head of a coombe, above the River Avon, on chalk geology prone to elevated groundwater, and within a broad flat-bottomed ditch. This is a poor location for a monumental roofed building. It is an excellent location for a pile-supported platform designed to interface with water.
When all of these observations are taken together, the conclusion is difficult to avoid. The Southern Circle at Durrington Walls was not constructed like a house, not maintained like one, and not positioned like one. It behaves instead as a load-bearing, wet-ground-adapted platform, built using driven timber piles and maintained through repeated intervention.
This reclassification is not speculative. It follows directly from the published excavation evidence. And once accepted, it provides the foundation for understanding the rest of the site—particularly the Northern Circle—not as isolated monuments, but as components within a single, coherent system.
Durrington Walls Revisited
The Ditch That Isn’t a Henge
Encircling much of Durrington Walls is a substantial ditch, approximately six metres wide, flat-bottomed, and conspicuously lacking many of the features usually associated with a defensive or symbolic enclosure. For decades, this feature has been described almost reflexively as a “henge ditch.” Yet this label explains little. Instead, it obscures a series of mechanical and spatial problems that have never been satisfactorily resolved.
If the ditch is examined as part of a conventional henge monument, its design is baffling. It has no associated bank, either internal or external. It does not create a visual boundary, nor does it restrict movement in any meaningful way. In places, it terminates abruptly, particularly near the Southern Circle, rather than forming a closed circuit. Its scale is excessive for symbolism alone, yet insufficient for defence. These inconsistencies have been noted repeatedly, but they are usually brushed aside as idiosyncrasies or later disturbances.
The difficulty lies not in the ditch itself, but in the assumption that it must be a boundary.
Boundaries—whether defensive, ritual, or social—require continuity. They are designed to enclose, exclude, or demarcate. They demand banks, palisades, or visual markers that signal a transition from one space to another. The Durrington ditch does none of these things. It is flat-bottomed rather than V-shaped, open rather than enclosed, and discontinuous rather than circuital. As a boundary, it fails on every functional criterion.
As an element of water infrastructure, however, it begins to make sense almost immediately.
Flat-bottomed channels are not arbitrary. They are used where predictable draft matters, where grounding without capsizing is desirable, and where loading and unloading must occur repeatedly. A flat base allows small craft to settle safely as water levels fluctuate. It facilitates the transfer of people, animals, or goods. And crucially, it will enable vessels to wait—either moored or grounded—without blocking movement elsewhere in the system.
Inadequate representation of the ditch – for Propaganda purposes – Durrington Walls Revisited
In such a context, a bank would be a liability rather than an asset. Banks restrict access, create instability through slumping, and impede lateral movement. The absence of a bank at Durrington is not an omission; it is a design choice.
The ditch also stops where it stops being useful. Near the Southern Circle platform, where water-managed access converges, the ditch terminates rather than looping neatly around the structure. This behaviour is inexplicable in symbolic terms, but entirely logical if the ditch functions as an access basin or secondary channel — infrastructure ends where function ends, not where geometry demands closure.
Further reinforcing this interpretation is the presence of smaller, narrow linear ditches within the enclosure. These features cut across activity areas, vary in depth according to slope, do not enclose anything, and extend beyond the immediate vicinity of the Southern Circle. They are often dismissed as later intrusions, drainage attempts, or poorly understood disturbances. Such labels may account for reuse, but they do not explain origin.
The site drawings are not the same as the excvation Record view of the ditch – Durrington Walls Revisited
In a dry landscape, these features are indeed awkward. They serve no obvious purpose. In a seasonally flooded chalk landscape, however, they behave exactly as secondary redistribution channels. They guide shallow flows, drain saturated areas, and create controlled pathways for water, people, or small craft moving between functional zones.
The critical point is that none of this infrastructure makes sense unless water was a recurring and significant presence. In permanently dry conditions, the ditch is redundant. The platform is unnecessary. The engineering is absurd. In wet conditions—where wheeled transport fails, livestock must be controlled, and movement across saturated ground is hazardous—water becomes the safest and most efficient route. The ditch, the channels, and the platform together form a coherent system.
This reinterpretation also dissolves the artificial separation between the ditch and the Southern Circle. Traditionally, the ditch is treated as a framing device, a symbolic container for the monument within. Under a functional reading, the relationship is reversed. The ditch exists for the platform, not around it. It facilitates access, movement, and staging at the point where loads are transferred between water and land, or vice versa.
Once the ditch is understood as an access basin rather than a boundary, it becomes clear that Durrington Walls was never intended to be enclosed in the conventional sense. It was designed to be entered, exited, and worked within. Control was achieved not through exclusion, but through channelling movement along predictable routes.
This reframing is not radical. It simply requires taking the physical form of the ditch seriously and asking what it is mechanically suited to do. When that question is asked honestly, the answer is no longer “henge,” but hydraulic infrastructure.
And that infrastructure, as the next section will show, connects directly to the site’s most misunderstood element: the Northern Circle.
Durrington is NOT a Henge as it has no banks and it’s a natural water feature – Durrington Walls Revisited
Introducing the North Circle: The Forgotten Half of the System
If the Southern Circle has been misread because it was forced into the category of a “great house,” then the North Circle has been misread because it has never fit comfortably into any category at all. Its awkwardness is not accidental. It is the clearest signal that the interpretive framework applied to Durrington Walls has been wrong from the outset.
The North Circle has typically been described in vague or dismissive terms: an incomplete timber circle, a subsidiary structure, a poorly preserved monument, or a ceremonial feature whose purpose remains unclear. These descriptions all share a common trait—they treat the North Circle as a failed version of something else, rather than asking what it actually is.
When examined on its own terms, the North Circle does not behave like architecture.
Architectural timber circles, whether domestic or ceremonial, tend to display several consistent characteristics. They favour regular spacing, because loads must be distributed predictably. They favour symmetry because roof structures require balanced support. They favour closure, because walls and roofs must enclose space. And they usually exhibit clear entrance logic aligned with internal organisation.
The North Circle exhibits none of these traits.
Instead, its post-holes are irregularly spaced, with zones of dense clustering and zones of relative absence. The arrangement is incomplete rather than closed. There is no coherent radial symmetry, no central focus, and no plausible roof geometry that could span the pattern without extraordinary and unnecessary complexity. Attempts to “complete” the circle or impose a regular geometry on it require heavy interpretive intervention—joining dots that the ground itself does not join.
This failure has often been attributed to truncation, later disturbance, or erosion. Yet this explanation becomes increasingly strained when the pattern is viewed as a whole. The irregularities are not random. They are structured. They display directionality, not decay.
Several alignments within the North Circle converge or taper, forming subtle V- or funnel-like shapes. These are not centred on a focal point, but biased toward particular orientations. Post density increases in some areas precisely where a structural or functional constraint would be expected, and decreases where openness would be advantageous. The plan reads not as a ring, but as a system of guidance and control.
Equally telling is what the North Circle does not attempt to do. It does not demarcate a sacred interior. It does not create an enclosed performance space. It does not separate inside from outside. Instead, it remains porous, open-ended, and accessible. These are not failures of design; they are the opposite. They indicate that containment was never the goal.
The persistent mistake has been to assume that posts must define walls.
Posts can just as easily define routes, channels, funnels, and working edges. In wetland and riverine environments, timber stakes are rarely used to enclose space. They are used to shape the movement of water, animals, and people. When the North Circle is read with this in mind, its structure stops looking defective and starts looking purposeful.
The spatial relationship between the North and South Circles reinforces this interpretation. The two are not redundant repetitions of the same idea. They occupy different positions within the enclosure, relate differently to slope and hydrology, and exhibit radically different construction logic. If they were both ceremonial timber monuments, built by the same community for the same symbolic purpose, this divergence would be inexplicable.
If they are components of a functional system, it is expected.
The Southern Circle, with its deep driven piles and heavy maintenance signature, behaves like a load-bearing interface—a place where weight, stress, and repeated use demanded structural robustness. The North Circle, by contrast, exhibits lighter construction, selective reinforcement, and directional geometry. It appears designed to work with movement rather than resist it.
This distinction has important implications. It suggests that Durrington Walls was not organised around a single focal monument, but around distributed functions. Different tasks required different structures, each optimised for its role within a larger operational landscape. In such a system, symmetry and monumentality are irrelevant. Efficiency and adaptability matter far more.
The North Circle has been forgotten not because it is unimportant, but because it does not conform to expectations. It does not announce itself as a monument. It does not demand reverence. It looks messy, irregular, and practical. In other words, it looks like infrastructure.
Recognising the North Circle as such does more than rehabilitate a neglected feature. It completes the picture begun with the Southern Circle and the ditch. It suggests that Durrington Walls was organised around movement and control, not static display. And it prepares the ground for a closer examination of the North Circle’s post-hole structure—an examination that points, quite consistently, toward a specific functional model.
That model is not architectural.
It is economic.
And it is aquatic
Simplistic Archaeologist’s View of The Southern Circle – Durrington Walls Revisited
Reading the Post-Hole Structure Correctly
The North Circle at Durrington Walls has resisted interpretation primarily because it has been read as architecture. Once that assumption is removed, the post-hole pattern stops appearing chaotic and begins to behave coherently. The key is to read the structure directionally, not radially.
This section does not argue by analogy or symbolism. It reads the geometry as preserved in plan.
A Crannog lives in water and has an evident footprint – Durrington Walls Revisited
5.1 Directionality, Not Radial Design
Architectural timber circles—whether domestic or ceremonial—are organised radially. Posts are arranged around a centre, spacing is broadly consistent, and geometry prioritises balance. The North Circle does none of this.
Instead, the post-holes form directional alignments.
Several lines of posts converge, narrowing toward specific zones rather than orbiting a central point. These alignments do not mirror one another, nor do they divide space evenly. They are biased in orientation, favouring particular directions across the enclosure rather than reinforcing a circular interior.
Most importantly, these converging lines form funnel-like geometries.
Funnels are not architectural devices. They are control devices. They are used to guide movement—of water, animals, or material—toward predictable points. In buildings, funnels are undesirable; they create uneven load and instability. In capture systems, they are essential.
The absence of any true radial symmetry is therefore not a problem to be explained away. It is diagnostic. The structure was never intended to define a central space.
Northern Circle showing a classic Crannog connected walkway- Durrington Walls Revisited
5.2 Variable Density and Open Ends
Equally revealing is the uneven density of post-holes across the structure.
Some zones show closely spaced posts, reinforced and clustered. Other areas are sparse, open, or entirely absent of posts. This pattern is inconsistent with walls or supports, which demand relatively uniform spacing to function structurally.
Instead, the density varies where stress or control would be required.
Reinforced zones occur at points of convergence and directional change. These are precisely the locations where pressure—hydraulic, biological, or mechanical—would be concentrated. Open zones occur where flow must continue unimpeded. This is not accidental variation; it is selective reinforcement.
Just as important is what the structure does not do.
The North Circle does not close.
There is no continuous ring, no sealed boundary, and no attempt to demarcate an “inside” and “outside.” Gaps are not randomly distributed but aligned with the directional geometry of the posts themselves. These open ends allow movement through the structure rather than confinement within it.
Containment is the defining feature of architecture. Controlled permeability is the defining feature of movement systems.
The North Circle is consistently permeable.
5.3 Structural Implication
Taken together, these characteristics are decisive:
Converging lines rather than radial symmetry
Funnel-shaped geometries rather than enclosed spaces
Biased orientation rather than balanced layout
Reinforced zones paired with deliberate openness
Absence of closure
This is not architectural geometry.
It is movement-control geometry.
The posts do not define walls. They define paths. They do not enclose space. They shape flow.
Once read correctly, the North Circle ceases to be an “incomplete monument” and becomes a purpose-built control structure designed to operate within a fluid, changing environment. The geometry is functional, not symbolic, and it does exactly what it needs to do—no more, no less.
The remaining question is therefore not whether this structure controlled movement, but what kind of movement it was designed to control.
The answer to that question lies in a close comparison with known prehistoric and ethnographic examples of stake-built capture systems—specifically, fish traps and weirs.
That comparison is structural, not metaphorical, and it is the subject of the next section.
Durrington Walls Revisited
Fish Traps, Weirs, and Walkways: A Structural Match
Once the North Circle is read as movement-control geometry rather than architecture, the range of plausible functions narrows rapidly. Among known prehistoric structures, one class matches the observed geometry with remarkable consistency: stake-built fish traps and weirs in riverine and wetland environments.
This is not a loose analogy. It is a structural correspondence.
Across Europe and beyond, fish traps built from driven wooden stakes share a small number of invariant design principles. These principles recur because they solve the same physical problems—guiding aquatic movement, managing variable water levels, and allowing human access for maintenance and harvesting. The North Circle conforms to these principles point by point.
6.1 Core Structural Traits of Stake-Built Fish Traps
Fish traps are not enclosures. They are guidance systems.
Their defining features include:
Converging stake lines forming V- or funnel-shaped geometries
Biased orientation aligned to current, slope, or tidal movement
Selective reinforcement at points of pressure or convergence
Open ends to prevent blockage and allow controlled release
Replaceable driven posts, not permanent load-bearing timbers
These systems are designed to be worked, not admired. Stakes are driven, removed, replaced, and re-set as conditions change. Precision is functional, not geometric. Symmetry is irrelevant.
This description matches the North Circle far more closely than any architectural model ever proposed for it.
6.2 Funnel Geometry and Capture Logic
At the heart of most fish traps lies a simple idea: narrowing space increases predictability.
Fish moving with current, tide, or seasonal flow tend to follow the path of least resistance. Converging stake lines exploit this behaviour, reducing lateral escape while avoiding complete obstruction. The narrowing geometry concentrates fish into a manageable zone where they can be collected, speared, netted, or temporarily held.
The North Circle exhibits precisely this behaviour.
Its post alignments converge rather than encircle. Density increases toward specific zones rather than around a centre. There is no attempt to close the structure, because closure would be counterproductive. A fully enclosed trap risks blockage, damage, and loss of control during high flow.
Instead, permeability is engineered.
6.3 Walkways and Working Edges
A further diagnostic feature of fish traps is the presence of access routes.
Fish traps require continual human intervention:
clearing debris
repairing or replacing stakes
harvesting catch
adjusting geometry to seasonal conditions
For this reason, many prehistoric traps incorporate walkways or linear access edges—not formal platforms, but narrow zones where people can move alongside or into the structure without disrupting flow.
The North Circle includes precisely such linear elements.
These alignments do not contribute to enclosure or support. They make no sense as walls or screens. But as working edges, they are entirely intelligible. They allow access to key points within the structure while maintaining the integrity of the funnel geometry.
This feature is difficult to explain symbolically. It is trivial to explain functionally.
6.4 Driven Posts and Maintenance Cycles
Fish traps almost universally employ driven stakes rather than excavated post-holes. Speed of construction, ease of replacement, and adaptability matter more than permanence. Stakes are sharpened, driven into soft or saturated ground, and replaced as needed.
This construction logic mirrors what has already been observed at Durrington, particularly in the Southern Circle, but at a lighter scale appropriate to a capture system rather than a load-bearing platform.
Crucially, fish traps leave minimal artefactual signatures. They are economic infrastructure, not ritual deposition sites. Their primary archaeological trace is geometric: the pattern of post-holes themselves. This explains both the long-standing interpretive discomfort and the lack of “confirmatory” finds.
Durrington Walls Revisited
6.5 Structural Conclusion
The correspondence between the North Circle and known fish-capture systems is not based on superficial resemblance. It is grounded in:
Directional funnel geometry
Variable post density
Open, non-enclosing design
Evidence for driven, replaceable posts
Presence of access alignments
Taken together, these traits identify the North Circle as a capture and control structure operating in a wetland context. Fish traps are not the only structures that control movement, but they are the only ones that match all of the observed characteristics without forcing the evidence.
The remaining task is to situate this structure within its environmental setting. Geometry alone suggests function; hydrology makes it inevitable.
That context—specifically the relationship between the North Circle, seasonal flooding, and the River Avon—is the focus of the next section.
6.6 Stakes Alone Do Not Capture Fish: The Role of Nets and Panels
It is essential to clarify a common misconception when interpreting prehistoric fish traps. Wooden stakes by themselves do not usually trap fish. Their primary role is to define geometry—to create funnels, guide movement, and provide anchoring points. Actual capture is achieved through flexible barriers fixed between those stakes.
Across ethnographic and archaeological examples, fish traps consistently combine:
driven poles or stakes
nets, woven reed panels, or wattle screens
removable or seasonal barriers
These soft components perform the critical work. Nets stretch between adjacent stakes, forming semi-permeable walls that allow water to pass while restricting fish movement. Wattle panels can be lifted, lowered, or removed entirely, enabling selective harvesting and preventing damage during high flow.
This distinction is crucial for interpreting the North Circle at Durrington Walls.
The post-hole pattern defines where barriers were anchored, not the barriers themselves. The absence of preserved nets or panels is therefore not a problem. Organic woven materials decay rapidly, particularly in fluctuating wet–dry conditions. What survives archaeologically is the system’s structural skeleton: the stake pattern.
This also explains the variable spacing observed in the North Circle. Where fine control was needed—such as at funnel throats or retention zones—posts are closer together, providing frequent anchor points for nets or woven screens. Where guidance alone was sufficient, spacing increases, allowing flow without excessive material resistance.
Importantly, this arrangement allows for adaptive management. Nets can be tightened or slackened. Panels can be reconfigured seasonally. Sections can be opened to release non-target species or to clear debris. The post system remains, while the soft infrastructure changes.
This behaviour aligns precisely with what is seen at Durrington. The North Circle shows:
permanent stake positions
selective reinforcement
no attempt at full enclosure
evidence for ongoing maintenance
These traits are incompatible with rigid architectural forms, but entirely consistent with net-assisted capture systems.
The presence of linear access alignments—interpreted in the previous section as walkways or working edges—becomes even more significant in this context. Nets must be set, checked, lifted, repaired, and cleared. This requires controlled human access along the structure. The North Circle provides that access structurally, without interfering with flow or capture zones.
Finally, this model explains why such a system would coexist with the Southern Circle platform rather than replace it. Fish traps capture and concentrate fish; platforms are needed to:
process catches
distribute food
store or dry fish
provision larger groups
The two structures are complementary, not redundant.
Durrington Walls Revisited
Hydrology and the Avon Connection
The functional interpretation of the North Circle as a net-assisted fish capture system only becomes fully coherent when placed within its hydrological context. Without water, the structure is inexplicable. With water, it is inevitable. The controlling variable is not symbolism or ritual intent, but the behaviour of the River Avon system during the Mesolithic and early Holocene.
Post-glacial Britain was not a dry, stable landscape punctuated by neatly contained rivers. It was a wet, dynamic environment characterised by elevated groundwater tables, seasonally inundated floodplains, and laterally mobile channels. Chalk landscapes in particular respond to rising water tables by spreading water across broad areas rather than confining it to discrete banks. Springs emerge unpredictably, coombes fill, and low gradients produce slow-moving, shallow flows ideal for fish movement—and capture.
In such conditions, the Avon would not have been the narrow, incised river seen today. It would have occupied a much broader floodplain, with multiple shallow channels, seasonal overbank flow, and temporary wetlands forming and dissipating across the valley floor. This is precisely the kind of environment in which stake-built fish traps are most effective.
Durrington Walls’ location places it at a critical junction within this system. Situated above the Avon, at the head of a coombe, the site occupies a natural transition zone between higher ground and floodplain. This is where water slows, spreads, and becomes manageable. Fish moving upstream or laterally with seasonal flooding are naturally funnelled into such areas. Human intervention needs only enhance an existing pattern.
The North Circle sits downslope from the main enclosure, in a position consistent with intermittent or seasonal water flow rather than permanent submersion. This is important. Fish traps are rarely placed in deep, fast-flowing channels. They are placed where water is shallow enough to control, slow enough to guide, and predictable enough to exploit repeatedly. The North Circle occupies exactly such a zone.
The Southern Circle platform, by contrast, occupies a slightly higher and more stable position. This spatial separation is not accidental. Capture systems are messy, dynamic, and exposed to fluctuating conditions. Processing and redistribution require firmer footing. The two structures are therefore arranged along a hydrological gradient rather than a ceremonial axis.
When the ditch system is reintroduced into this picture, the integration becomes clearer still. The broad flat-bottomed ditch functions as a controlled water body—part basin, part channel—linking capture zones, working areas, and access points. Smaller linear ditches act as secondary channels, draining or redistributing water as conditions change. Together, these features create a managed waterscape rather than a bounded monument.
This model also explains why Durrington Walls does not behave like a settlement. Permanent domestic occupation is poorly suited to fluctuating wet ground. Infrastructure, however, thrives on predictability rather than permanence. Fish runs are seasonal but reliable. Flooding is disruptive but cyclical. A site organised around provisioning and aggregation does not need year-round habitation; it requires timing.
The Avon connection further explains the scale of the system. Fish capture at this level is not a subsistence afterthought. It is provisioning infrastructure capable of supporting large numbers of people over short periods. This aligns neatly with isotopic evidence from nearby sites indicating the movement of cattle over long distances. Aggregation events require reliable food sources. Fish, preserved by drying or smoking, provide exactly that.
Crucially, none of this requires speculative reconstructions of ritual behaviour. It requires only an honest assessment of how water behaves in chalk landscapes and how people respond to it. Once hydrology is treated as an active force rather than a passive backdrop, the site stops fragmenting into unrelated anomalies and starts functioning as a system.
The North Circle does not need to be reimagined as symbolic. The Southern Circle does not need to be elevated into a hall. The ditch does not need to enclose anything.
They need only to be wet.
With the hydrological framework in place, the final step is to integrate all components—North Circle, Southern Circle, ditch, and channels—into a single operational model. That integration, and its wider implications for how Durrington Walls is understood, forms the basis of the next section.
Avon in the Mesolithic – Durrington Walls Revisited
One System, Not Two Monuments
Once the North Circle is understood as a net-assisted fish capture structure operating within a flooded landscape, and the Southern Circle as a pile-supported platform adapted to wet ground, the most important interpretive shift becomes unavoidable: these were not two monuments serving parallel symbolic roles. They were two components within a single operational system, each designed for a different task but dependent on the other to function effectively.
Traditional interpretations have treated the two circles as variants of the same idea—timber equivalents of stone monuments, perhaps reflecting social or ritual dualism. This approach struggles to explain why the two structures differ so profoundly in construction logic, geometry, maintenance signature, and placement. If they were built by the same community, at roughly the same time, for the same symbolic purpose, such divergence would be inexplicable.
If they were built for different functions, it is exactly what we should expect.
The North Circle, with its directional geometry, variable post density, open ends, and reliance on nets or panels fixed between stakes, is optimised for capture and control. It operates in shallow, slow-moving water. It is light, adaptable, and continuously reworked. Its success depends on guiding movement rather than resisting it.
The Southern Circle, by contrast, is heavy, vertical, and structurally intensive. Driven piles, pointed bases, extraction scars, and repeated refitment indicate a structure designed to carry load and withstand repeated use. It is not concerned with guiding movement, but with supporting weight—people, animals, goods, or equipment—above unstable ground.
These are not alternative expressions of monumentality. They are complementary solutions to different problems posed by the same environment.
The spatial relationship between the two reinforces this reading. They are positioned along a hydrological gradient rather than a symbolic axis. Capture occurs where water spreads and slows; processing and redistribution occur where footing is more reliable. Movement between the two is short, direct, and controlled, minimising loss and maximising efficiency. This is how working landscapes are organised.
The ditch system binds these elements together. Far from enclosing or separating, it facilitates the circulation of water, people, and resources. The broad flat-bottomed ditch provides a holding basin and access route. Smaller linear ditches redistribute flow internally. Together, they create a managed network rather than a ceremonial boundary.
This integrated system also explains features that have long resisted interpretation. The absence of domestic architecture ceases to be a problem once the site is recognised as seasonal or task-specific rather than permanently inhabited. The lack of ritual deposition around the North Circle becomes irrelevant once its function is understood as economic rather than symbolic. The repeated maintenance of the Southern Circle stops being anomalous and becomes expected.
Importantly, this model does not diminish the social or cultural importance of Durrington Walls. On the contrary, it elevates it. The infrastructure of this scale implies coordination, planning, and shared knowledge. Fish capture systems require an understanding of seasonal cycles, water behaviour, and animal movement. Platforms that support heavy, repeated use demand engineering competence and long-term investment.
What it does reject is the idea that meaning must always precede function.
In many prehistoric contexts, function generates meaning, not the other way around. Aggregation sites become socially significant because they work—because they feed people, enable exchange, and bring groups together at predictable times. Ritualisation follows success; it does not replace it.
Seen in this light, Durrington Walls begins to resemble other large-scale provisioning landscapes known from wetland contexts worldwide. These are places where food is captured, processed, and distributed; where people gather seasonally; where social bonds are renewed around shared labour rather than abstract symbolism.
The persistent attempt to read Durrington as a dry ceremonial complex has obscured this possibility for decades. Once water is reintroduced as the organising force, the site stops fragmenting into unrelated anomalies. The North Circle, Southern Circle, ditch, and channels lock together into a coherent whole.
They were never meant to be read separately.
The next question, then, is not how this system functioned internally—that is now clear—but what it was capable of supporting. The answer lies in the scale of provisioning required to sustain aggregation, movement, and long-distance exchange. That evidence comes from the animals themselves.
Durrington Walls Revisited
Provisioning, Not Symbolism: Fish, Cattle, and Aggregation
The integrated model proposed for Durrington Walls—combining fish capture, water-managed access, and load-bearing platforms—only makes sense if it served a substantial provisioning role. Infrastructure of this scale is not built to support small household groups. It is built to sustain aggregation: the periodic gathering of large numbers of people for social, economic, or logistical purposes. The archaeological evidence strongly supports this interpretation.
One of the most compelling lines of evidence comes from animal remains, particularly cattle. Isotopic analysis of cattle teeth from the Durrington area has demonstrated that animals were brought to the site from hundreds of kilometres away, including regions as distant as northern Britain. This level of movement cannot be explained by casual exchange or local herding. It implies planned transport, coordination across landscapes, and a clear reason for convergence.
Moving cattle over such distances presents a fundamental logistical challenge: feeding people during aggregation events. Large numbers of humans and animals arriving simultaneously create immediate provisioning demands. Terrestrial resources alone are insufficient unless extensive storage or long-term settlement is present. Durrington Walls shows no convincing evidence for either.
Fish solve this problem elegantly.
Riverine and wetland fish resources are highly productive, predictable, and scalable. Seasonal runs concentrate biomass naturally, allowing capture systems to harvest large quantities with relatively low labour input once infrastructure is in place. Fish can be consumed fresh, but more importantly, they can be preserved—dried or smoked—for use over extended periods. This makes them ideal for supporting short-term population spikes.
The presence of a dedicated fish capture system adjacent to a processing and redistribution platform transforms Durrington from a symbolic gathering place into a functional provisioning hub. Fish provide the caloric baseline that allows cattle to be moved and exchanged without exhausting local resources. In this context, cattle become socially and economically meaningful assets rather than primary food sources.
This also clarifies why the North Circle shows no signs of ritual elaboration. Fish traps are invisible when they work well. Their success is measured in output, not display. What mattered was reliability, not monumentality. The South Circle, by contrast, may well have acquired social significance over time—not because it was symbolic in origin, but because it became central to the site’s functioning.
Aggregation sites do not need to be permanently occupied to be socially powerful. In many ethnographic and archaeological examples, the opposite is true. Places that are visited seasonally, but reliably, acquire meaning precisely because they structure time, movement, and interaction. Durrington Walls fits this pattern far better than that of a permanent village.
The combined fish-and-cattle model also resolves the persistent question of scale. Why build such large earthworks and timber structures if they were not continuously inhabited? The answer is that scale reflects capacity, not population. Infrastructure is built to accommodate peak demand, not average use. The apparent over-engineering of the ditch, the maintenance-heavy nature of the Southern Circle, and the extensiveness of the enclosure all make sense once the site is understood as an aggregation and provisioning landscape.
This interpretation further undermines attempts to explain Durrington solely through ritual or cosmology. Ritual does not require such logistical redundancy. Symbolism does not demand maintenance cycles. Meaning does not require fish traps.
Provisioning does.
None of this denies the possibility that social or ceremonial activities occurred at Durrington Walls. On the contrary, they almost certainly did. But those activities were enabled by an infrastructure that worked first. The sequence matters. Food precedes feast; logistics precede ceremony.
By reframing Durrington as a provisioning hub rather than a symbolic centre, long-standing interpretive tensions dissolve. The absence of domestic architecture is no longer a problem. The scale of construction is no longer puzzling. The presence of multiple specialised structures becomes expected rather than anomalous.
The final issue to address is not whether this model fits the evidence—it does—but why it has been so persistently overlooked. That question speaks less to the site itself and more to the habits of the discipline that has studied it.
Durrington Walls Revisited
Woodhenge Reconsidered: Why a Real Timber Monument Was Built
Any serious reinterpretation of Durrington Walls must confront an uncomfortable but decisive fact: Woodhenge exists only metres away, and it behaves entirely differently. This proximity removes any excuse for misinterpretation. If archaeologists wish to argue that the Southern Circle and the North Circle are misunderstood timber monuments, they must also explain why Woodhenge—built in the same landscape, by the same culture, using the same materials—follows a completely different construction logic.
When the excavation evidence is read honestly, Woodhenge is exactly what orthodox archaeology claims it to be: a dry-land timber monument. Its post-holes are excavated, not driven. Bases are flat or scooped. Spacing is regular and concentric. Construction appears largely single-phase. There is no evidence of refitment, no extraction scars, and no requirement for continual maintenance. This is what architecture looks like when it is built on stable ground.
In other words, Woodhenge behaves precisely as a monument should.
This matters because it means cultural incompetence, technological limitations, or preservation bias cannot explain away the anomalous behaviour observed at the Southern Circle. The builders clearly understood how to construct dry-land timber structures when they wanted to. They did so successfully at Woodhenge.
The question, then, is not whether they could build a great house or ceremonial monument at Durrington.
It is why they chose not to – The answer lies in function.
Durrington Walls Revisited
Woodhenge occupies a slightly higher, drier position in the landscape, removed from the most unstable ground and from the immediate water interface. Its geometry is regular, enclosed, and inward-facing. It defines a space rather than guiding movement. Everything about it suggests a static, symbolic structure—a place designed to be stood within, observed, or marked, rather than worked.
By contrast, the Southern Circle is engineered for load, not enclosure. Its driven piles, pointed bases, extraction scars, and repeated refitment demonstrate adaptation to unstable ground and continual stress. It is outward-facing, practical, and structurally redundant. These are not symbolic choices; they are engineering responses.
The North Circle pushes this contrast even further. Where Woodhenge is concentric and enclosed, the North Circle is directional and open. Where Woodhenge emphasises symmetry, the North Circle emphasises flow. Where Woodhenge creates a place, the North Circle creates a process.
Seen together, the three structures form a deliberate functional triad:
Woodhenge: a true dry-land timber monument, static and symbolic
Southern Circle: a pile-supported working platform, load-bearing and maintained
North Circle: a net-assisted capture system, guiding movement in water
This arrangement is not accidental, nor is it contradictory. It reflects task differentiation within a single managed landscape.
Woodhenge demonstrates that symbolism had a place here—but not everywhere. Meaning was spatially segregated from function. Ritual did not need to sit on unstable ground. Infrastructure did not need to be monumental. Each structure was optimised for its role, not forced into a single interpretive category.
This observation alone dismantles the “timber monument everywhere” assumption that has distorted interpretations of Durrington Walls for decades. The presence of Woodhenge proves that the builders were capable of symbolic timber architecture. The absence of similar behaviour at the Southern and North Circles proves that those structures were intended for something else.
Woodhenge is not the key to explaining Durrington by analogy. It is the key to explaining why analogy fails.
Durrington Walls Revisited
Why the Site Is There: Woodhenge as Beacon, Durrington Walls as Harbour
Once the structures at Durrington Walls are understood functionally—rather than symbolically—the final and most important question can finally be adequately asked: why here? Not why these monuments look the way they do, but why this landscape was chosen in the first place.
The answer lies not in cosmology, ritual abstraction, or seasonal feasting alone, but in navigation, visibility, and access.
The relationship between Woodhenge and Durrington Walls has been consistently mischaracterised as a symbolic pairing. In reality, it is a functional pairing—beacon and harbour, signal and destination.
Woodhenge as a Beacon, Not a Gathering Place
Woodhenge occupies a slightly elevated, dry position in the landscape, visible across the surrounding floodplain. Its regular concentric structure, excavated post-holes, and lack of maintenance scars indicate a static, dry-land monument rather than a working platform. This alone sets it apart from the Southern Circle at Durrington.
But crucially, Woodhenge also occupies the wrong position to be economically useful in provisioning, capture, or water management. It does not sit at a hydrological interface. It does not control movement. It does not support load. It does not guide flow.
What it does do exceptionally well is stand.
When the post heights implied by the excavated sockets are reconstructed, Woodhenge becomes a tall vertical structure in an otherwise low-relief landscape. In a flooded or waterlogged plain, such verticality is not ornamental—it is navigational. A timber ring supporting a raised superstructure, fire platform, or beacon would have been visible from a considerable distance across open water or marsh.
This places Woodhenge firmly within a known class of prehistoric structures: fire beacons and navigation markers, used to attract, guide, and signal to approaching vessels. Such beacons are not inventions of historic or classical societies. They are a logical response wherever waterborne movement dominates, and shorelines are unstable or indistinct.
Woodhenge does not need to be interpreted as exclusively ritual to fulfil this role. A beacon is both practical and symbolic. Fire marks presence. Height marks authority. Visibility marks safety.
Durrington Walls as Harbour and Trading Point
If Woodhenge is the signal, Durrington Walls is the destination.
The scale, layout, and infrastructure of Durrington Walls are entirely consistent with a harbour complex rather than a village. The broad flat-bottomed ditch functions as a controlled basin. The Southern Circle provides a pile-supported platform for unloading, staging, and redistribution. The North Circle captures and concentrates aquatic resources. Linear channels manage movement internally.
This is what harbours look like before stone quays and masonry piers.
In a Mesolithic or early Holocene environment dominated by water transport, harbours do not require monumental stonework. They require predictable access, controlled grounding, and reliable provisioning. Durrington provides all three.
The presence of long-distance cattle movement reinforces this interpretation. Harbours are exchange points. They are where inland routes meet water routes. They are where goods arrive, are processed, redistributed, and moved on. Cattle arriving from hundreds of kilometres away do not converge on ritual centres by accident. They converge on logistical hubs.
Durrington Walls occupies precisely such a node: accessible from the Avon system, provisioned by fish capture, stabilised by platforms, and signalled by a visible beacon.
Dual-Purpose Monuments and Excarnation
This civilisation did not separate function and meaning. It layered them.
The same structures that guided ships and provisioned people could also serve mortuary functions. Elevated timber platforms—especially those associated with fire and visibility—are ideal for excarnation. This practice is well attested ethnographically, including the Silent Towers of India, where bodies are exposed on raised structures for defleshing by birds.
Woodhenge’s elevated, open timber form is well suited to such use. Fire, height, and exposure are not contradictions; they are complementary. A beacon can signal to the living while serving the dead. A harbour can receive goods and bodies alike. In water-based cultures, the boundary between journey, trade, and afterlife is often deliberately thin.
This dual-purpose logic explains why these structures were invested with care but not rebuilt endlessly. Their power lay in continuity, not replacement.
Durrington Walls Revisited
Conclusion: A Coastal Logic Inland
Woodhenge and Durrington Walls together form a system that only looks strange if interpreted through dry-land assumptions.
Seen through the lens of navigation and water management, the logic is simple:
Woodhenge marks the place
Durrington Walls services the place
Water connects the place
This is not a ritual landscape with accidental practicality. It is a maritime landscape with embedded meaning.
The site exists where it does because it had to.
Podcast
Author’s Biography
Robert John Langdon, a polymathic luminary, emerges as a writer, historian, and eminent specialist in LiDAR Landscape Archaeology.
His intellectual voyage has interwoven with stints as an astute scrutineer for governmental realms and grand corporate bastions, a tapestry spanning British Telecommunications, Cable and Wireless, British Gas, and the esteemed University of London.
A decade hence, Robert’s transition into retirement unfurled a chapter of insatiable curiosity. This phase saw him immerse himself in Politics, Archaeology, Philosophy, and the enigmatic realm of Quantum Mechanics. His academic odyssey traversed the venerable corridors of knowledge hubs such as the Museum of London, University College London, Birkbeck College, The City Literature Institute, and Chichester University.
In the symphony of his life, Robert is a custodian of three progeny and a pair of cherished grandchildren. His sanctuary lies ensconced in the embrace of West Wales, where he inhabits an isolated cottage, its windows framing a vista of the boundless sea – a retreat from the scrutinous gaze of the Her Majesty’s Revenue and Customs, an amiable clandestinity in the lap of nature’s embrace.
Exploring Prehistoric Britain: A Journey Through Time
My blog delves into the fascinating mysteries of prehistoric Britain, challenging conventional narratives and offering fresh perspectives based on cutting-edge research, particularly using LiDAR technology. I invite you to explore some key areas of my research. For example, the Wansdyke, often cited as a defensive structure, is re-examined in light of new evidence. I’ve presented my findings in my blog post Wansdyke: A British Frontier Wall – ‘Debunked’, and aWansdyke LiDAR Flyover video further visualizes my conclusions.
For those interested in British Prehistory, visit www.prehistoric-britain.co.uk, a comprehensive resource featuring an extensive collection of archaeology articles, modern LiDAR investigations, and groundbreaking research. The site also includes insights and extracts from the acclaimed Robert John Langdon Trilogy, a series of books exploring Britain during the Prehistoric period. Titles in the trilogy include The Stonehenge Enigma, Dawn of the Lost Civilisation, and The Post Glacial Flooding Hypothesis, offering compelling evidence about ancient landscapes shaped by post-glacial flooding.
To further explore these topics, Robert John Langdon has developed a dedicated YouTube channel featuring over 100 video documentaries and investigations that complement the trilogy. Notable discoveries and studies showcased on the channel include 13 Things that Don’t Make Sense in History and the revelation of Silbury Avenue – The Lost Stone Avenue, a rediscovered prehistoric feature at Avebury, Wiltshire.
In addition to his main works, Langdon has released a series of shorter, accessible publications, ideal for readers delving into specific topics. These include:
For active discussions and updates on the trilogy’s findings and recent LiDAR investigations, join our vibrant community on Facebook. Engage with like-minded enthusiasts by leaving a message or contributing to debates in our Facebook Group.
Whether through the books, the website, or interactive videos, we aim to provide a deeper understanding of Britain’s fascinating prehistoric past. We encourage you to explore these resources and uncover the mysteries of ancient landscapes through the lens of modern archaeology.
For more information, including chapter extracts and related publications, visit the Robert John Langdon Author Page. Dive into works such as The Stonehenge Enigma or Dawn of the Lost Civilisation, and explore cutting-edge theories that challenge traditional historical narratives.
At the outset, the clay-with-flints, a vestige of ancient weathering and erosion, stands as a testament to the relentless forces of nature that sculpted the landscape. Born from the remnants of Palaeogene sediments and the dissolution of chalk, these deposits serve as silent witnesses to the Pleistocene’s cold embrace. Their presence on the hilltop flats signifies a chronological anchor, predating the rhythmic succession of river terraces that stitch the valley’s quilt. (The Mesolithic River Avon)
As one descends the slopes, a mosaic of older head deposits unfolds, their genesis tied to the ancient processes of solifluction and solution. These sediments, bound to the clay-with-flint, narrate a tale of gradual descent and transformation, shaping the valley’s upper reaches with a subtle, yet profound, hand.
Further down the valley, the narrative evolves with the introduction of head gravel, gravelly head, and head deposits. These characters in the valley’s story are borne of fluvial transport, hill wash, hill creep, and solifluction—agents of change that have, over millennia, contributed to the valley’s sculptural form. The river terraces, numbering fourteen, ascend like steps from the valley floor, each a plateau from which to view the passage of time. The highest terraces, perched up to 100 meters above the valley, offer a broad vista extending 12 kilometers across, while the lower terraces, more intimate in their proximity to the present-day river, mark the recent chapters of geological history.
The consistency of thickness across these terraces speaks to a dynamic equilibrium of erosion and deposition, influenced by sediment overloading and tributary contributions. This interplay suggests a complex narrative of landscape evolution, one not solely dictated by the simplistic rhythm of Marine Isotope Stage cycles but enriched by a multifaceted process of lateral erosion and sediment redeposition.
Amidst this discussion of terraces and quaternary deposits, the narrative briefly diverges to contemplate the pre-Quaternary geology, where terraces from the River Avon linger in the Hampshire basin, their ages enshrouded in mystery. The challenges of dating these terraces, and by extension, understanding the full scope of the valley’s geological history, are underscored by recent findings that question traditional dating methods. Such inquiries not only deepen the mystery but also invite a reevaluation of our understanding of the Earth’s past.
Thus, we are reminded that the study of the Avon valley’s quaternary deposits is not merely an academic exercise but a profound exploration of the human quest for knowledge and understanding. It is a journey that connects us to the very essence of the natural world, revealing the intricate interplay of forces that have shaped not only the valley but also the broader tapestry of Earth’s geological history. (The Mesolithic River Avon)
The intriguing findings presented in the diagrams regarding Optically Stimulated Luminescence (OSL) dating within the Avon valley unearth a complex narrative of sediment deposition and geological processes that challenges traditional understandings. The OSL results, as depicted in Figure 5, illuminate the temporal relationship between terrace formations and Marine Isotope Stages (MIS), while Figure 6, based on a three-dimensional model constructed from borehole data, offers a visual cross-section of the valley’s superficial geology.
The OSL ages for terraces T10 through T7, indicating deposition during or before MIS10/9, including the Last Glacial Maximum (LGM), suggest a timeline that not only aligns with but also refines previously established chronological frameworks. This refinement has significant implications for interpreting the archaeological record associated with Terrace T7 and recalibrating regional uplift and incision rates, which are crucial for understanding landscape evolution over geological timescales.
However, the apparent inconsistencies in the OSL dating results, particularly the dating of Terrace T7 before Terrace T10 and the identification of a Loess Terrace laid during the LGM, introduce a paradox into the sedimentary record. These anomalies challenge the linear progression implied by the terrace hypothesis that has guided interpretations of the valley’s geological history.
The highest terrace, T10, positioned at 102 meters above ordnance datum (OD) as illustrated in Figure 6, spans an unexpectedly broad temporal range of over 200,000 years, according to OSL dating. This finding disrupts the presumed chronological order, especially when juxtaposed with the dating of Terrace T7 at 58 meters OD, which, perplexingly, predates T10. Additionally, the Loess Terrace, situated at 77 meters OD and undifferentiated in the terrace sequence, laid down during the LGM, along with Terrace T4, which harbors the youngest dates, further complicates the scenario.
These results hint at a more intricate story of terrace formation and sediment deposition than previously thought. The seeming randomness and inconsistencies in the dating challenge the traditional terrace hypothesis and suggest that other factors, perhaps related to climatic variations, tectonic activities, or both, played significant roles in shaping the valley’s geomorphology.
The evidence points to a dynamic and possibly non-linear process of terrace formation, where episodes of sediment deposition were influenced by a combination of environmental conditions, rather than a simple chronological succession. This complexity underscores the need for a reassessment of the methods and models used to date and interpret terrace formations, advocating for a more nuanced understanding of the interplay between geological processes and climate change over the Pleistocene.
Thus, while the OSL dating provides valuable insights into the timing of terrace deposition, it also raises critical questions about the reliability of traditional chronological frameworks and the factors driving landscape evolution in the Avon valley. These findings invite further investigation and a reevaluation of existing hypotheses, highlighting the ongoing dialogue between past and present in the quest to decipher Earth’s geological history.
The authors’ observations highlight significant discrepancies and anomalies in the OSL dates that raise questions about the method’s reliability in certain contexts, particularly when compared to other dating methods like radiocarbon dating. These discrepancies are not merely academic curiosities; they fundamentally challenge our understanding of the temporal and environmental context in which these sediment layers were deposited.
The attempt to explain the notable discrepancy in the age estimates of Terrace T4 across different locations within the Avon valley suggests that sediment reworking due to recent fluvial processes or the presence of compound terraces exhibiting different depositional behaviors might be responsible. This acknowledgment of variability within the depositional environment underscores the dynamic nature of fluvial landscapes and the complexity of accurately dating such contexts.
The variability in OSL dates for samples taken at the same soil level (e.g., GL14039, GL14041, GL14038, GL14040) further complicates the narrative. The presence of nearly contemporaneous dates within error limits, juxtaposed with the significantly different sedimentation rates observed just below the topsoil, suggests that the depositional history of the Avon valley is more nuanced than previously understood. These findings indicate that relying solely on visual stratigraphy for dating purposes can lead to inaccuracies, reinforcing the need for a multi-methodological approach to construct a reliable chronological framework.
The comparison between OSL and radiocarbon dating, as discussed in the Gaigalas (2000) study, exemplifies the potential for significant age discrepancies between different dating methods. The observation that OSL dates can be substantially older than their radiocarbon counterparts highlights the need for caution and cross-validation when interpreting chronological data, especially in contexts where sediment exposure and reworking may have occurred.
The discussion of Holocene river flooding and its impact on the dating of river terraces introduces an additional layer of complexity. Flooding events can lead to the deposition of silt and other materials that obscure the original depositional sequence, potentially leading to out-of-sequence terrace dates. This phenomenon complicates attempts to use uplift modeling or the Palaeolithic record as reliable chronological markers, as evidenced by the discrepancies in age estimates for Terrace T7.
The passage concludes by emphasizing the potential of terrace deposits to provide a valuable chronological framework, albeit one that must be approached with caution. By integrating chronometric age control with detailed modeling of deposit height and thickness, researchers can gain a more nuanced understanding of the Avon valley’s landscape evolution. This approach not only enhances our interpretations of past hominin landscape use but also improves the predictive modeling of Palaeolithic sites. The challenges and discrepancies encountered in OSL dating underscore the importance of adopting a holistic and critically engaged approach to understanding the geological past, one that acknowledges the inherent complexities and uncertainties of dating dynamic fluvial landscapes.
Macklin, as we have now seen in this section has identified over one hundred Holocene river floods, twelve of which lasted hundreds of years, that would have contributed to this lack of alluvium or colluvium at Stonehenge Bottom. Moreover, the sources of the rivers that lay this sediment over the centuries of water flow, rely on massive precipitation entering the rivers, cutting through rocks and valleys making them flow at extreme levels which create this erosion and consequential sediment. However, the source of Palaeochannel water are natural springs found locally underground and therefore would not contain the same alluvium levels as active flowing rivers – resolving this dilemma.
Model of the number of flooded rivers in Britain – River Avon
UPDATE
More Empirical Evidence of Post-Glacial Flooding and a Flooded Stonehenge
Prehistoric Levels and Widths for the River Avon
Take a close look at this illustration. It is not speculation, it is empirical science — mapped and measured river terraces from the Avon Valley, published in Egberts (2016), Pleistocene terrace formation and the Quaternary evolution of the Hampshire Basin, Bournemouth University.
What are we looking at?
These are the terrace steps cut by the River Avon over multiple glacial–interglacial cycles.
Each “T-level” marks a former stable floodplain where the river held its height for centuries, often millennia.
The heights are measured in metres OD (Ordnance Datum) and tied to known quarry and pit sites (e.g. Hatchet Gate Farm, Woodgreen, Somerley, Ashley).
How much bigger was the Avon?
Today, the river meanders with a width of just ~50 m near Salisbury.
At its maximum (T11), the Avon floodplain stretched ~12 km across.
That is ~240 times wider than the river today.
What does this mean for Stonehenge?
Phase 1 of Stonehenge (Car Park Postholes) sits on T9 (~90 m OD).
Phase 2 (ditch, Aubrey Holes, bluestones) cuts into T8 (~75 m OD).
The terraces show that the palaeochannel not only flooded up to the old car park, but at times overtopped the entire Stonehenge site.
Why this matters:
Terraces are not theory — they are empirical geomorphological evidence.
They prove that the Avon has flooded to multiple levels, sometimes far higher than the monument itself.
This is not about “if” water could reach those heights — the terraces prove it already has, repeatedly, over many Ice Age cycles.
So when critics dismiss the role of high water tables or argue “the site couldn’t have been wet,” they are ignoring the most basic geological record in front of us. The terraces are the diary of the river — written in gravel, chalk, and silt — showing that water rose and fell, over and over again.
The real question is not if Stonehenge was surrounded by water. It is when, and how many times it happened during its long prehistory.
For active discussions on the findings of the TRILOGY and recent LiDAR investigations that are published on our WEBSITE, you can join our and leave a message or join the debate on our Facebook Group.


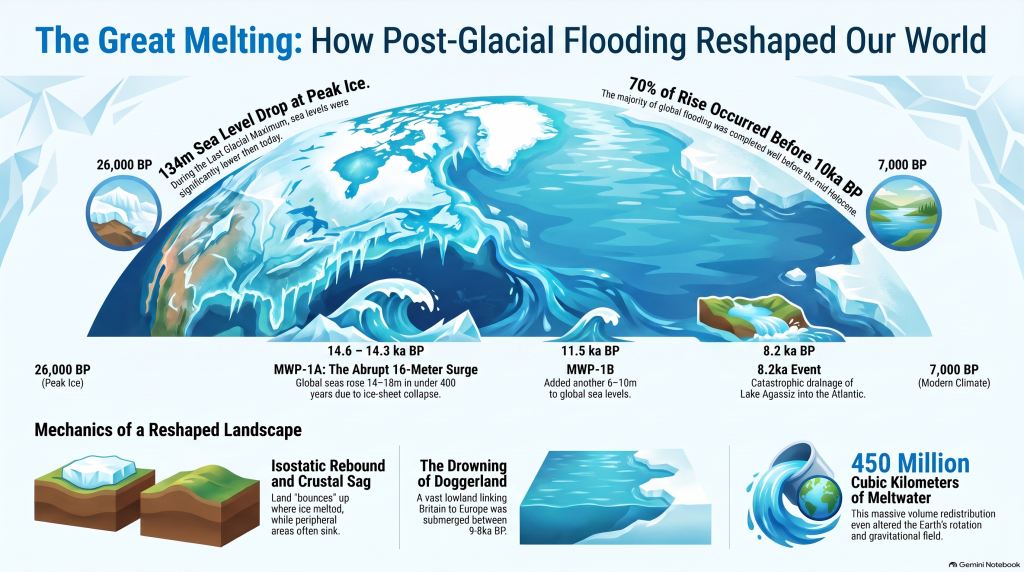
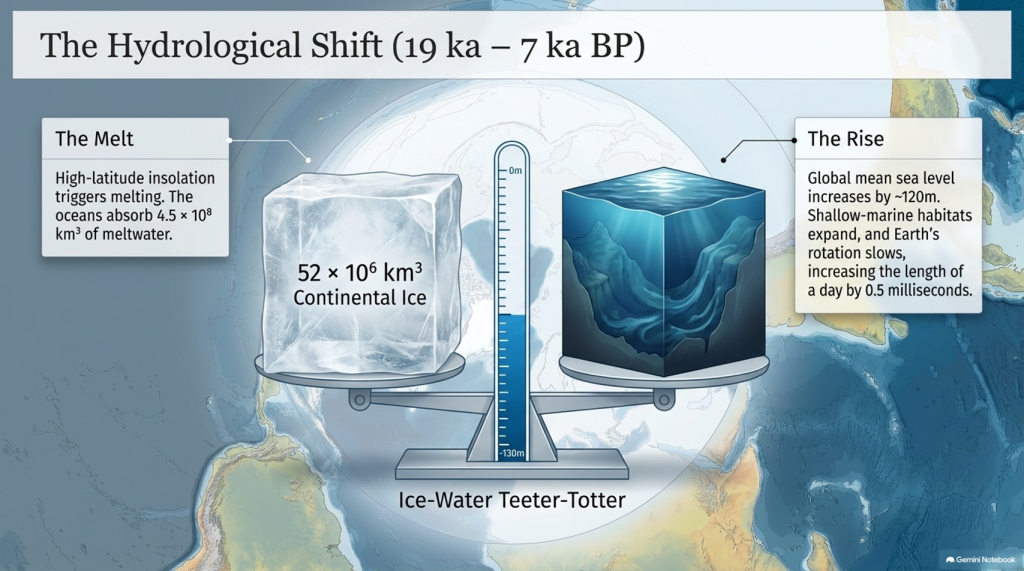
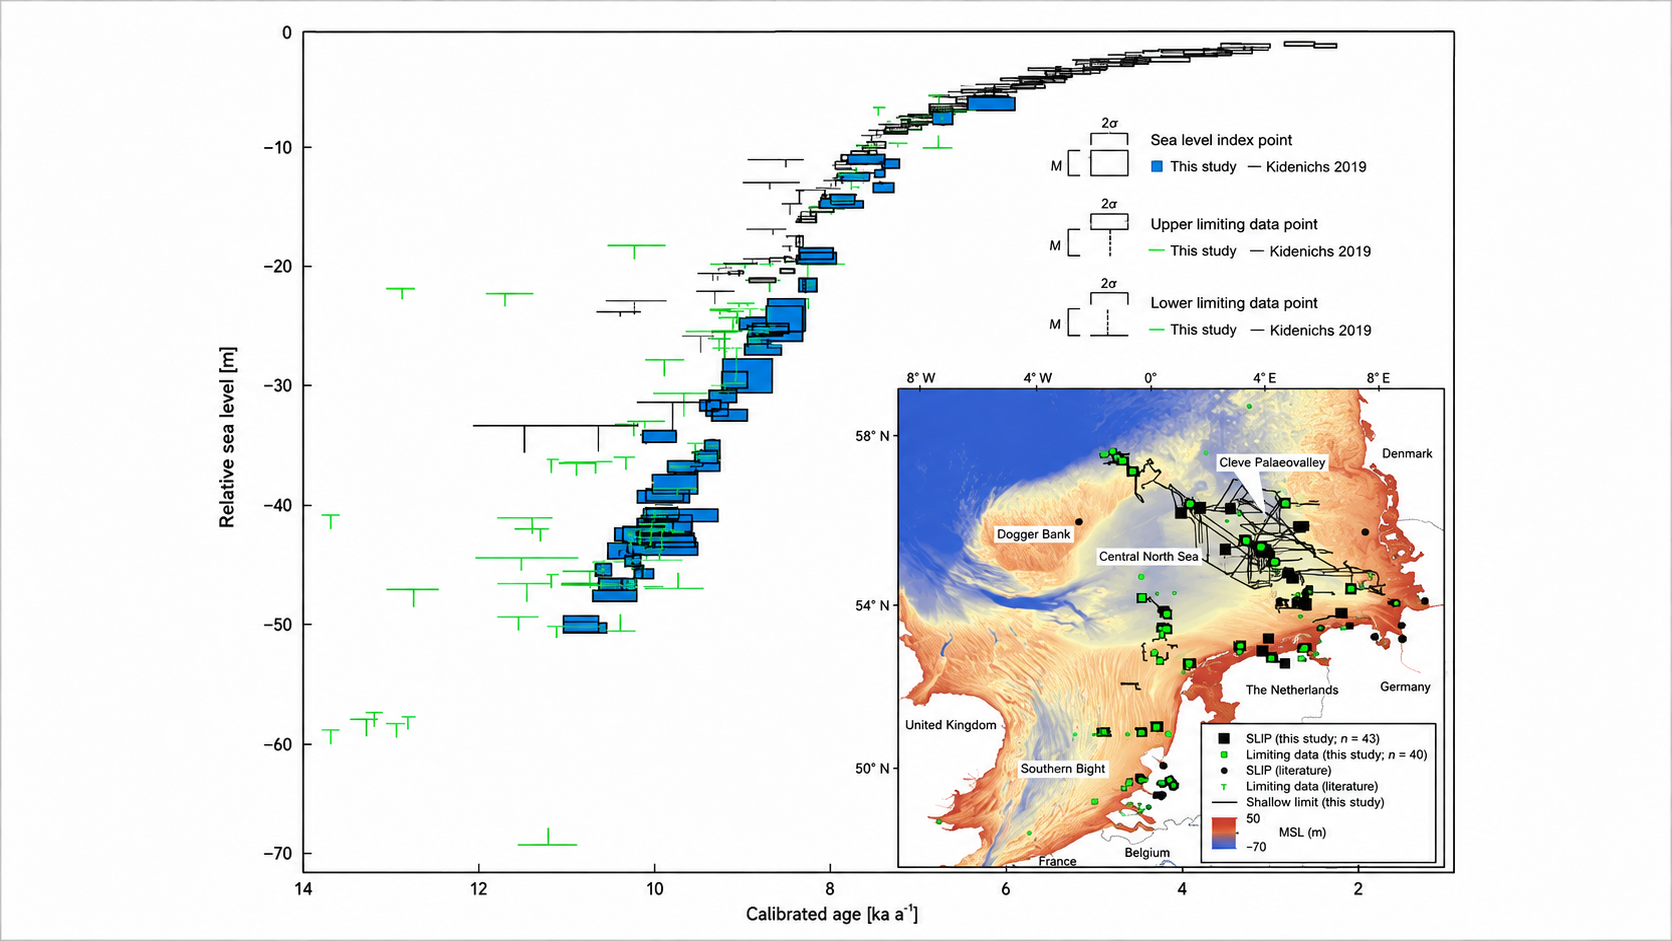
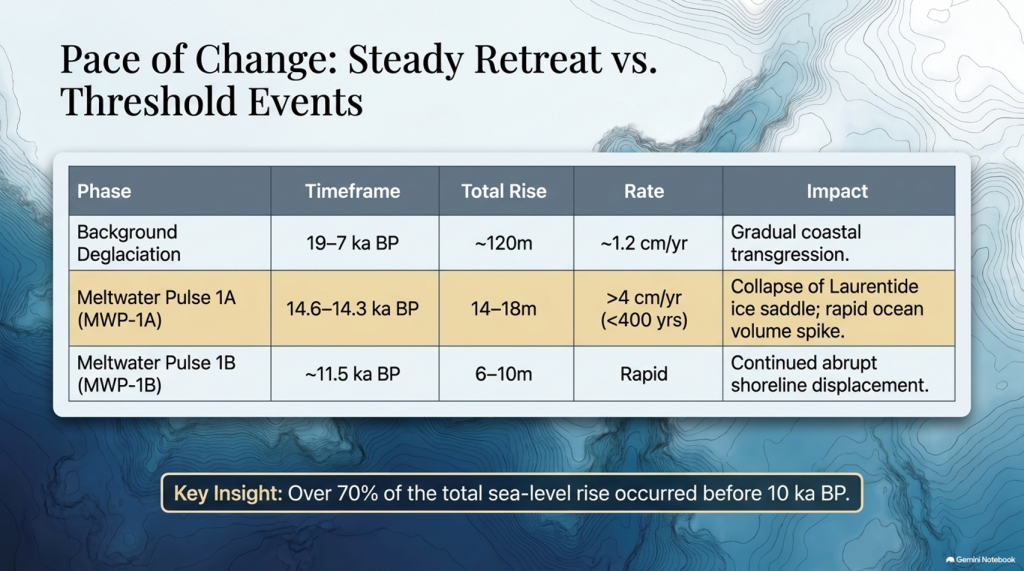
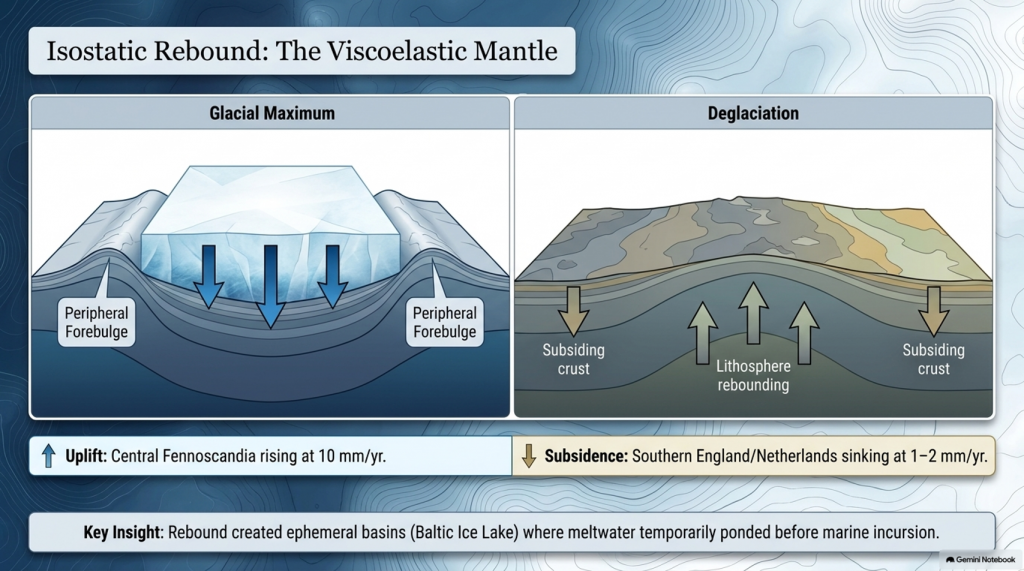
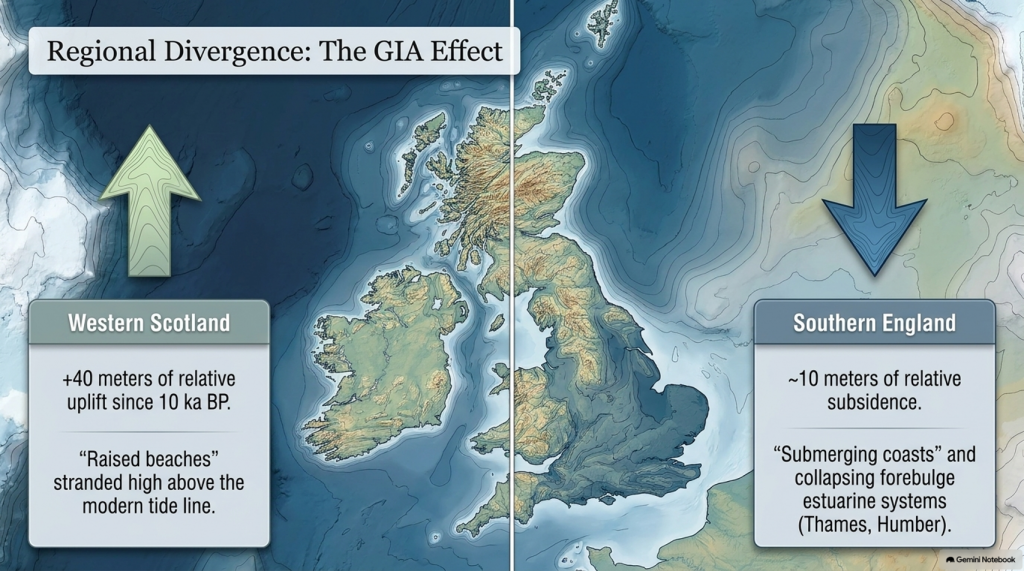
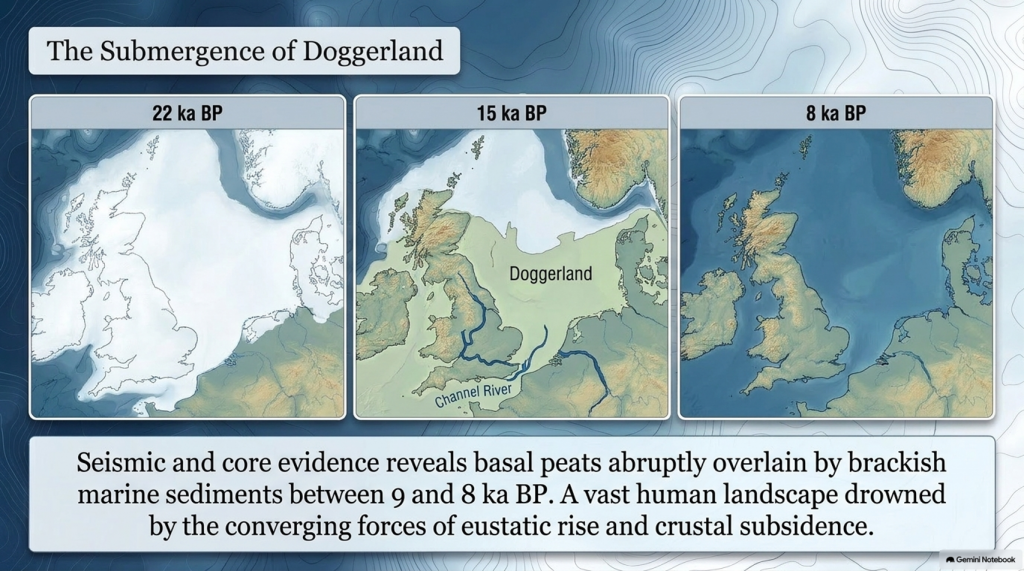
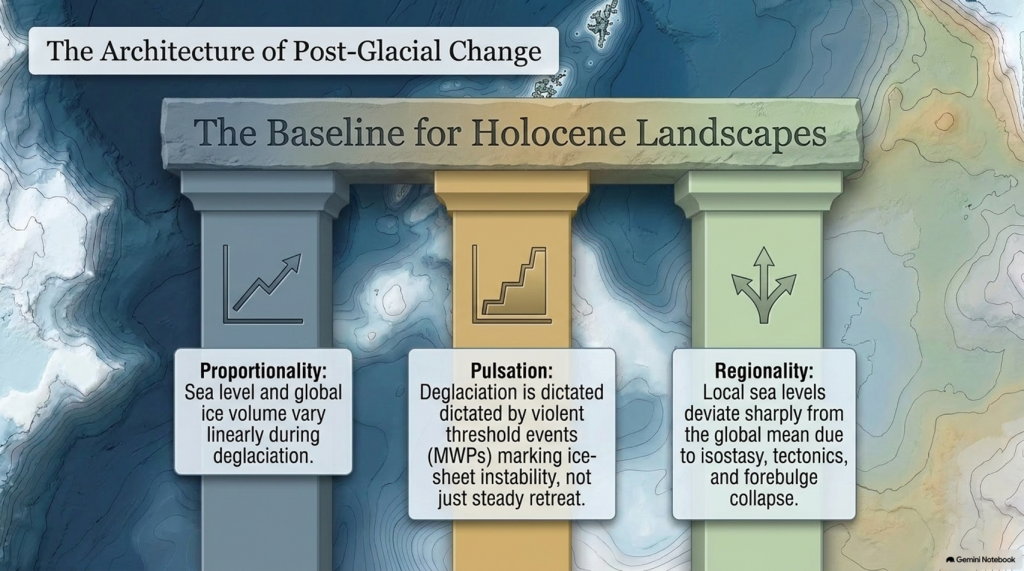
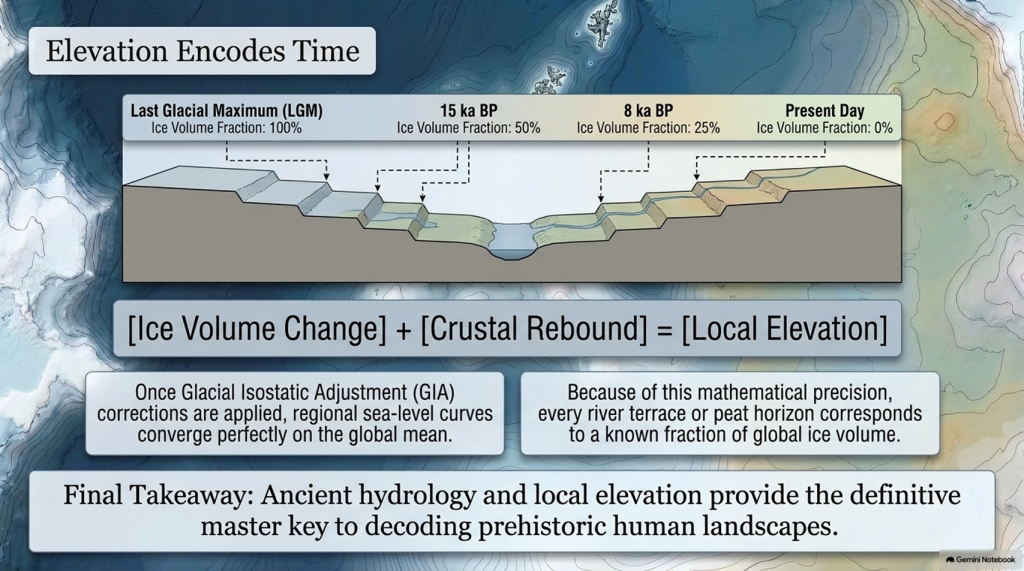
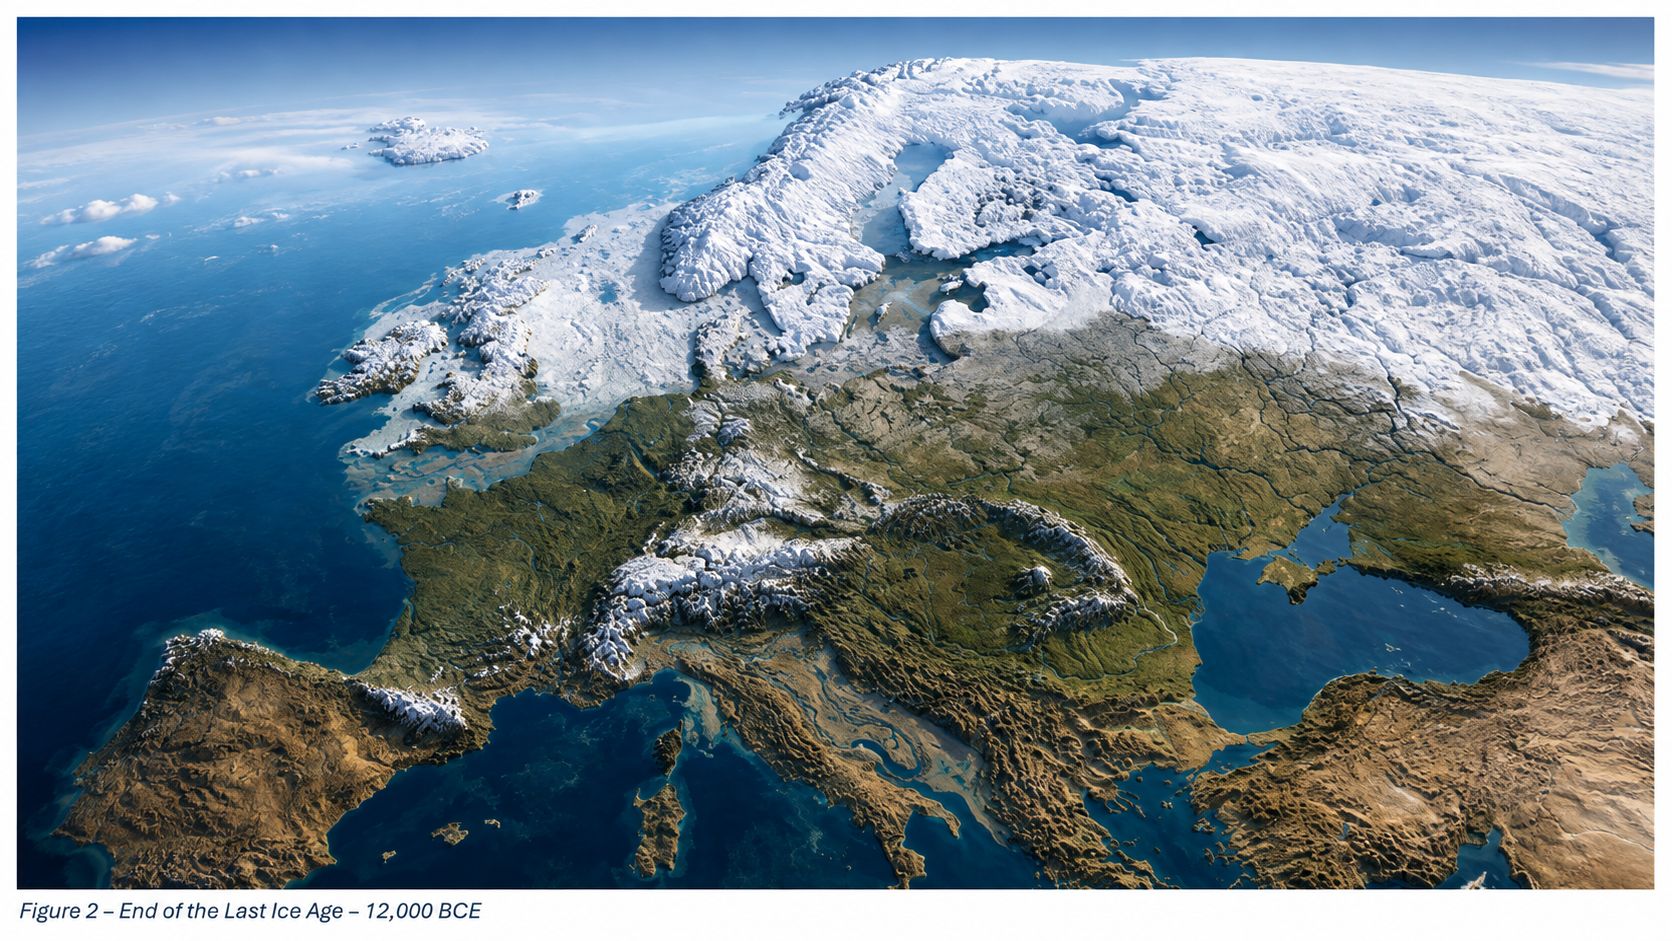


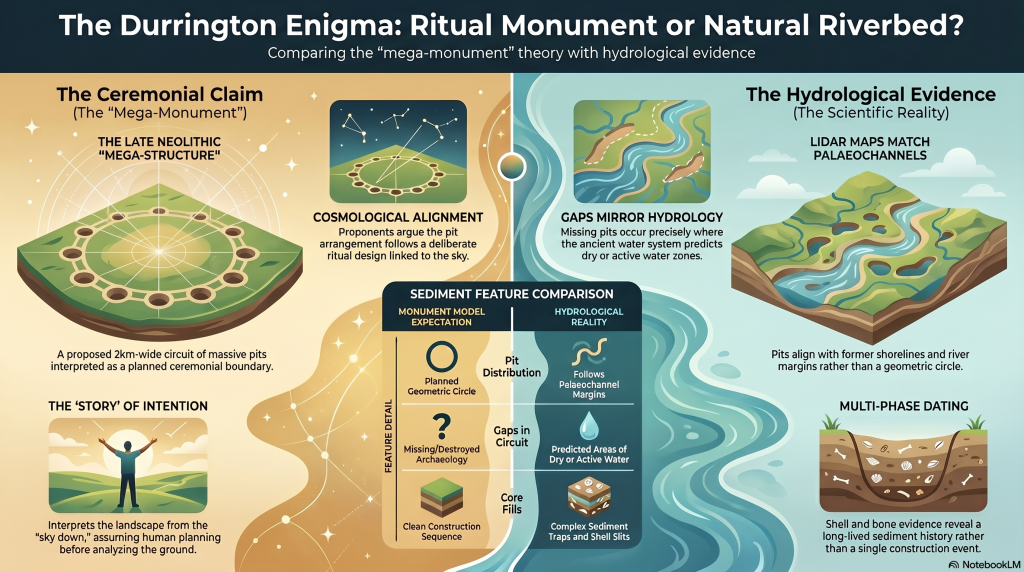
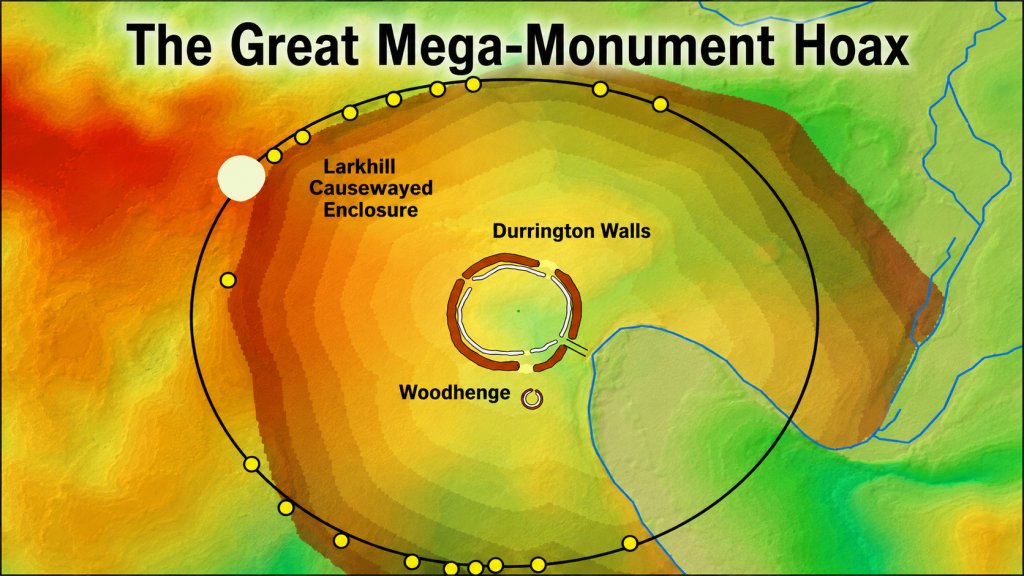
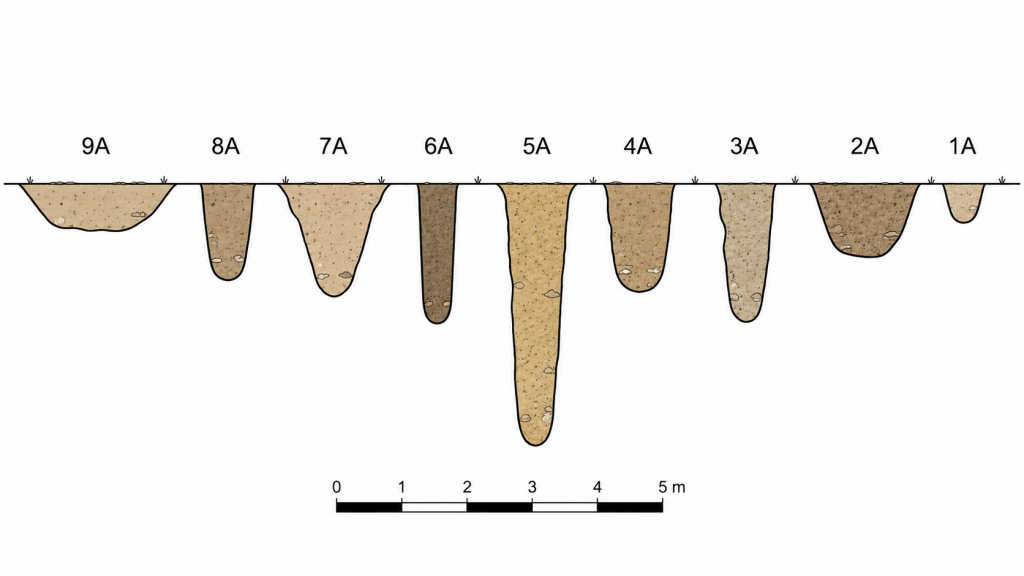
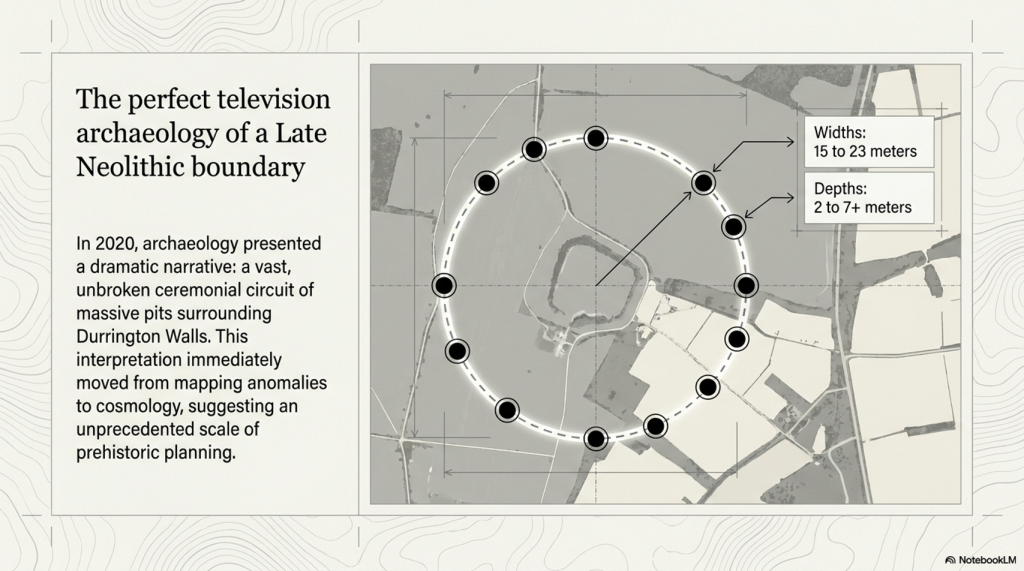
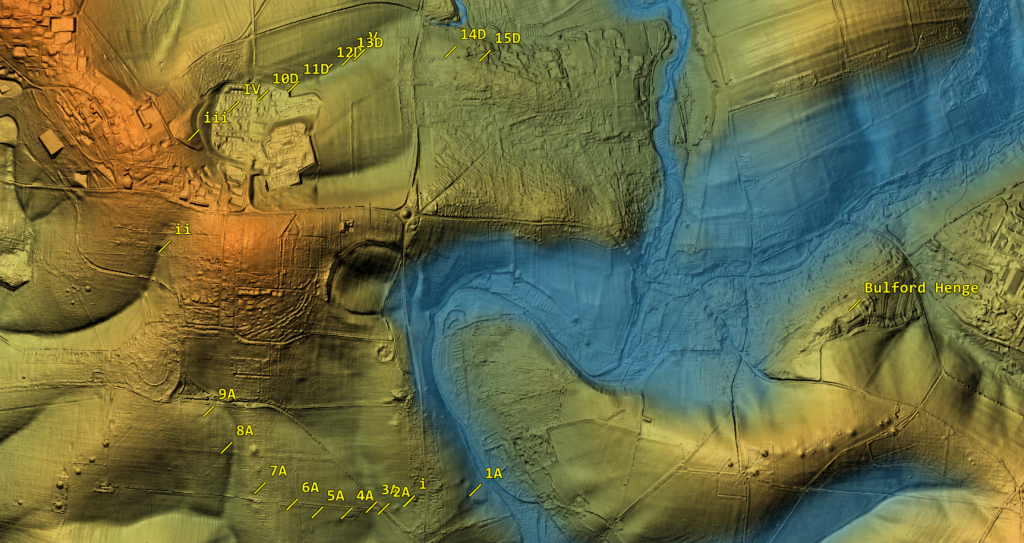
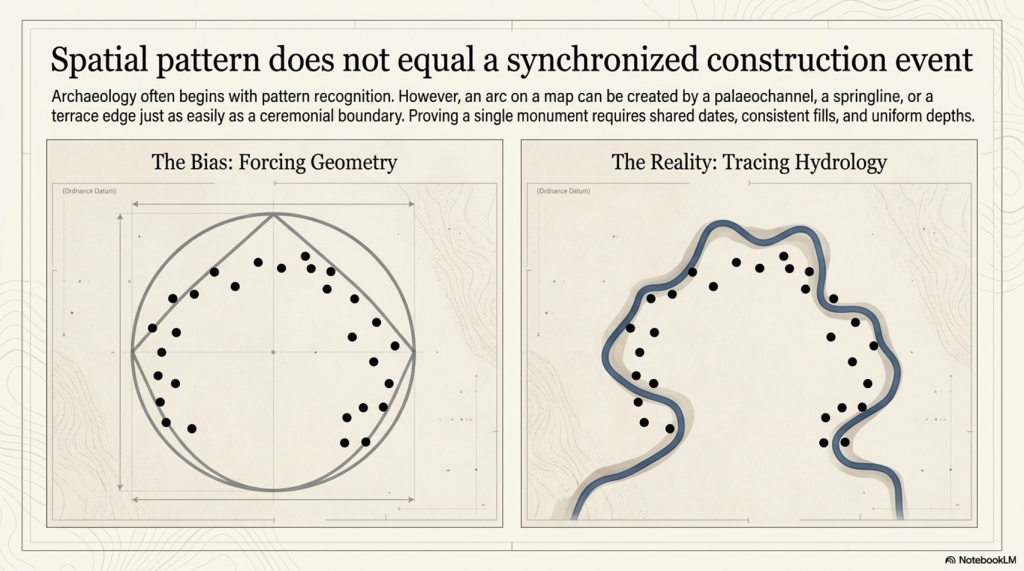
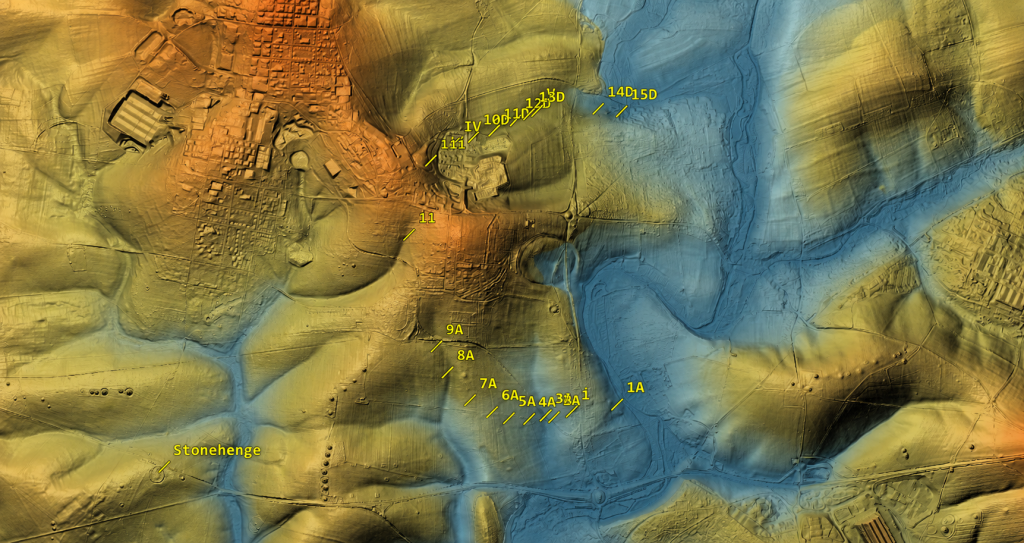
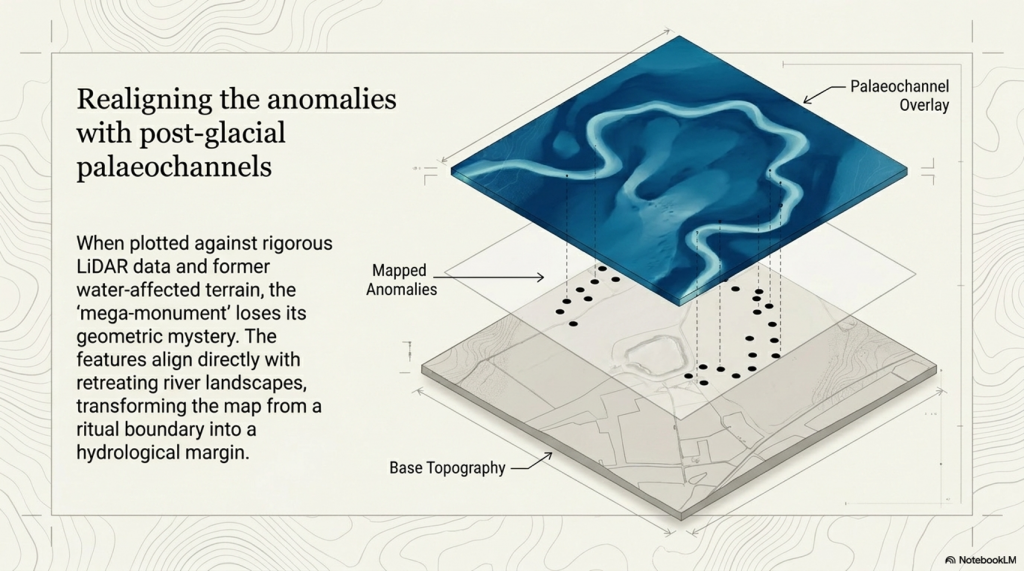
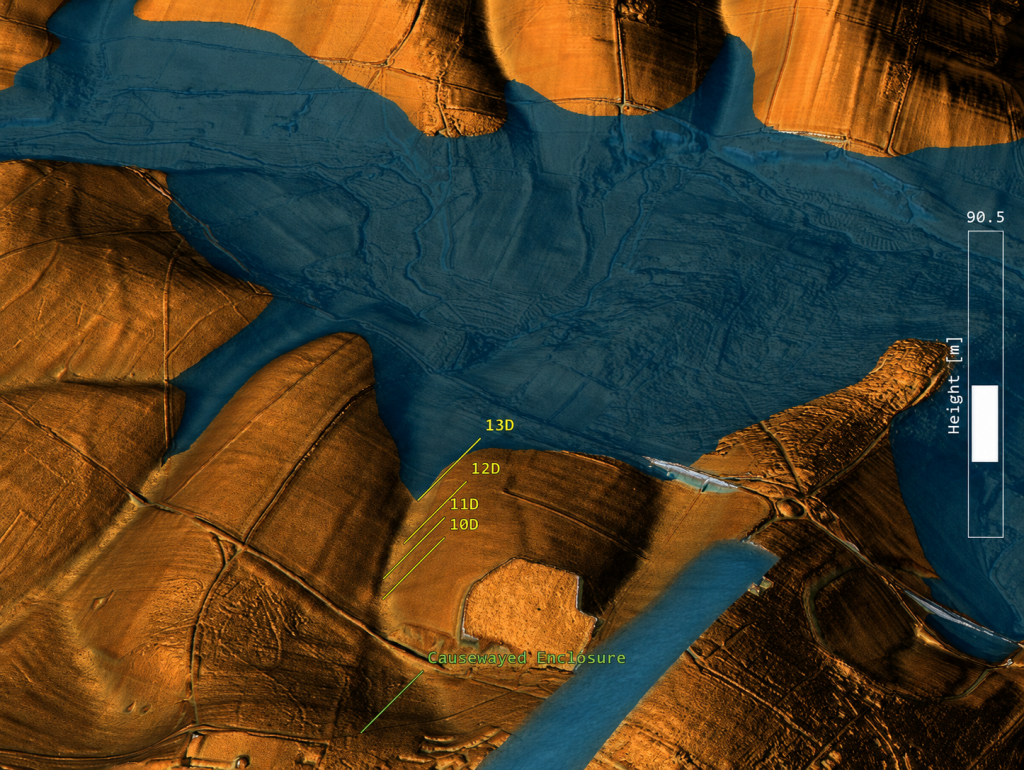
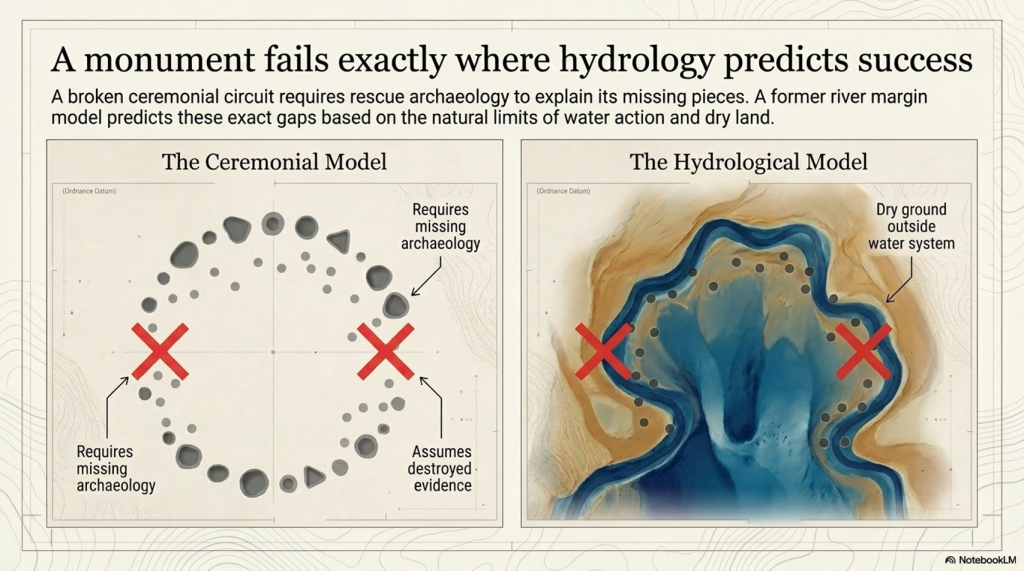
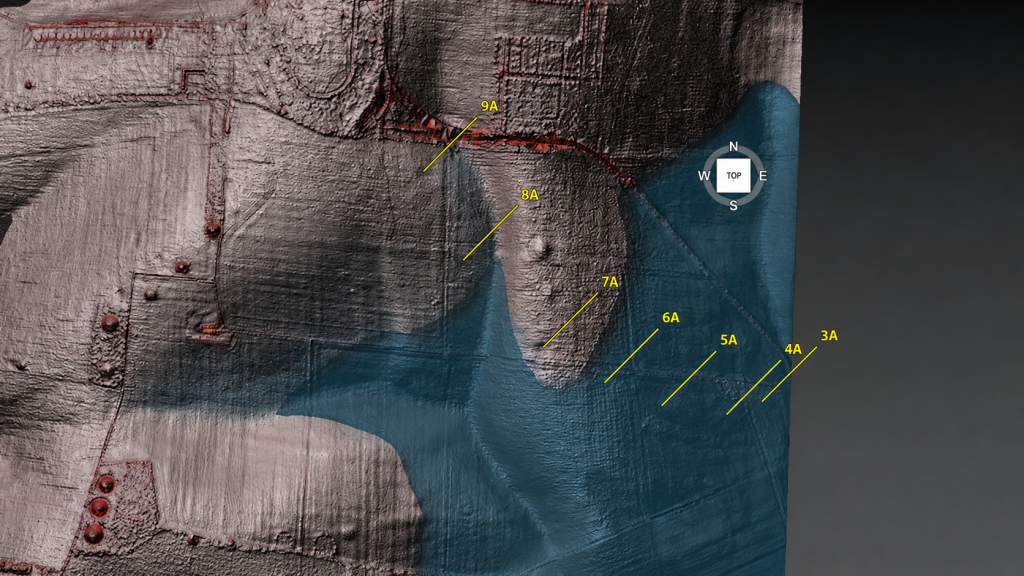
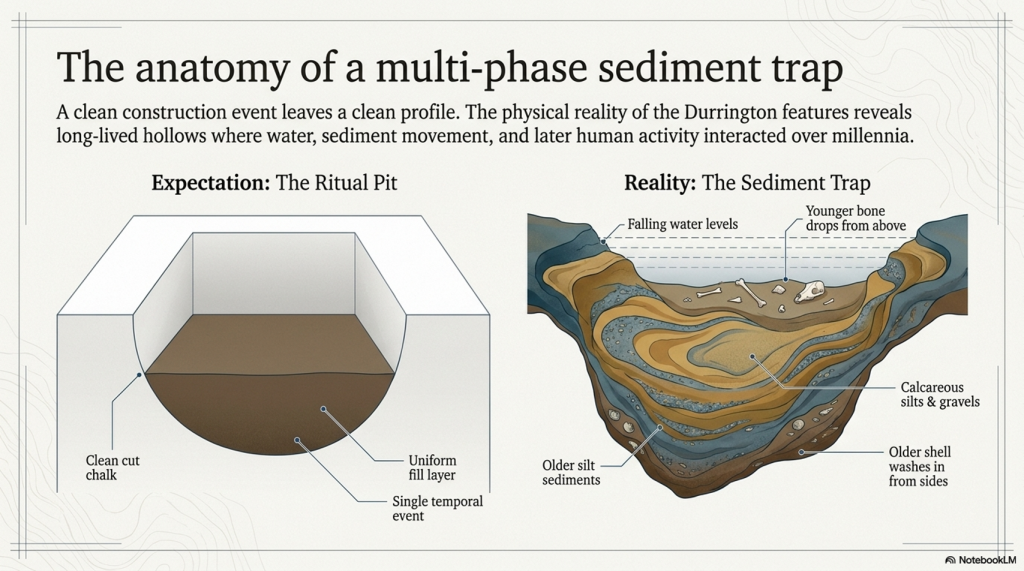
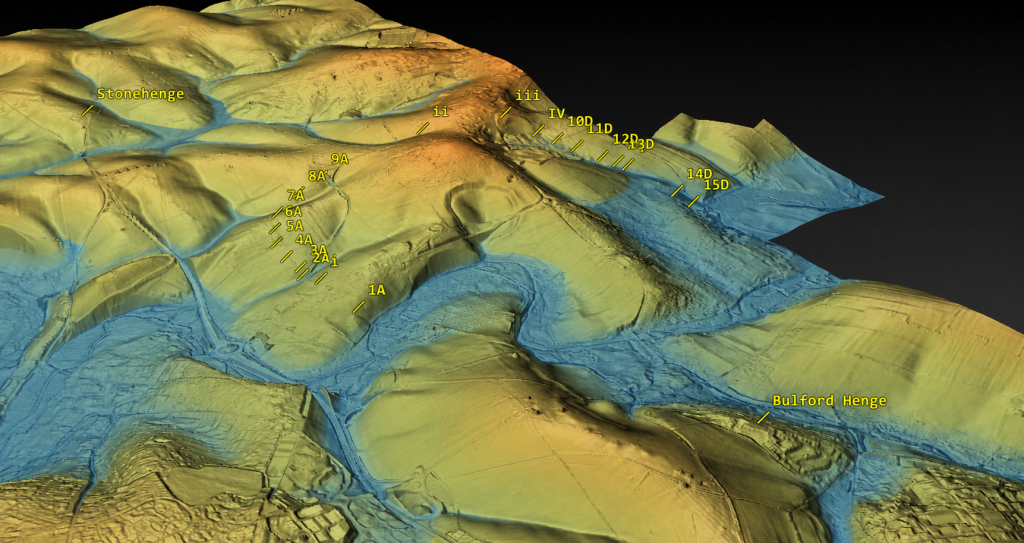
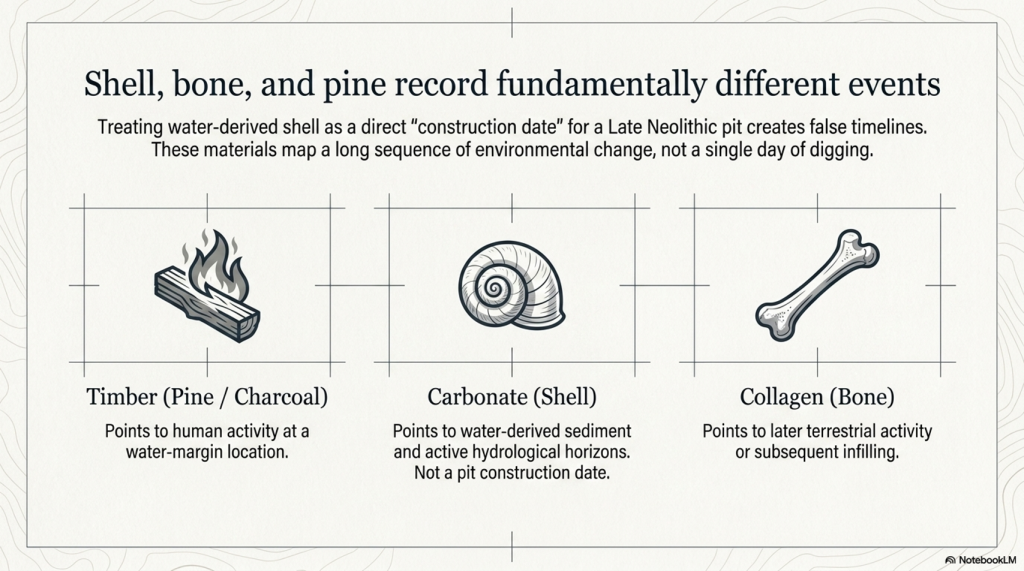
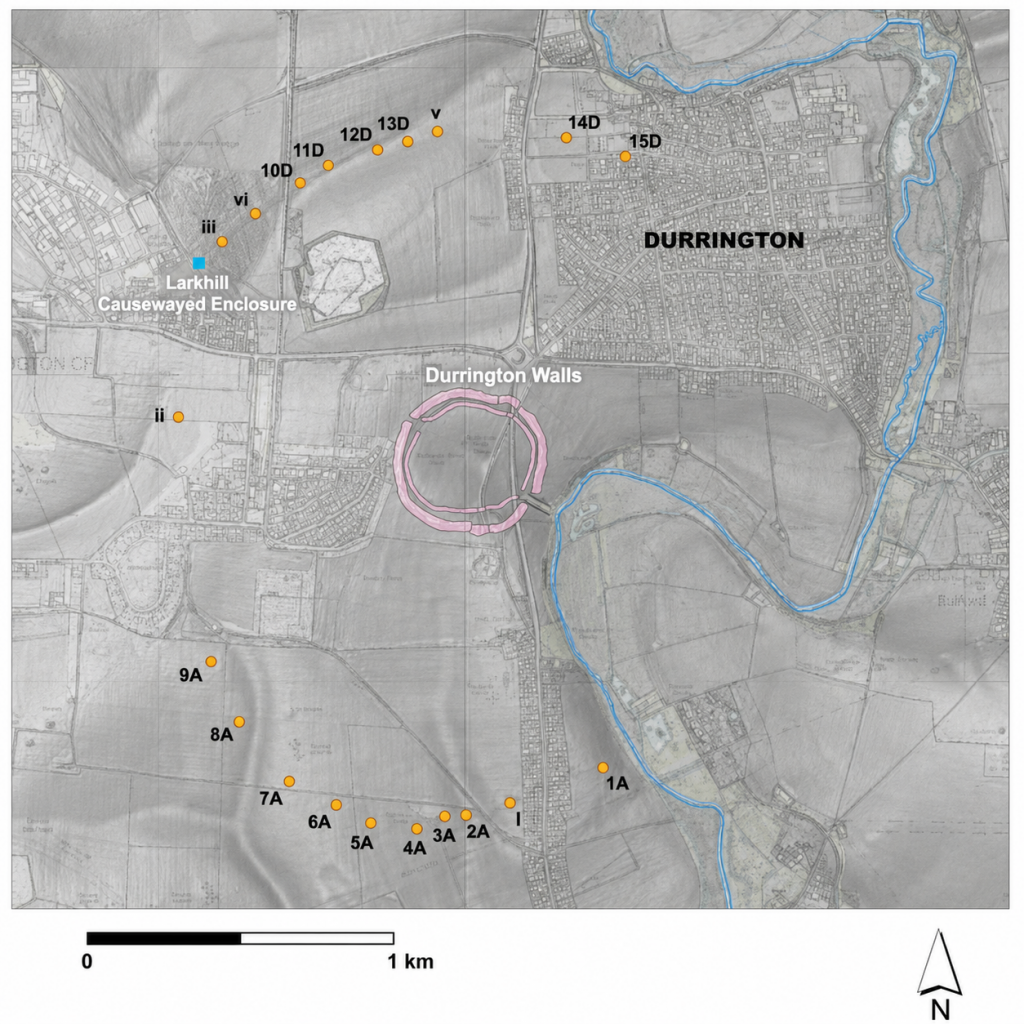
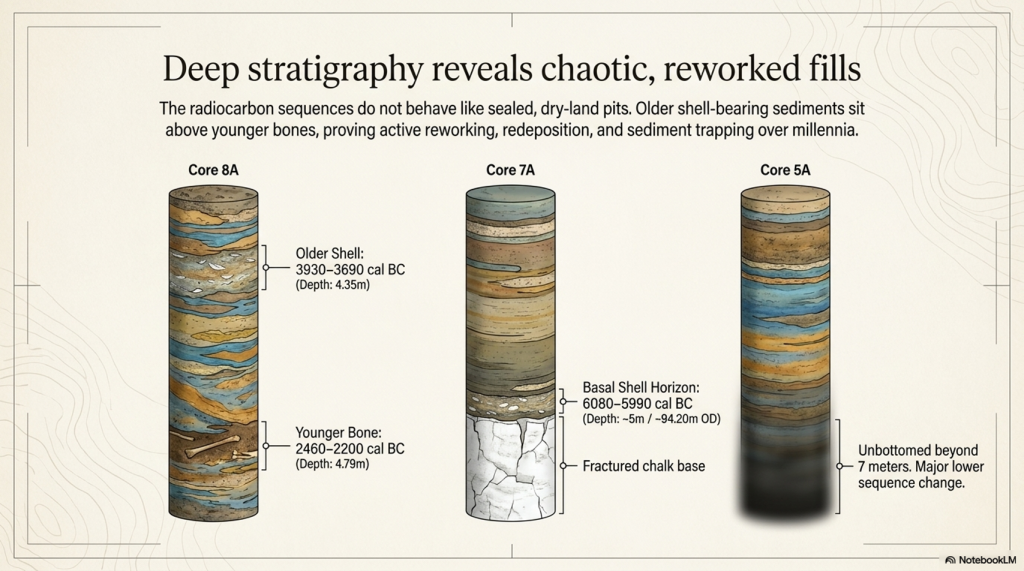
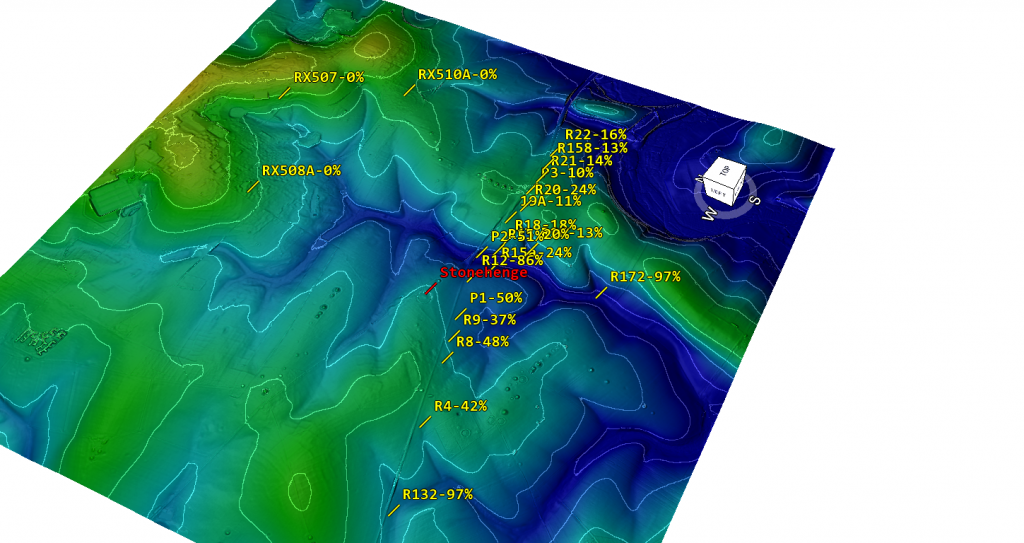
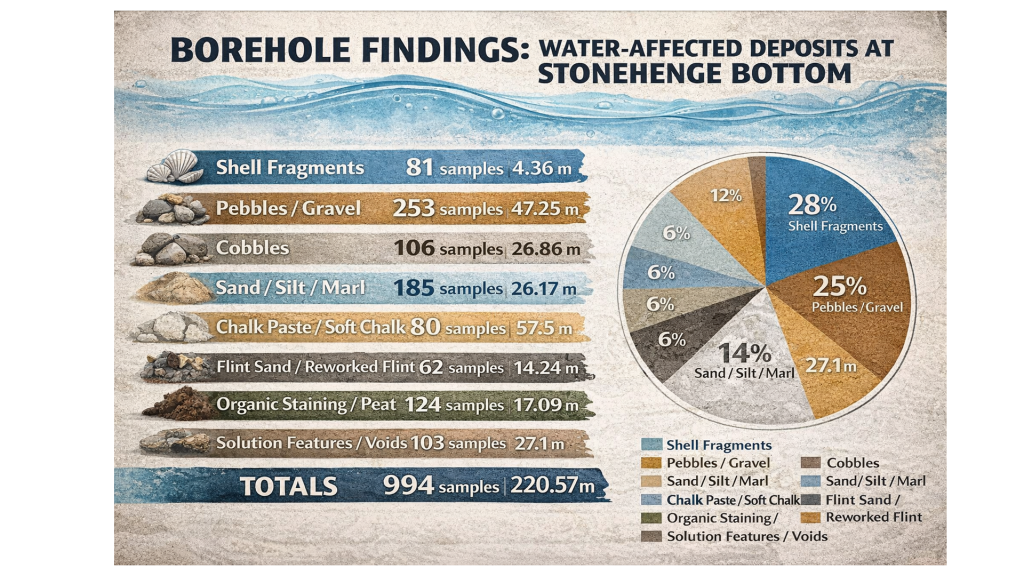
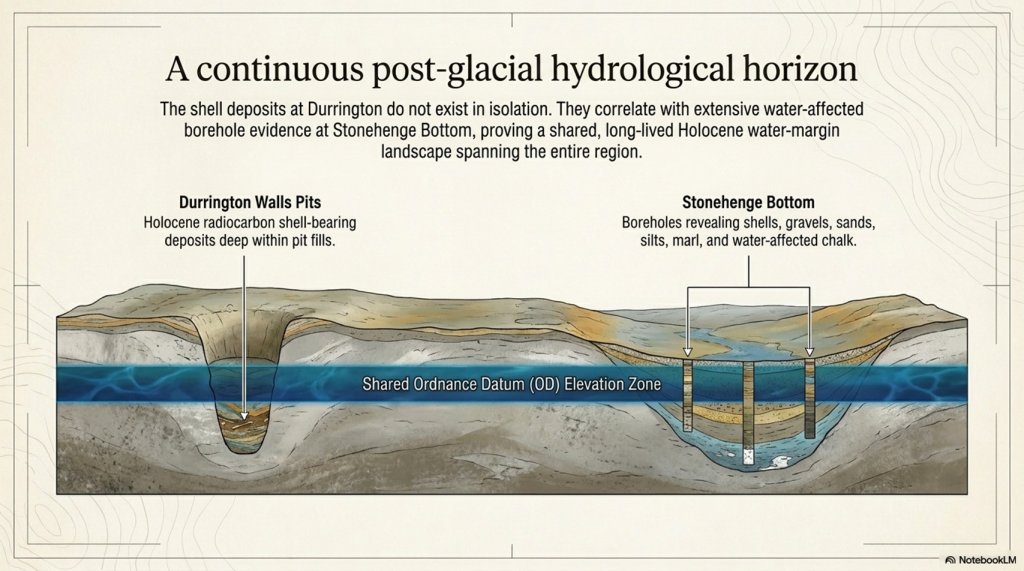
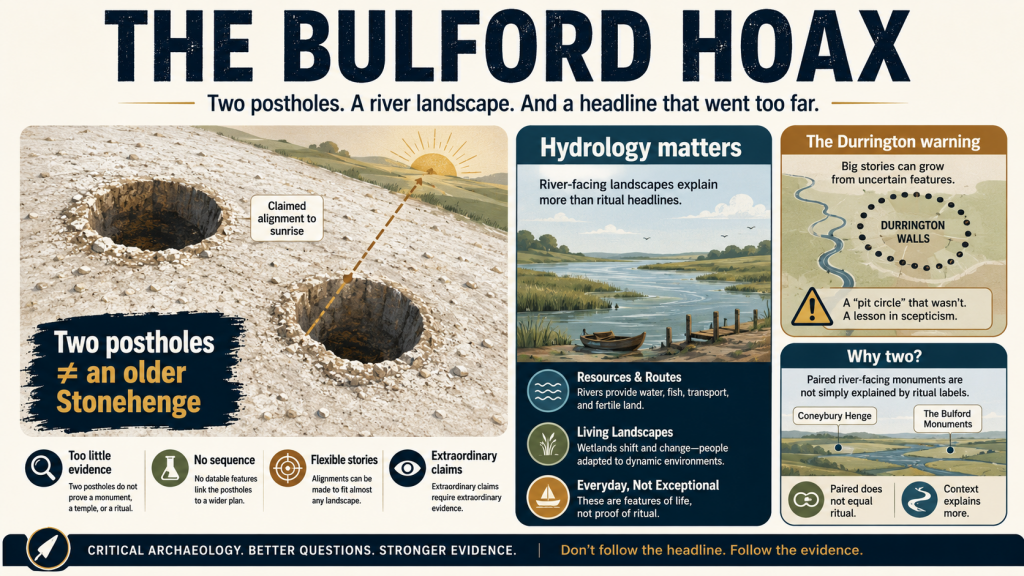
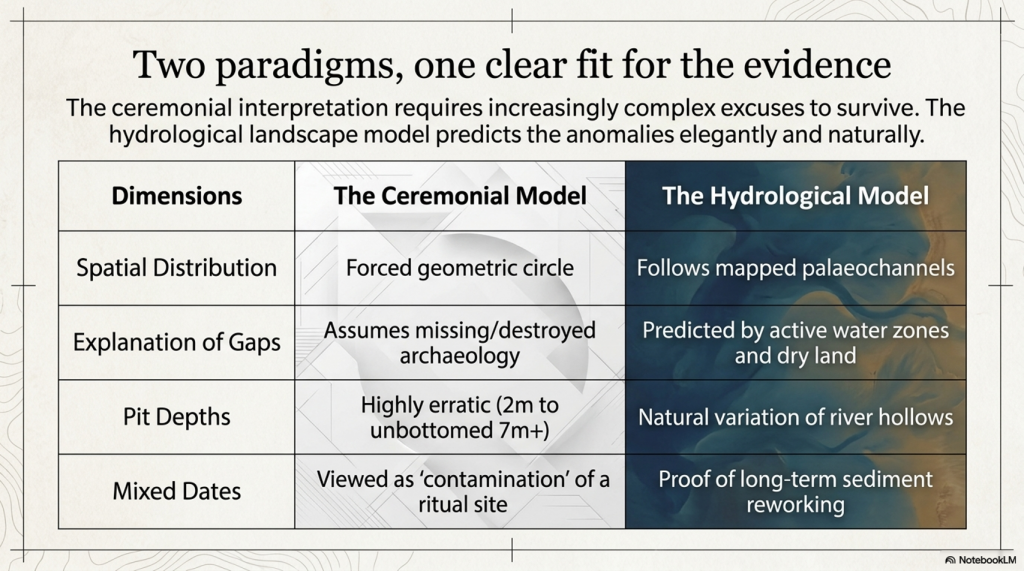
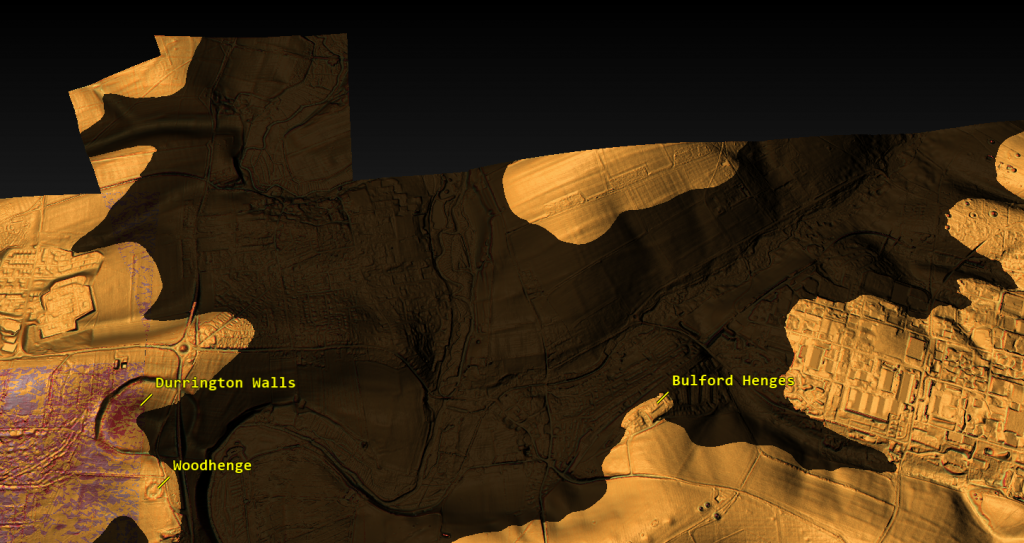
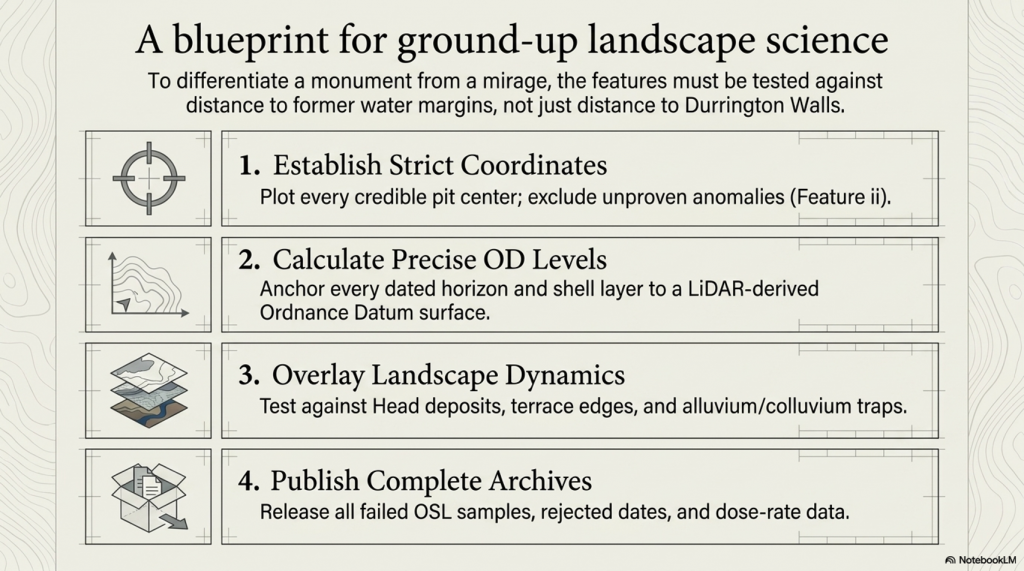
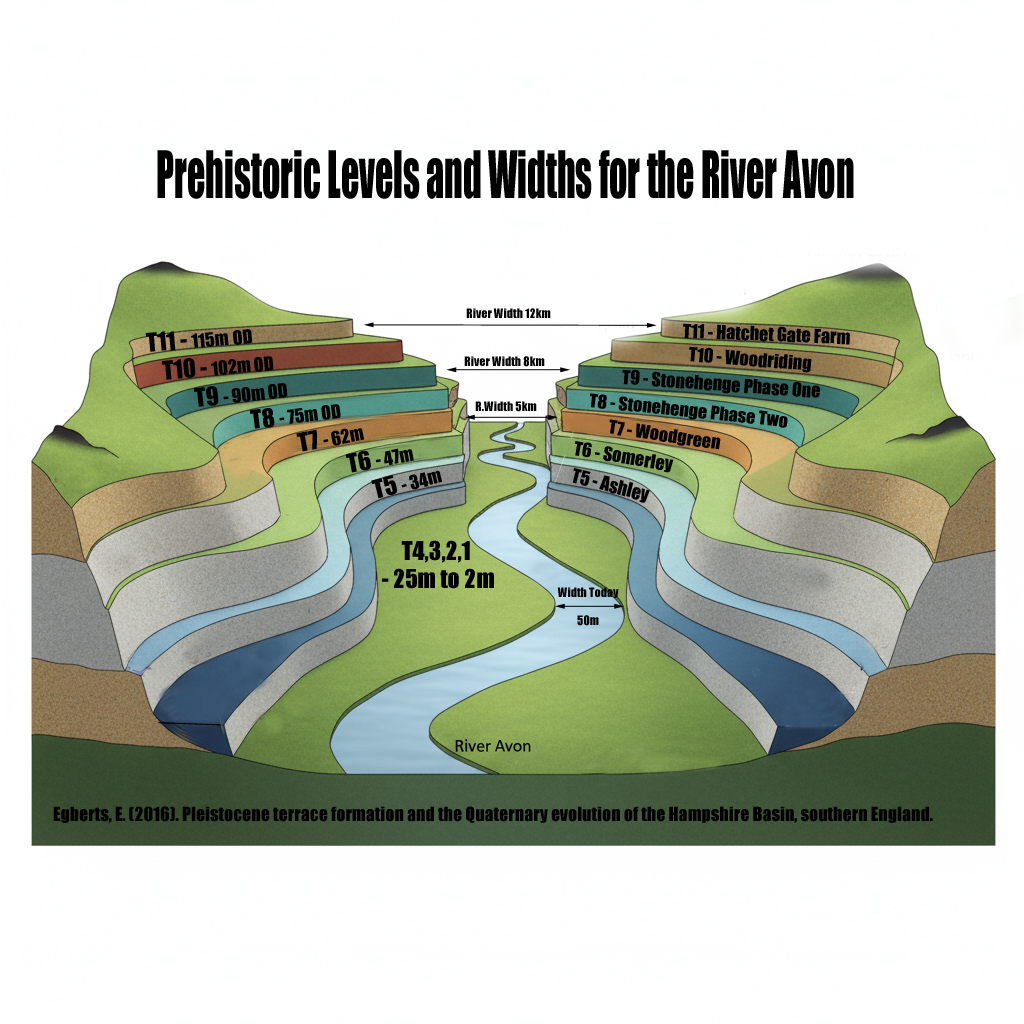
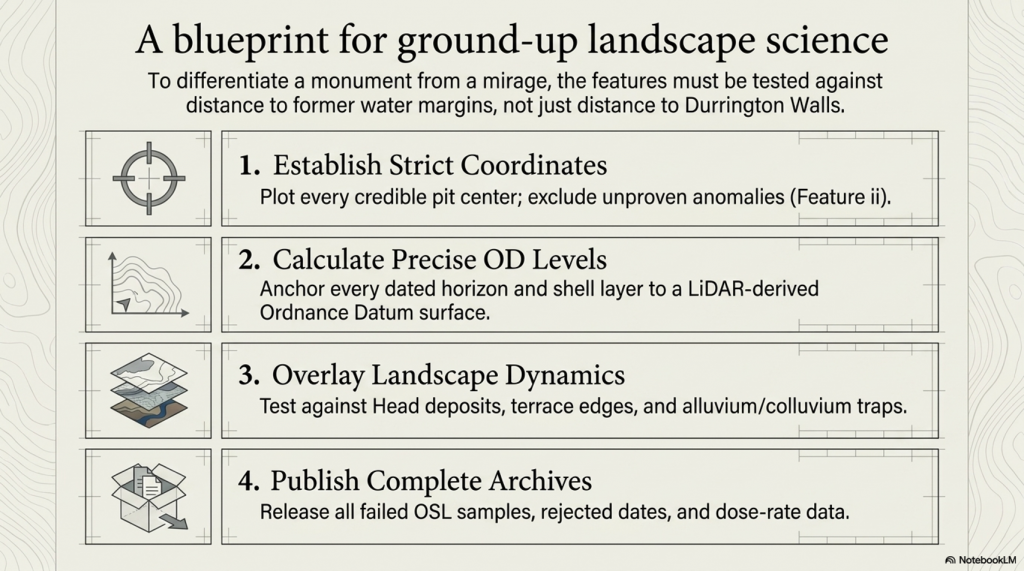
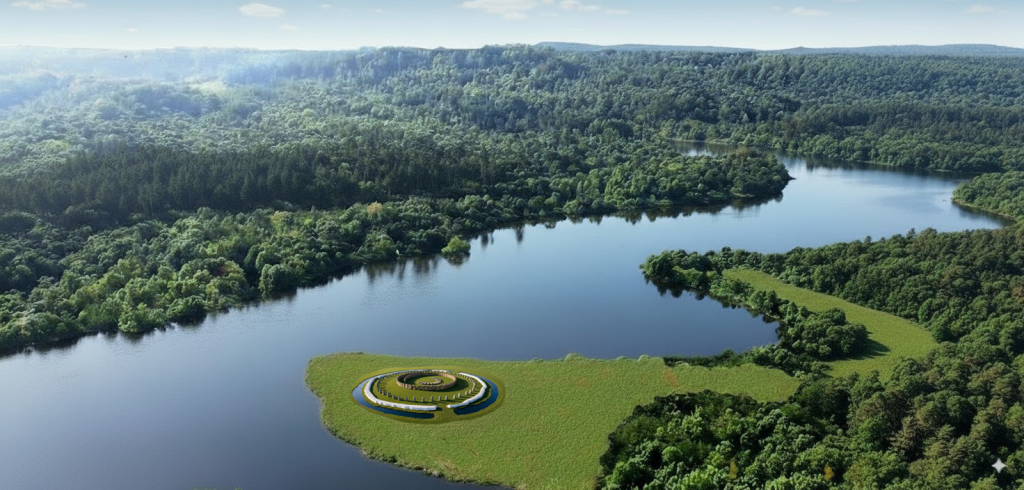
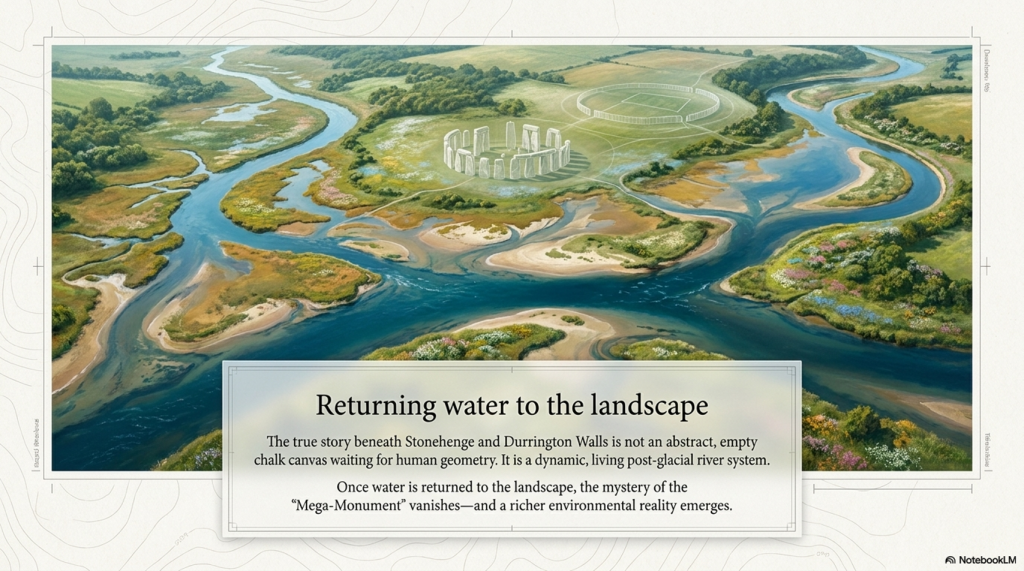
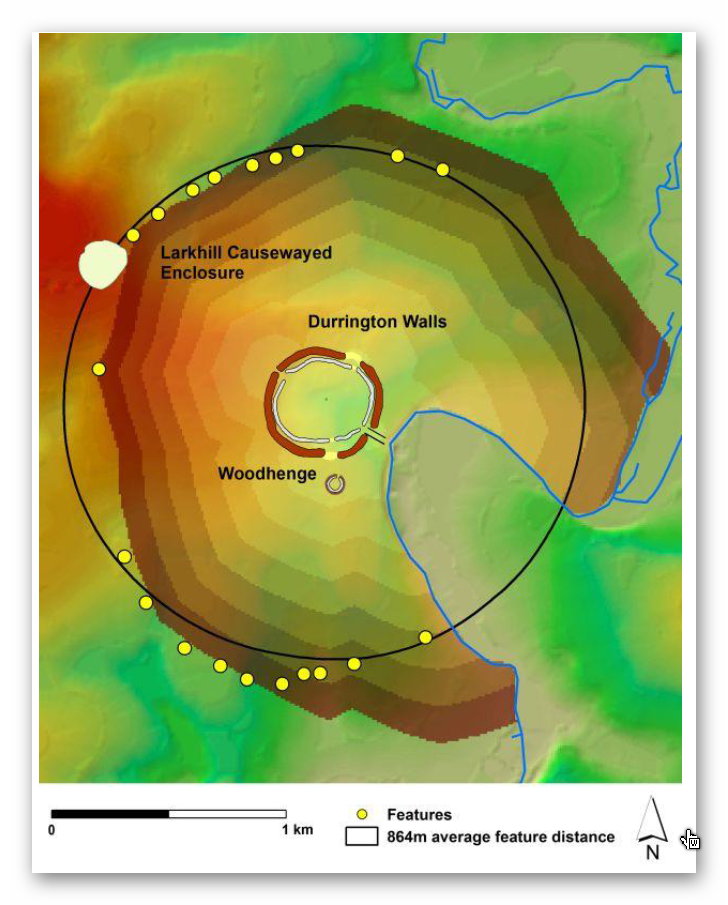
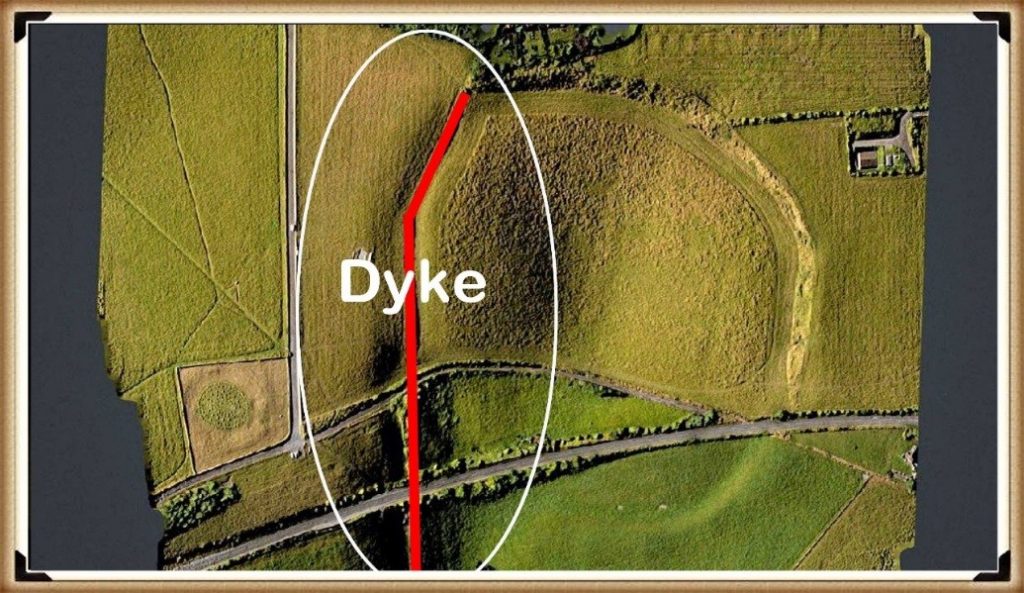
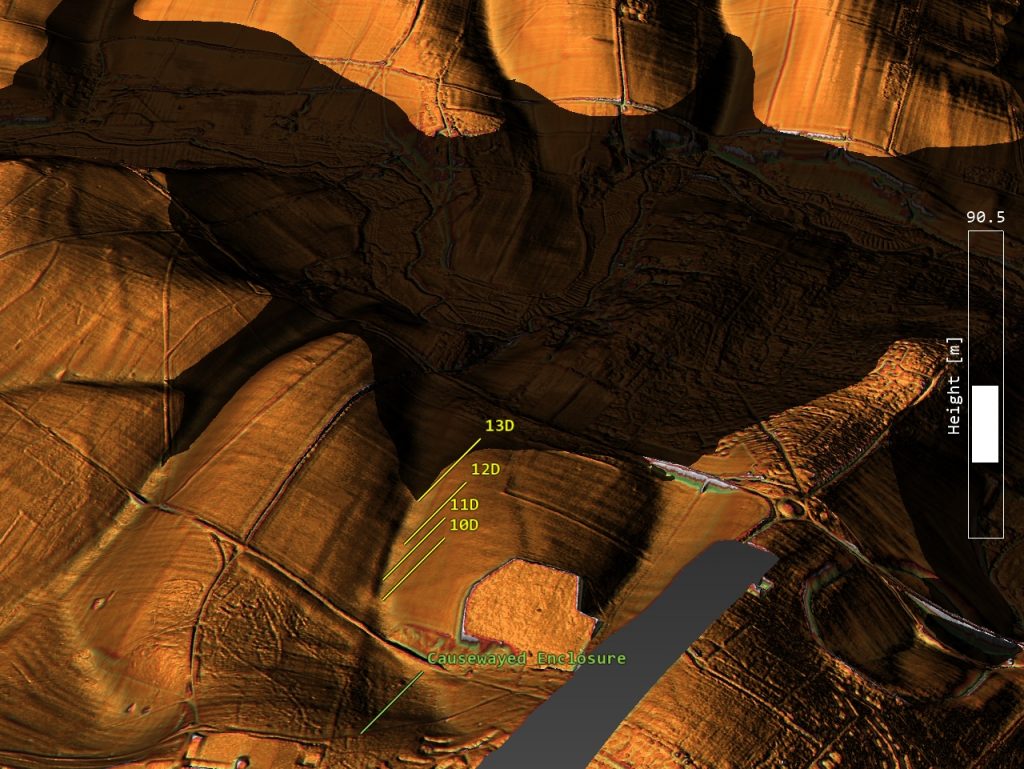
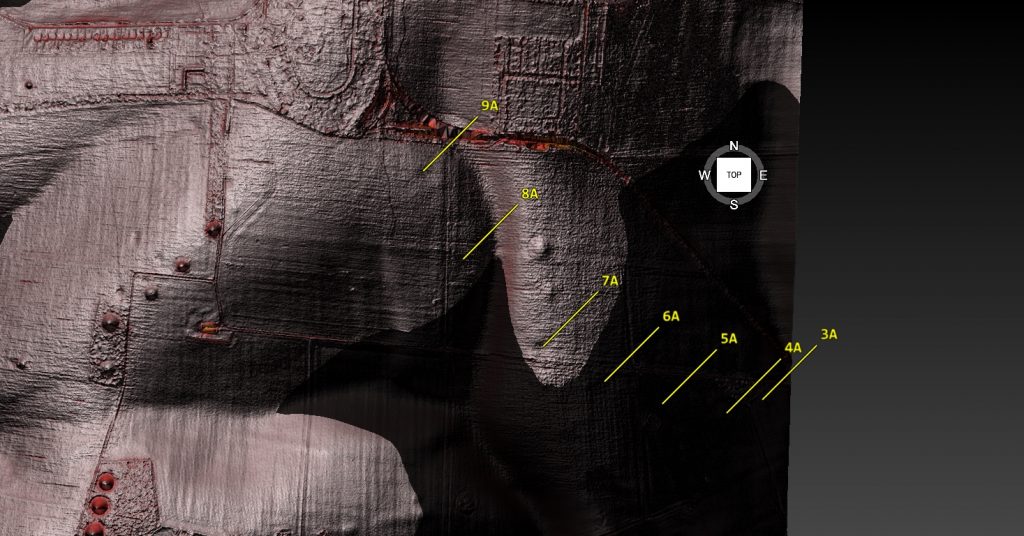
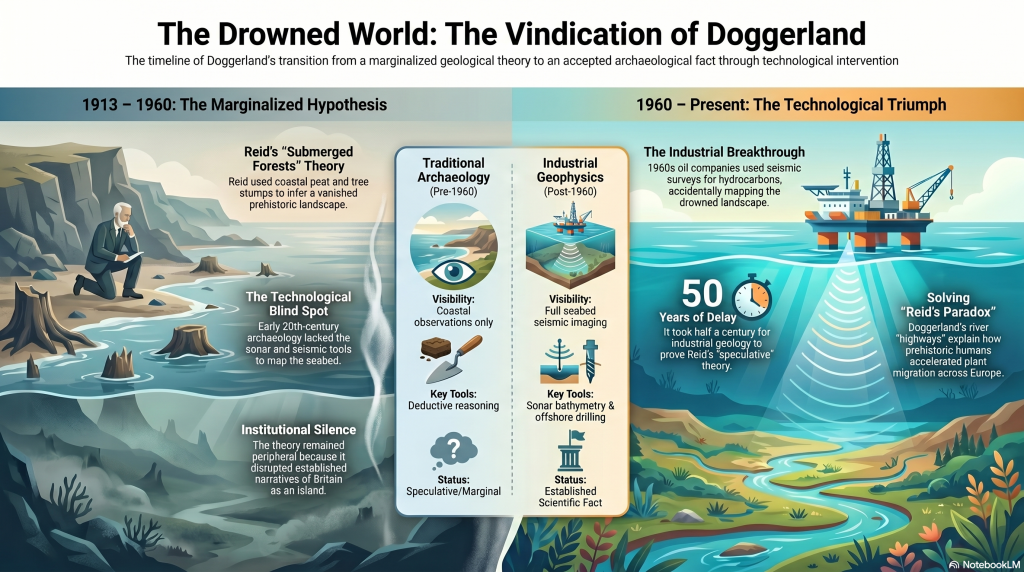
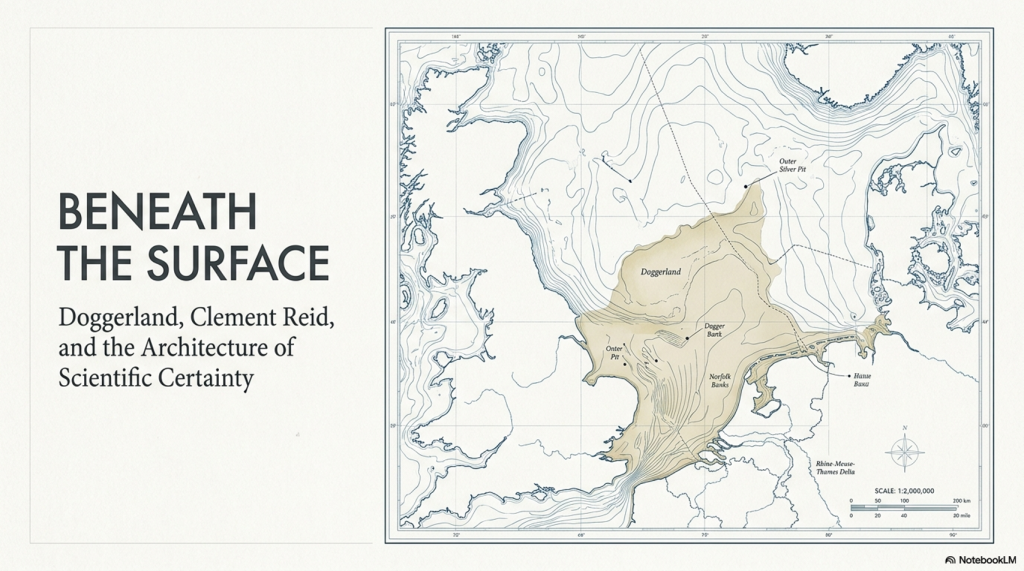
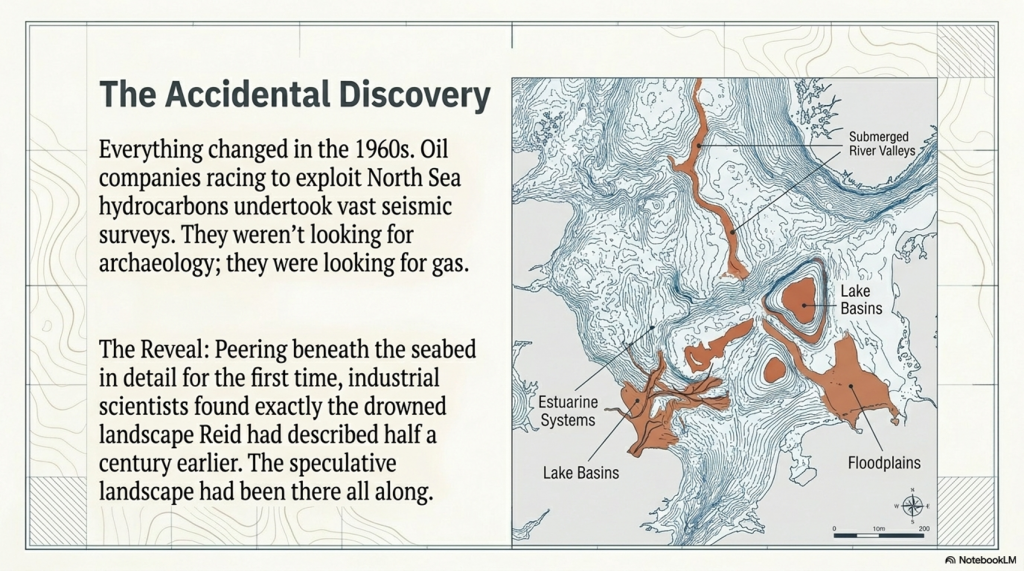
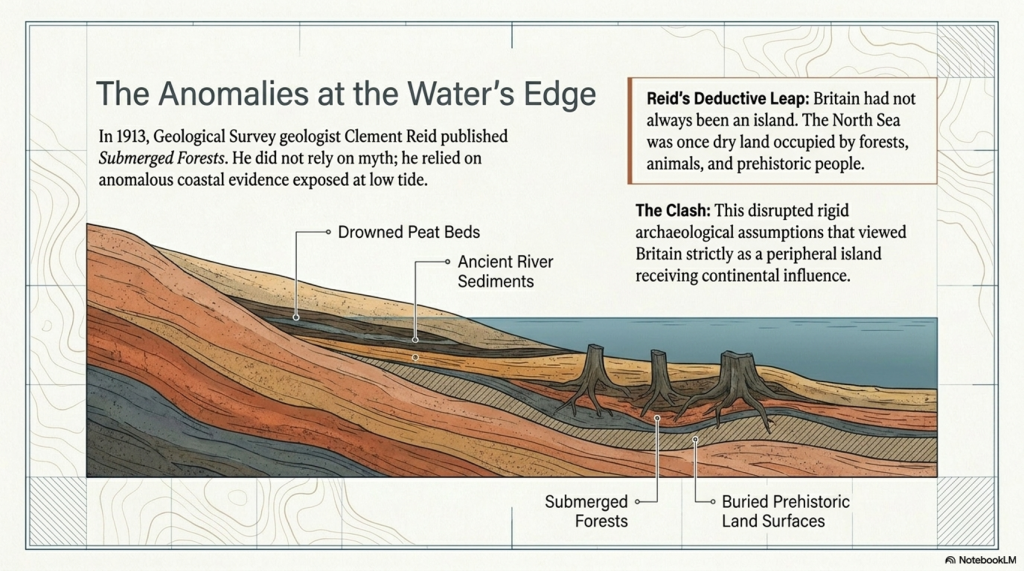
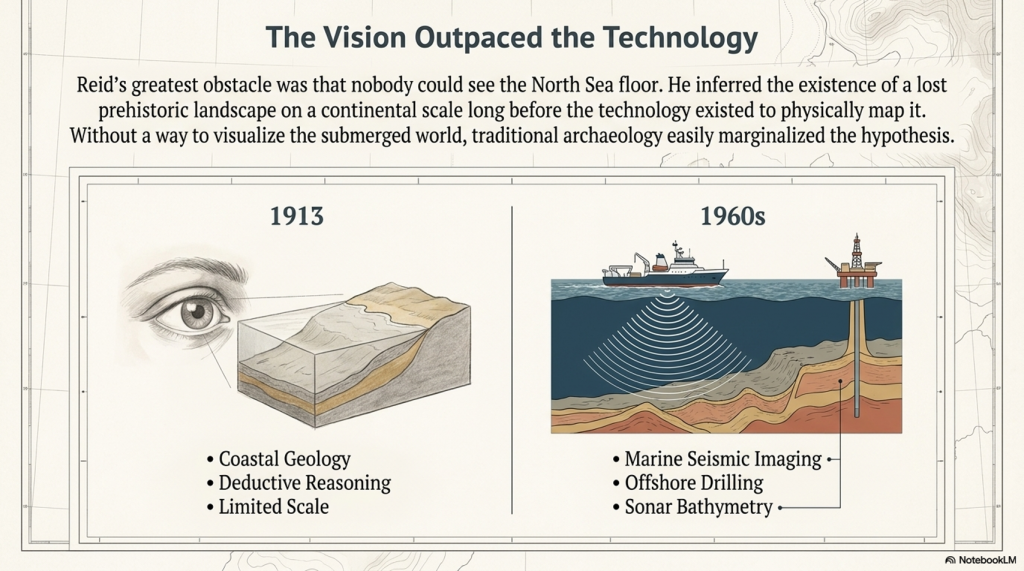
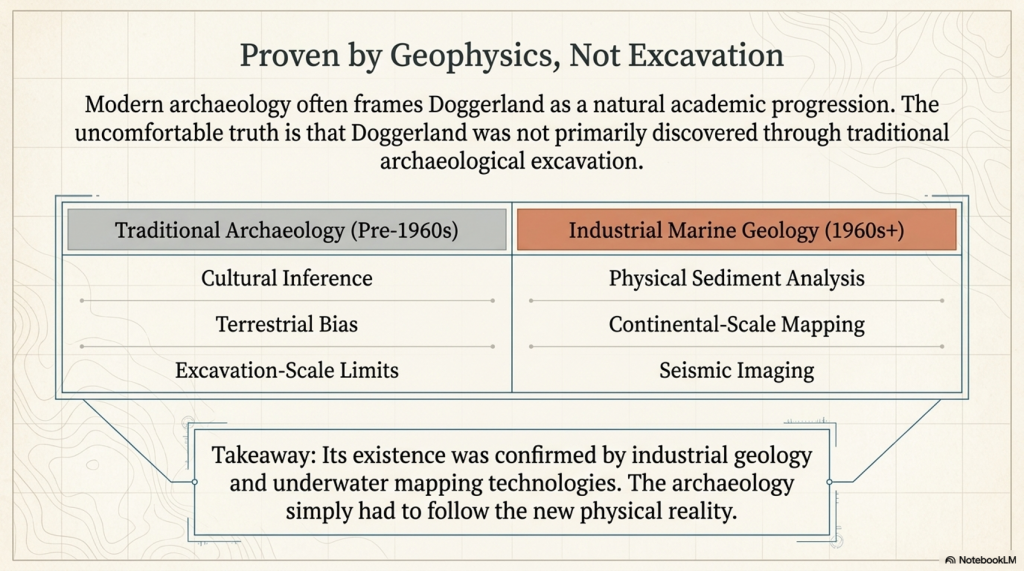
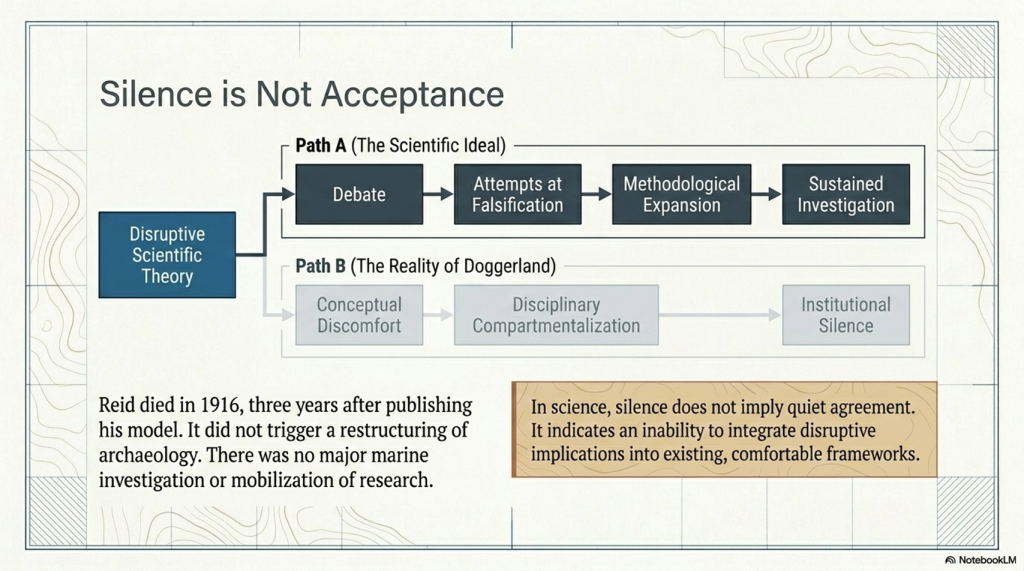
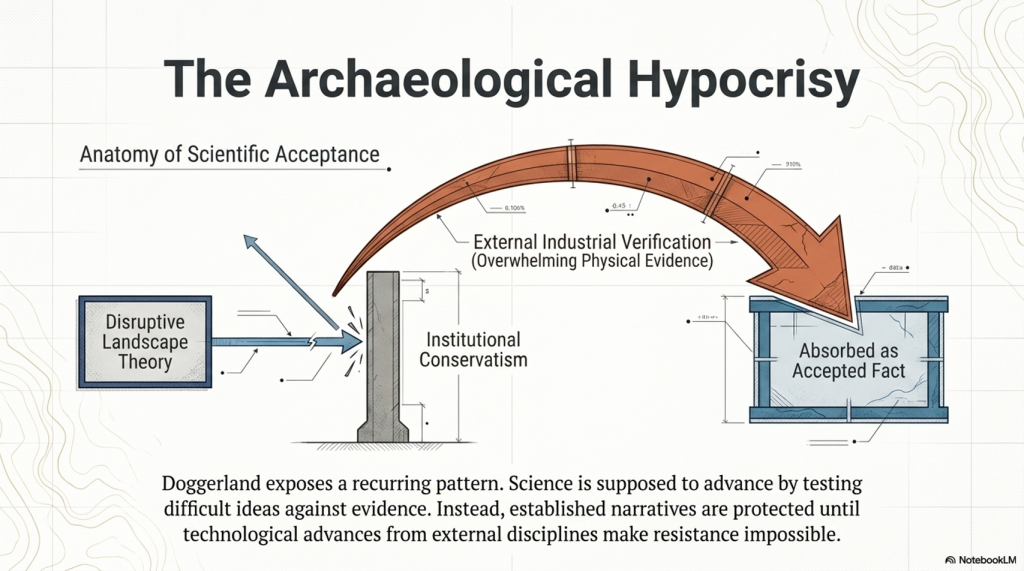
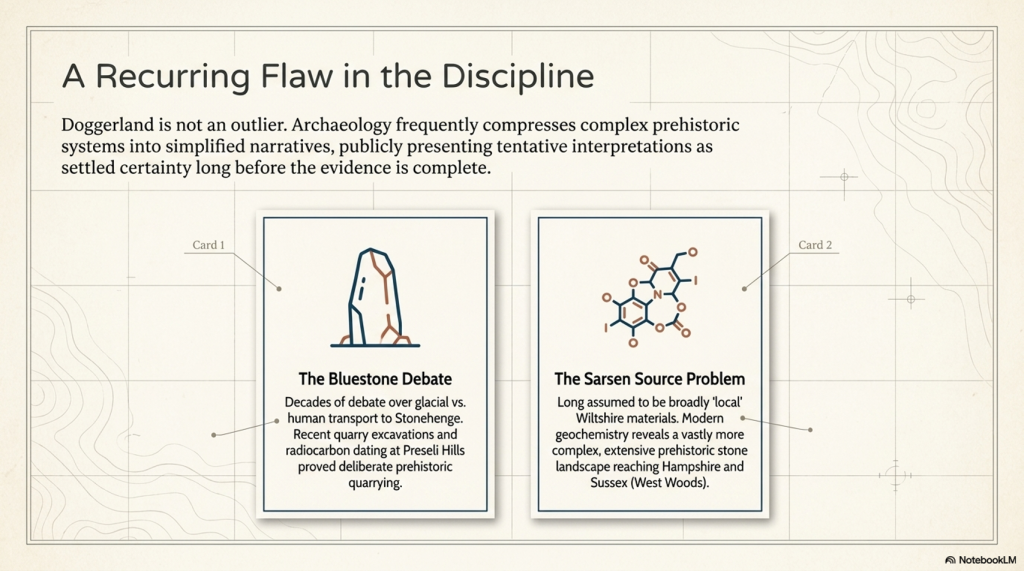
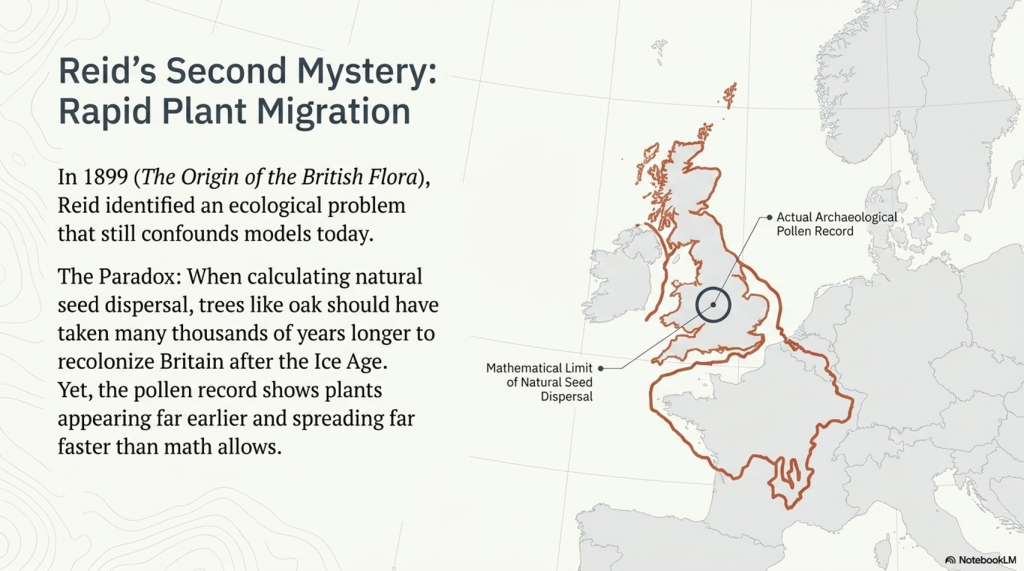
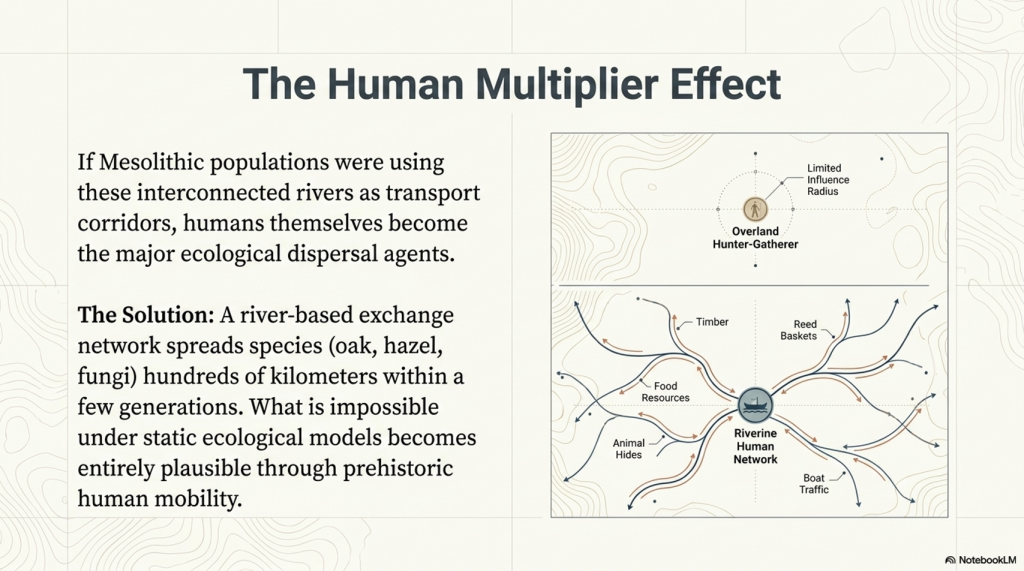
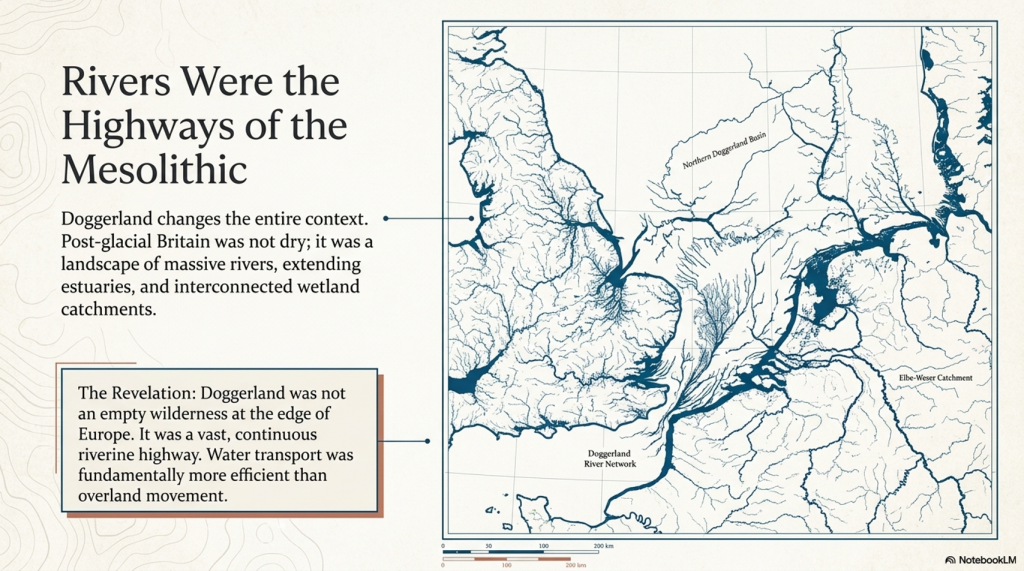
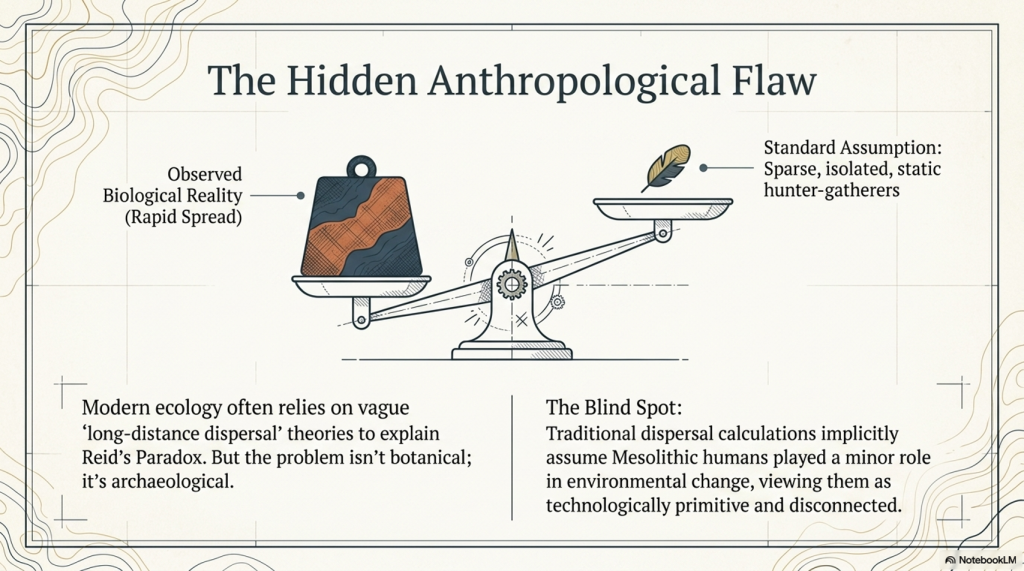
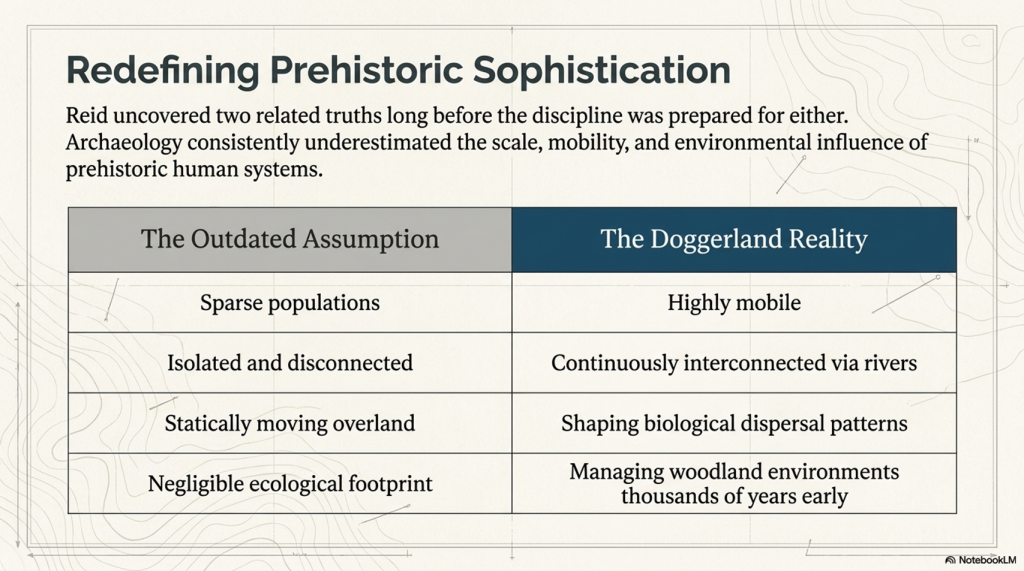


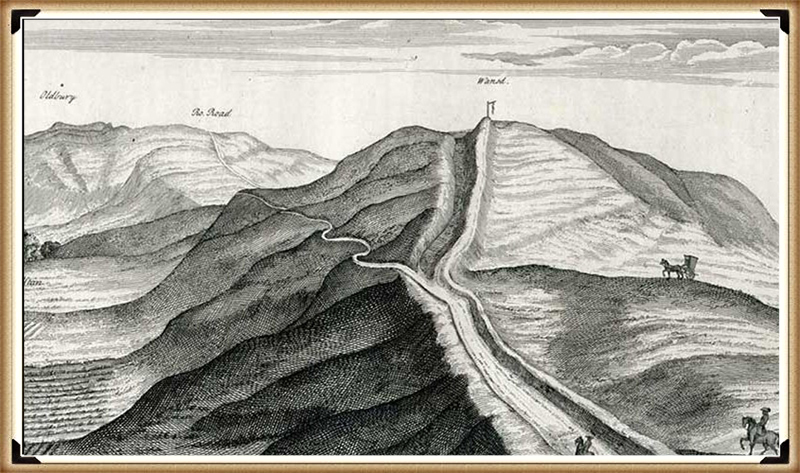

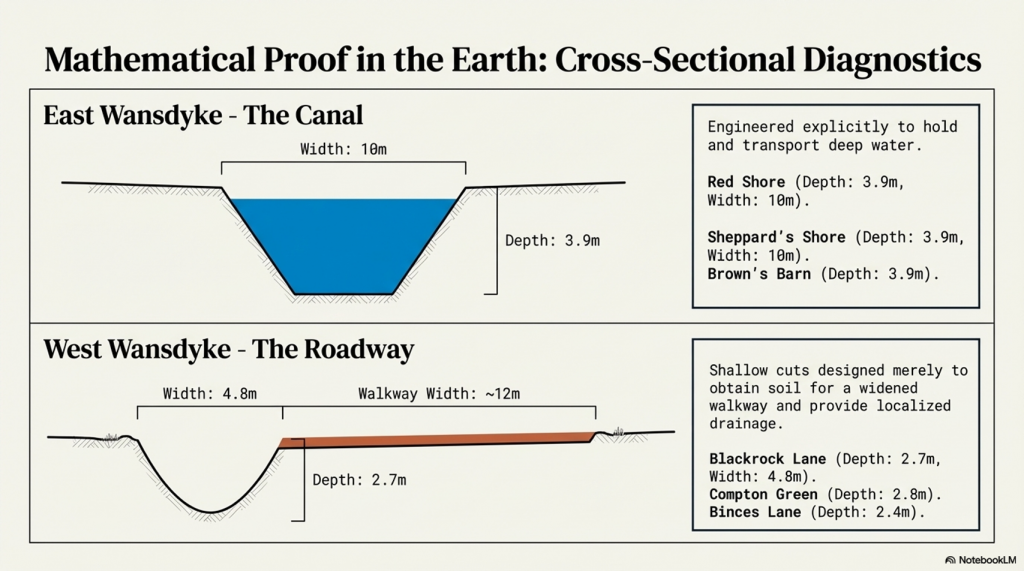

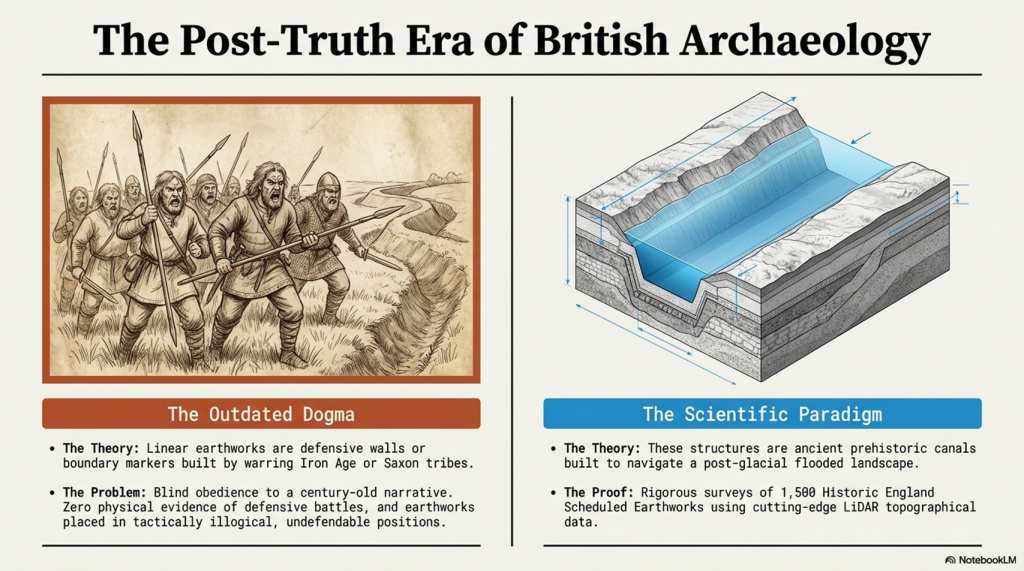
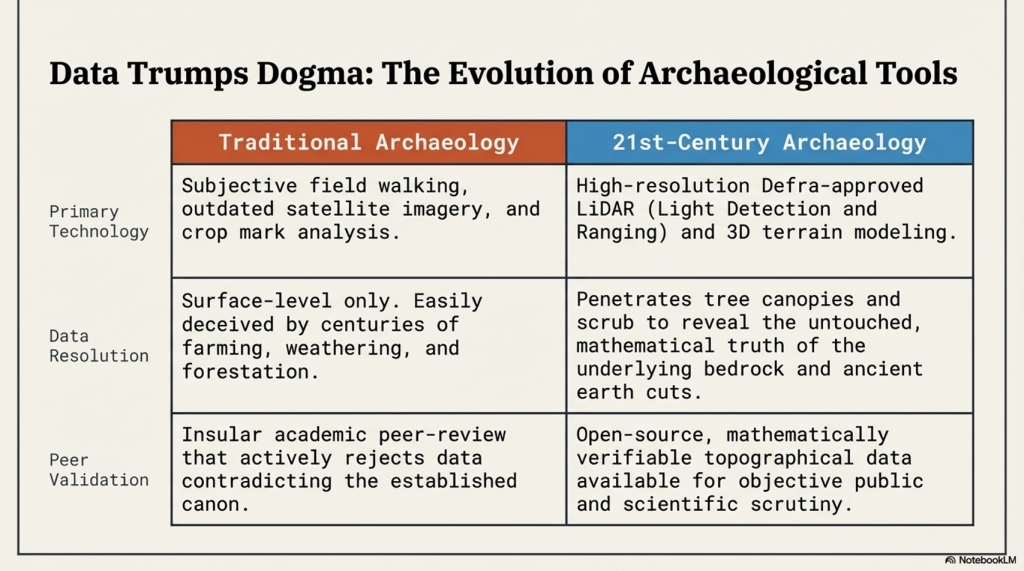
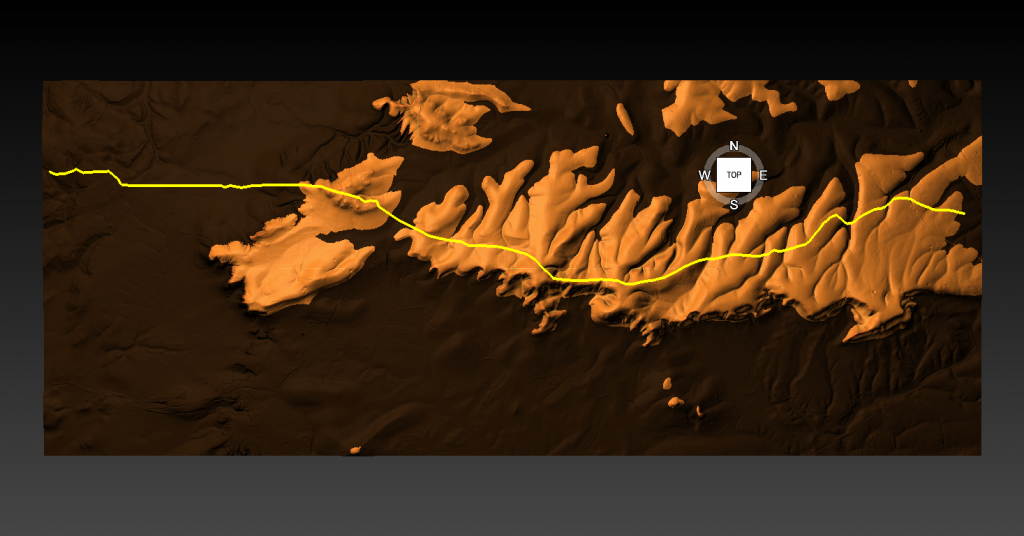
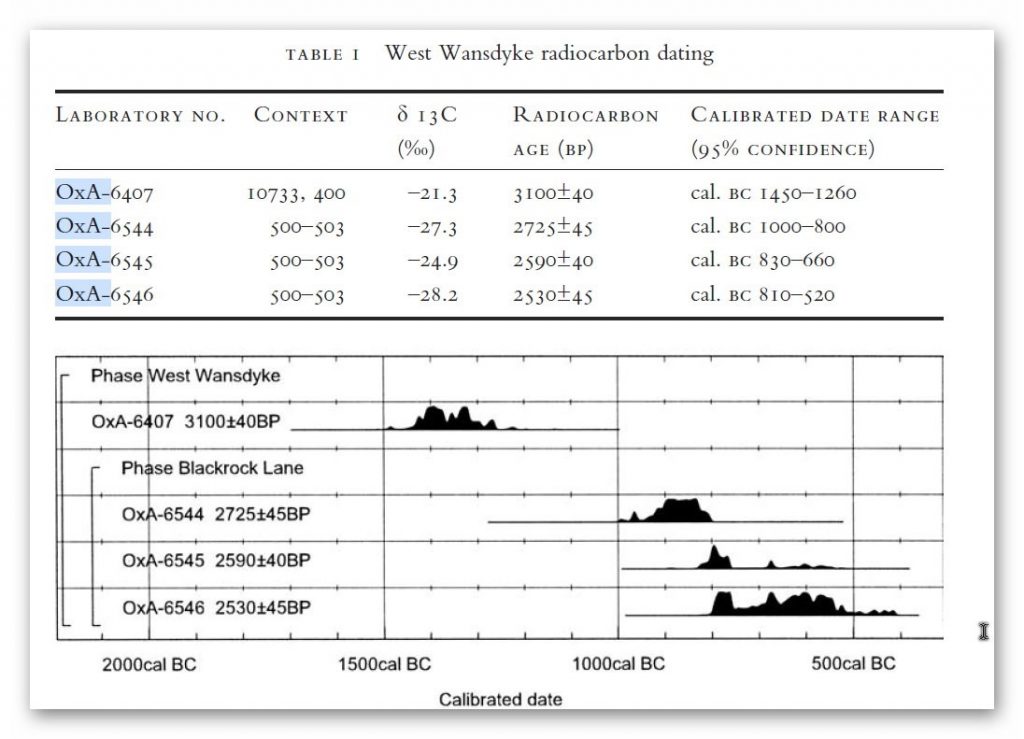
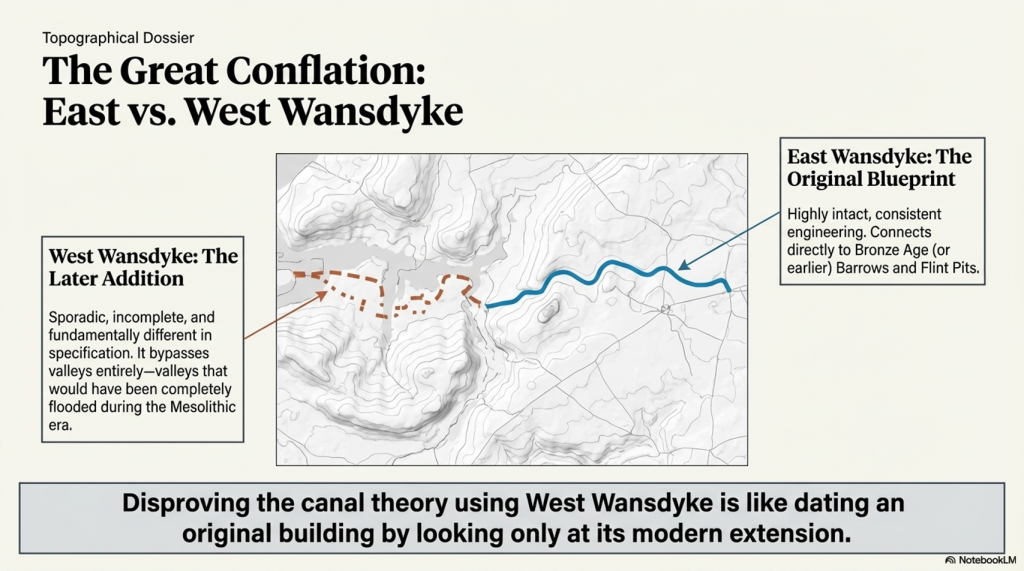
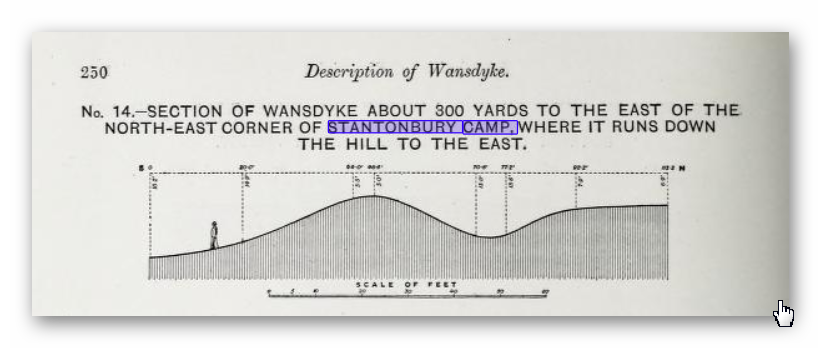
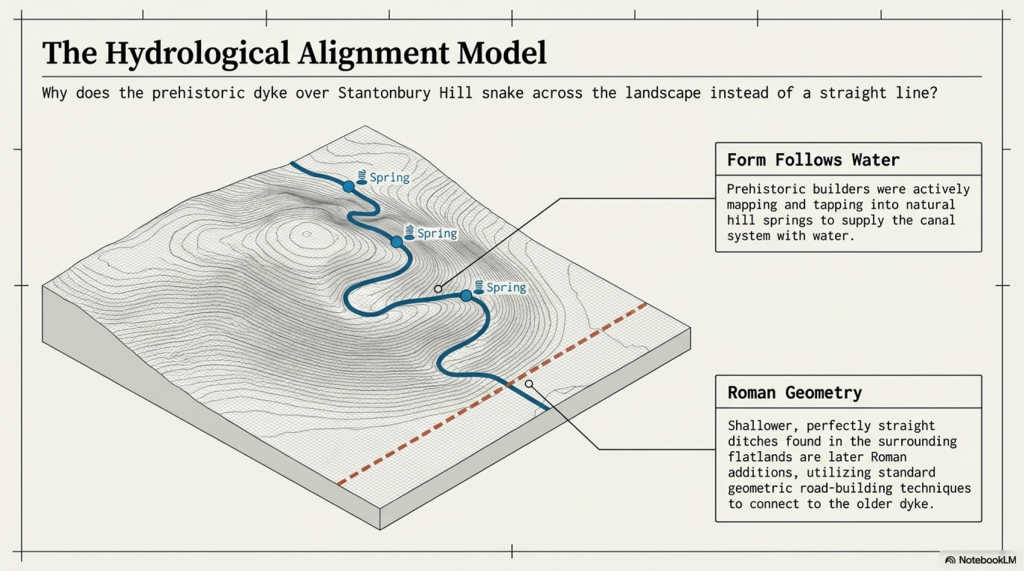
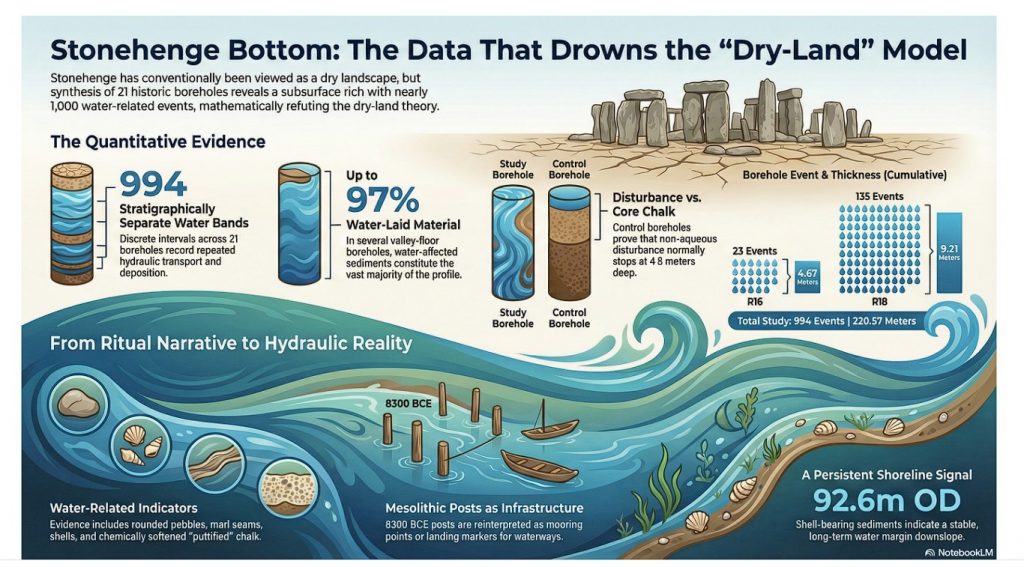
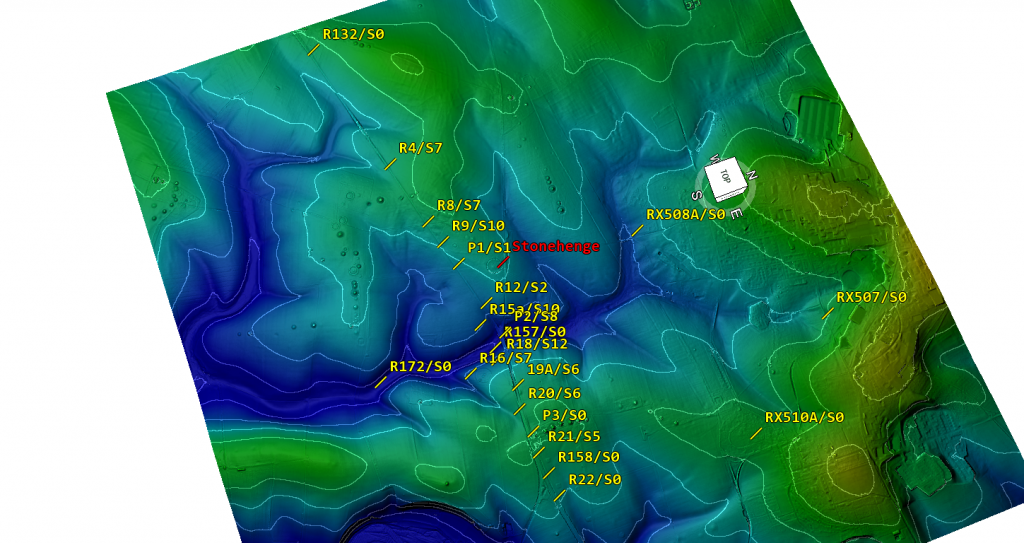
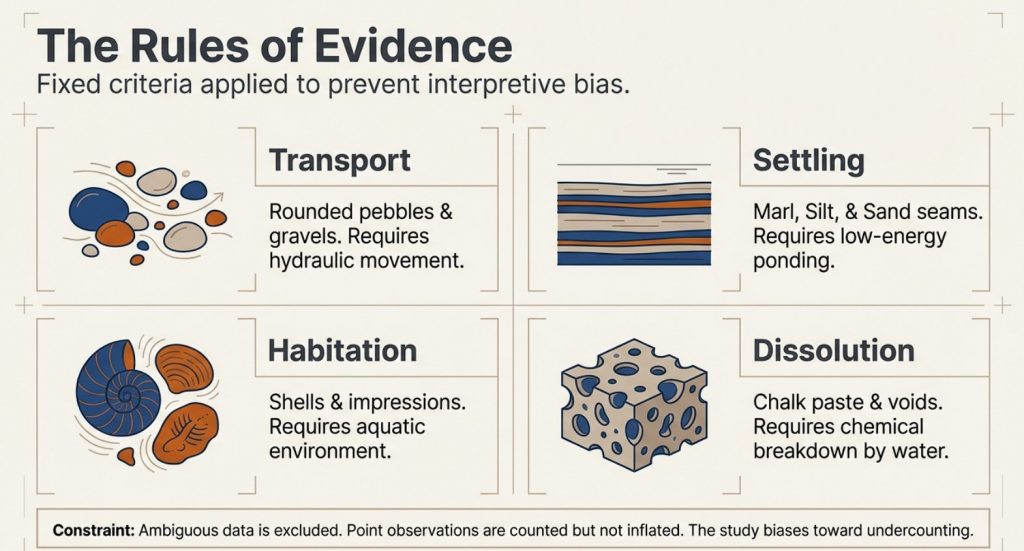
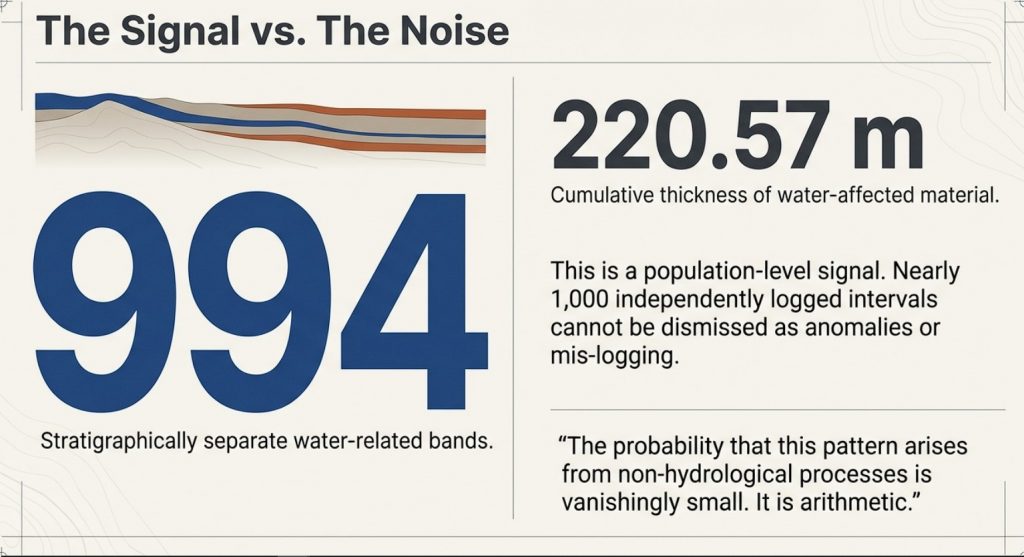
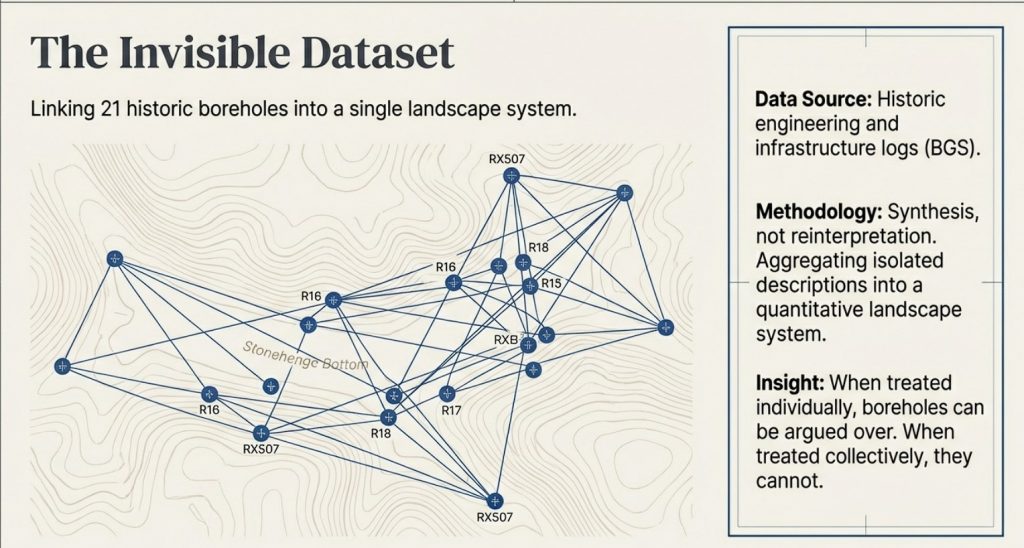
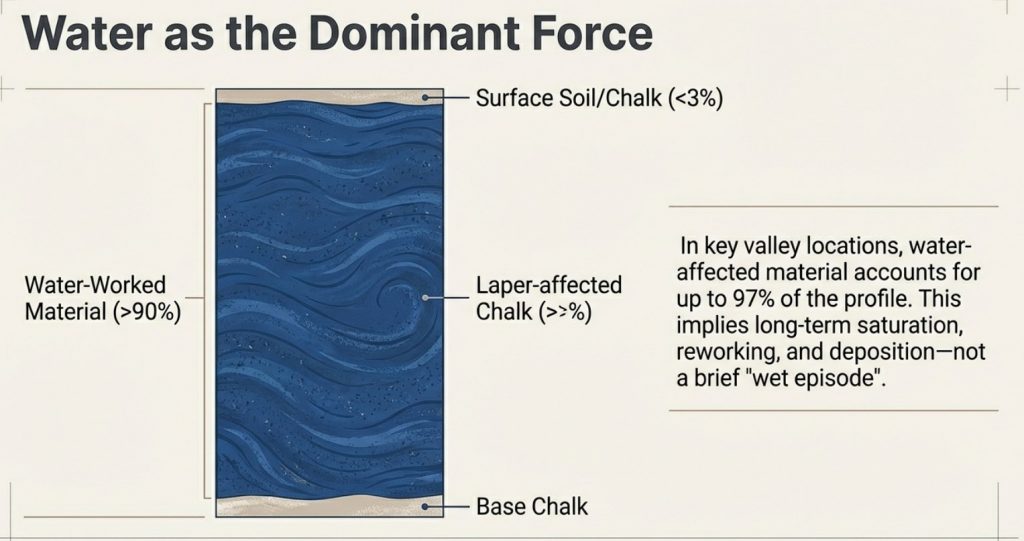
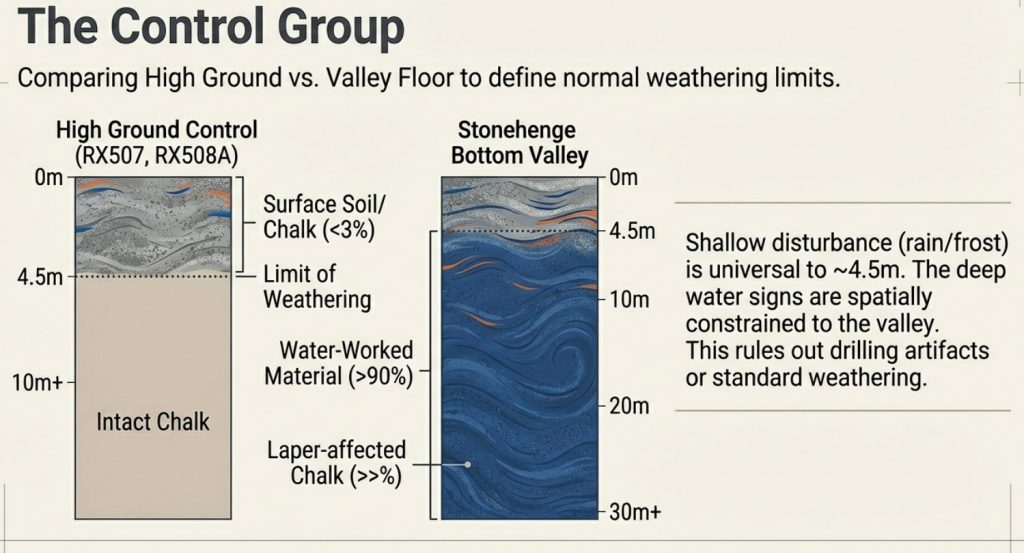
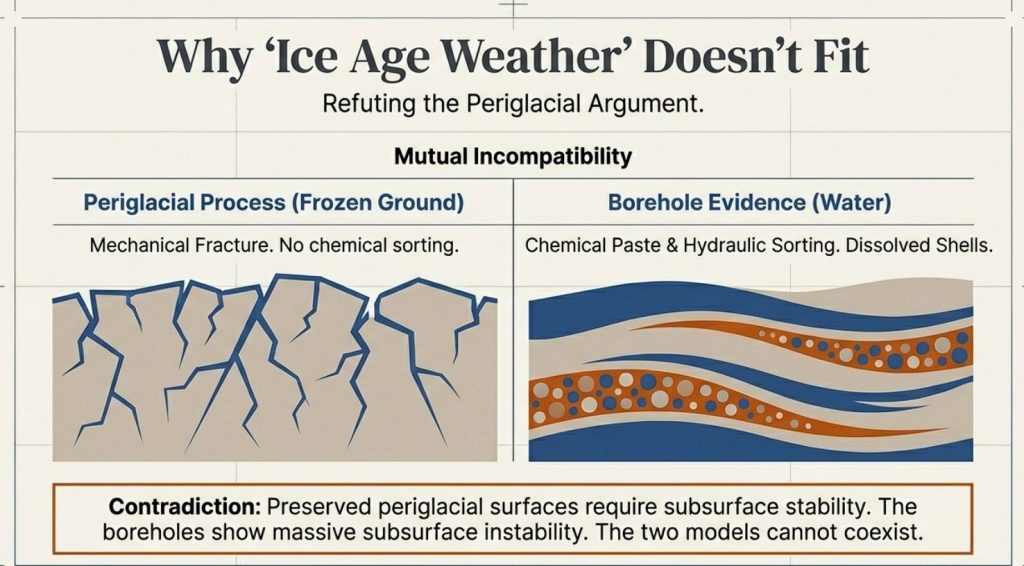
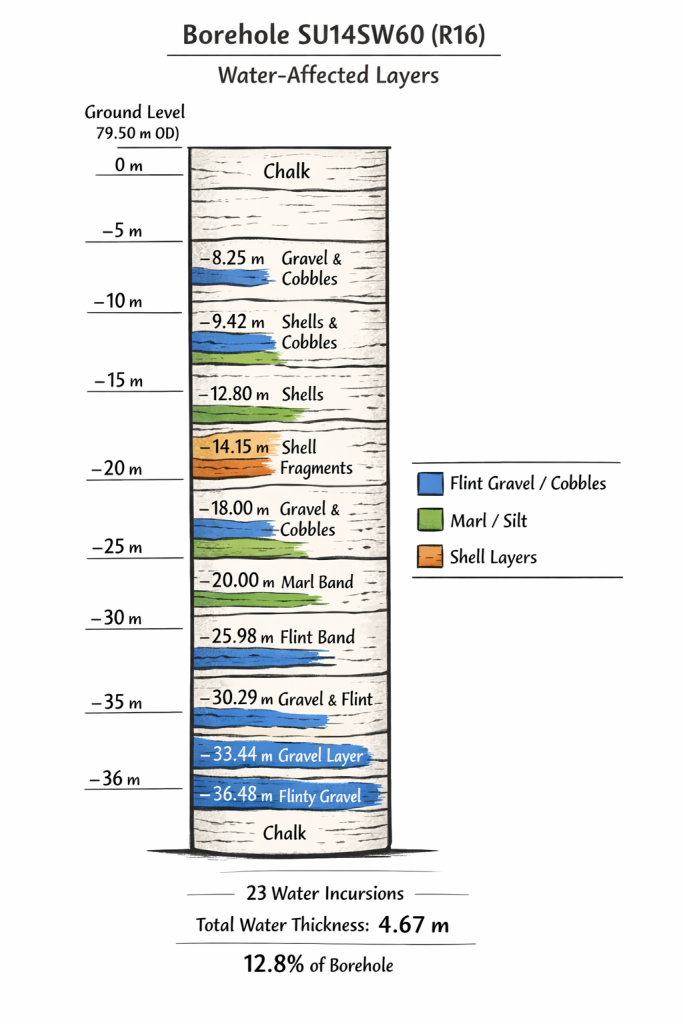
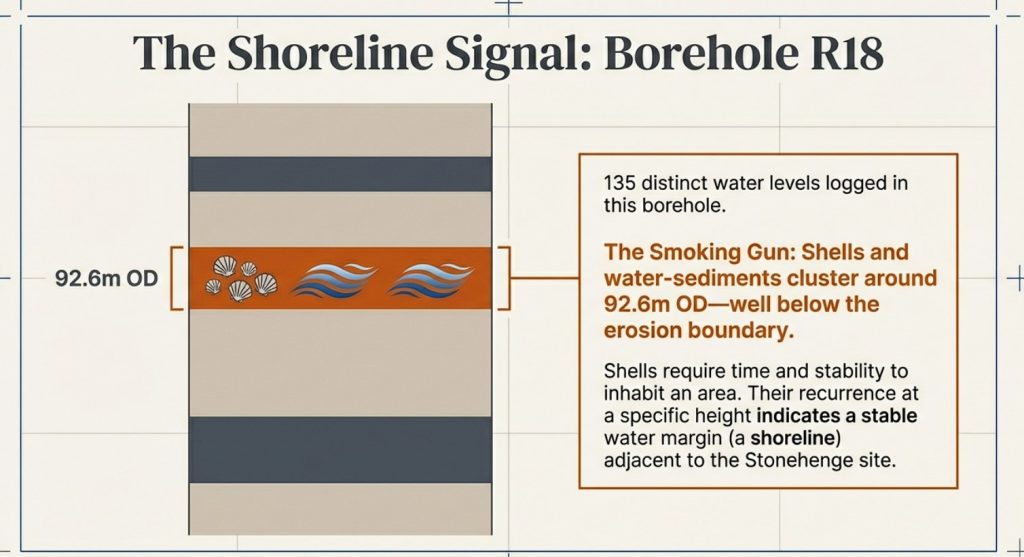
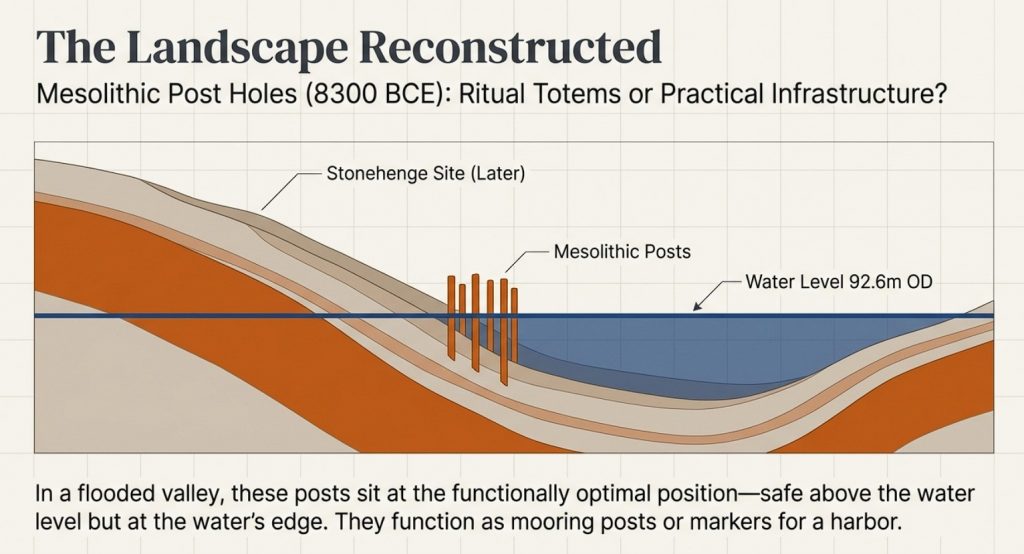
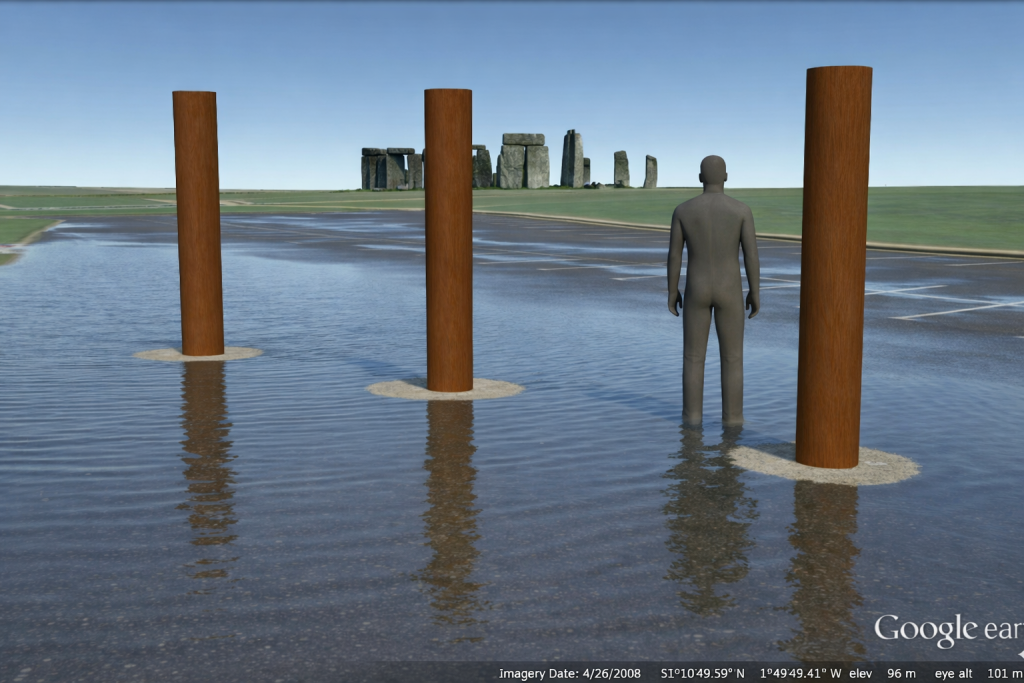
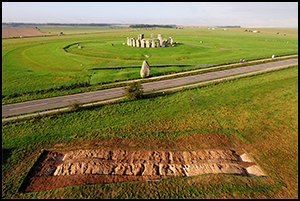
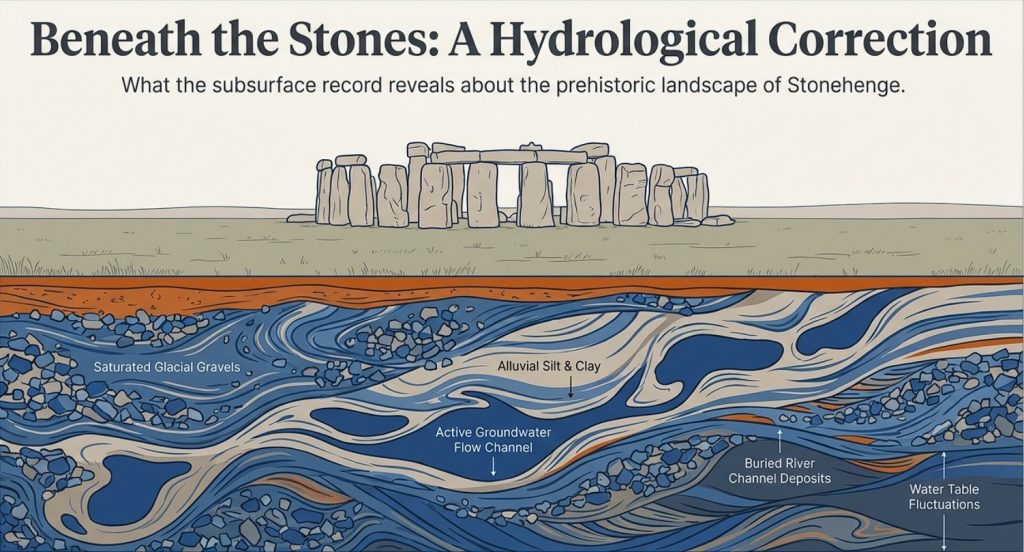
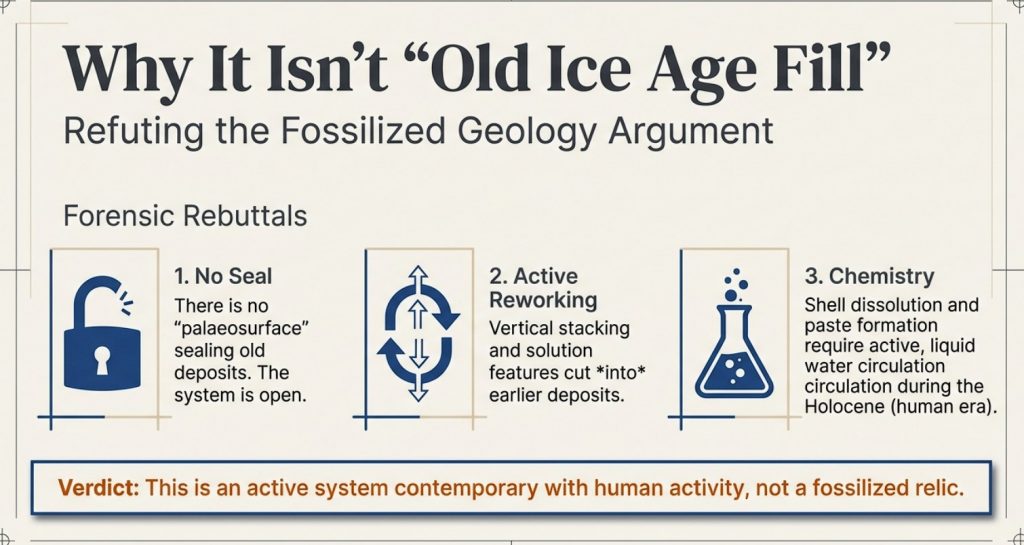
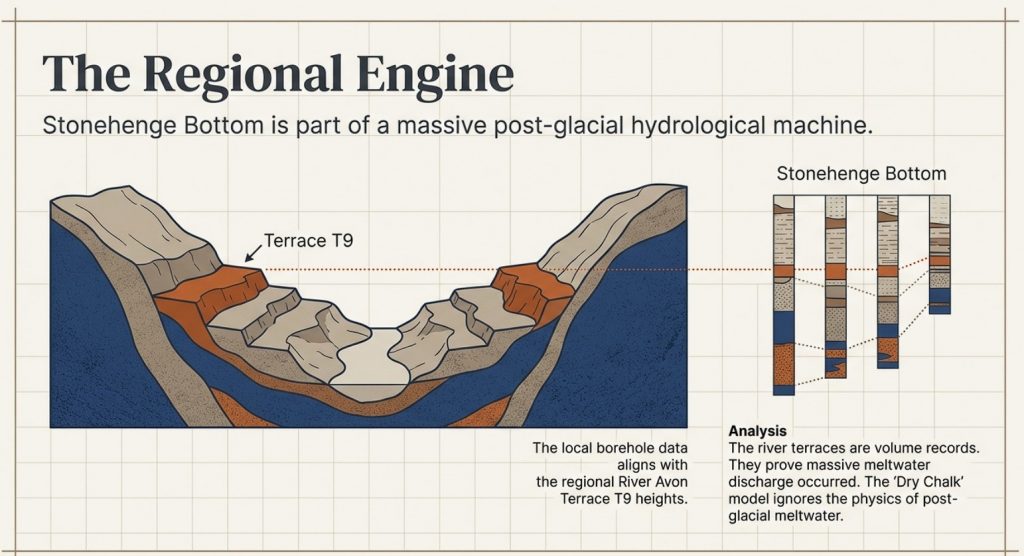
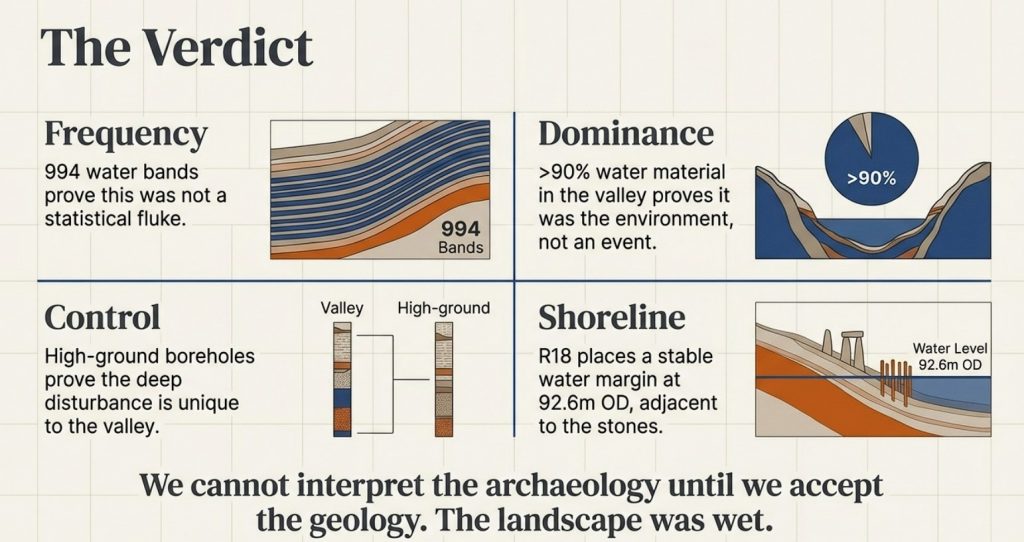
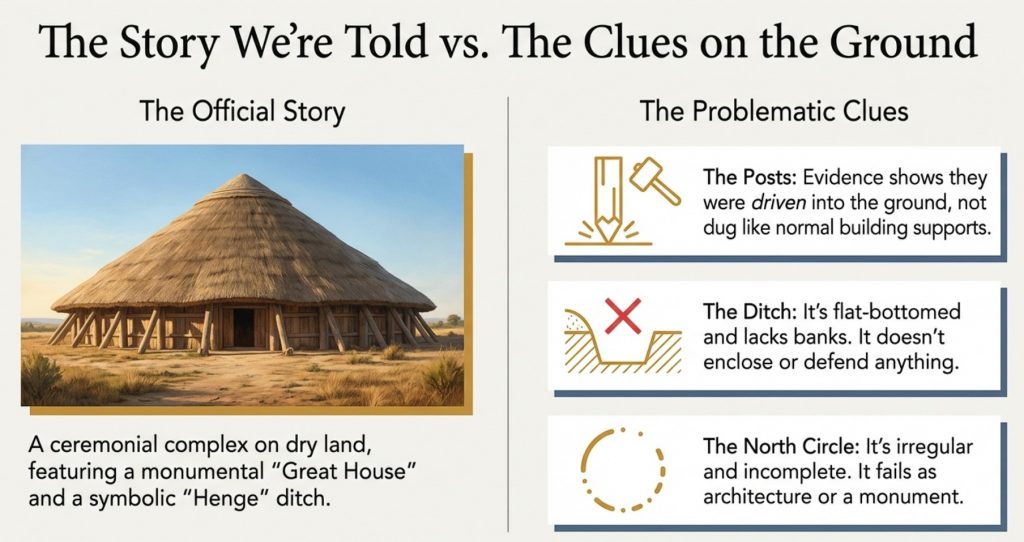

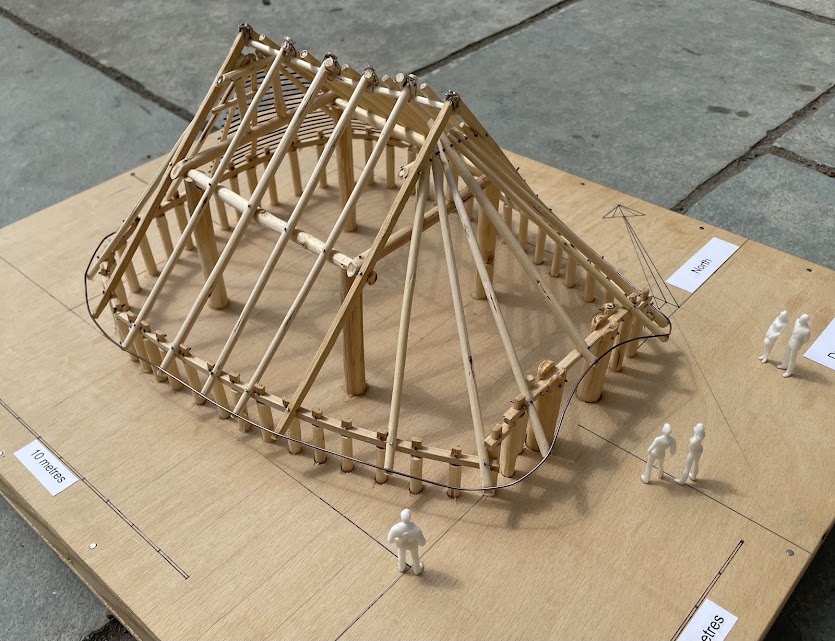
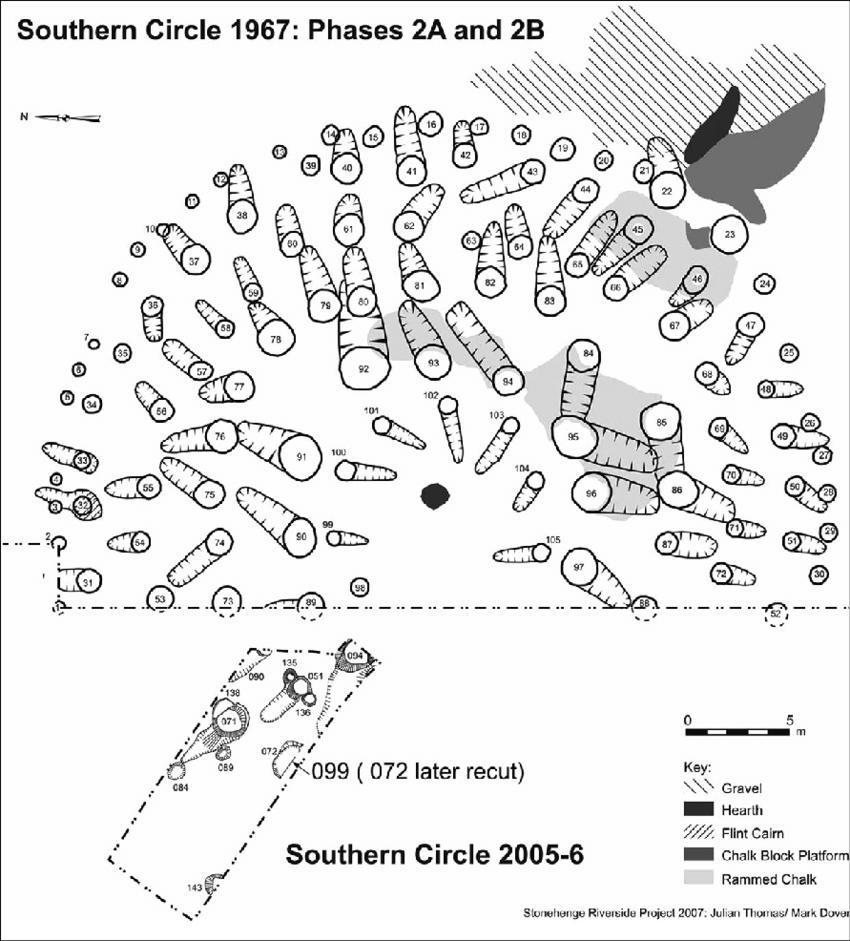
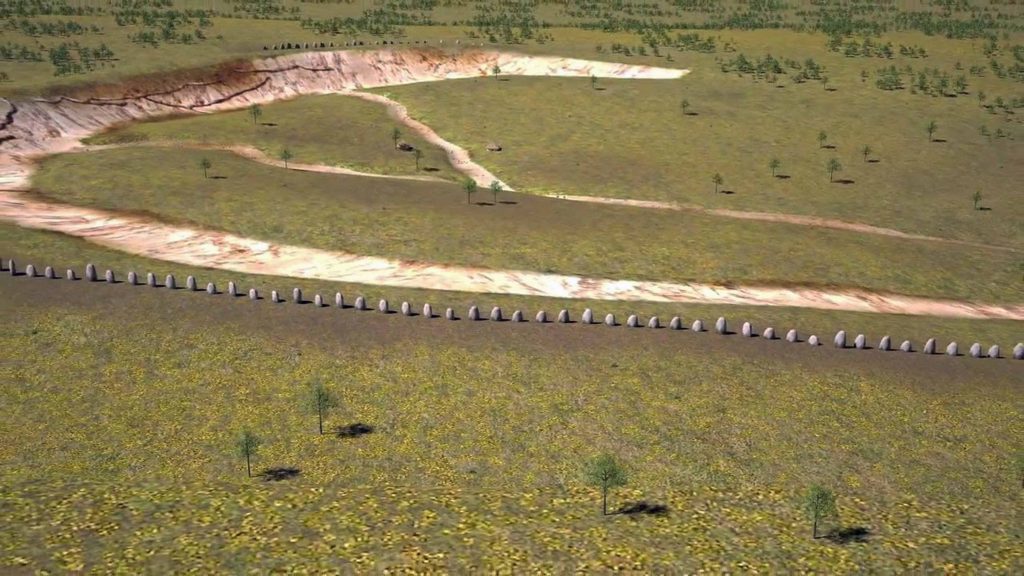
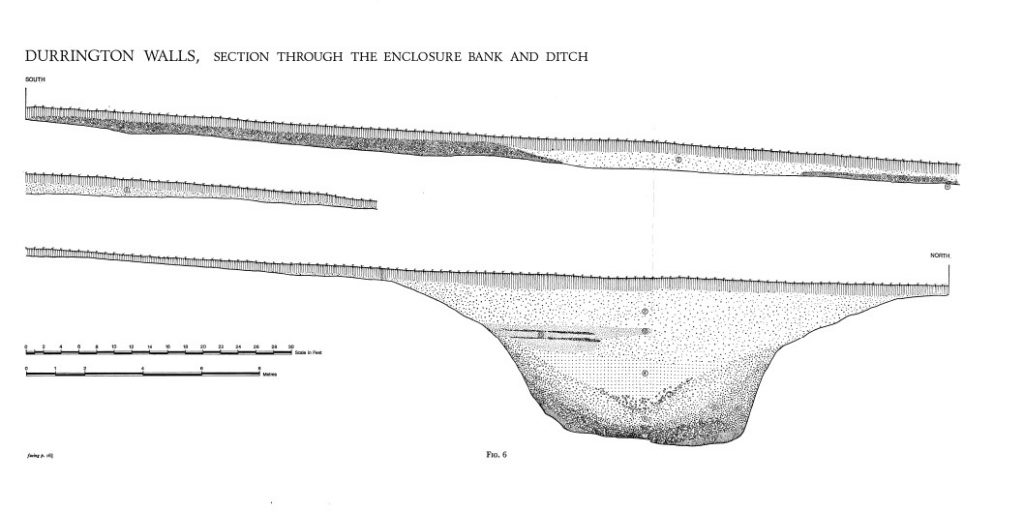
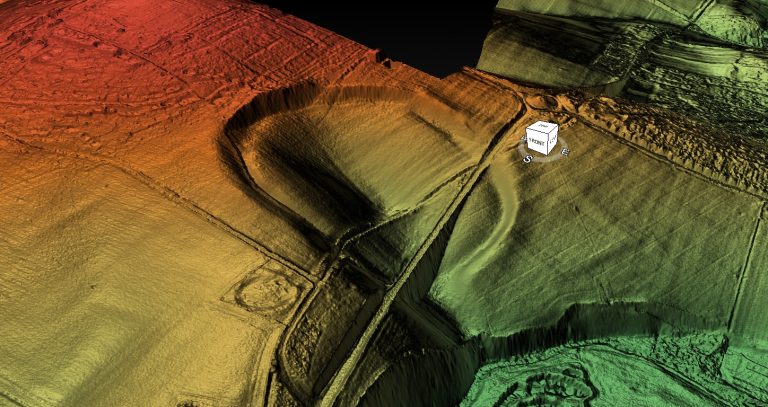
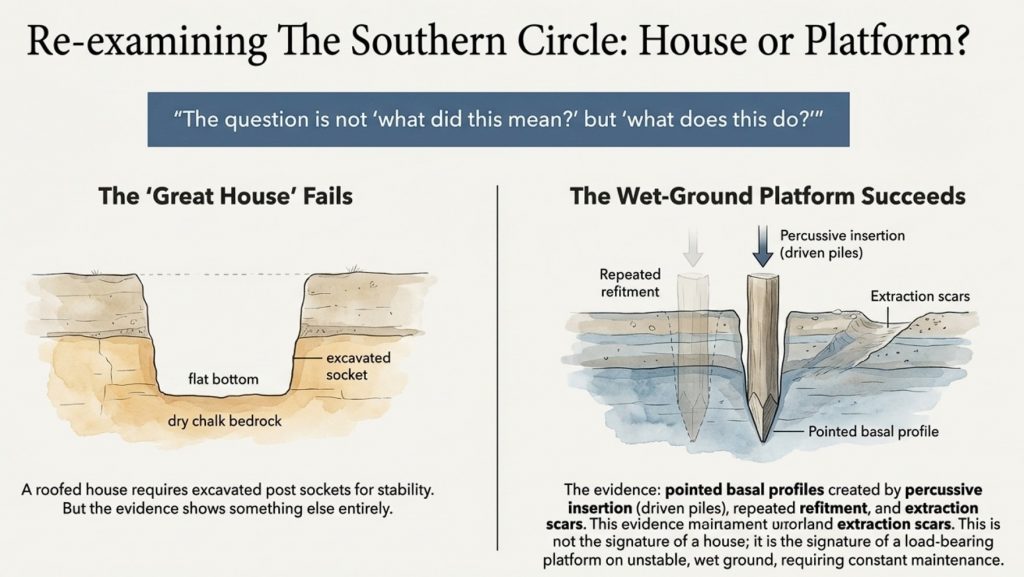
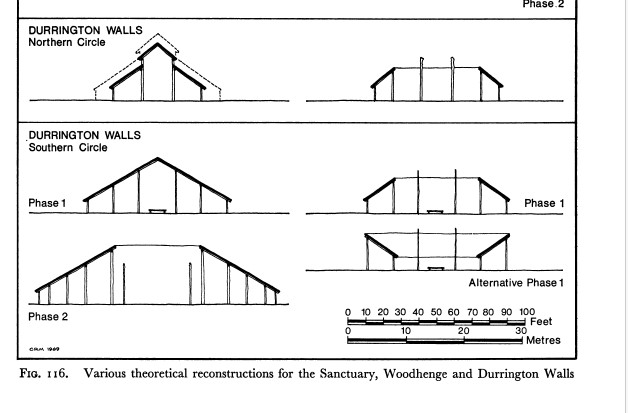
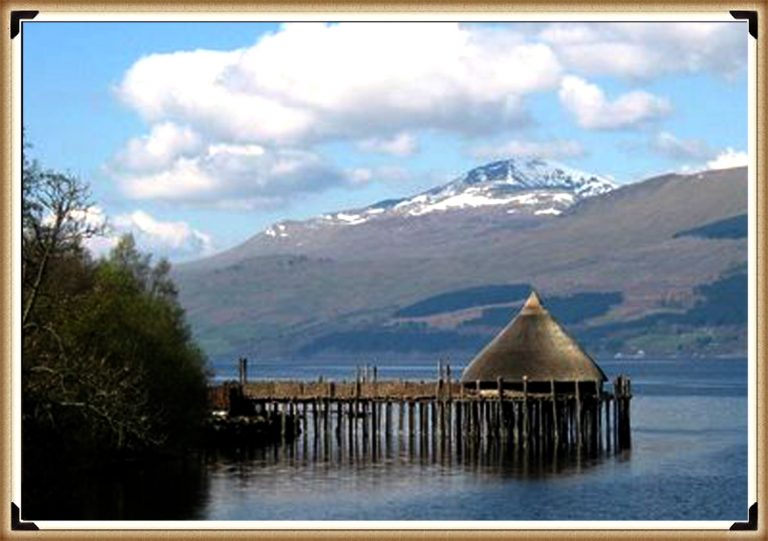
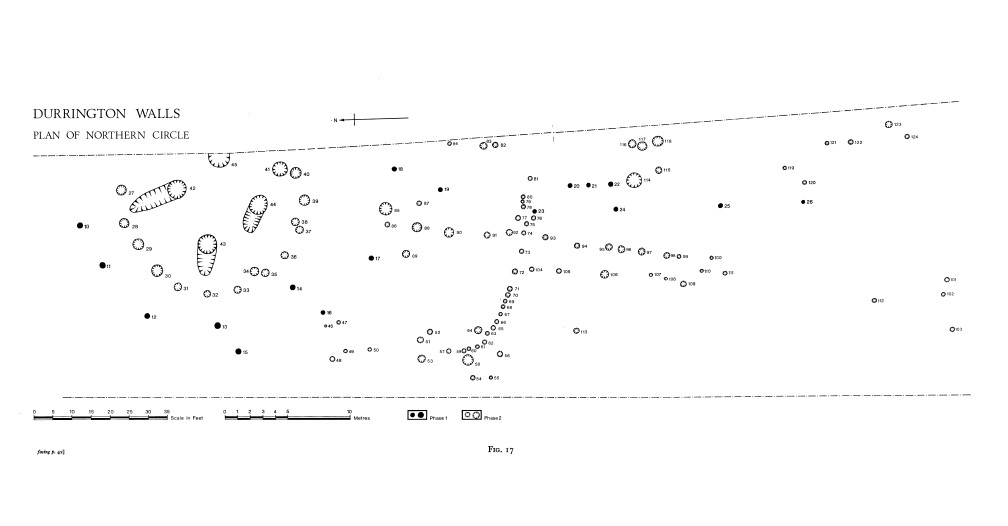
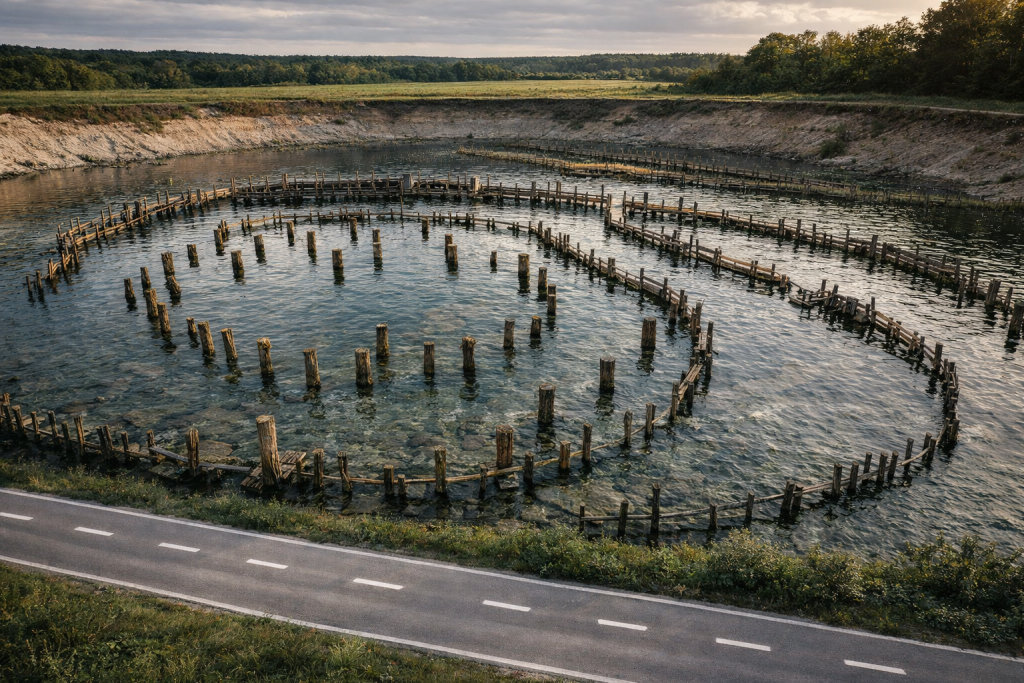
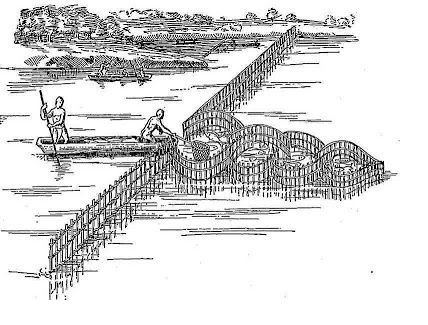
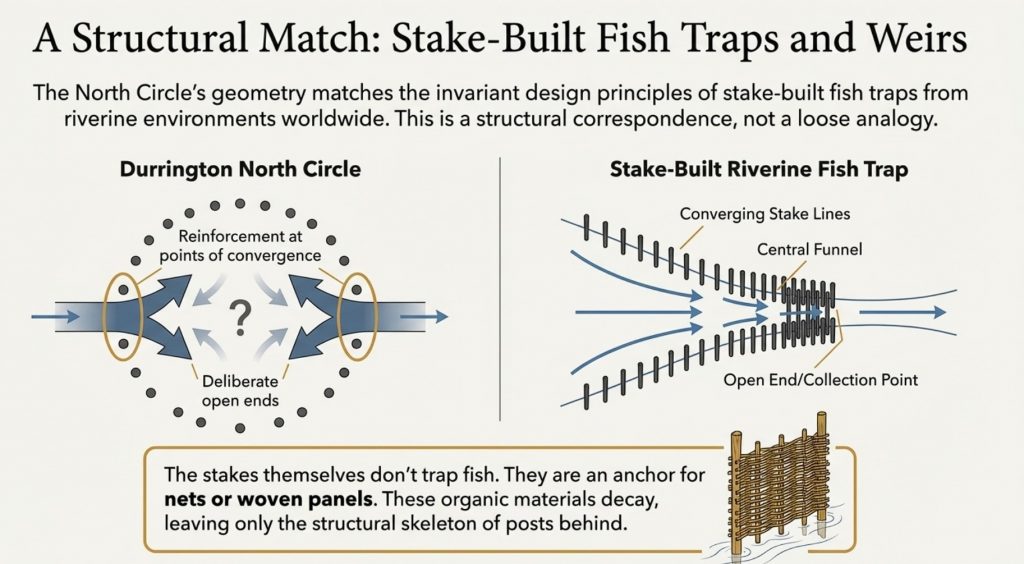
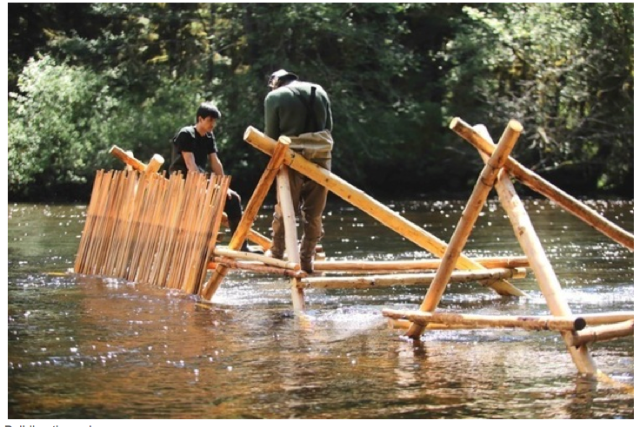
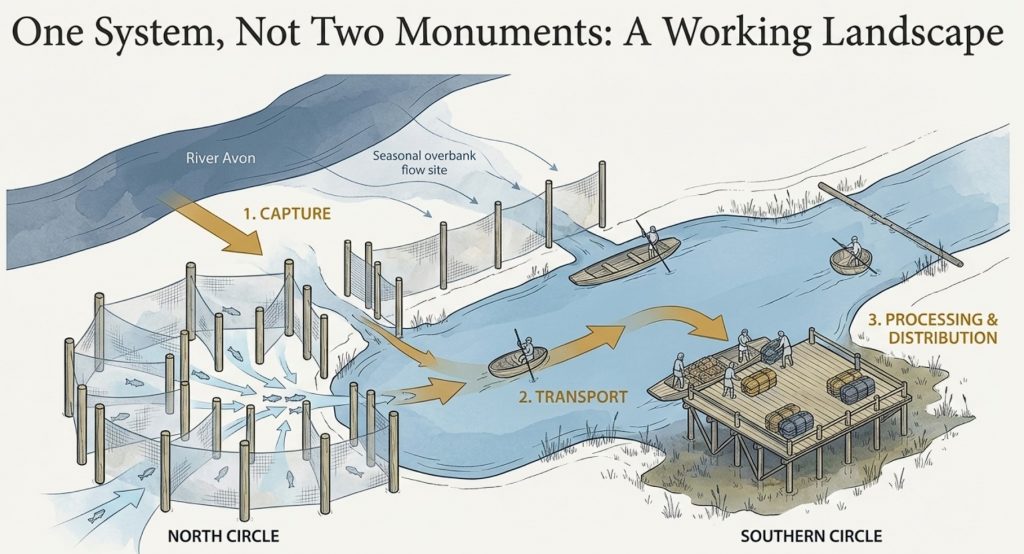
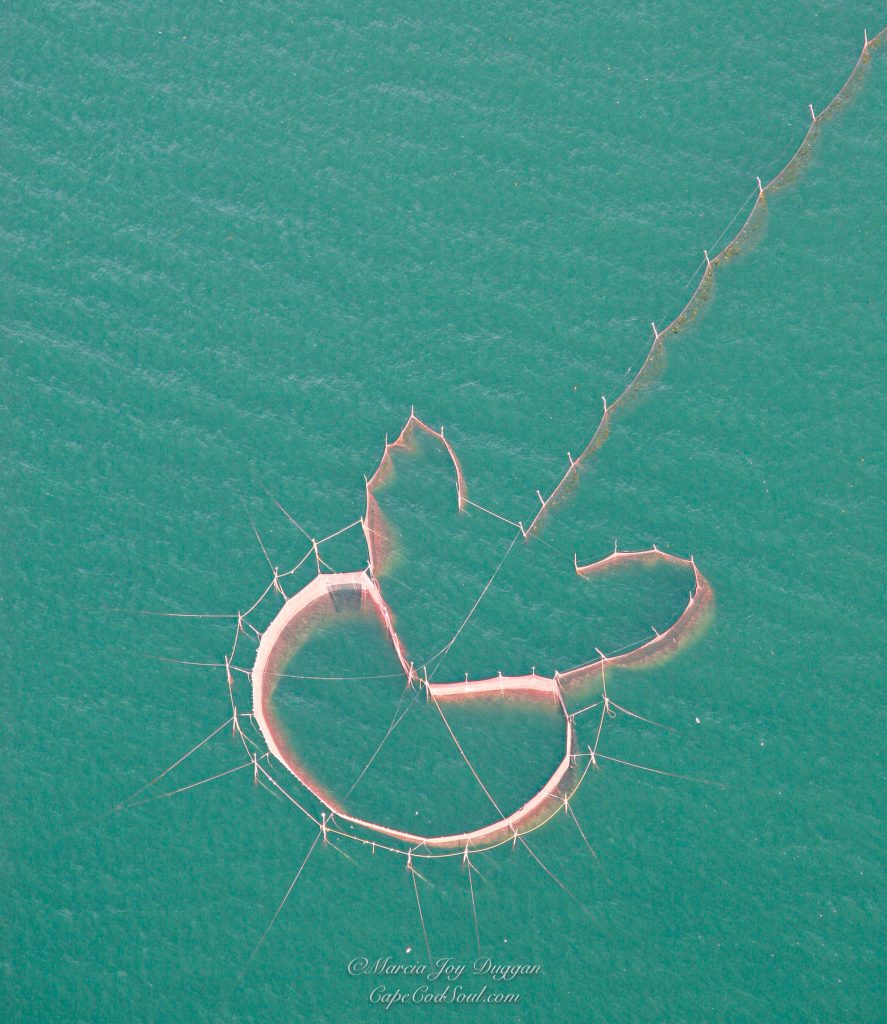
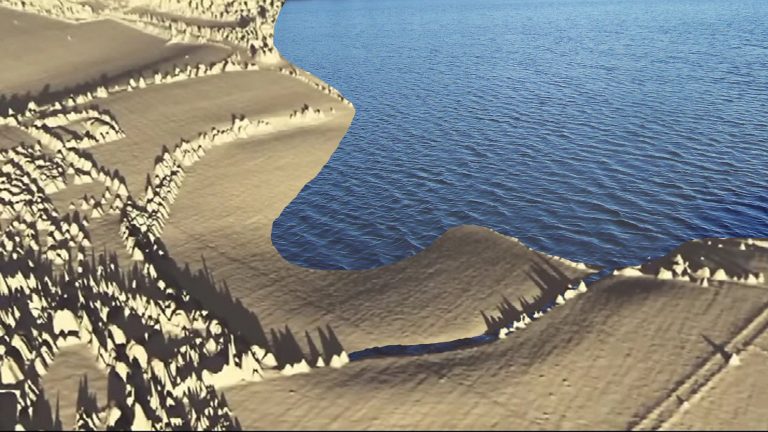
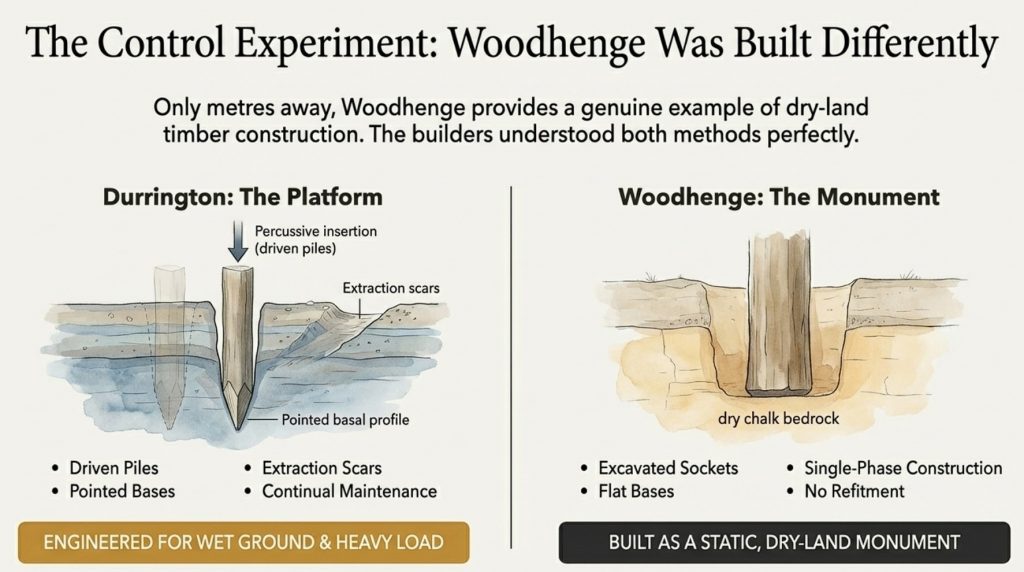
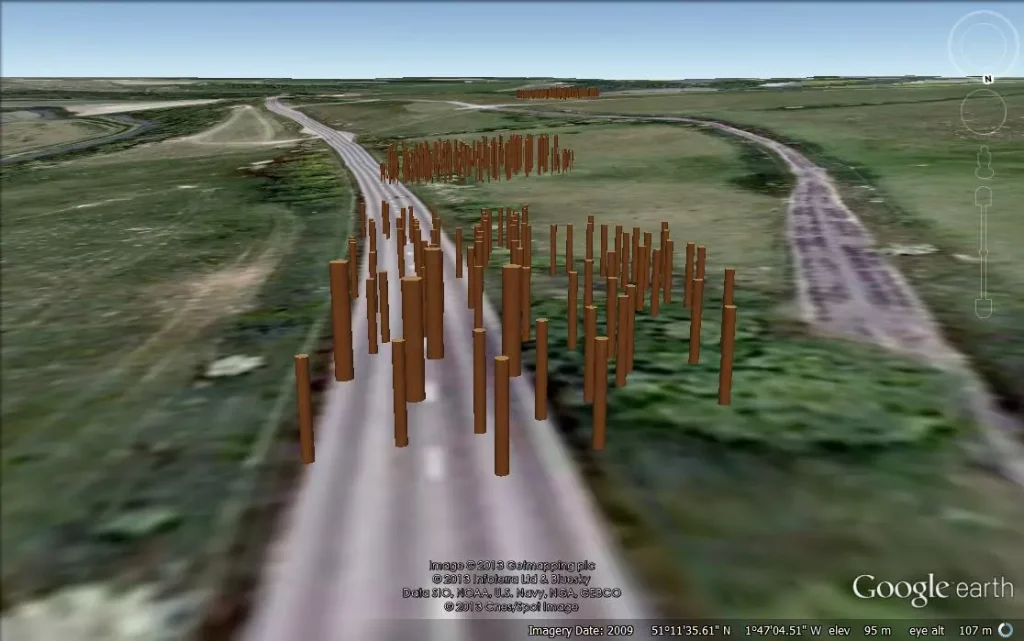
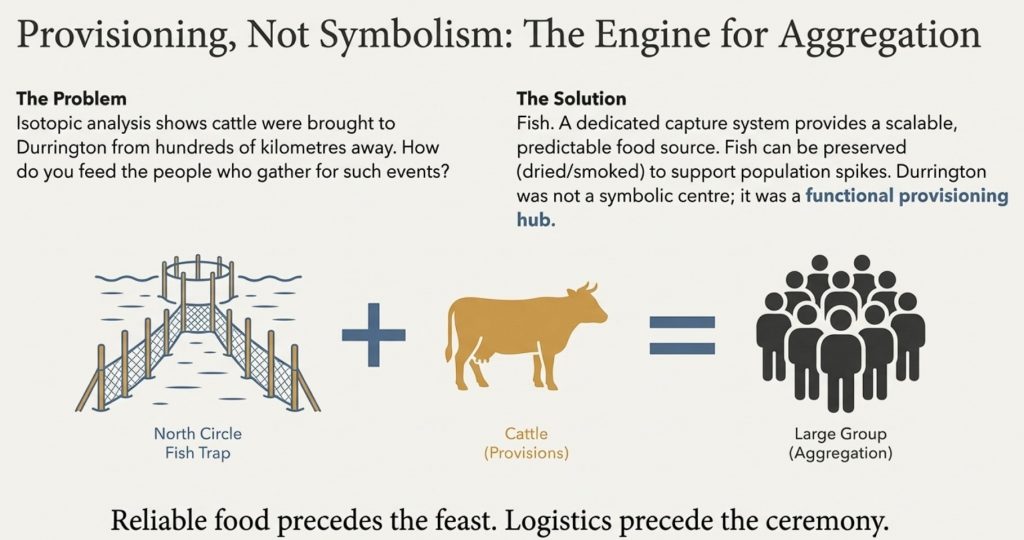


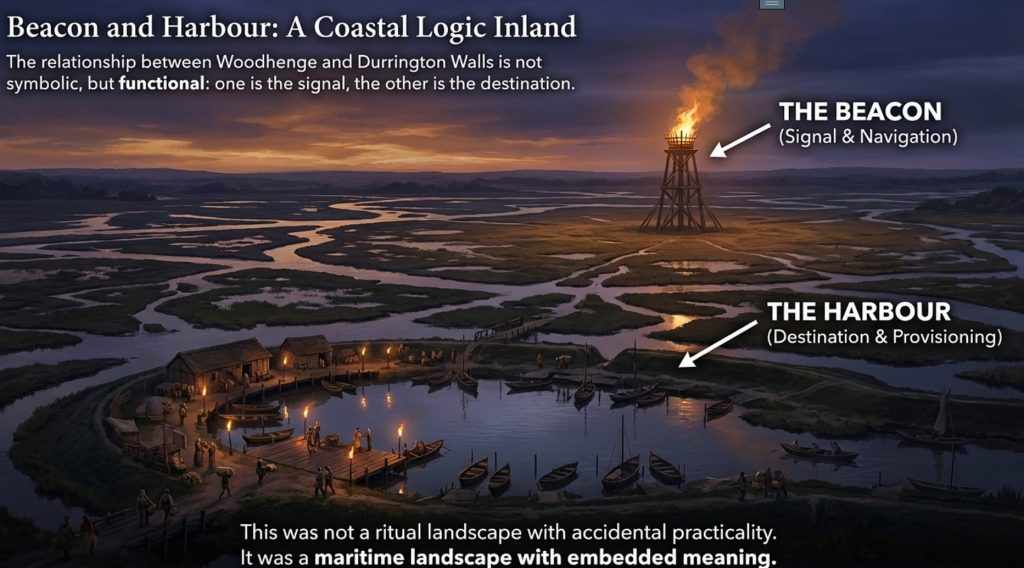
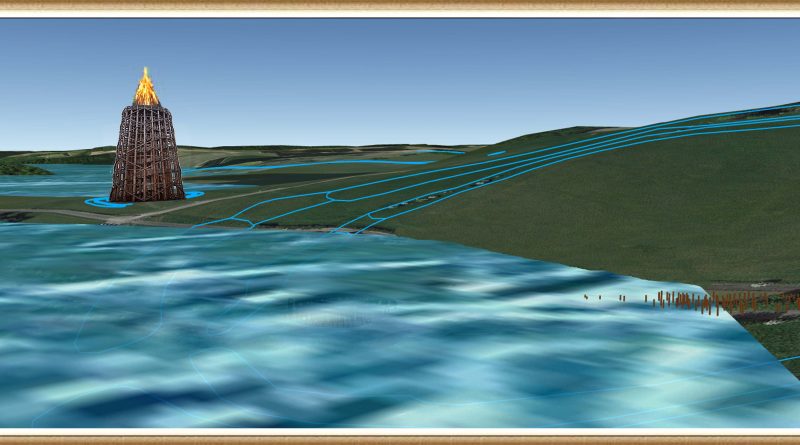

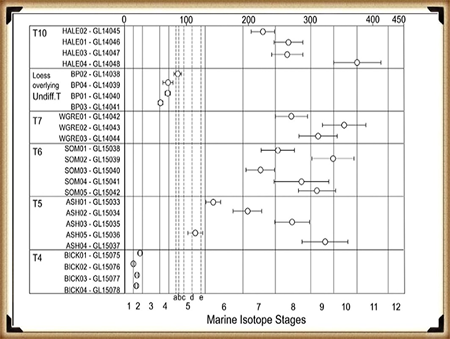
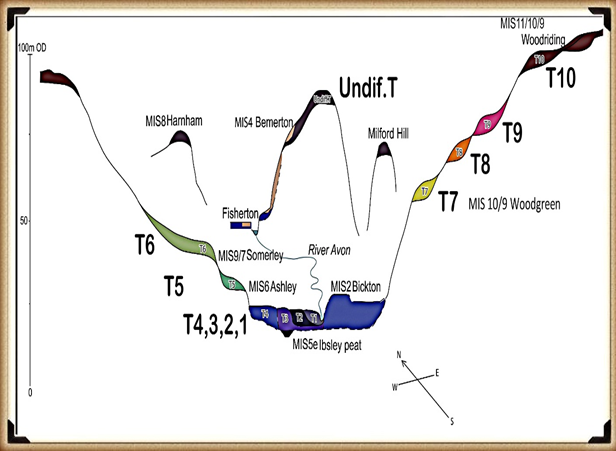
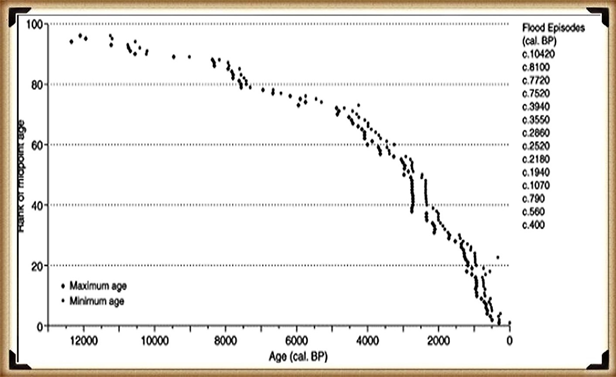
 How much bigger was the Avon?
 What does this mean for Stonehenge?
 Why this matters:
 The real question is not if Stonehenge was surrounded by water. It is when, and how many times it happened during its long prehistory.