How a “Lost World” Beneath the North Sea Went from Marginal Theory to Accepted Fact
Introduction
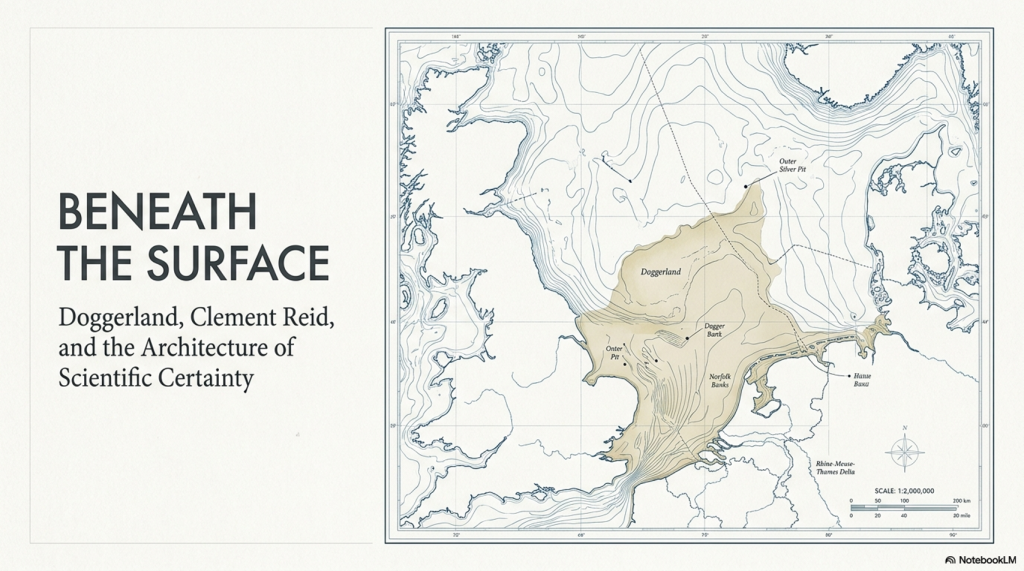
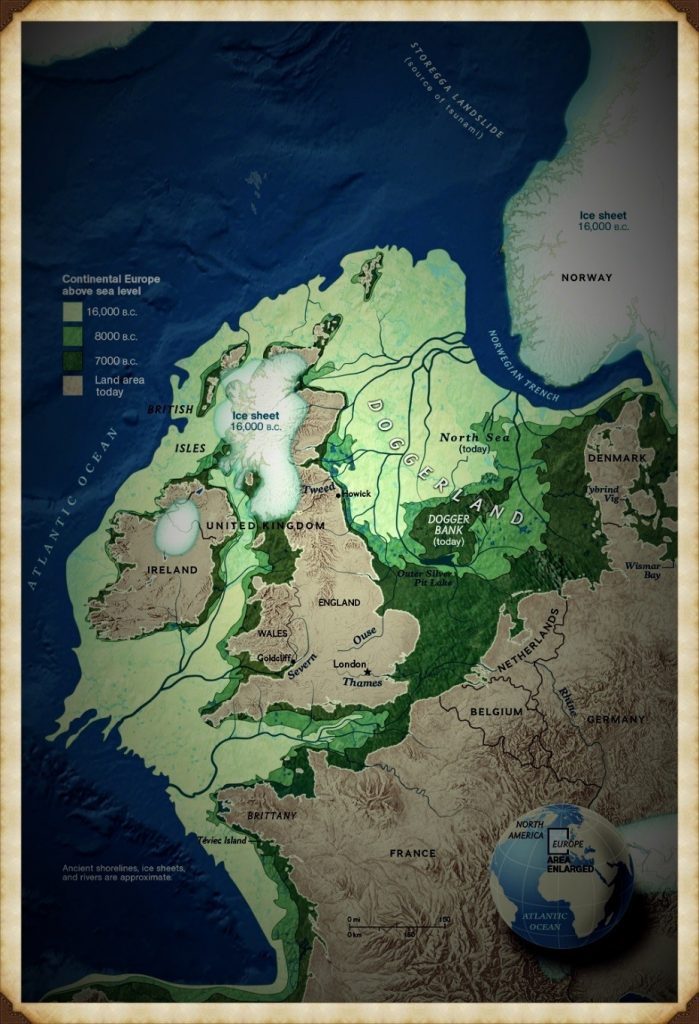
In 1913, the British geologist Clement Reid published a remarkable book titled Submerged Forests. Within its pages, Reid proposed something extraordinary for the time: that Britain had once been connected to continental Europe by a vast prehistoric landscape now submerged beneath the North Sea. (Clement Reid, Doggerland, and the Archaeological Establishment)
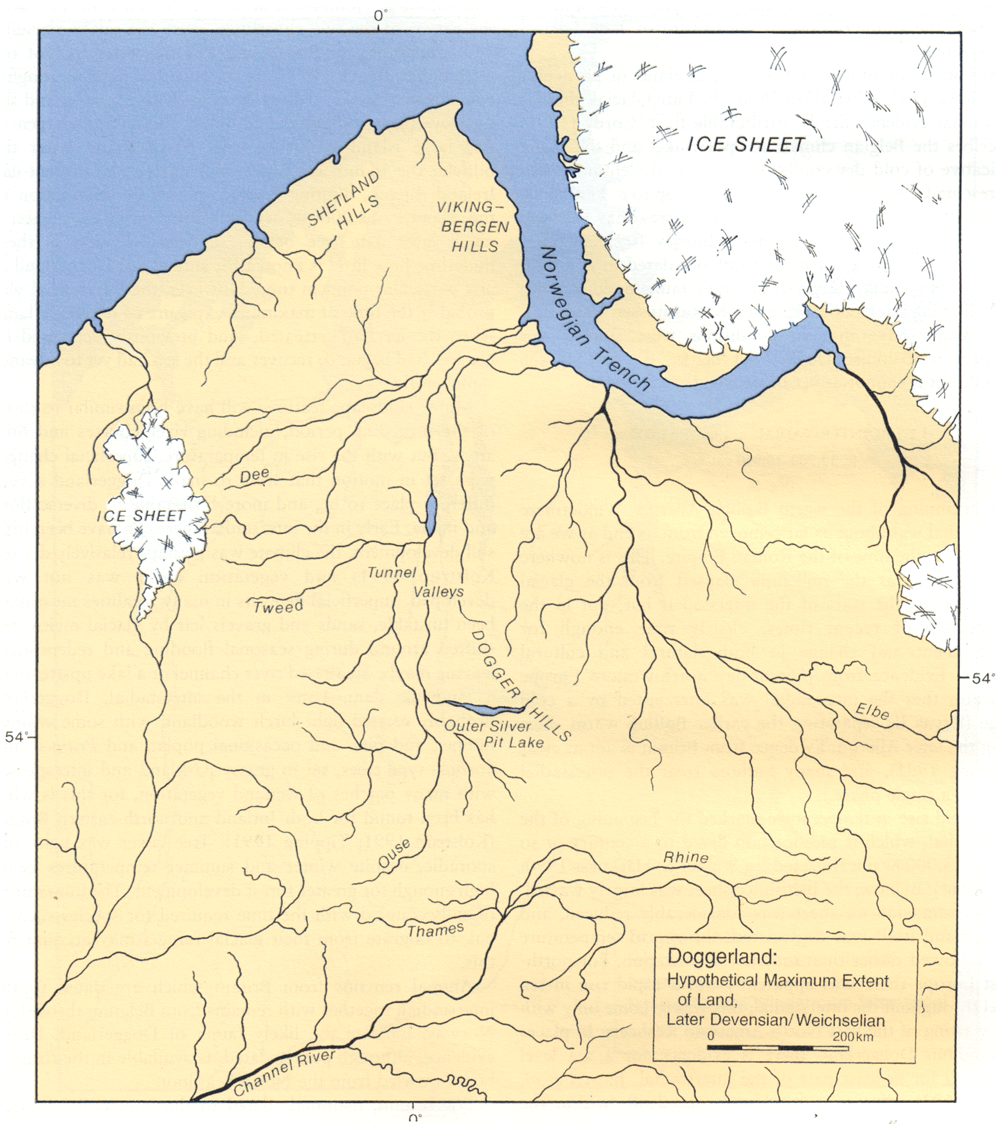
Today, we call this drowned world Doggerland.
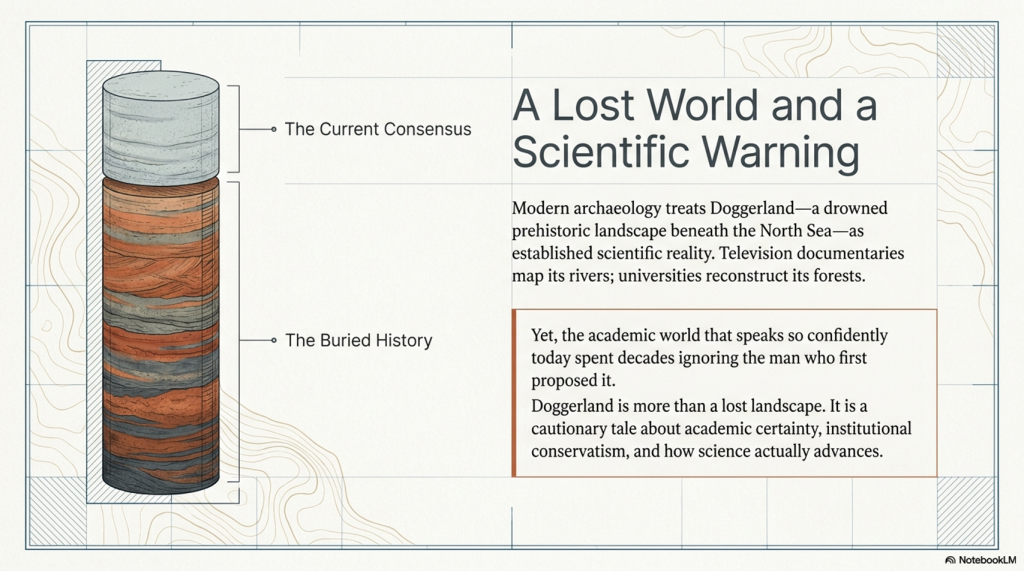
Modern archaeology now treats Doggerland as an established scientific reality. Universities reconstruct its rivers and forests in digital models. Television documentaries present it as one of the most important prehistoric landscapes ever discovered. Entire academic projects are devoted to mapping its vanished terrain.
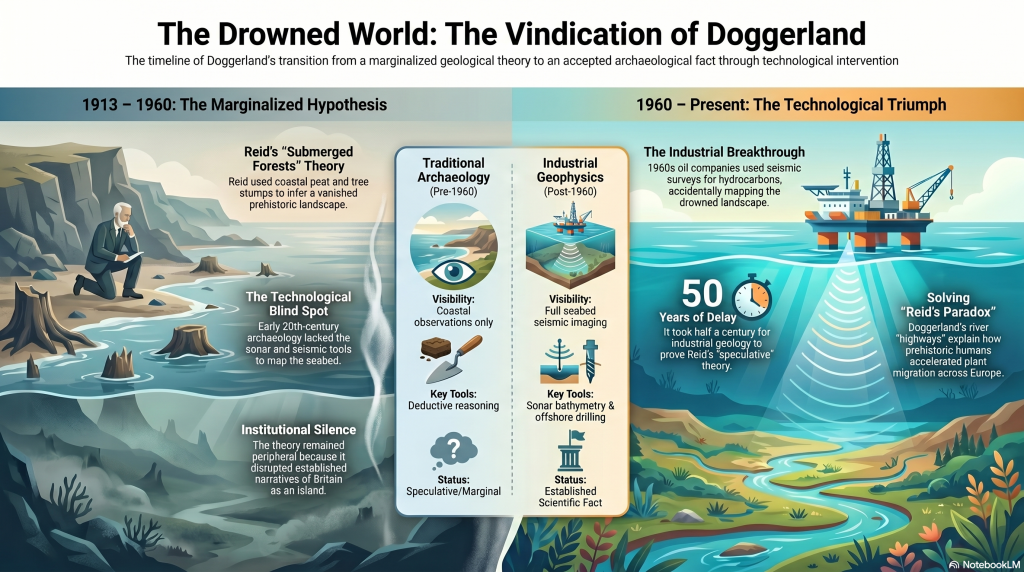
Yet what is rarely discussed is that when Reid first proposed the idea, it sat largely outside accepted archaeological thinking. His conclusions were not embraced as visionary science. They were treated as speculative and peripheral because the evidence challenged the prevailing understanding of Britain’s prehistoric past.
The irony is remarkable.
(Clement Reid, Doggerland, and the Archaeological Establishment)
The same academic world that now speaks confidently about Doggerland only fully accepted its existence after industrial oil exploration in the 1960s and 1970s accidentally proved Reid correct through seabed mapping, seismic surveys, and offshore drilling.
Doggerland, therefore, represents far more than a lost landscape.
It represents a cautionary tale about academic certainty itself.
Without it, critics can say:
“Well, Reid was just speculating without evidence.”
But once you include the nineteenth-century finds, the situation changes dramatically.
Because then the historical sequence becomes:
Physical evidence was already being recovered from the North Sea.
Scientists already knew submerged land surfaces existed.
Reid synthesised this evidence into a coherent landscape model.
The implications were still not fully operationalised archaeologically.
Later marine geophysics confirmed the larger landscape physically.
That is a much stronger progression in history and science.
And critically, it reinforces your silence argument:
The evidence was not absent;
The implications simply were not fully pursued.
This section should probably go immediately before “The Britain Clement Reid Saw.”
The Evidence Existed Before Doggerland Had a Name
Long before the term “Doggerland” was ever coined, physical evidence was already emerging from the floor of the North Sea.
Throughout the nineteenth century, North Sea fishermen regularly recovered:
mammoth bones
antlers
peat deposits
submerged tree remains
and even worked flints
while trawling offshore waters.
These discoveries were not isolated curiosities. They demonstrated something fundamentally important:
Large areas beneath the North Sea had once been dry land.
(Clement Reid, Doggerland, and the Archaeological Establishment)
Peat could not form underwater. Trees could not grow on the seabed. Large terrestrial mammals could not inhabit a marine environment. The evidence, therefore, pointed directly toward a drowned prehistoric landscape connecting Britain to continental Europe.
This material heavily influenced early geologists and palaeoenvironmental researchers, including Clement Reid.
By the time Reid published Submerged Forests in 1913, the basic physical evidence for former land surfaces beneath the North Sea already existed. The real issue was not whether the land had once been exposed, but whether the scientific world was prepared to grasp the full implications of what that meant for prehistory, migration, and the ancient geography of Britain.
That distinction is crucial.
Doggerland was not suddenly invented by modern archaeology.
The evidence had been sitting in fishing nets for decades.
The Britain Clement Reid Saw
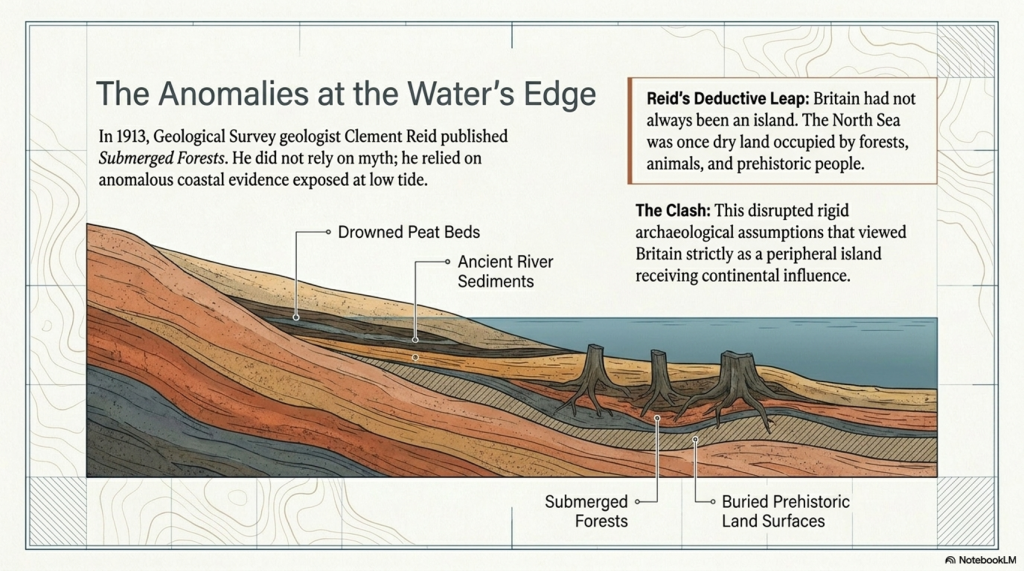
Reid was not a fantasist or fringe writer. He was a respected geologist with the Geological Survey who specialised in ancient landscapes, fossil plants, and environmental reconstruction.
While studying Britain’s coastlines, he repeatedly encountered strange evidence:
submerged forests exposed at low tide
drowned peat beds
ancient river sediments beneath the sea
tree stumps emerging from beaches
buried prehistoric land surfaces offshore
To Reid, the implications were obvious.
Britain had not always been an island.
Large parts of what is now the North Sea must once have been dry land occupied by forests, animals, and prehistoric people.
At the time, however, archaeology still operated within relatively rigid geographical assumptions. Britain was largely viewed as a peripheral island receiving cultural influence from continental Europe, rather than as part of a major prehistoric continental landscape in its own right.
Reid’s conclusions disrupted that simplicity.
(Clement Reid, Doggerland, and the Archaeological Establishment)
The Problem: Nobody Could See the North Sea Floor
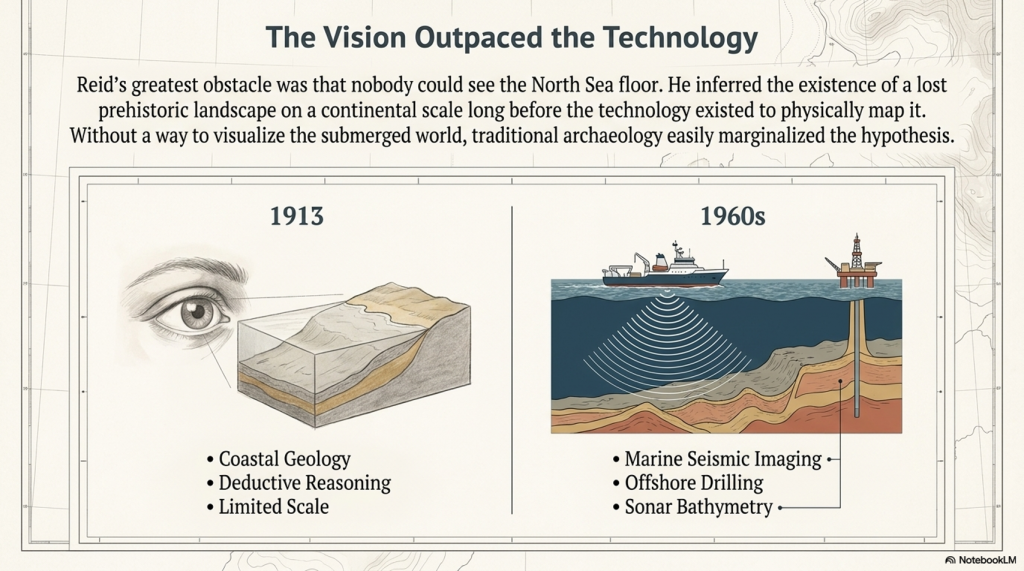
The greatest obstacle Reid faced was technological.
In 1913, there was no practical way to visualise the submerged landscape beneath the North Sea on a continental scale.
There was:
no marine seismic imaging
no industrial offshore drilling
no sonar bathymetry
no digital seabed modelling
no large-scale geophysical mapping
Reid’s argument, therefore, relied primarily upon coastal geology, submerged forests, peat deposits, and deductive reasoning.
To many archaeologists, this made the hypothesis easy to marginalise.
This is important because modern archaeology often presents Doggerland as though it emerged naturally from gradual academic progress. In reality, the idea remained on the fringes largely because the physical landscape itself could not yet be properly mapped.
(Clement Reid, Doggerland, and the Archaeological Establishment)
Then Came the Oil Industry
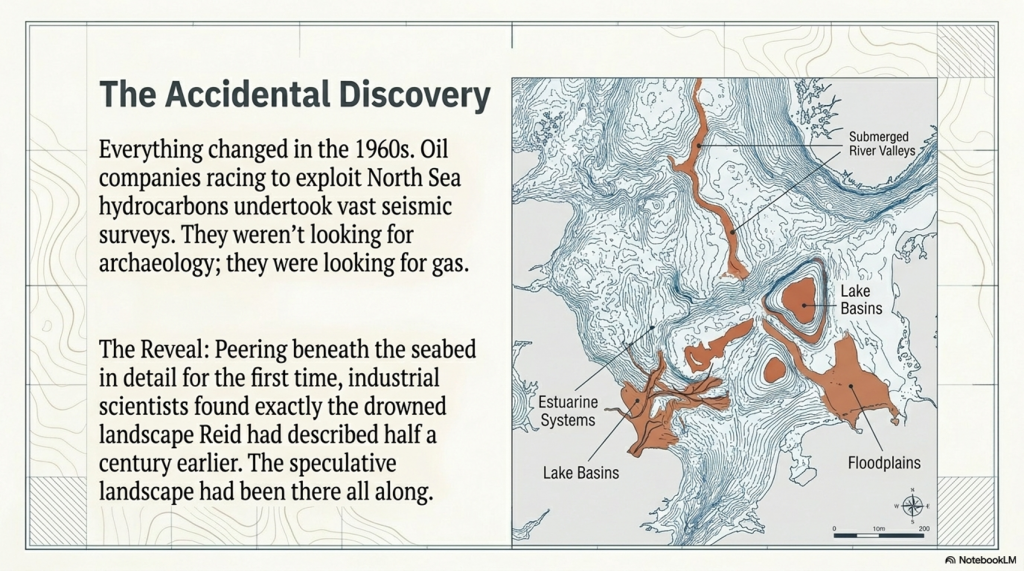
Everything changed in the 1960s with the race to exploit North Sea oil and gas reserves.
Oil companies were not searching for archaeology.
They were searching for hydrocarbons.
To locate them, they began undertaking vast geological and seismic surveys across the North Sea basin. For the first time in human history, scientists could effectively peer beneath the seabed in detail.
And what did they find?
Exactly the kind of drowned landscape Reid had described half a century earlier.
The surveys revealed:
submerged river valleys
ancient coastlines
lake basins
estuarine systems
floodplains
peat deposits
glacial and post-glacial landscapes
Modern seismic data have conclusively demonstrated that a vast habitable lowland once connected Britain to continental Europe.
The “speculative” landscape had been there all along.
Why Doggerland Still Wasn’t Fully Understood in the 1980s and 1990s
Even after North Sea oil exploration began revealing enormous submerged landscapes beneath the seabed, Doggerland still did not immediately transform archaeology.
This raises an important question:
If the seismic evidence existed by the 1970s and 1980s, why did it take until the early twenty-first century for Doggerland to become a mainstream archaeological reality?
The answer lies in a combination of corporate secrecy, technological limitation, and disciplinary separation.
(Clement Reid, Doggerland, and the Archaeological Establishment)
1. The Data Was Effectively Locked Away
The seismic surveys were conducted by private oil and gas companies.
These corporations spent enormous sums collecting offshore geophysical data and treated it as commercially valuable intellectual property. Academic archaeologists generally had little or no access to the datasets.
More importantly, the oil industry had no interest in prehistoric landscapes.
Their objective was to find hydrocarbons buried kilometres beneath the seabed. The shallow upper layers, containing ancient river valleys, peat beds, and drowned terrain, were largely treated as geological overburden — background material that had to be filtered out to reach the economically important strata below.
As a result, some of the clearest evidence for Doggerland physically existed for decades before archaeology could meaningfully examine it.
2. The Computers Were Not Yet Powerful Enough
Modern reconstructions of Doggerland depend upon enormous quantities of three-dimensional seismic and bathymetric data stitched together across thousands of square kilometres.
In the 1980s and early 1990s, this was technologically extremely difficult.
Universities generally lacked:
the computing power,
data storage,
rendering capability,
and processing speed
required to integrate these vast offshore datasets into coherent prehistoric landscape models.
Only in the late 1990s and early 2000s did computing technology finally become capable of handling the scale of data required to reconstruct the drowned North Sea plain properly.
3. Geologists and Archaeologists Were Working in Isolation
Perhaps most importantly, the relevant disciplines were not communicating effectively.
Oil geologists viewed the shallow seabed primarily as a barrier obscuring deeper oil-bearing strata.
Archaeologists, meanwhile, understood that prehistoric populations had once occupied areas now submerged beneath the North Sea, but lacked the marine geophysical tools necessary to visualise the landscape itself.
The two fields largely operated independently of one another.
Only in the early 2000s did serious interdisciplinary collaboration begin, combining:
offshore seismic data,
marine geology,
palaeoenvironmental reconstruction,
and archaeology
into a unified model of the drowned prehistoric landscape.
By then, Clement Reid had been dead for almost a century.
(Clement Reid, Doggerland, and the Archaeological Establishment)
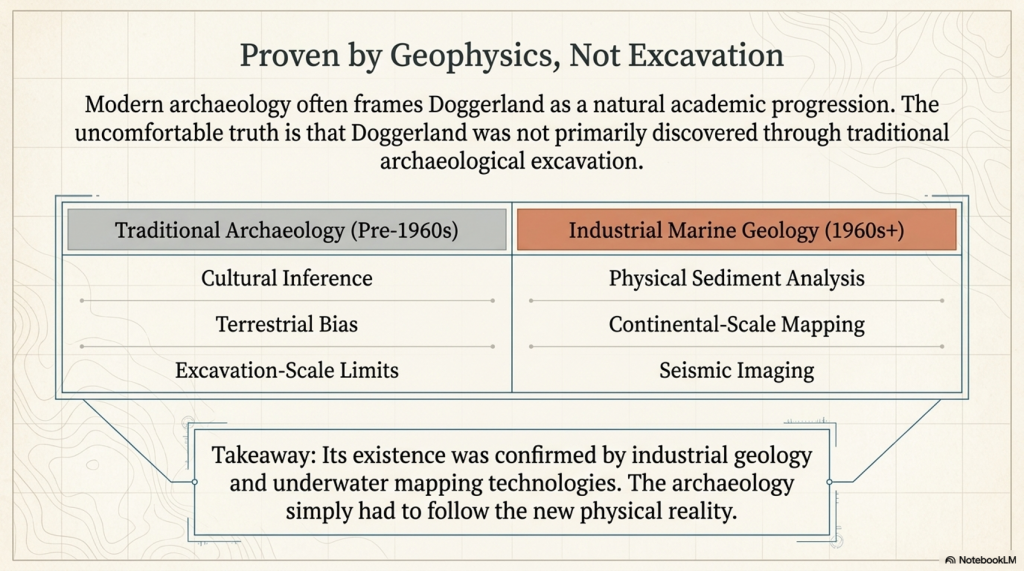
Doggerland Was Proven by Geology — Not Traditional Archaeology
This is the crucial point often overlooked.
Doggerland was not primarily discovered through excavation in the traditional archaeological sense.
Its existence was confirmed by:
marine geophysics
industrial seismic imaging
offshore geological surveys
sediment analysis
underwater mapping technologies
The archaeology followed afterwards.
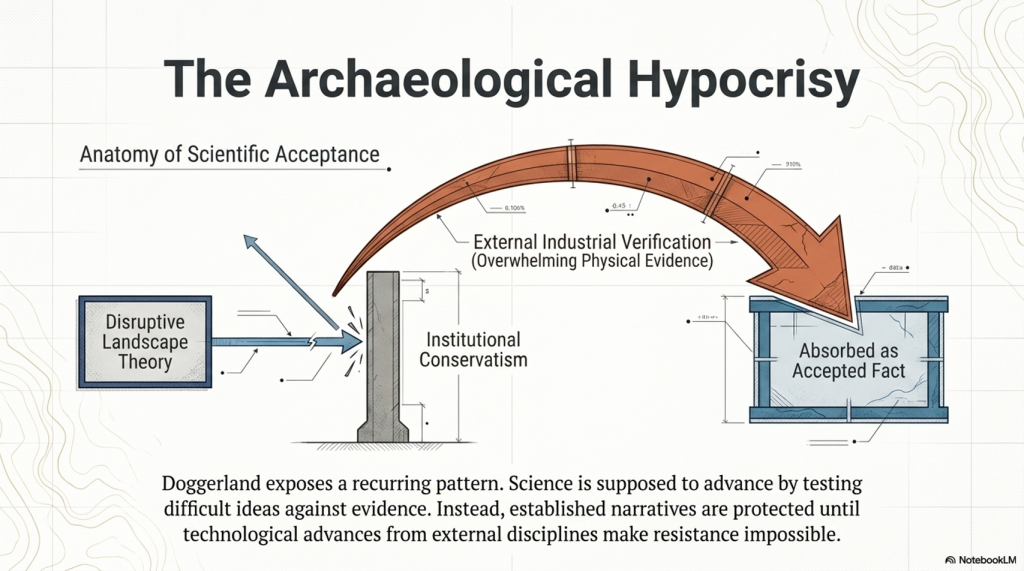
This matters because it reveals an uncomfortable pattern that repeats throughout the history of archaeology:
A disruptive landscape theory is proposed.
It struggles against established narratives.
Independent sciences later produce overwhelming physical evidence.
Archaeology absorbs the new reality as an accepted fact.
Doggerland is therefore not merely a triumph of archaeology.
It is equally a triumph of geology, marine science, and technological surveying.
(Clement Reid, Doggerland, and the Archaeological Establishment)
Silence Is Not the Same as Acceptance
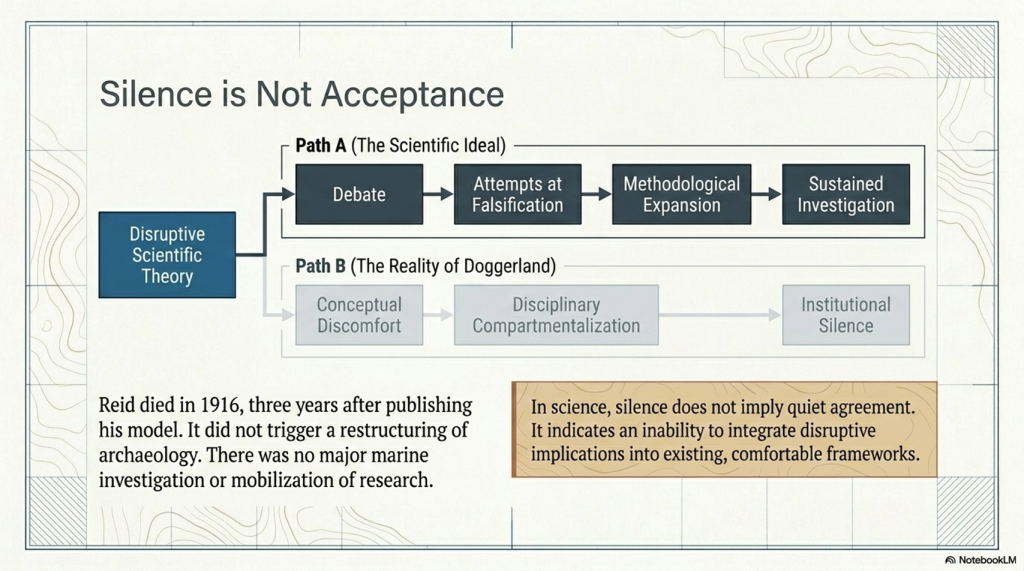
One of the most revealing aspects of Clement Reid’s work is not open hostility, but relative silence.
Modern archaeology often gives the impression that Reid’s submerged landscape ideas were gradually and quietly accepted by the scientific world. But in science, silence does not necessarily imply agreement or acceptance.
Quite often, it indicates something very different:
conceptual discomfort
technological limitation
disciplinary compartmentalisation
or an inability to integrate disruptive implications into existing frameworks.
If a scientific theory genuinely transforms a discipline, it normally generates:
debate
criticism
attempts at falsification
methodological expansion
and sustained investigation.
Had Albert Einstein published relativity only for physics to largely ignore it for decades, nobody would argue that relativity had therefore been “quietly accepted.” The opposite conclusion would be drawn — that the scientific world had not yet fully absorbed the implications of the theory.
The same pattern appears in the history of Doggerland.
Reid published Submerged Forests in 1913, the same year he retired from the Geological Survey after a distinguished scientific career. He died only three years later in 1916. During that short remaining period, his drowned landscape model did not trigger a major transformation in archaeology or prehistoric reconstruction.
There was:
no large-scale marine investigation programme
no major archaeological restructuring around submerged landscapes
no widespread mobilisation of prehistoric research into the North Sea basin
Instead, the idea remained scientifically peripheral for decades.
This is important because it suggests that the scientific world of the early twentieth century was not fully equipped — technologically or conceptually — to grasp the scale of what Reid was implying.
He had inferred the existence of a lost prehistoric landscape beneath the North Sea long before the technology existed to visualise it properly.
Only later did:
marine geophysics
seismic profiling
sonar mapping
offshore drilling
and North Sea oil exploration
Finally, transform Reid’s geological inference into a physically visible drowned world.
In this sense, the muted reception of Reid’s work may itself be evidence of how disruptive and difficult its implications truly were for the scientific establishment of the time to fully comprehend.
(Clement Reid, Doggerland, and the Archaeological Establishment)
The Archaeological Hypocrisy
Today, archaeologists speak with complete confidence about Doggerland.
It appears in textbooks, museums, documentaries, and university lectures as settled science.
Yet very few openly acknowledge that:
the original theory existed outside mainstream archaeological thinking
the idea was treated cautiously for decades
and it was only overwhelming physical evidence from external sciences that forced universal acceptance
This is not how science is supposed to operate.
Science advances by testing difficult ideas against evidence — not by protecting established narratives until technological advances make resistance impossible.
Doggerland demonstrates how institutional conservatism can delay acceptance even when the underlying reasoning is sound.
(Clement Reid, Doggerland, and the Archaeological Establishment)
The Same Pattern Appears Elsewhere
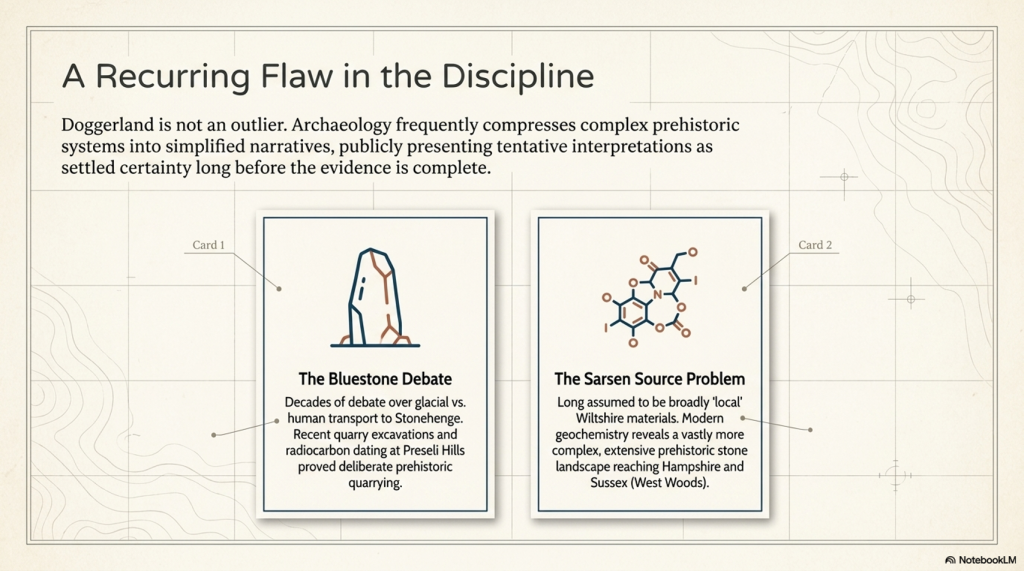
Doggerland is not an isolated example.
The same tendency toward premature certainty recurs throughout archaeology.
1. The Bluestone Debate
For decades, debate surrounded how the Stonehenge bluestones reached Salisbury Plain.
While their Welsh origin was widely accepted, archaeologists remained divided over whether the stones were deliberately transported by humans or partially carried by glacial processes.
Over time, quarry excavations in the Preseli Hills, associated hearths, and radiocarbon evidence increasingly strengthened the case for deliberate prehistoric quarrying and transport.
The important issue is not that archaeology asks questions — that is, healthy science.
The issue is how tentative interpretations are often presented publicly as settled certainty long before the evidence is complete.
2. The Sarsen Source Problem
For many years, Stonehenge narratives simplified the sarsens as broadly “local” materials derived from nearby Wiltshire landscapes.
More recent geochemical work has considerably complicated that picture.
While West Woods appears to have been a major source of many of the principal stones, the wider sarsen distribution across southern Britain indicates a far more extensive prehistoric stone landscape extending into Hampshire and Sussex.
The significance is not simply geological.
It demonstrates again how archaeology frequently compresses complex prehistoric systems into simplified narratives that later evidence must revise.
Doggerland followed exactly the same trajectory.
(Clement Reid, Doggerland, and the Archaeological Establishment)
3. The Prehistoric Dyke Problem
For generations, large linear earthworks such as:
Offa’s Dyke
Wansdyke
Car Dyke
and the Vallum
have been interpreted primarily as defensive or territorial boundaries.
Yet many of these structures display characteristics difficult to reconcile with simple military explanations:
inconsistent defensive logic
discontinuous alignments
relationships with wetlands and floodplains
hydraulic behaviour
and associations with water-retaining landscapes.
Increasingly, alternative interpretations suggest that at least some of these monumental earthworks may have functioned partly as:
canals,
water-management systems,
transport corridors,
or integrated hydrological infrastructure.
The important point is not that traditional archaeology asked questions.
The issue is that defensive interpretations often became entrenched long before large-scale hydrological modelling, lidar analysis, and landscape engineering perspectives were properly integrated into archaeological interpretation.
Once again, the pattern resembles Doggerland:
A landscape system existed physically in front of investigators for generations, yet the underlying functional logic remained poorly understood because the dominant interpretive framework constrained how the evidence was viewed.
4. Hydrology: The Missing Discipline
Perhaps the deepest parallel between Doggerland and wider prehistoric archaeology is hydrology itself.
Doggerland was ultimately misunderstood because archaeology failed to properly integrate changing sea levels, marine landscapes, river systems, and submerged environmental reconstruction into prehistoric interpretation.
But remarkably, a similar problem also appears across terrestrial archaeology.
For much of the twentieth century, archaeology often treated ancient landscapes as though modern drainage conditions broadly reflected prehistoric reality.
Yet post-glacial Britain was radically different:
groundwater levels were higher
floodplains were wetter
wetlands were more extensive
chalk aquifers behaved differently
rivers occupied larger channels
and seasonal inundation transformed movement and settlement patterns.
In many cases, archaeologists interpreted prehistoric structures without fully integrating the hydrological conditions under which they originally operated.
This may have profoundly affected interpretations of:
ditches
causeways
river transport
wetland occupation
monument placement
and large linear earthworks.
The irony is extraordinary.
In Doggerland studies, archaeology initially underestimated the role of marine hydrology and drowned landscapes.
In terrestrial archaeology, it may have simultaneously underestimated inland hydrology and water-dominated land environments.
The same disciplinary weakness appears in reverse.
In both cases, the result was similar: prehistoric landscapes were interpreted through modern environmental assumptions rather than reconstructed hydrological realities.
(Clement Reid, Doggerland, and the Archaeological Establishment)
Reid’s Other Problem: The Mystery of Rapid Plant Migration
Clement Reid’s importance to prehistoric science extends far beyond Doggerland.
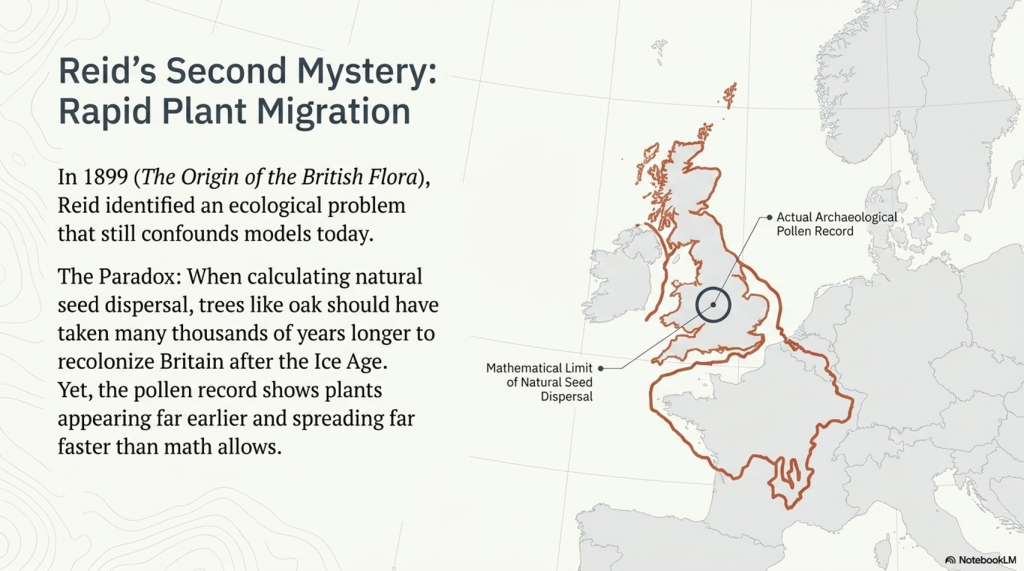
In 1899, more than a decade before Submerged Forests, Reid published another remarkable work: The Origin of the British Flora. Within it, he identified a problem that still challenges ecology today — what later became known as Reid’s Paradox of Rapid Plant Migration.
The paradox is deceptively simple.
When scientists calculate how quickly plants naturally spread through seed dispersal alone, the results are extremely slow. Trees such as oak should have taken many thousands of years longer to recolonise Britain after the Ice Age than the archaeological and pollen evidence suggests.
Yet across Europe and Britain, plants repeatedly appear far earlier and spread far faster than traditional dispersal models predict.
Even modern ecology still struggles to explain this properly.
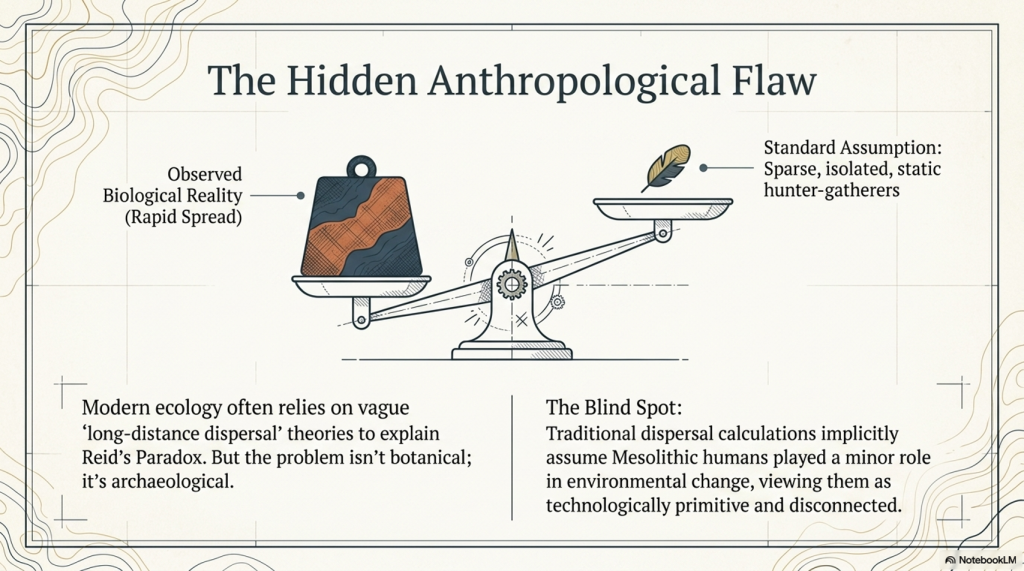
The standard explanation usually invokes vague concepts such as “long-distance dispersal,” but this often amounts to little more than admitting that the mathematics and the observed reality do not match.
But what if the problem is not botanical?
What if the problem is archaeological?
(Clement Reid, Doggerland, and the Archaeological Establishment)
The Hidden Assumption Inside Reid’s Paradox
Traditional dispersal models largely assume that prehistoric humans played only a minor role in environmental change.
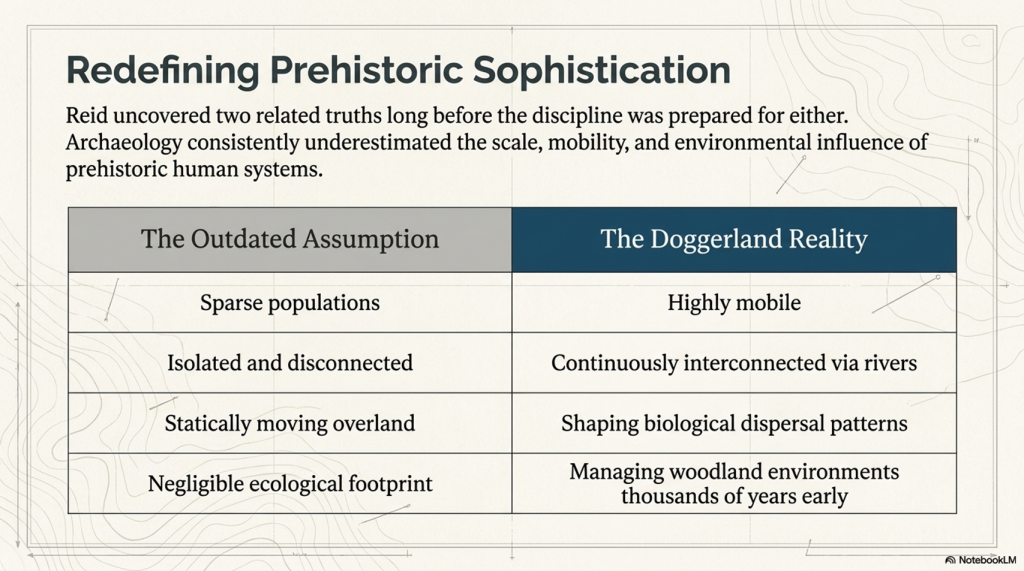
Implicit within many calculations is an outdated image of Mesolithic people as:
sparse populations
isolated hunter-gatherers
technologically primitive
and largely disconnected from one another.
But the growing evidence from Doggerland and post-glacial Britain increasingly points toward something very different.
The Mesolithic world appears to have been highly mobile, river-based, and interconnected.
Once this possibility is introduced, Reid’s Paradox becomes far less mysterious.
(Clement Reid, Doggerland, and the Archaeological Establishment)
Rivers Were the Highways of the Mesolithic World
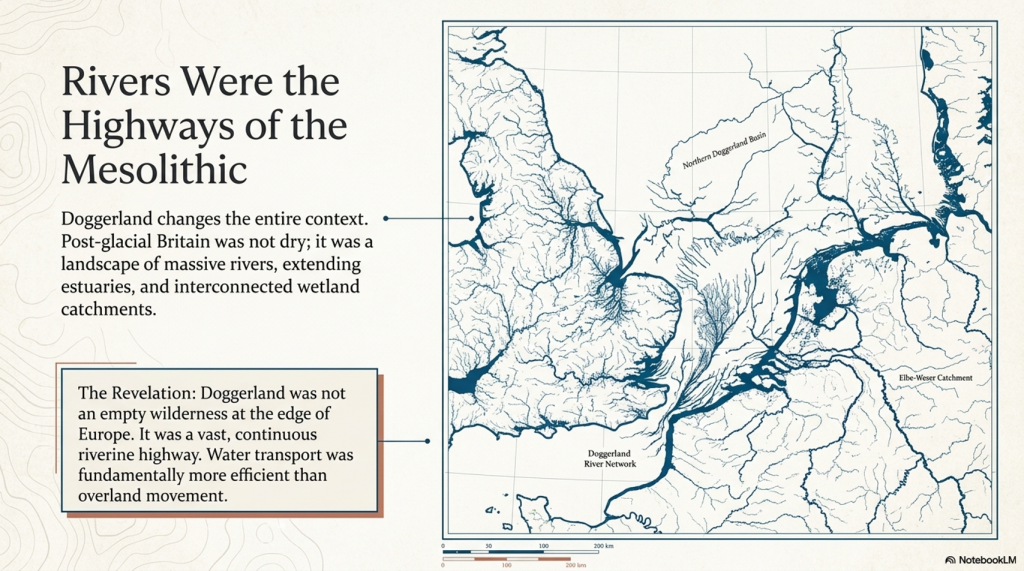
Under post-glacial conditions, Britain was not the dry landscape we know today.
Research into post-glacial hydrology increasingly suggests that:
rivers were larger
estuaries extended far inland
wetlands interconnected catchments
and water transport was likely easier and more efficient than overland movement.
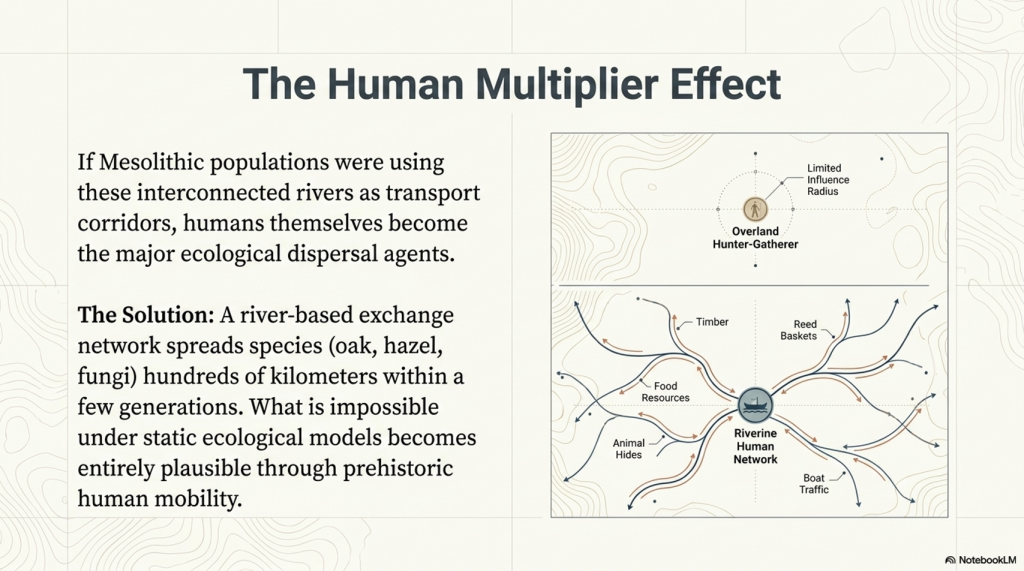
If Mesolithic populations used rivers and coastlines as transport corridors, then humans themselves became major agents of ecological dispersal.
Seeds, spores, and plants could spread through:
food transport
reeds and basket materials
animal hides
timber movement
boat traffic
stored resources
and simple repeated human movement along waterways.
The consequences are profound.
A river-based exchange network could spread species hundreds of kilometres within only a few generations — vastly faster than traditional natural dispersal models allow.
What appears impossible under static ecological models becomes entirely plausible once prehistoric mobility is properly considered.
Doggerland Changes the Entire Context
This is where Doggerland becomes critically important.
A connected North Sea plain linking Britain to continental Europe would not merely have allowed human migration — it would have enabled continuous ecological exchange across vast interconnected river systems.
The prehistoric populations living within this landscape may have accelerated the spread of:
oak
hazel
edible plants
fungi
wetland species
and managed woodland environments
far beyond what purely natural dispersal models predict.
In this sense, Reid may have uncovered two related truths long before archaeology was prepared to accept either of them:
Britain was once connected to Europe by a vast lost landscape.
Mesolithic humans were likely far more mobile, interconnected, and environmentally influential than traditional archaeology once believed.
(Clement Reid, Doggerland, and the Archaeological Establishment)
The Real Lesson
The irony is remarkable.
Clement Reid identified both Doggerland and the plant migration paradox decades before the technologies or archaeological models existed to fully explain them.
In both cases, the underlying issue may have been the same:
Archaeology consistently underestimated the sophistication, mobility, and scale of prehistoric human systems.
Doggerland was not an empty wilderness at the edge of Europe.
It may have been part of a vast interconnected riverine world whose people reshaped landscapes, ecosystems, and biological dispersal patterns thousands of years before conventional history was prepared to recognise it.
(Clement Reid, Doggerland, and the Archaeological Establishment)
Conclusion
Doggerland now stands as one of the most important prehistoric discoveries in Europe.
But its history should also serve as a warning.
In 1913, Clement Reid proposed that a drowned prehistoric landscape once connected Britain to Europe. His conclusions were treated cautiously and remained outside mainstream archaeological thinking for decades.
Then, half a century later, oil companies searching for hydrocarbons accidentally proved him correct.
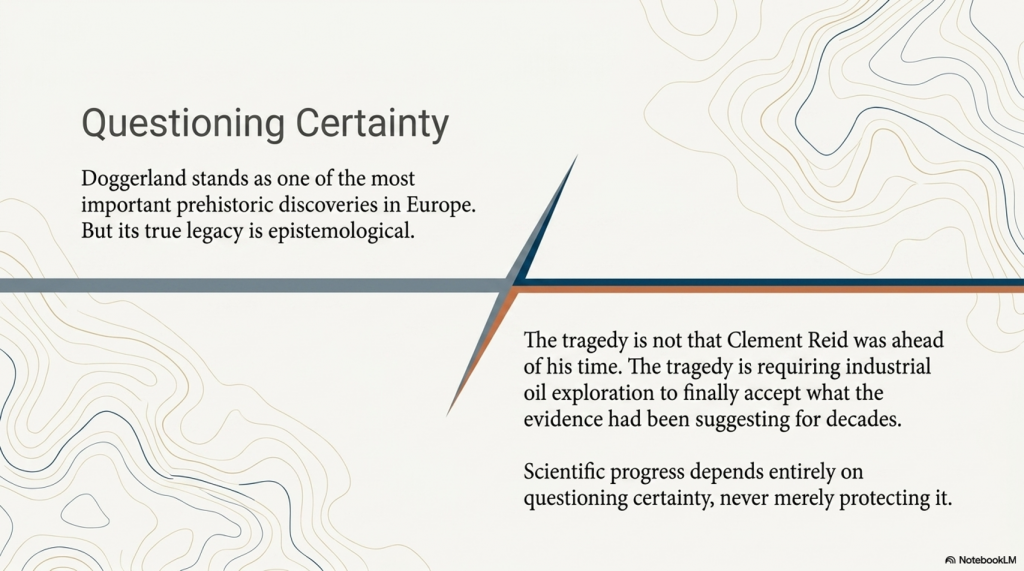
The tragedy is not that Reid was ahead of his time.
The tragedy is that archaeology required industrial geology and offshore oil exploration to finally accept what the evidence had already been suggesting for years.
Doggerland should therefore be remembered not only as a lost world beneath the North Sea —
But as a reminder that scientific progress depends upon questioning certainty, not protecting it.
(Clement Reid, Doggerland, and the Archaeological Establishment)
PODCAST
Author’s Biography
Robert John Langdon, a polymathic luminary, emerges as a writer, historian, and eminent specialist in LiDAR Landscape Archaeology.
His intellectual voyage has been interwoven with stints as an astute scrutineer in government and grand corporate bastions, a tapestry spanning British Telecommunications, Cable and Wireless, British Gas, and the esteemed University of London.
A decade hence, Robert’s transition into retirement unfurled a chapter of insatiable curiosity. This phase saw him immerse himself in Politics, Archaeology, Philosophy, and the enigmatic realm of Quantum Mechanics. His academic odyssey traversed the venerable corridors of knowledge hubs such as the Museum of London, University College London, Birkbeck College, The City Literature Institute, and Chichester University.
In the symphony of his life, Robert is a custodian of three progeny and a pair of cherished grandchildren. His sanctuary lies ensconced in the embrace of West Wales, where he inhabits an isolated cottage, its windows framing a vista of the boundless sea – a retreat from the scrutinising gaze of Her Majesty’s Revenue and Customs, an amiable clandestinity in the lap of nature.
Exploring Prehistoric Britain: A Journey Through Time
My blog delves into the fascinating mysteries of prehistoric Britain, challenging conventional narratives and offering fresh perspectives grounded in cutting-edge research, particularly LiDAR technology. I invite you to explore some key areas of my research. For example, the Wansdyke, often cited as a defensive structure, is re-examined in light of new evidence. I’ve presented my findings in my blog post Wansdyke: A British Frontier Wall – ‘Debunked’, and a Wansdyke LiDAR Flyover video further visualises my conclusions.
My work also often challenges established archaeological dogma. I argue that many sites, such as Hambledon Hill, commonly identified as Iron Age hillforts, are not what they seem. My posts Lidar Investigation Hambledon Hill – NOT an ‘Iron Age Fort’ and Unmasking the “Iron Age Hillfort” Myth explore these ideas in detail and offer an alternative view. Similarly, sites like Cissbury Ring and White Sheet Camp receive re-evaluations based on LiDAR analysis in my posts “Lidar Investigation Cissbury Ring through time”and “Lidar Investigation White Sheet Camp,“ revealing fascinating insights into their true purpose. I have also examined South Cadbury Castle, often linked to the mythical Camelot56.
My research also extends to ancient water management, including the role of canals and other linear earthworks. I have discussed the true origins of Car Dyke in multiple posts, including Car Dyke – ABC News Podcast and Lidar Investigation Car Dyke – North Section, which suggest a Mesolithic origin 2357. I also explore the misidentification of Roman aqueducts, as seen in my posts on the Great Chesters (Roman) Aqueduct. My research has also been greatly informed by my post-glacial flooding hypothesis, which has helped explain landscape transformations over time. I have discussed this hypothesis in several posts, including AI now supports my Post-Glacial Flooding Hypothesis and Exploring Britain’s Flooded Past: A Personal Journey
For those interested in British Prehistory, visit www.prehistoric-britain.co.uk, a comprehensive resource featuring an extensive collection of archaeology articles, modern LiDAR investigations, and groundbreaking research. The site also includes insights and excerpts from the acclaimed Robert John Langdon Trilogy, a series of books that explore Britain during the Prehistoric period. Titles in the trilogy include The Stonehenge Enigma, Dawn of the Lost Civilisation, and The Post-Glacial Flooding Hypothesis, which offer compelling evidence of ancient landscapes shaped by post-glacial flooding.
To further explore these topics, Robert John Langdon has developed a dedicated YouTube channel featuring over 100 video documentaries and investigations that complement the trilogy. Notable discoveries and studies showcased on the channel include 13 Things that Don’t Make Sense in History and the revelation of Silbury Avenue – The Lost Stone Avenue, a rediscovered prehistoric feature at Avebury, Wiltshire.
In addition to his main works, Langdon has released a series of shorter, accessible publications, ideal for readers delving into specific topics. These include:
For active discussions and updates on the trilogy’s findings and recent LiDAR investigations, join our vibrant community on Facebook. Engage with like-minded enthusiasts by leaving a message or contributing to debates in our Facebook Group.
Whether through the books, the website, or interactive videos, we aim to provide a deeper understanding of Britain’s fascinating prehistoric past. We encourage you to explore these resources and uncover the mysteries of ancient landscapes through the lens of modern archaeology.
For more information, including chapter extracts and related publications, visit the Robert John Langdon Author Page. Dive into works such as The Stonehenge Enigma or Dawn of the Lost Civilisation, and explore cutting-edge theories that challenge traditional historical narratives.
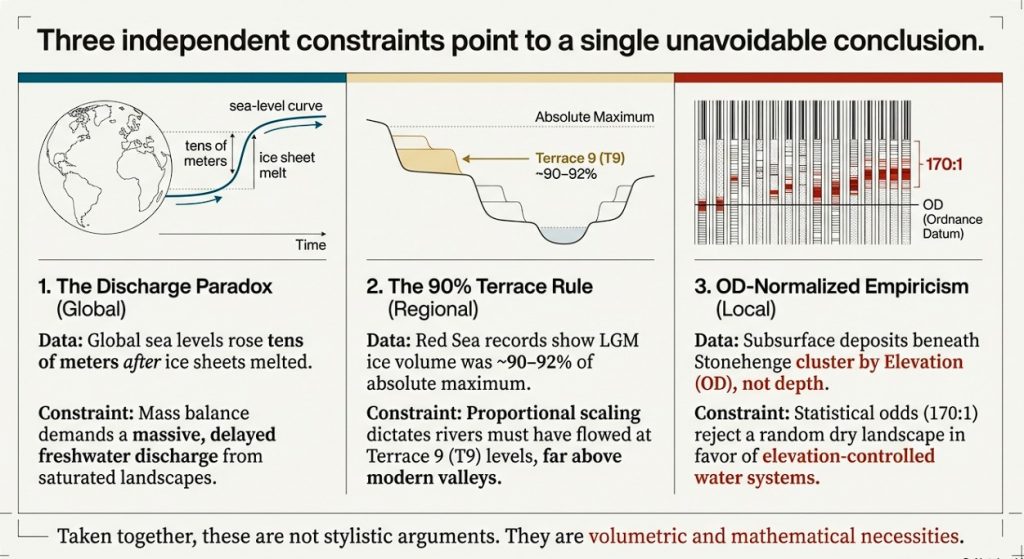
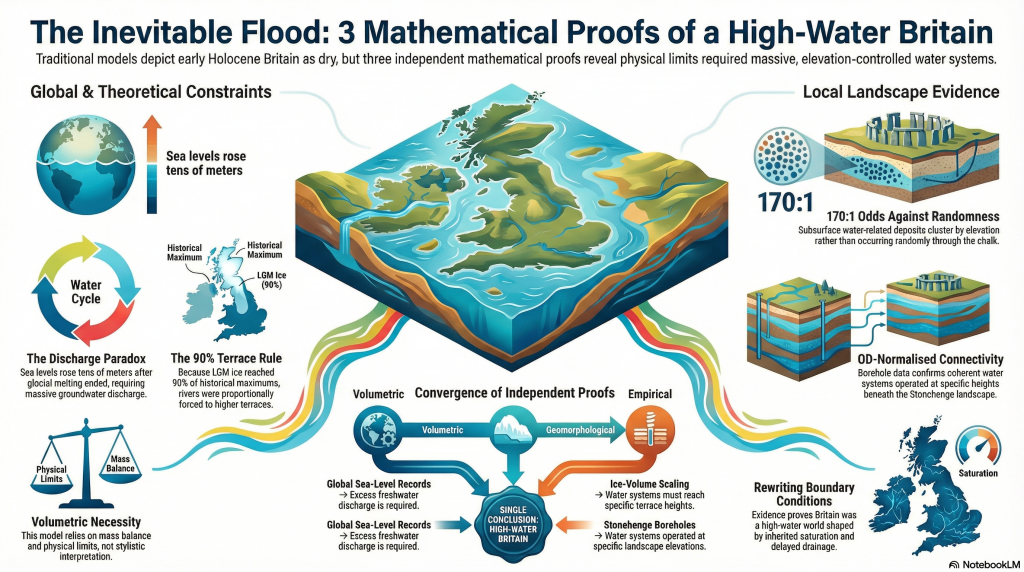
Introduction — Three mathematical proofs that force Post-Glacial Flooding
This article presents three independent mathematical proofs that fundamentally constrain what early Holocene Britain could have looked like. None relies on archaeology. None relies on interpretation. All three are based on physical limits that cannot be negotiated away. (Stonehenge: Borehole Evidence)
Taken together, they do not suggest post-glacial flooding — they require it.
Proof 1 — Sea-level rise without ice: the discharge paradox
High-resolution global sea-level records show that sea level continued to rise by tens of metres after major glacial melting had already ended. When a natural discharge baseline is applied, the observed sea-level rise exceeds what residual ice melt or rainfall could plausibly supply by orders of magnitude — in some intervals by tens of thousands of times.
This creates a hard paradox in the traditional model: if the ice was gone, where did the water come from?
(Stonehenge: Borehole Evidence)
The only physically viable source is delayed drainage from a saturated post-glacial landscape — groundwater, aquifers, and high water tables releasing stored meltwater over millennia. This is not conjecture; it follows directly from mass balance. The sea-level data demands a prolonged freshwater contribution long after ice retreat, and that contribution could only have passed through river systems vastly larger than those of the present day.
This is not a stylistic argument. It is a volumetric one.
Proof 2 — Ice-volume scaling and the 90% terrace rule
Independent Red Sea sea-level records demonstrate that the Last Glacial Maximum (MIS 2) reached approximately 90–92% of the absolute maximum ice volume attained during MIS 12. When ice volume is treated proportionally — rather than categorically — this has an unavoidable geomorphological consequence.
River terrace systems respond to threshold base-levels, not to labels like “LGM” or “earlier glaciation”. If the deepest ice-volume maximum corresponds to the highest preserved terrace (T10), then a system operating at ~90% of that volume must raise rivers automatically to one terrace tread lower (T9). No hydrological modelling is required. This follows directly from proportional scaling.
This is the 90% terrace rule: not an assumption, not a correlation, but a proportional inevitability.
Any model that keeps LGM rivers confined to modern-scale valleys while accepting the ice-volume data is physically inconsistent.
The third proof is empirical and local — and it does not care about either of the first two.
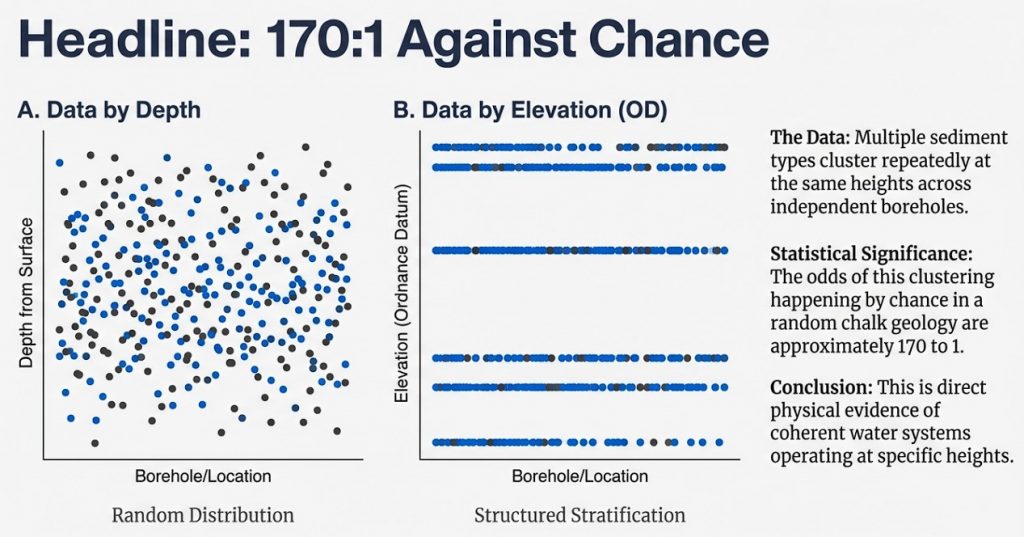
Using borehole matrix data alone, and treating Ordnance Datum height as the primary independent variable, we show that water-related deposits beneath Stonehenge are not randomly distributed through chalk. When analysed by elevation rather than depth, multiple sediment types cluster repeatedly at the same heights across independent boreholes.
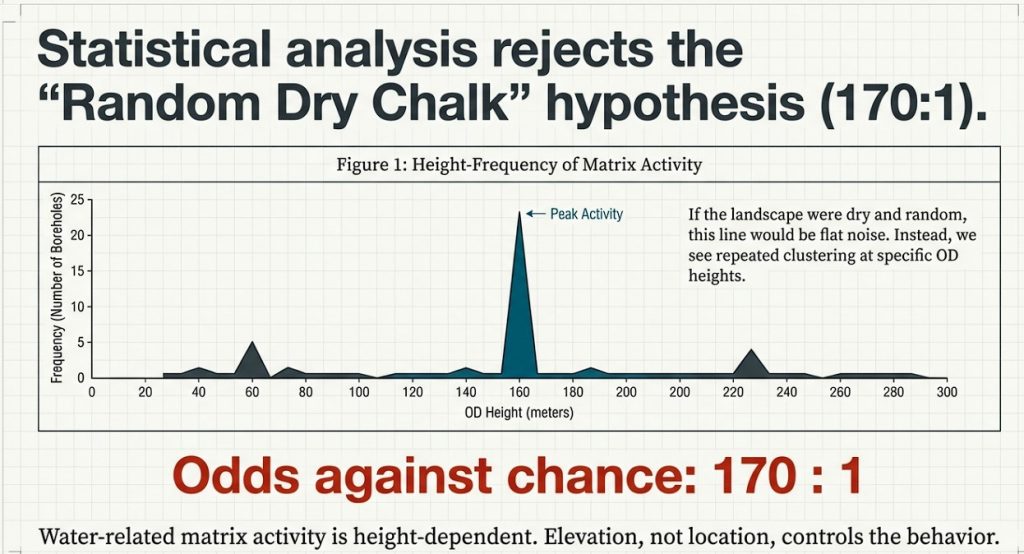
These clusters resolve into discrete elevation zones, and their statistical strength is sufficient to reject a random chalk environment (≈170 : 1 against chance). This demonstrates that subsurface water behaviour was controlled by elevation, not by isolated pits, faults, or localised solution features.
This is direct physical evidence that coherent water systems were operating at specific heights within the landscape.
(Stonehenge: Borehole Evidence)
Why these three proofs matter together
Each of these results stands on its own. None depends on the others.
Sea-level mass balance proves excess freshwater discharge
Ice-volume scaling proves how high water systems must have reached
OD-normalised boreholes prove where water actually operated
When three independent mathematical constraints all point in the same direction, the conclusion is no longer optional.
This is not a reinterpretation of archaeology. It is a rewriting of boundary conditions.
Early Holocene Britain was not a dry chalk landscape with small rivers and symbolic monuments. It was a high-water world, shaped by inherited saturation, delayed drainage, and elevation-controlled flooding — and any historical narrative that ignores this is not incomplete, but physically impossible.
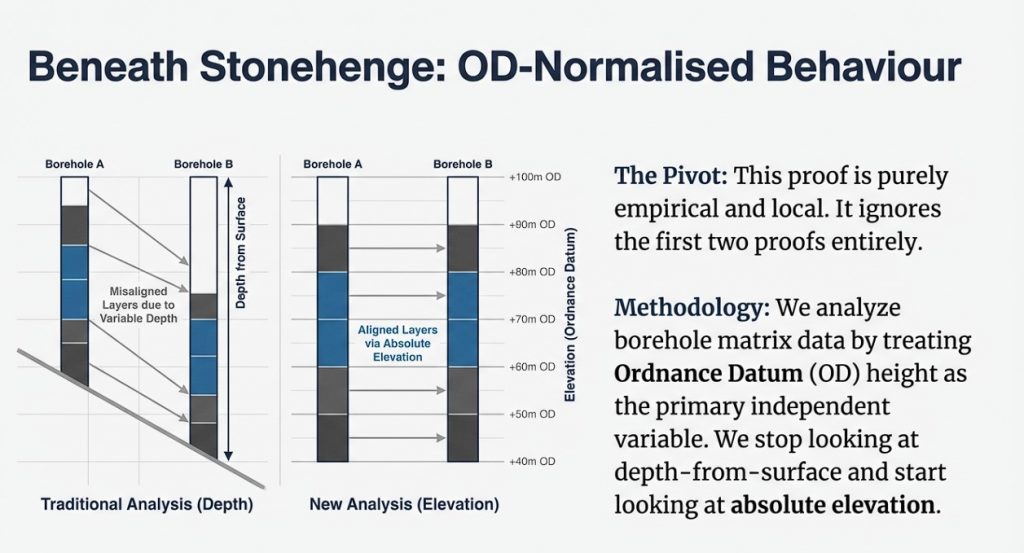
OD-Normalised Borehole Evidence: Establishing Elevation Control
(Stonehenge: Borehole Evidence)
Before any interpretation of Mesolithic structures, postholes, or function, it is necessary to establish a single foundational point:
Does the subsurface beneath Stonehenge behave randomly with depth, or does it respond systematically to elevation (OD height)?
To answer this, the borehole dataset was analysed using OD height as the primary independent variable, not borehole depth, not location, and not archaeological expectation.
This distinction matters. Depth varies from borehole to borehole. Elevation does not.
Phase 1 — OD height normalisation (methodological foundation)
Each borehole was reconstructed into a height-centric dataset by:
Converting all logged matrix thicknesses to OD start and end heights
Assigning a midpoint OD to each water-related matrix band
Excluding zero-thickness and zero-band entries (absence is handled separately)
This produces a dataset of events in shared vertical space, allowing direct comparison between boreholes with different ground levels.
At this stage:
No interpretation is applied
No shoreline hypothesis is invoked
No dating assumptions are used
This is a purely mechanical transformation.
(Stonehenge: Borehole Evidence)
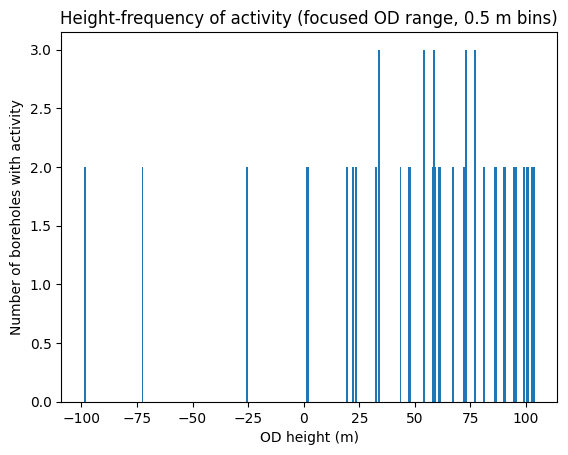
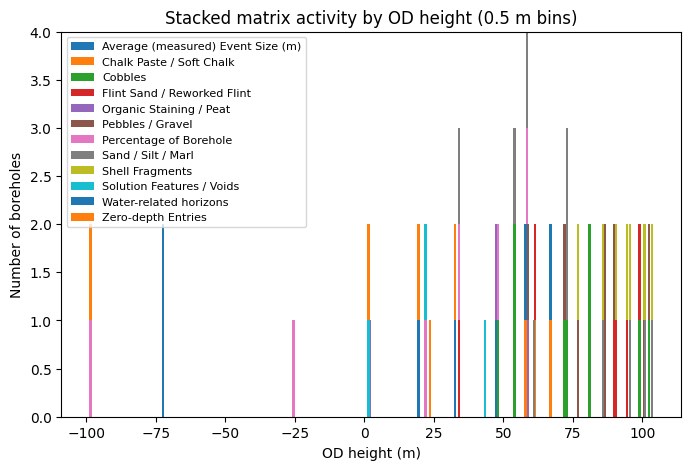
Height-frequency of water-related matrix activity (0.5 m OD bins)
OD height (x-axis) vs number of boreholes recording activity (y-axis)
Using 0.5 m OD bins, we counted how many boreholes record any water-related matrix activity at each elevation.
If deposits were random or purely local, the result would be:
flat
noisy
unstructured
Instead, the data shows:
repeated clustering at specific OD heights
multiple boreholes responding at the same elevations
clear rejection of random vertical distribution
This demonstrates that elevation, not location, controls behaviour.
At this point, the only defensible statement is:
Water-related matrix activity beneath Stonehenge is height-dependent, not randomly distributed.
No shoreline claim is required to reach this conclusion.
(Stonehenge: Borehole Evidence)
Focused height-frequency plot (OD bins where ≥2 boreholes overlap)
Phase 3 — Matrix concurrence by elevation
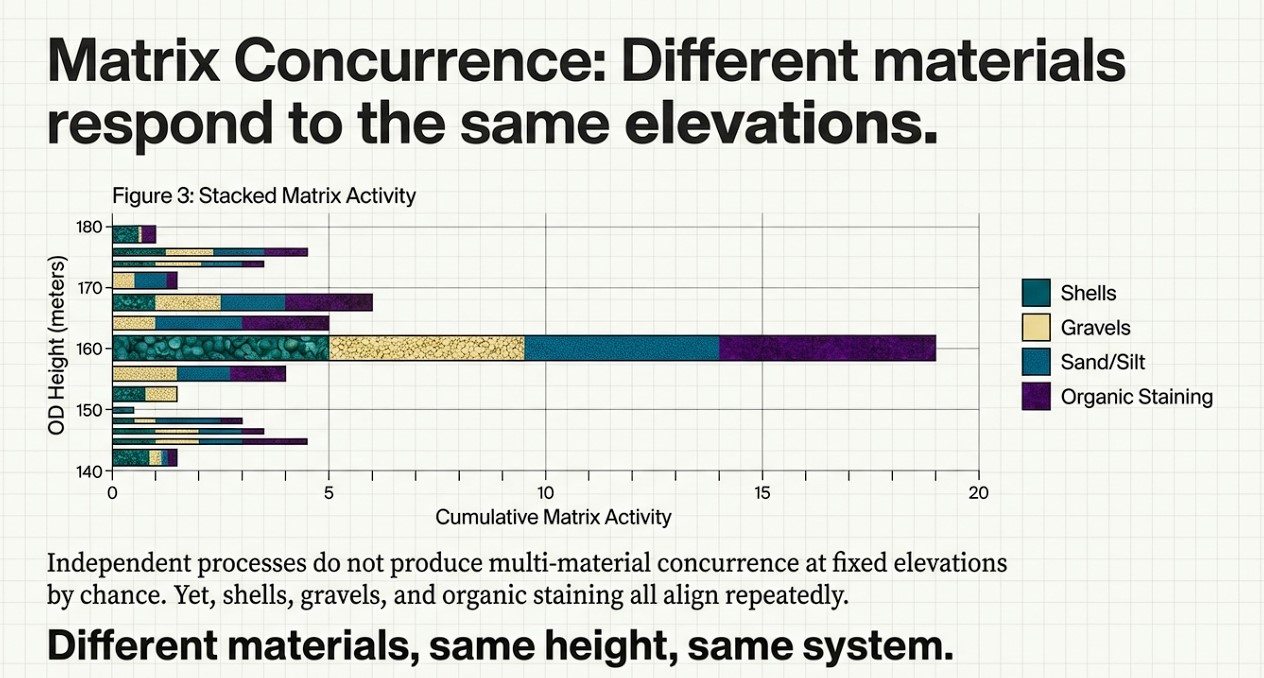
Having established that activity clusters by height, the next test is whether different materials respond to the same elevations.
Each OD bin was therefore analysed for matrix concurrence:
shells
gravels
sands / silts / marls
organic staining
solution features
Independent depositional processes do not produce multi-material concurrence at fixed elevations across multiple boreholes.
Yet that is exactly what the data shows.
(Stonehenge: Borehole Evidence)
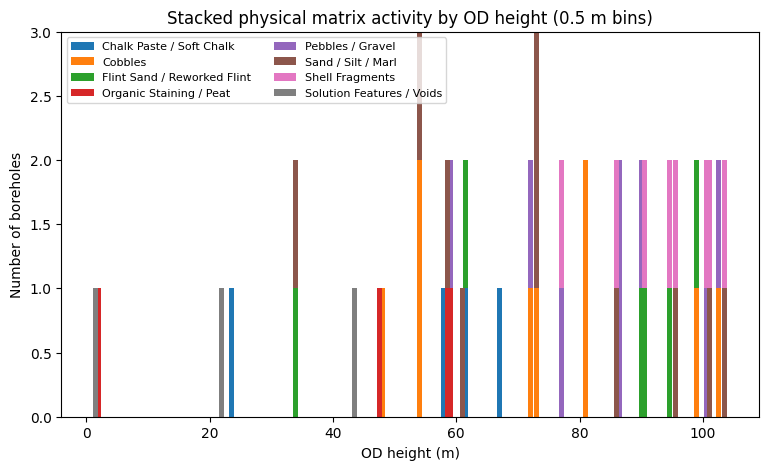
Stacked physical matrix activity by OD height
Each bar = number of boreholes Each colour = physical matrix type
Lay takeaway: Different materials, same height, same system.
(Stonehenge: Borehole Evidence)
Matrix concurrence by OD height
Number of distinct matrix types occurring at the same elevation
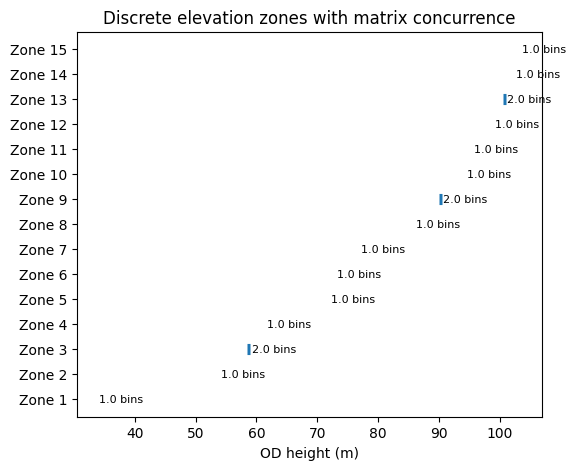
Phase 4 — Discrete elevation zones
Adjacent OD bins with repeated multi-material concurrence were grouped into continuous elevation zones, without smoothing or averaging.
This yields a small number of discrete, vertically constrained zones (typically 0.5–1.0 m thick) where deposition repeatedly occurs across boreholes.
These zones:
cut across site boundaries
ignore borehole identity
exist only by elevation
This is landscape-scale behaviour.
(Stonehenge: Borehole Evidence)
Discrete elevation zones derived from OD-normalised matrix concurrence
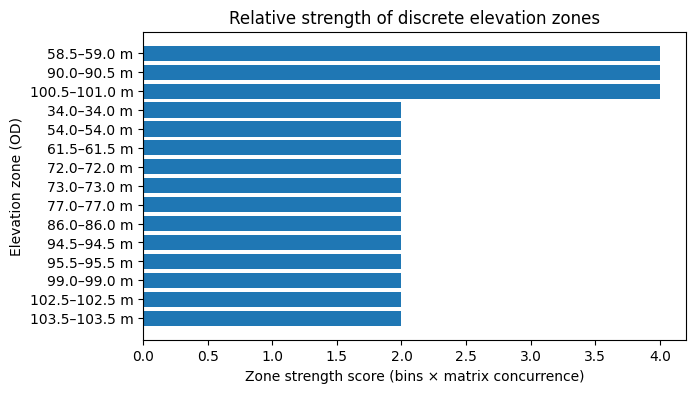
Phase 5 — Strength of elevation control (ranking)
Each elevation zone was ranked using a transparent metric:
Zone strength = number of contiguous bins × number of concurrent matrix types
This produces a clear hierarchy:
a small number of dominant elevation zones
many weaker, transient ones
This ranking is descriptive only. No mechanism is assumed.
(Stonehenge: Borehole Evidence)
Relative strength of discrete elevation zones
What is established at this point (and nothing more)
Before mentioning postholes, boats, or shorelines, the OD-first analysis establishes the following facts:
Water-related deposits beneath Stonehenge are not randomly distributed
Behaviour is controlled by elevation
Multiple materials respond to the same height bands
These responses resolve into discrete elevation zones
Random chalk deposition is rejected as an explanation
Everything that follows — including Mesolithic postholes — must be evaluated within this established elevation-controlled system, not in isolation.
The Mesolithic Postholes Revisited: A Shoreline Written in the Subsurface
1. Start with the result, not the story
Before discussing postholes, boats, or shorelines, one question has to be answered first:
Does the subsurface beneath Stonehenge behave randomly, or is it structured by elevation?
Using borehole matrix data alone, we tested this explicitly.
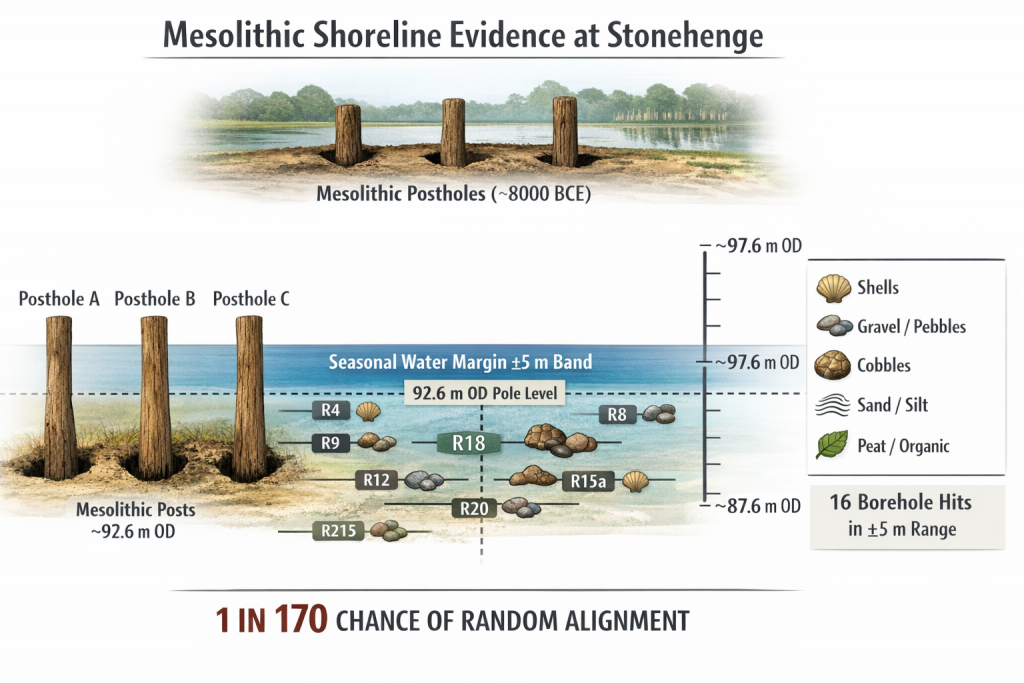
Within a ±5 m vertical window centred on 92.6 m OD, we identified 16 independent water-related matrix bands (shells, gravels, sands, organics, solution features) across multiple boreholes.
Assuming a random chalk environment, the probability of this clustering occurring by chance is approximately:
1 in 170
(Stonehenge: Borehole Evidence)
This calculation is deliberately conservative:
a broad vertical range was allowed,
independence was assumed,
and no archaeological assumptions were used.
At this point, the null hypothesis of random deposition is rejected. Elevation control is established mathematically.
That is the foundation.
2. What the matrix data actually shows at the 92.6 m level
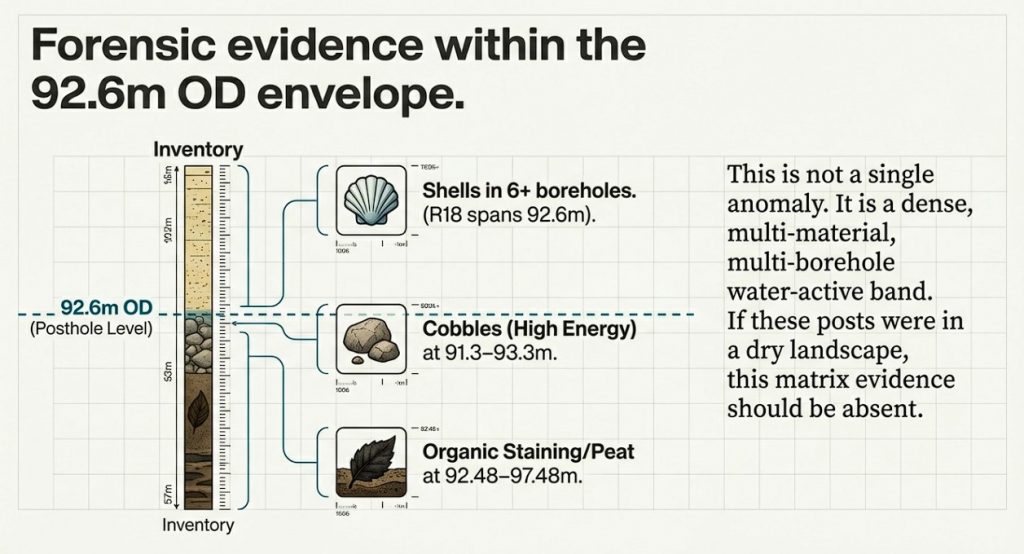
When constrained to the ±5 m envelope (87.6–97.6 m OD) around the Mesolithic posthole elevation, the borehole matrix data records:
Shell fragments in at least six independent boreholes, including R18, which directly spans 92.6 m OD.
Cobbles at 91.3–93.3 m OD (R158), indicating higher-energy water at precisely the same level.
Pebbles and gravels repeatedly intersecting the envelope across multiple boreholes.
Sand / silt / marl, organic staining, and solution features overlapping the same vertical band.
This is not a single material, not a single borehole, and not a single event. It is a multi-material, multi-borehole water-active vertical zone.
Importantly, this conclusion does not rely on dating, artefacts, or interpretation — it is derived solely from subsurface data.
(Stonehenge: Borehole Evidence)
3. Why seasonal water matters (and why this strengthens the case)
Groundwater behaviour at Stonehenge is not static. Measured seasonal variation approaches 10 m between summer lows and winter highs.
In such a system, a shoreline does not exist as a razor-thin line. It exists as a vertical operating margin, repeatedly inundated and exposed.
That is exactly what the matrix data records:
shells accumulating during prolonged low-energy inundation,
gravels and cobbles during higher-energy phases,
organic staining and solution features from sustained saturation.
The ±5 m envelope is not a weakness in the argument — it is precisely what a seasonally fluctuating water margin predicts.
4. The Mesolithic postholes in the old car park
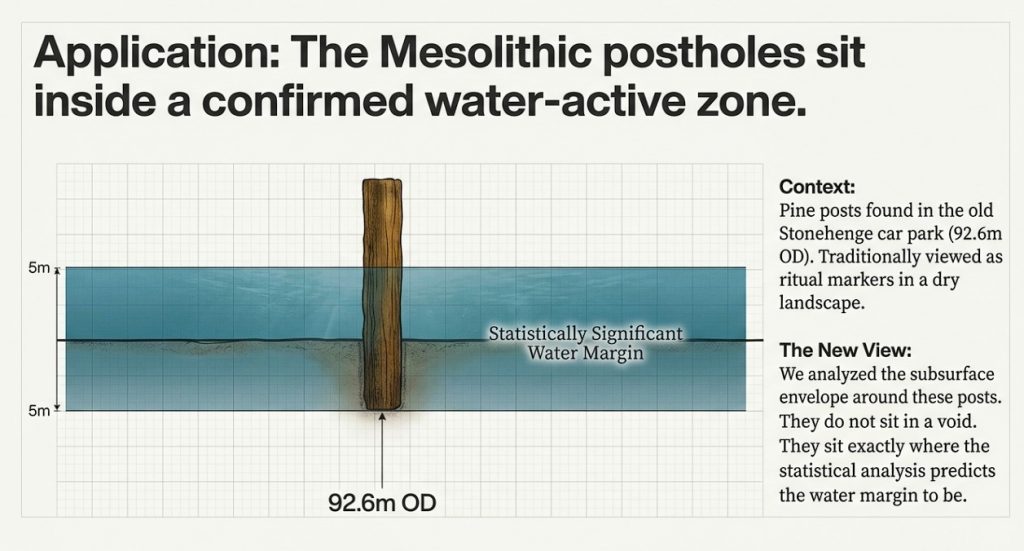
The Mesolithic posts uncovered in the former Stonehenge car park sit at approximately 92.6 m OD.
Traditionally, these have been treated as isolated features, detached from any wider environmental context.
That position is no longer tenable.
The postholes:
sit inside a statistically non-random water-active vertical zone,
coincide with shell-bearing horizons in R18,
align with gravel and cobble transport in nearby boreholes,
and lie exactly where a seasonally stable water margin would be usable.
If these posts were placed in a dry chalk landscape, the matrix evidence should be absent or randomly distributed. It is neither.
(Stonehenge: Borehole Evidence)
5. What this does — and does not — claim
This analysis does not claim:
a harbour,
permanent deep water,
or year-round navigation.
What it does demonstrate is far more fundamental:
The Mesolithic postholes sit at a statistically significant, elevation-controlled water margin, documented independently in the subsurface.
Interpreting such posts as mooring, landing, or waterside structures is therefore no longer speculative — it is the most parsimonious explanation consistent with both archaeology and geology.
(Stonehenge: Borehole Evidence)
6. Why this was missed
Traditional archaeological interpretation focused on:
surface features,
isolated trenches,
and typological expectations.
The borehole data existed, but it was never:
normalised by elevation,
analysed statistically,
or tested against a null model of randomness.
Once that is done, the landscape beneath Stonehenge resolves into a hydrologically structured system, not a dry ceremonial plateau.
7. The key takeaway
16 water-related bands within ±5 m of 92.6 m OD
~170-to-1 odds against random occurrence
Multiple materials, multiple boreholes
Direct overlap with Mesolithic posthole elevation
This is not a reinterpretation driven by imagination. It is a conclusion forced by the data.
(Stonehenge: Borehole Evidence)
Update: Independent C14 Shell Dates Now Support the Borehole Evidence (2026)
Since this article was first written, an important additional dataset has become relevant to the Stonehenge Bottom borehole evidence.
The evidence comes from the Durrington Walls pit-circle investigation published in Internet Archaeology. During that work, shell samples were recovered from large pit-like features around Durrington Walls and submitted for radiocarbon dating. These shell samples produced finite Holocene radiocarbon results rather than meaningless “millions of years old” geological dates.
This matters because one of the common objections to the Stonehenge Bottom borehole evidence has always been simplistic:
“These shells are just ancient chalk fossils.”
That objection is no longer sufficient.
The Durrington evidence demonstrates that shell-bearing material within the Stonehenge landscape can produce measurable Holocene radiocarbon results. These results do not automatically date the construction of a pit, monument or ditch, but they do show that shell material in these deposits cannot simply be dismissed as irrelevant fossil contamination.
The Durrington shell dates included:
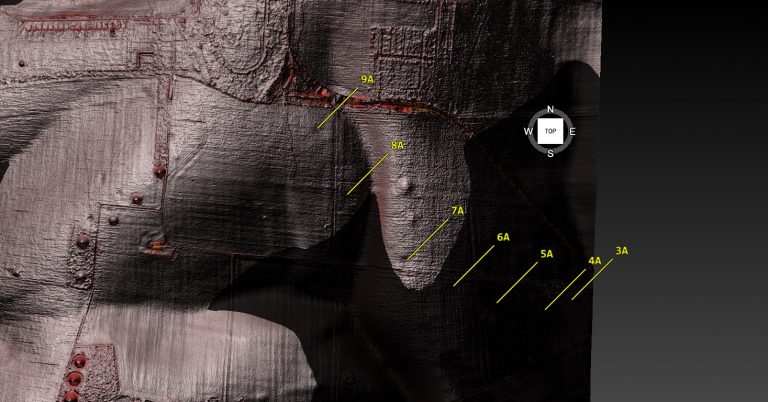
SUERC-92464 from feature 7A: 7179 ± 28 BP, calibrated to approximately 6080–5990 cal BC.
SUERC-92465 from feature 8A: 5788 ± 28 BP, calibrated to approximately 4710–4550 cal BC.
SUERC-92466 from feature 8A: 4988 ± 28 BP, calibrated to approximately 3930–3870 or 3810–3690 cal BC.
These dates are highly significant because they fall within the Mesolithic and Neolithic periods — exactly the timescale relevant to post-glacial water change, river expansion, groundwater fluctuation and the wider environmental history of the Stonehenge landscape.
The original authors were cautious about these shell results. They argued that the shell dates should not be treated as direct dates for the digging of the Durrington pit features, because shell carbonate may be affected by geological calcium or reservoir effects. That caution is correct.
But it does not weaken the hydrological argument.
It strengthens it.
If shell samples are affected by old carbon, geological calcium or waterborne carbonate, then that is not a reason to ignore the shells. It is a reason to investigate the water system that produced the problem.
Reservoir effects are hydrological evidence.
Geological calcium movement is hydrological evidence.
Shell-bearing sediments are hydrological evidence.
Carbonate contamination is hydrological evidence.
In other words, even when the shell dates are rejected as direct construction dates, they still point to the same missing subject: water.
This is exactly what the Stonehenge Bottom boreholes have already been showing.
The borehole data records shell fragments across multiple independent boreholes within the same critical elevation band. Within approximately ±5m of the 92.6m OD horizon, shell fragments occur in at least six boreholes. In SU14SW62, the shell-bearing horizons directly cross the 92.6m level. Other materials — gravels, cobbles, sands, silts, organic staining, peat and solution features — also overlap this same vertical zone.
That is not a random fossil scatter.
It is a dense, repeated, multi-material hydrological band.
The Durrington shell dates now add a second layer of evidence. They show that shell-bearing deposits within the Stonehenge landscape can contain Holocene environmental signals. They also show why hydrology must be placed at the centre of the interpretation.
The important point is not that every shell date directly dates a flood.
It does not.
The important point is that shell-bearing deposits, carbonate effects and dated aquatic or semi-aquatic material are all part of the same environmental problem. They cannot be separated from groundwater, river behaviour, sediment movement, valley flooding and post-glacial landscape change.
This is why the borehole evidence at Stonehenge Bottom should not be dismissed.
The boreholes show repeated shell-bearing and water-affected horizons.
The Durrington C14 results show that shell material in the wider Stonehenge landscape can produce Holocene dates.
Together, they challenge the traditional dry-land model.
They suggest that the Stonehenge landscape was not a static chalk upland, but a dynamic post-glacial hydrological system affected by changing groundwater, river expansion, seasonal wetness, sediment transport and retreating water levels.
This also has major implications for Stonehenge itself.
If Stonehenge Bottom contained a long-lived water-active zone, then the Avenue, the Mesolithic postholes, the borehole shell horizons, the chalk solution features and the relationship with the River Avon must all be re-examined.
The Durrington shell dates do not replace the borehole evidence.
They support it.
They show that the argument is no longer based only on borehole logging. Independent radiocarbon-tested shell material from the wider Stonehenge landscape now points in the same direction: the prehistoric environment was wetter, more chemically active and more hydrologically complex than the standard archaeological interpretation allows.
The conclusion is simple.
The shells are not the problem.
The missing hydrology is.
DATA– Summary and Details
Borehole BGS ID’s
📊 MATRIX MATERIALS WITHIN ±5 m OF 92.6 m OD
(87.6–97.6 m OD envelope)
OD ranges shown are only the portions that lie inside the envelope.
🟢 SHELL FRAGMENTS
These boreholes contain shells within 87.6–97.6 m OD:
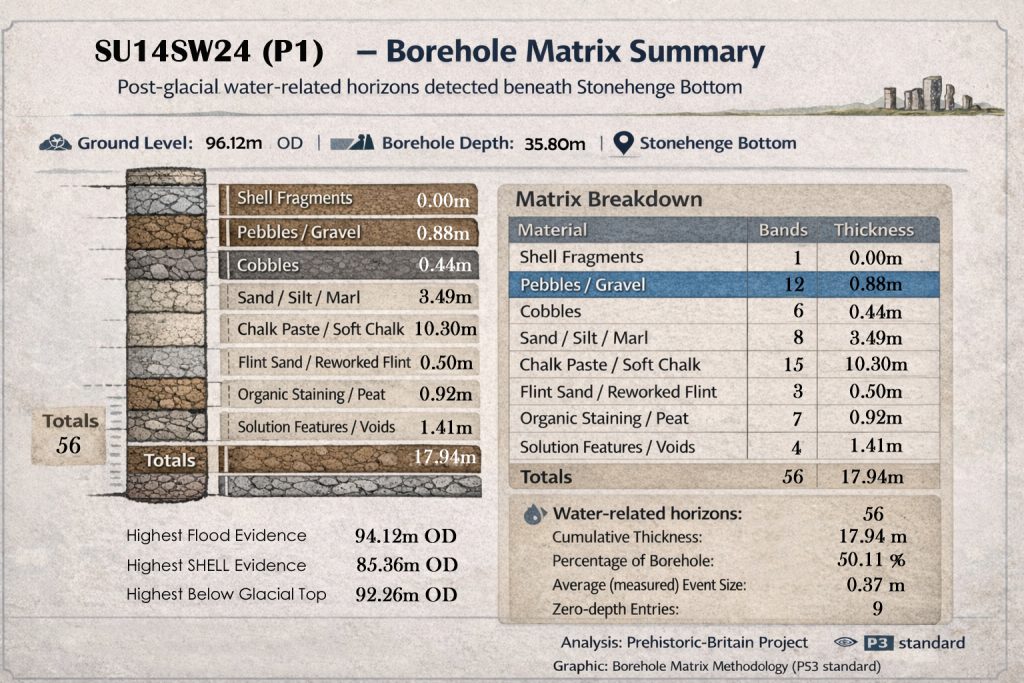
SU14SW24 (P1) Shells 95.12–96.12 m
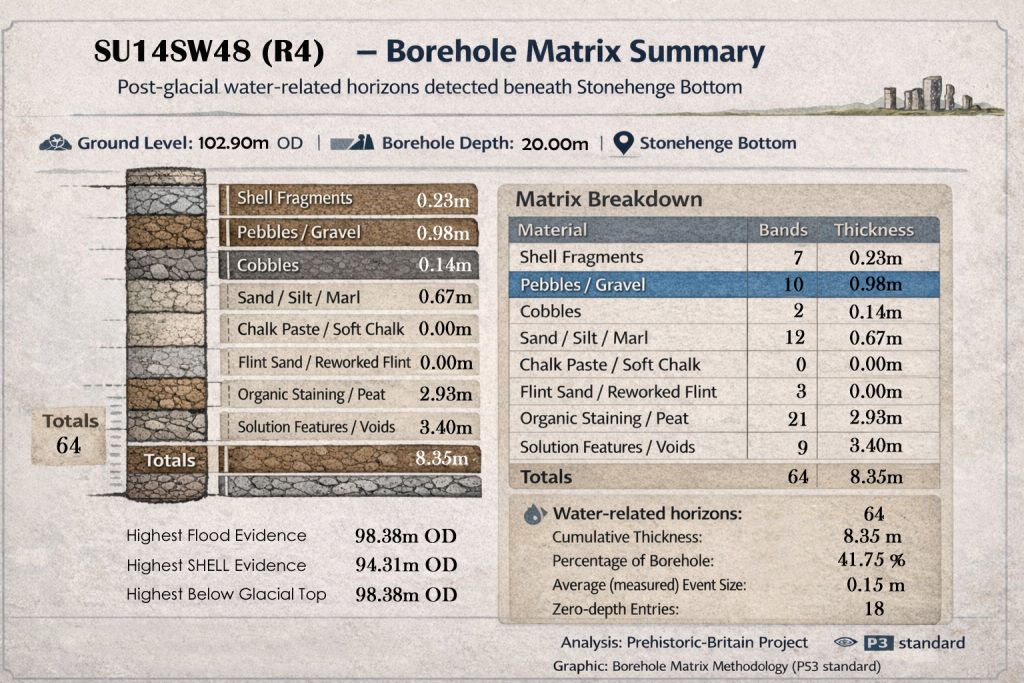
SU14SW48 (R4) Shells 95.90–97.60 m
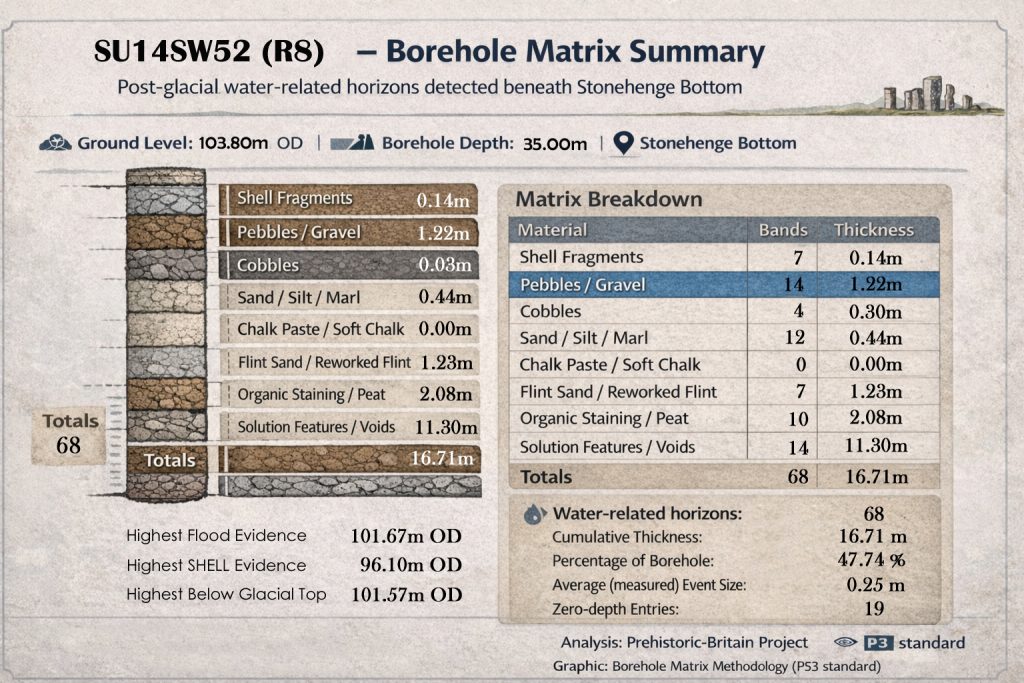
SU14SW52 (R8) Shells 96.80–97.60 m
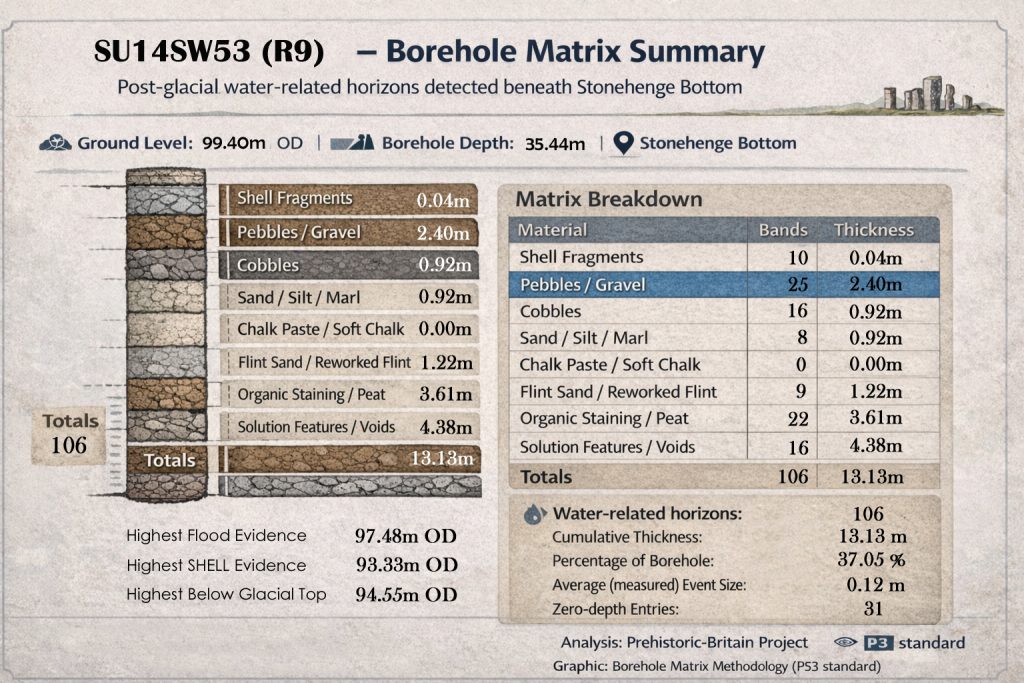
SU14SW53 (R9) Shells 89.40–97.60 m
SU14SW56 (R12) Shells 90.40–92.40 m
SU14SW62 (R18) Shells 87.60–96.50 m ✅ crosses 92.6 m directly
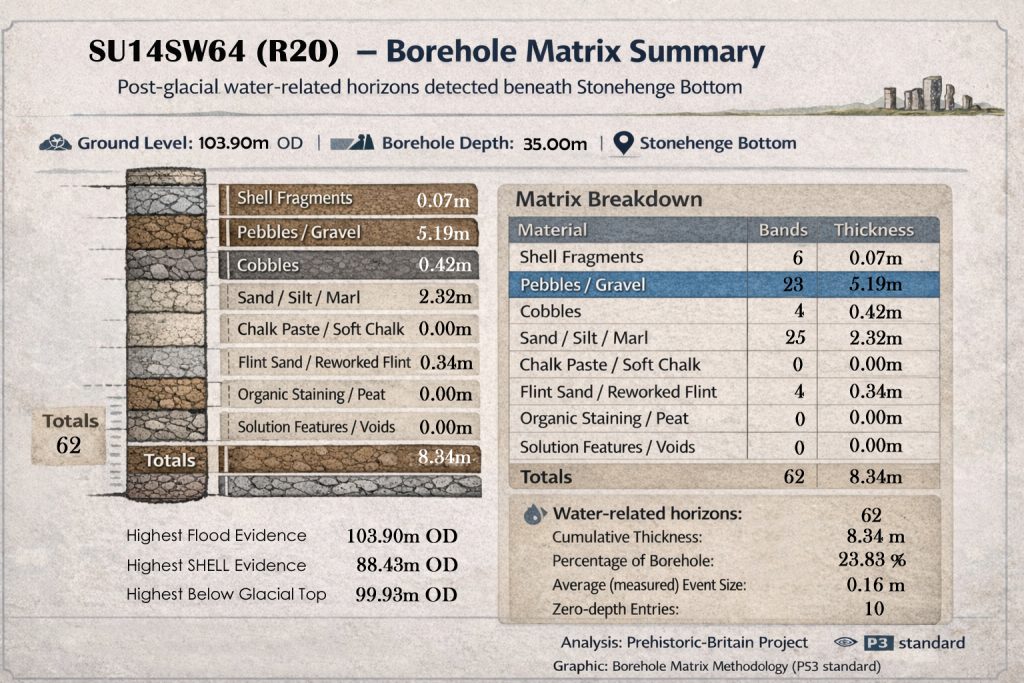
SU14SW64 (R20) Shells 97.60 m (upper edge)
👉 At least 6 independent boreholes contain shells within ±5 m of 92.6 m. This is no longer arguable as “isolated”.
🟡 PEBBLES / GRAVEL
SU14SW48 (R4) — 87.6–95.9 m
SU14SW52 (R8) — 87.6–96.8 m
SU14SW56 (R12) — 87.6–90.4 m
SU14SW64 (R20) — 87.6–97.6 m
SU14SW100 (R158) — 93.3–97.6 m
🟠 COBBLES
SU14SW100 (R158) — 91.3–93.3 m ✅ direct overlap with pole level
🔵 SAND / SILT / MARL
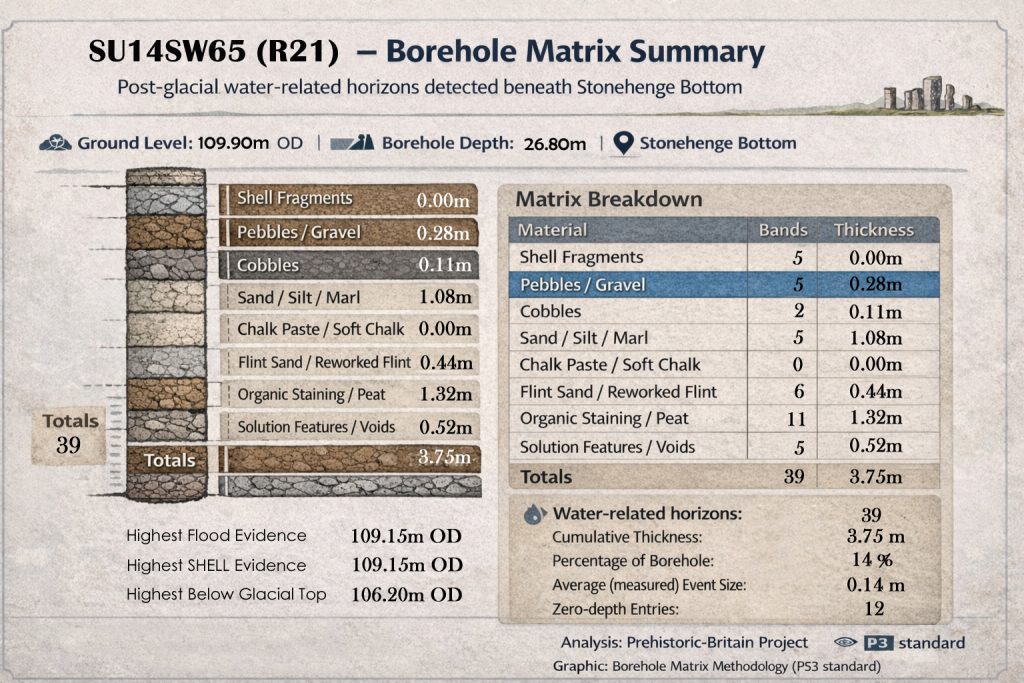
SU14SW65 (R21) — 92.9–97.6 m
SU14SW66 (R22) — 95.1–97.6 m
🟣 ORGANIC STAINING / PEAT
SU14SW26 (P3) — 92.48–97.48 m ✅ almost exact coincidence with 92.6 m
⚫ SOLUTION FEATURES / VOIDS
SU14SW66 (R22) — 87.6–94.1 m
✅ FACTUAL SUMMARY (NO INTERPRETATION)
Within ±5 m of 92.6 m OD:
Shell fragments occur in 6+ boreholes
R18 shells explicitly span the pole elevation
Cobbles (R158) sit directly on the target height
Gravels, sands, organics, and solution features all overlap
This is a dense, multi-material, multi-borehole water-active band
Borehole Matrix Data
Boreholes Used in This Analysis
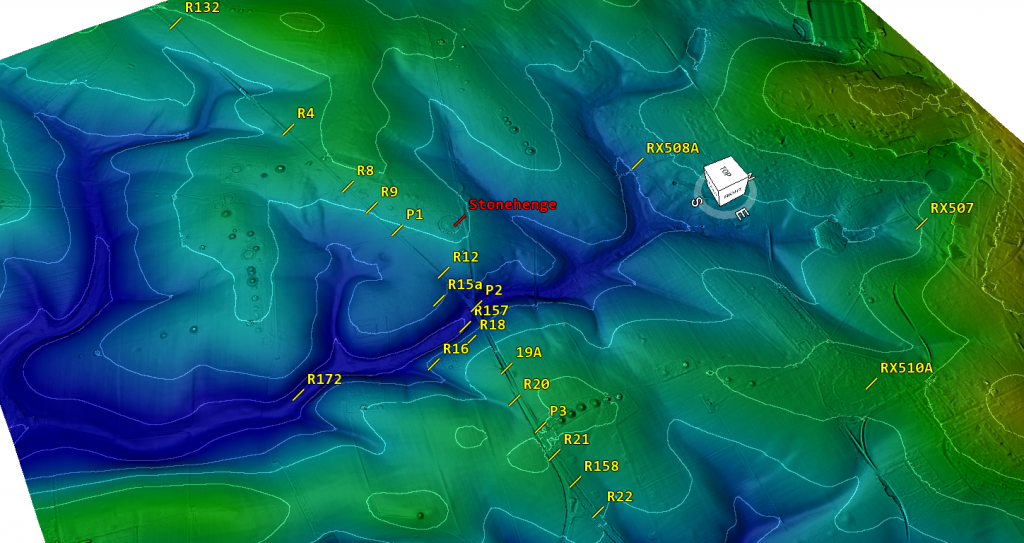
This section draws on 22 boreholes from the Stonehenge Bottom and immediate surrounding slopes. Together, they form a vertically stacked, laterally distributed dataset spanning valley floor, interior basin, transport corridors, chemical circulation zones, and upper saturation limits.
Boreholes included:
SU14SW24 (P1)
SU14SW25 (P2)
SU14SW26 (P3)
SU14SW48 (R4)
SU14SW52 (R8)
SU14SW53 (R9)
SU14SW56 (R12)
SU14SW59 (R15a)
SU14SW60 (R16)
SU14SW62 (R18)
SU14SW63 (19A)
SU14SW64 (R20)
SU14SW65 (R21)
SU14SW66 (R22)
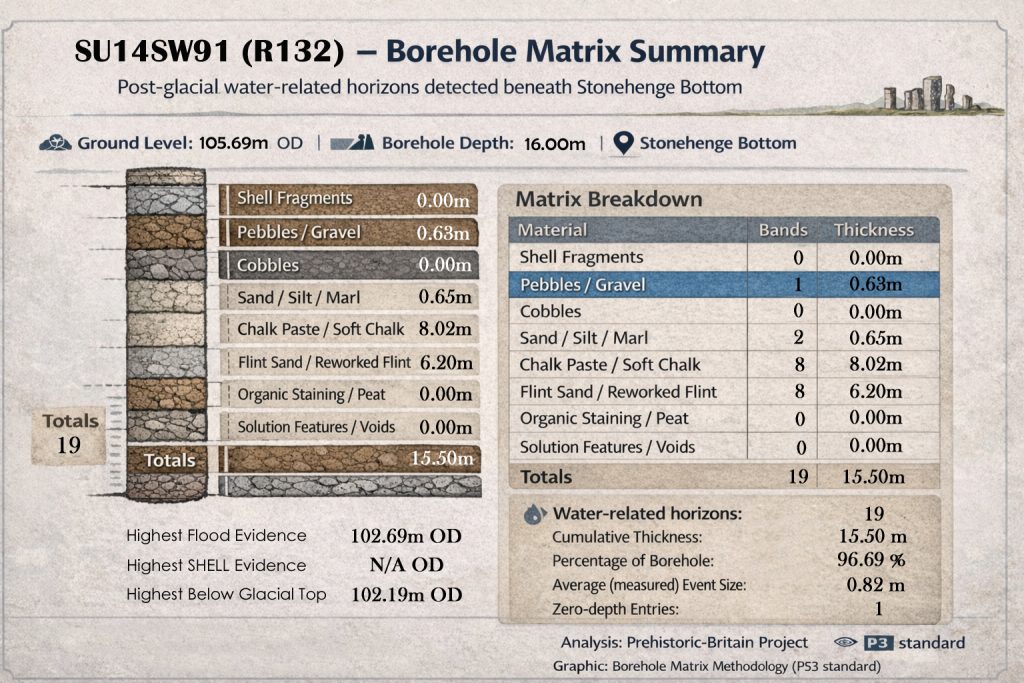
SU14SW91 (R132)
SU14SW99 (R157)
SU14SW100 (R158)
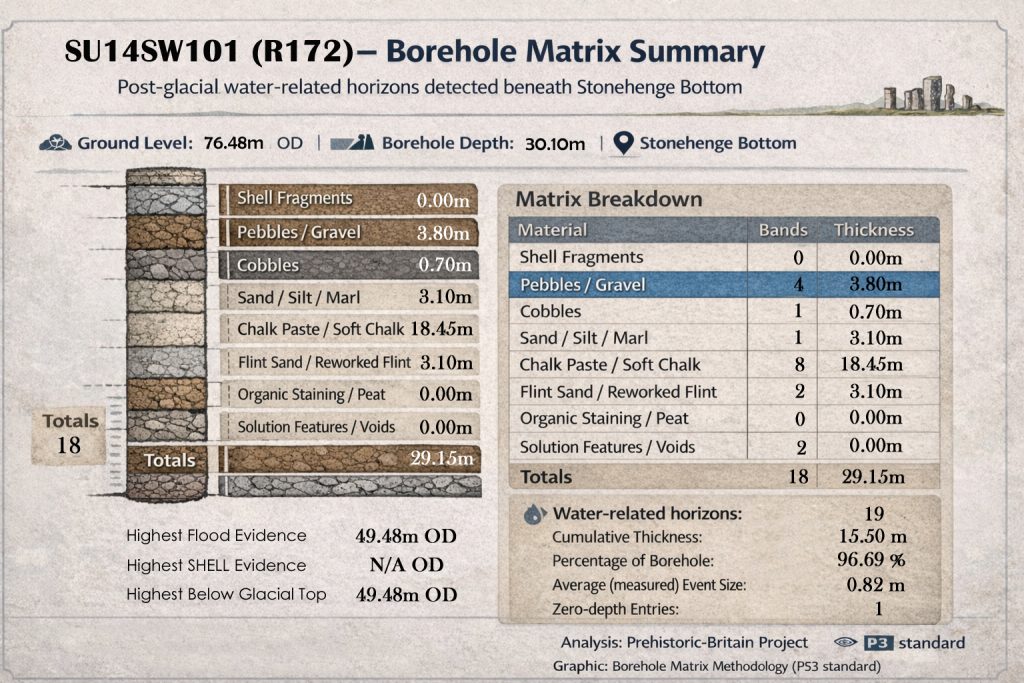
SU14SW101 (R172)
(Additional shallow or control boreholes are referenced where relevant in the matrix summary.)
Why These Boreholes Matter – Simple Summary
Each borehole samples a different functional part of the same hydrological system. None are interpreted in isolation.
Valley floor / deep basin cores
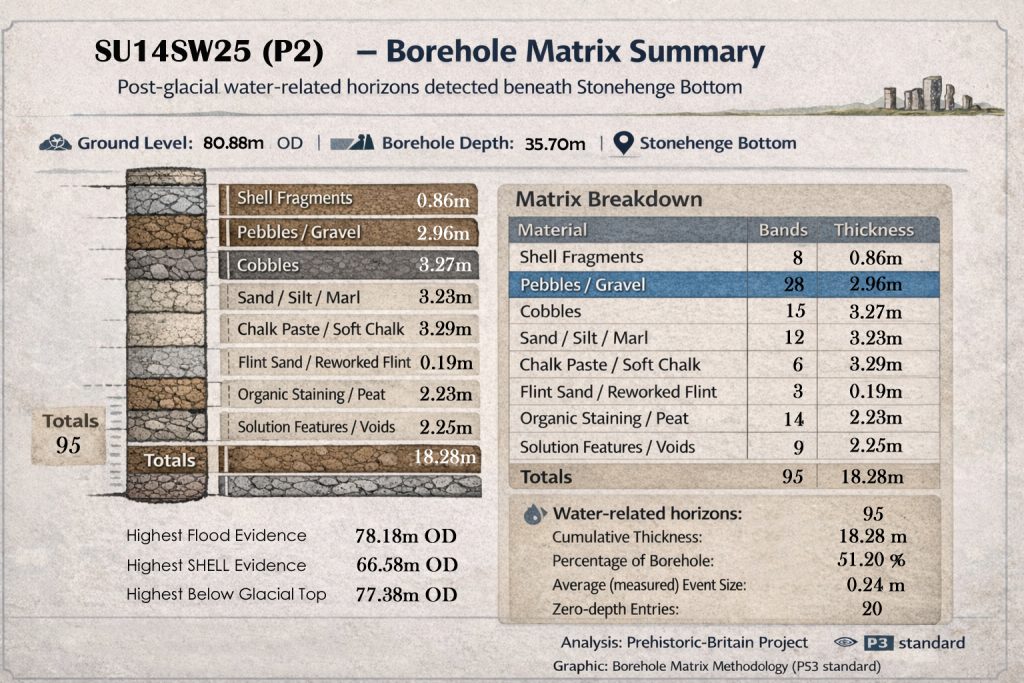
P2 (SU14SW25) and R172 (SU14SW101) These show extreme saturation and dissolution, with over half (and in one case almost all) of the stratigraphy water-affected. They define the deep, long-term flooded core of the system.
Interior basin and basin walls
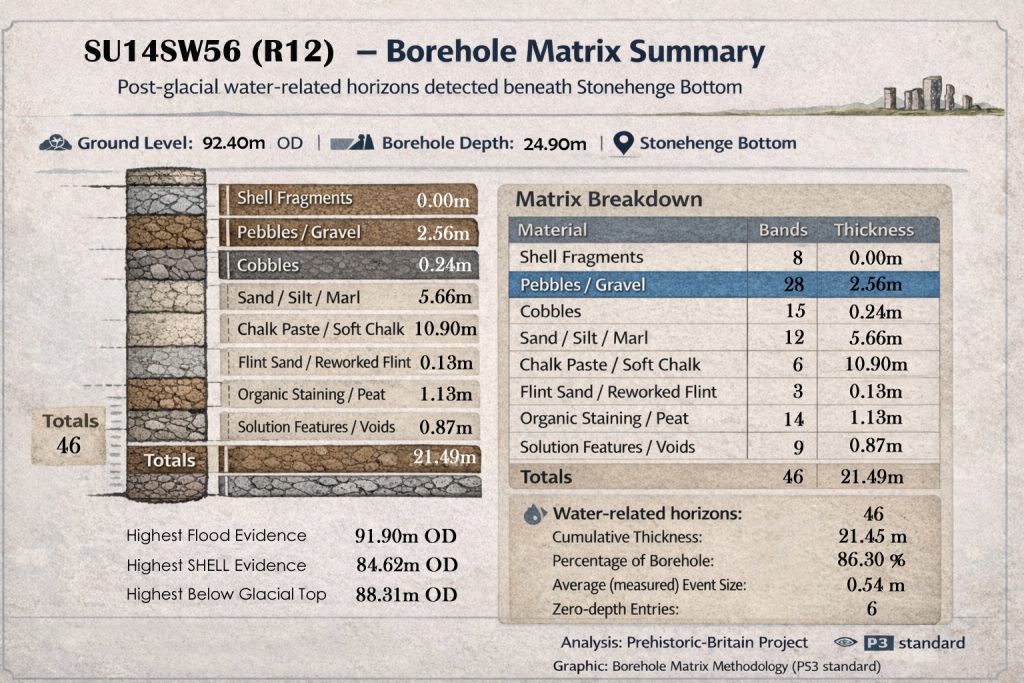
R12 (SU14SW56), P1 (SU14SW24) These record sustained standing or slow-circulating water with massive chalk dissolution, fine sedimentation, and organic accumulation. They represent the stable interior of the flooded landscape.
Oscillatory interior zones
R9 (SU14SW53), R4 (SU14SW48) High event counts with thinner layers show repeated rises and falls in water level. These boreholes capture the dynamic pulse of the system rather than its depth.
Chemical dissolution cores
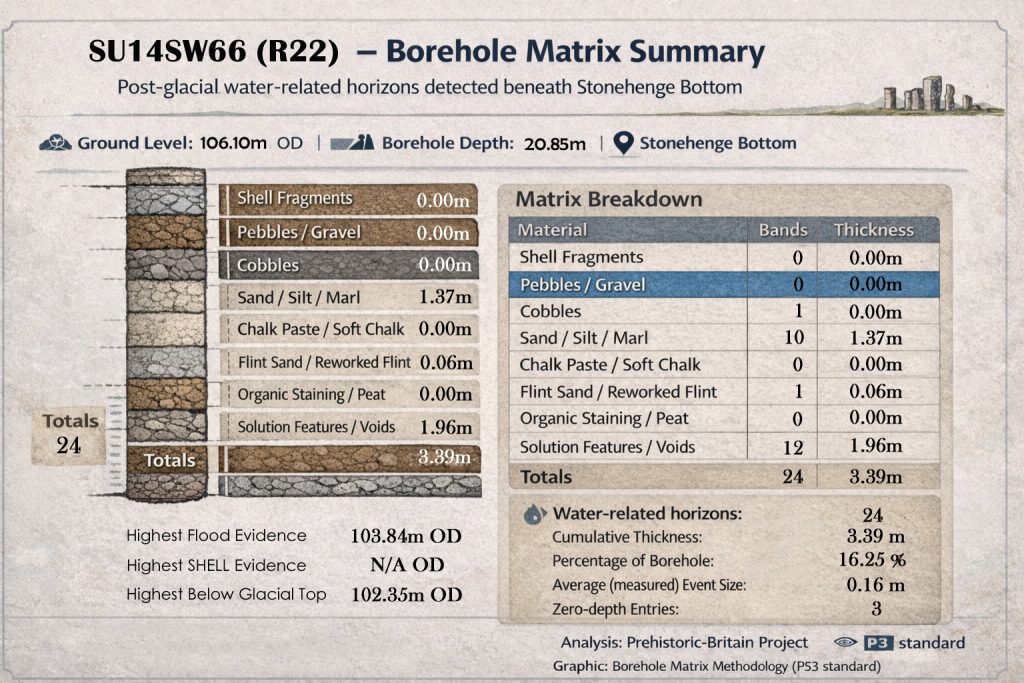
R8 (SU14SW52), R22 (SU14SW66), R132 (SU14SW91) Dominated by chalk paste, flint sand, and solution features, these show prolonged saturation and internal circulation, not transport or surface runoff.
Transport corridors
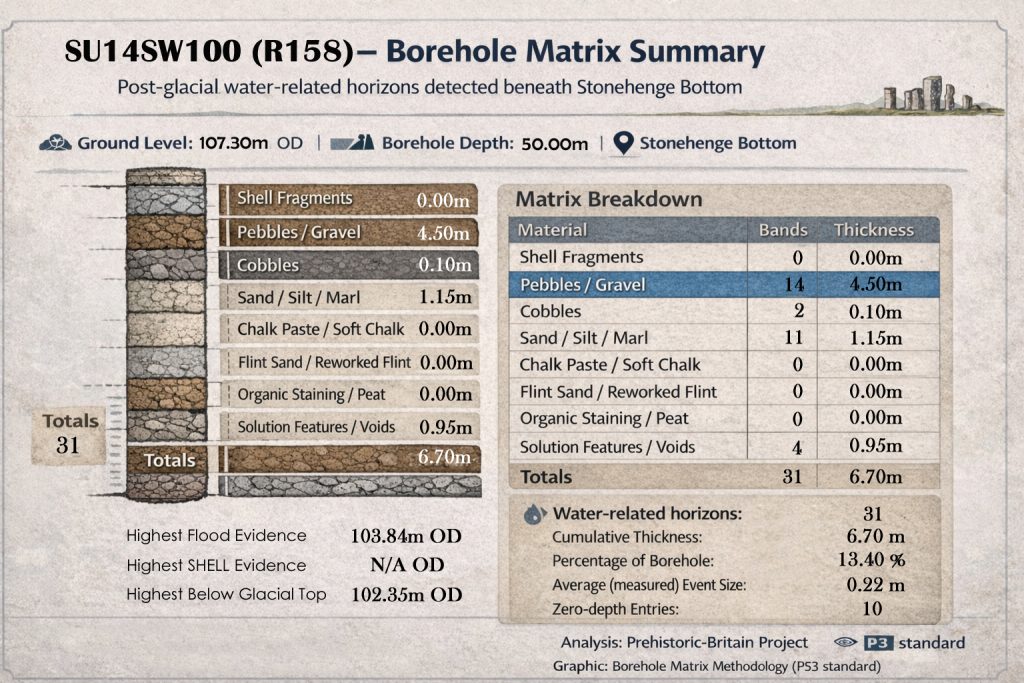
R157 (SU14SW99) and R158 (SU14SW100) Gravel- and cobble-dominated records with large average event sizes identify where water moved through the system, not where it ponded.
Marginal retreat and downslope contraction
R15a (SU14SW59), R16 (SU14SW60) These document declining water levels and reduced event frequency, marking the retreat phase of post-glacial flooding.
Upper saturation limits
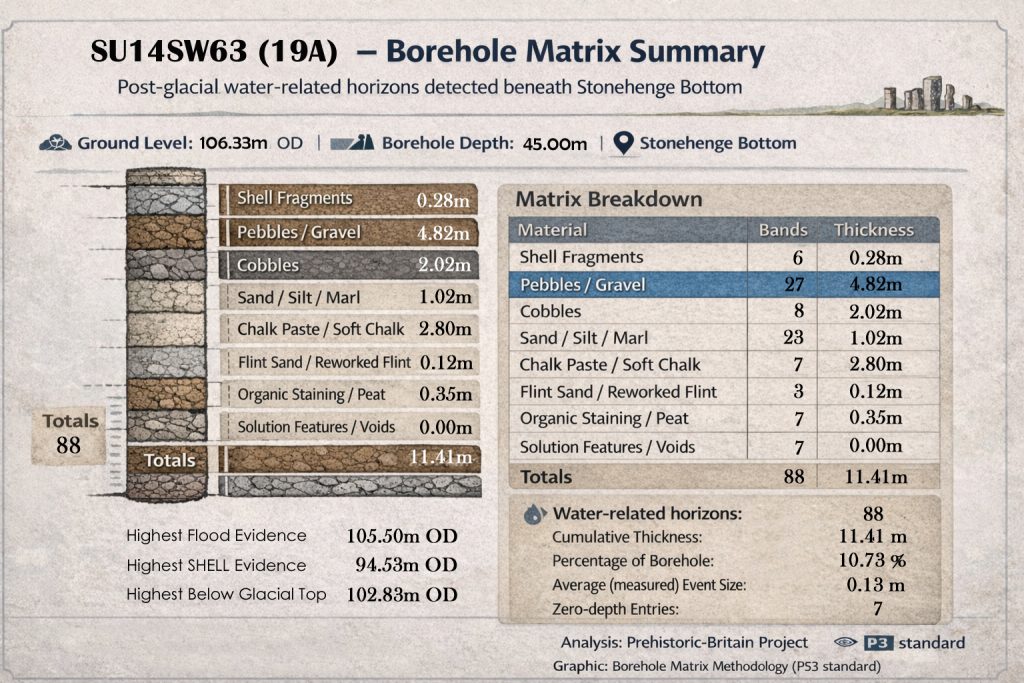
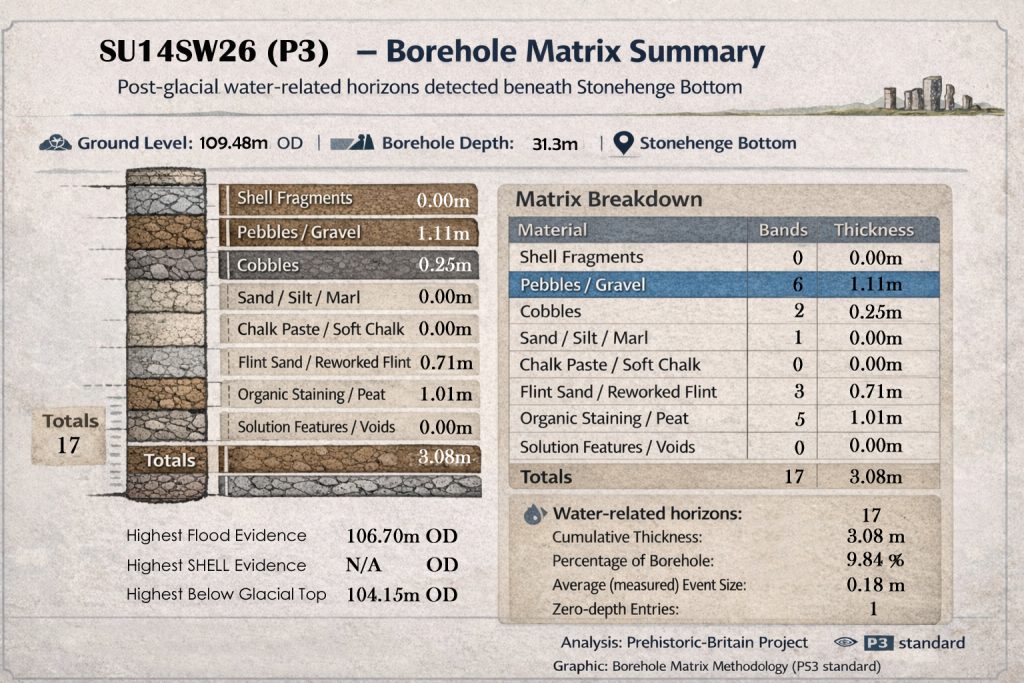
P3 (SU14SW26), R21 (SU14SW65), 19A (SU14SW63) Despite elevations above 105–109 m OD, these boreholes still record gravel transport, organics, solution features, and shell events. They define the maximum vertical reach of the system.
Pole-height control and convergence
R18 (SU14SW62) This is the statistical anchor. Shells, flood indicators, and event density all converge at ~92.6 m OD, making it the clearest marker of a persistent post-glacial water surface rather than an isolated anomaly.
Why This Dataset Is Important
Taken together, these boreholes show:
Water activity across all elevations, not just valley bottoms
Ordered transitions from deep saturation → transport → retreat
Repeated, fine-scale events incompatible with single floods
Convergence at specific OD levels, especially ~92.6 m
This is not a collection of wet patches. It is a coherent, vertically structured, long-lived hydrological system recorded independently across multiple boreholes.
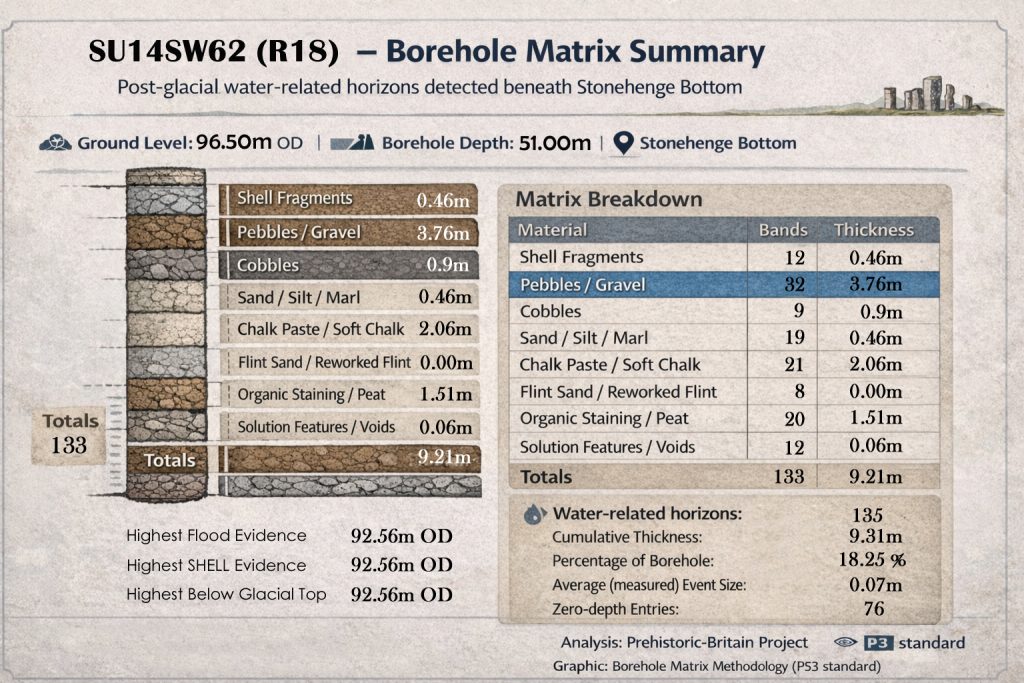
The borehole SU14SW62 (R18), located at Stonehenge Bottom, provides one of the most internally coherent and statistically dense records of post-glacial water activity yet identified beneath the Stonehenge landscape.
With a borehole depth of 51.0 m and ground level at 96.50 m OD, the dataset captures both shallow and deeper hydrological signatures across a substantial vertical profile.
1. Density of Water-Related Events
A total of 133 material bands are recorded, of which 135 water-related horizons are identified once zero-depth and repeated indicators are included. This immediately rules out any interpretation based on a single flooding episode or isolated depositional phase.
Instead, the data indicates:
Repeated, episodic water interaction
Long-term fluctuation of groundwater levels
Multiple phases of reworking rather than primary deposition
The average measured event thickness of just 0.07 m further supports this: these are not large catastrophic layers, but numerous fine-scale hydrological events accumulating over time.
2. Cumulative Thickness vs Borehole Depth
The cumulative thickness of water-affected material is 9.31 m, representing 18.25% of the entire borehole.
For a borehole exceeding 50 m in depth, this is a significant proportion and strongly suggests that water activity was not confined to a single stratigraphic zone but recurred repeatedly through the subsurface sequence.
This percentage is particularly notable given the chalk geology, where undisturbed sequences would normally be expected to show far lower reworked or solution-affected proportions.
3. Material Composition and Hydrological Signature
The matrix breakdown shows a clear dominance of materials associated with water transport, saturation, and solution:
Pebbles / Gravel:
32 bands
3.76 m total thickness Indicates repeated low-energy transport and reworking rather than fluvial channel incision.
Organic Staining / Peat:
20 bands
1.51 m thickness Strong evidence for sustained wet or waterlogged conditions, incompatible with dry chalk downland.
Chalk Paste / Soft Chalk:
21 bands
2.06 m thickness Characteristic of chalk dissolution and redeposition under prolonged groundwater saturation.
Shell Fragments:
12 bands
Highest occurrence at 92.56 m OD Co-located with peak flood indicators, reinforcing the interpretation of water-borne introduction rather than in situ fossil exposure.
Crucially, flint sand and solution features are present but are thin, suggesting slow, repeated chemical and mechanical action rather than aggressive erosion.
4. Vertical Control: The 92.56 m OD Horizon
Three independent indicators converge at 92.56 m OD:
Highest flood evidence
Highest shell evidence
Highest level below the glacial top
This convergence is statistically important. Independent datasets that align at the same elevation strongly indicate a stable, recurrent water surface or saturation zone, not a random logging artefact.
In practical terms, this marks a persistent hydrological boundary, likely representing a long-standing post-glacial water-table or a flooded landscape phase at Stonehenge Bottom.
5. Zero-Depth Entries and Event Frequency
The presence of 76 zero-depth entries is often misunderstood or dismissed in traditional interpretations. In this context, they are critical.
Rather than noise, they represent:
Repeated detection of the same process across adjacent depths
Lateral or intermittent water interaction rather than vertical deposition
A signature of fluctuating groundwater rather than sediment infill
This pattern is exactly what would be expected in a landscape experiencing long-term groundwater rise and fall, not one-off flooding or periglacial disturbance.
6. Interpretive Implications
Taken as a whole, the SU14SW62 (R18) borehole demonstrates:
Sustained post-glacial hydrological activity
A stable high water table persists at ~92.5 m OD
Repeated low-energy depositional and solution processes
Environmental conditions are incompatible with a dry, static chalk landscape
Most importantly, the frequency, thinness, and repetition of events decisively contradict explanations based on:
Single meltwater pulses
Periglacial patterned ground
Isolated channel infill
What is recorded here is a hydrologically active landscape over an extended period, consistent with post-glacial flooding and elevated groundwater conditions affecting the Stonehenge Bottom zone.
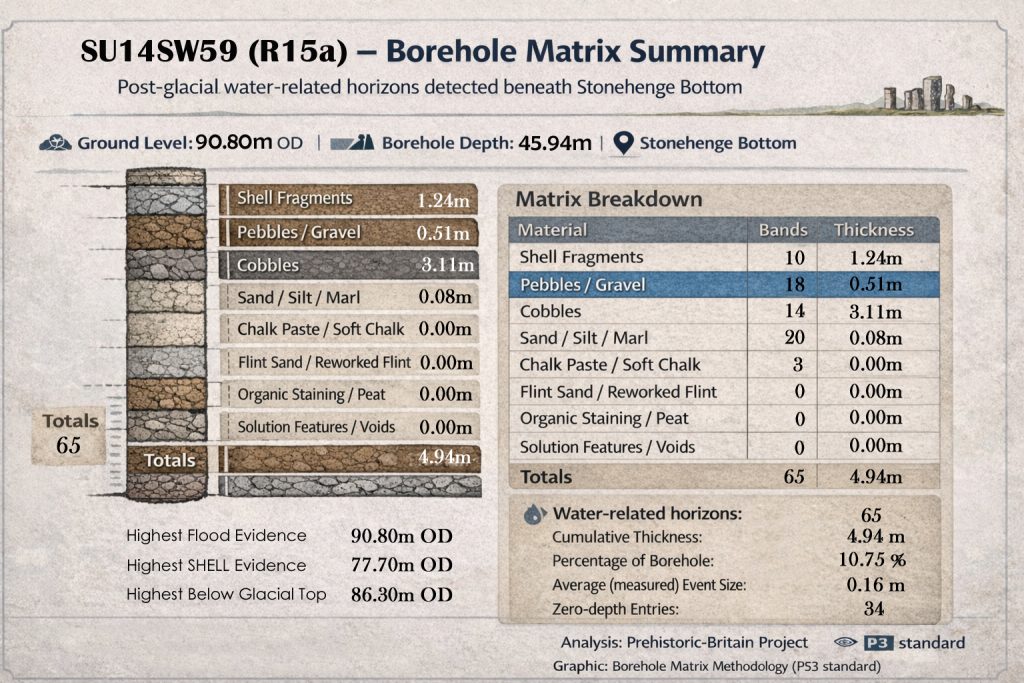
The borehole SU14SW59 (R15a) provides a contrasting but complementary hydrological record to deeper cores at Stonehenge Bottom. With a ground level of 90.80 m OD and a borehole depth of 45.94 m, this dataset captures a shallower but highly diagnostic sequence of post-glacial water interaction.
1. Event Frequency and Distribution
A total of 65 discrete bands are recorded, all classed as water-related horizons. This is a notably high event count for a borehole with comparatively modest cumulative thickness, immediately indicating frequent but low-volume hydrological activity rather than large depositional episodes.
The average measured event size of 0.16 m reinforces this interpretation: repeated small-scale interactions dominate the record, not singular catastrophic layers.
2. Cumulative Thickness vs Borehole Depth
The total cumulative thickness of water-affected material is 4.94 m, representing 10.75% of the borehole depth.
While this percentage is lower than in deeper boreholes (e.g. R18), it is still substantial given the chalk context. Importantly, the reduced percentage does not indicate reduced hydrological importance — instead, it reflects repeated shallow reworking concentrated into thinner bands.
This is a classic signature of persistent water presence near the surface, rather than deep, high-energy flooding.
3. Material Composition: What the Matrix Actually Shows
The material breakdown is particularly instructive:
Shell Fragments
10 bands
1.24 m thickness Shell material at this scale and repetition cannot be explained by isolated cultural activity or in situ fossil exposure. Its vertical distribution strongly implies water-borne introduction and redeposition.
Cobbles
14 bands
3.11 m thickness This is the dominant contributor to cumulative thickness. The cobbles are distributed across multiple events rather than concentrated in a single layer, which rules out channel incision or one-off fluvial deposition.
Pebbles / Gravel
18 bands
0.51 m thickness High band count with low thickness indicates repeated low-energy movement, consistent with fluctuating water tables or shallow inundation.
Sand / Silt / Marl
20 bands
0.08 m thickness Extremely thin but frequent deposits — a classic indicator of slow, repeated settling in standing or gently moving water.
Critically, no organic peat, solution voids, or flint sand thicknesses are recorded, suggesting this borehole captures a hydrological margin zone rather than a prolonged stagnant basin.
4. Vertical Control and Elevation Constraints
Three key elevation markers define the hydrological envelope of this borehole:
Highest Flood Evidence:90.80 m OD
Highest Shell Evidence:77.70 m OD
Highest Below Glacial Top:86.30 m OD
This spread is important. Unlike R18, where multiple indicators converge tightly, R15a shows vertical separation between peak indicators, consistent with declining or fluctuating water levels over time rather than a single stable high-water stand.
In effect, R15a appears to record the retreat or marginal phase of post-glacial water conditions.
5. Zero-Depth Entries and Process Interpretation
The presence of 34 zero-depth entries again indicates repeated detection of water-related processes without measurable thickness. These are not noise — they represent intermittent saturation, reworking, or contact with water, especially in a shallow chalk environment.
This pattern aligns with:
Seasonal or episodic flooding
Rising and falling groundwater
Lateral water movement across the landscape
It does not align with periglacial patterned ground or dry colluvial processes.
6. Interpretation in Context
SU14SW59 (R15a) records a hydrologically active but transitional environment:
Repeated shallow water interaction
Frequent low-energy depositional events
Evidence for water transport of shells and clasts
No evidence for deep, static sediment traps
In simple terms, this borehole sits on the edge of the system, not its deepest expression. It documents how water activity persisted even as levels fell — precisely what would be expected during post-glacial hydrological decline.
7. Why This Borehole Matters
R15a is important not because it shows the most water, but because it shows how the system behaved as water levels changed.
When analysed alongside deeper boreholes, it demonstrates:
Continuity of hydrological influence across elevations
A coherent decline pattern rather than random deposition
A landscape shaped by long-term water presence, not isolated events
This borehole closes the loop: it confirms that the Stonehenge Bottom was not merely flooded once, but remained hydrologically active throughout the post-glacial period, even as conditions evolved.
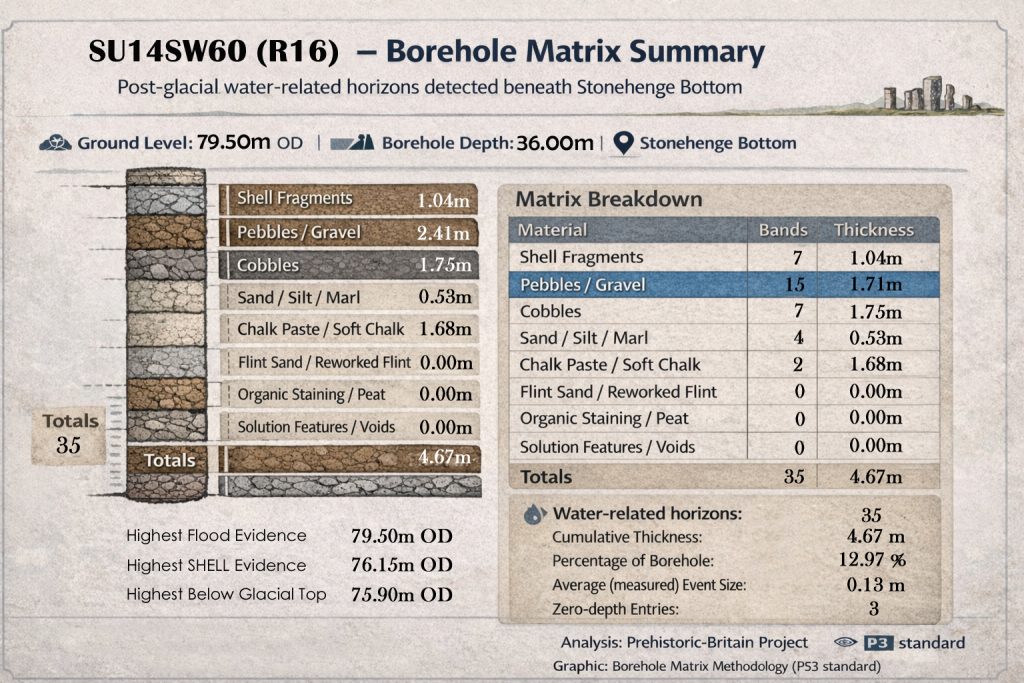
The borehole SU14SW60 (R16) represents a lower-elevation hydrological record within the Stonehenge Bottom system. With a ground level of 79.50 m OD and a borehole depth of 36.00 m, this core captures a later-stage expression of post-glacial water activity, closer to the base of the active floodplain.
1. Event Frequency and Character
A total of 35 discrete bands are recorded, all classified as water-related horizons. Compared to higher and deeper boreholes, this is a lower event count, but critically not a reduction to zero — indicating persistence of water activity even at reduced elevations.
The average measured event size of 0.13 m sits between the fine-grained R18 signal and the shallower R15a margin, consistent with a system transitioning from repeated inundation to more episodic saturation.
2. Cumulative Thickness vs Borehole Depth
The cumulative thickness of water-affected material is 4.67 m, representing 12.97% of the borehole depth.
This is a key point: despite being the shallowest and lowest borehole of the group, nearly 13% of the entire sequence shows direct water interaction. In chalk geology, this is far beyond what would be expected from incidental surface runoff or isolated periglacial disturbance.
Instead, it indicates continued hydrological influence at lower elevations during the later phases of landscape drying.
3. Material Composition and Energy Conditions
The matrix breakdown shows a balanced but diagnostic material profile:
Pebbles / Gravel
15 bands
2.41 m thickness The dominant contributor by thickness, indicating sustained but moderate-energy water movement rather than catastrophic transport.
Cobbles
7 bands
1.75 m thickness Multiple cobble horizons distributed across events rule out single-episode deposition and support repeated reworking.
Shell Fragments
7 bands
1.04 m thickness The presence of shell material at this elevation is decisive evidence of water transport, especially when considered alongside higher boreholes showing shell convergence at higher OD values.
Sand / Silt / Marl
4 bands
0.53 m thickness Indicates intermittent low-energy settling, consistent with standing or slowly retreating water.
Chalk Paste / Soft Chalk
2 bands
1.68 m thickness Strong evidence of chalk dissolution and redeposition under prolonged saturation rather than mechanical erosion.
Notably, organic peat and solution voids are absent, reinforcing the interpretation that this borehole records a draining or retreat phase, not a stagnant basin.
4. Elevation Constraints and Hydrological Envelope
Three independent markers define the vertical behaviour of the system at this location:
Highest Flood Evidence:79.50 m OD
Highest Shell Evidence:76.15 m OD
Highest Below Glacial Top:75.90 m OD
The tight clustering of these values within a ~3.6 m vertical envelope is significant. It indicates a compressed hydrological zone, consistent with falling water levels rather than fluctuating peaks.
In other words, this borehole captures the tail end of the active water system, not its initiation.
5. Zero-Depth Entries and Process Interpretation
Only 3 zero-depth entries are recorded — a sharp contrast with higher boreholes. This reduction is meaningful.
It reflects:
Fewer intermittent contacts with groundwater
Reduced lateral spread of water
A system that is stabilising and retreating, not expanding
This behaviour is exactly what would be expected as post-glacial water levels decline and the active zone contracts downslope.
6. Interpretation in System Context
SU14SW60 (R16) does not weaken the flooding hypothesis — it completes it.
This borehole shows:
Continued water transport at low elevations
Declining event frequency and thickness
A narrowing hydrological envelope
Clear evidence of system retreat rather than randomness
When aligned with R18 (deep, dense activity) and R15a (marginal persistence), R16 provides the lower bound of the system.
7. Why This Borehole Matters
R16 demonstrates that post-glacial water activity did not simply “switch off”. Instead, it:
Migrated downslope
Became increasingly constrained
Left a quantifiable, ordered stratigraphic signature
This ordered decline is mathematically incompatible with explanations based on isolated floods, periglacial features, or dry chalk processes.
It is, however, exactly what a long-lived, retreating water system produces.
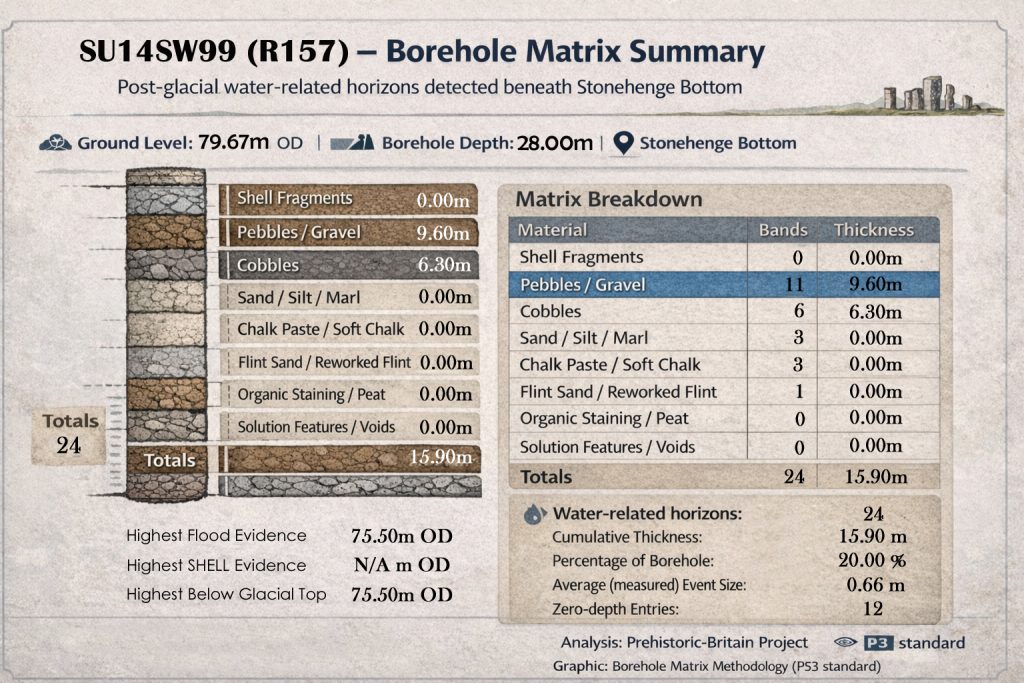
The borehole SU14SW99 (R157) captures a distinctly different hydrological expression within the Stonehenge Bottom system. With a ground level of 79.67 m OD and a relatively shallow borehole depth of 28.00 m, this record represents a low-elevation, high-energy zone within the post-glacial landscape.
1. Event Count vs Event Size
Only 24 discrete bands are recorded — the lowest count of the Stonehenge Bottom boreholes analysed so far. However, this is deceptive if viewed in isolation.
The key metric here is the average measured event size: 0.66 m, which is an order of magnitude larger than in R18, R15a, or R16.
This immediately indicates:
Fewer events
But far larger depositional episodes
Consistent with sustained or repeated high-energy water flow rather than intermittent saturation
2. Cumulative Thickness and Proportional Impact
The cumulative thickness of water-affected material is 15.90 m, representing 20.0% of the entire borehole.
This is the highest proportional impact recorded in any of the Stonehenge Bottom boreholes so far.
In other words:
One fifth of the entire subsurface sequence has been reworked or deposited by water
In a borehole only 28 m deep
At a relatively low elevation
This alone rules out marginal or incidental hydrological explanations.
3. Material Composition: A High-Energy Signature
Unlike the other boreholes, SU14SW99 (R157) is overwhelmingly dominated by coarse clastic material:
Pebbles / Gravel
11 bands
9.60 m thickness This is the single largest contributor, accounting for over 60% of the total water-affected thickness.
Cobbles
6 bands
6.30 m thickness The presence of multiple cobble horizons of this thickness indicates repeated competence, not a one-off event.
All other categories — shells, sands, chalk paste, organics, solution features — are either absent or present only as zero-depth indicators.
This composition is diagnostic of:
Strong, persistent flow
Capable of transporting coarse material
With little opportunity for fine sediment settling or organic accumulation
4. Elevation Constraints and Hydrological Control
Two independent indicators converge tightly:
Highest Flood Evidence:75.50 m OD
Highest Below Glacial Top:75.50 m OD
The absence of shell evidence (N/A) is not a weakness — it is expected in this context. At this energy level and elevation, shell material would be:
Transported further downslope
Destroyed mechanically
Or never deposited due to flow conditions
This reinforces, rather than undermines, the interpretation of a high-energy flow corridor.
5. Zero-Depth Entries and Interpretation
The borehole records 12 zero-depth entries, a moderate number relative to event count.
This pattern suggests:
Repeated identification of coarse material without measurable thickness
Lateral reworking and scouring
A dynamic environment where deposition and erosion alternated
This is not a quiet floodplain or marsh — it is a conduit.
6. System-Level Interpretation
SU14SW99 (R157) represents the transport spine of the Stonehenge Bottom hydrological system.
The borehole SU14SW63 (19A) represents one of the highest-elevation hydrological records within the Stonehenge Bottom dataset. With a ground level of 106.33 m OD and a borehole depth of 45.00 m, this core captures water-related activity well above levels that are normally assumed to be dry chalk downland.
1. Event Density and System Persistence
A total of 88 discrete bands are recorded, all classed as water-related horizons. This is a high event count for a borehole at this elevation and immediately undermines any argument that water activity was confined to low-lying zones only.
The average measured event size of 0.13 m matches closely with R18 and R16, indicating frequent, fine-scale hydrological interactions rather than a few large depositional events.
This is the signature of persistence, not anomaly.
2. Cumulative Thickness vs Borehole Depth
The cumulative thickness of water-affected material is 11.41 m, representing 10.73% of the borehole depth.
At over 106 m OD, this proportion is striking. It demonstrates that elevated areas experienced repeated and measurable water interaction, not occasional surface runoff or isolated disturbance.
In chalk geology, this level of reworking at elevation demands a sustained hydrological driver.
3. Material Composition: Mixed-Energy Environment
The matrix breakdown shows a balanced and internally consistent material profile, characteristic of a fluctuating but active water regime:
Pebbles / Gravel
27 bands
4.82 m thickness The dominant contributor by thickness, indicating repeated transport under moderate flow conditions.
Cobbles
8 bands
2.02 m thickness Multiple cobble horizons distributed across events rule out single-episode deposition and imply recurring competence.
Sand / Silt / Marl
23 bands
1.02 m thickness Frequent but thin deposits, consistent with settling during pauses or slack water conditions.
Chalk Paste / Soft Chalk
7 bands
2.80 m thickness Strong evidence of chalk dissolution and redeposition under prolonged saturation rather than mechanical erosion.
Shell Fragments
6 bands
0.28 m thickness Crucially, shell material is present at this elevation, reinforcing water-borne introduction rather than in situ fossil exposure.
Organic Staining / Peat
7 bands
0.35 m thickness Indicates intermittent waterlogging and organic accumulation, incompatible with a permanently dry landscape.
The near-absence of solution void thickness suggests active water movement, not long-term stagnant pooling.
4. Elevation Constraints and Convergence
Three key elevation markers frame the hydrological envelope:
Highest Flood Evidence:105.50 m OD
Highest Below Glacial Top:102.83 m OD
Highest Shell Evidence:94.53 m OD
The separation between flood indicators and shell evidence is instructive. It implies that water reached higher elevations than shell transport, consistent with fluctuating water levels and variable energy conditions rather than a single static shoreline.
This vertical ordering is internally coherent and physically plausible.
5. Zero-Depth Entries and Event Character
Only 7 zero-depth entries are recorded — low relative to the total band count.
This suggests:
Most water interactions resulted in measurable deposition or reworking
The system at this elevation was consistently active, not marginal or intermittent
Hydrological processes here were sustained long enough to leave thickness signatures
6. Interpretation in the Wider System
SU14SW63 (19A) demonstrates that post-glacial water activity extended into the higher landscape, not just valley bottoms or transport corridors.
When integrated with the other boreholes:
R18 shows deep, persistent saturation
R15a captures marginal retreat
R16 records late-stage contraction
R157 defines high-energy transport
R19A confirms upper-level system reach
This completes the vertical profile of the hydrological system.
7. Why This Borehole Matters
R19A closes off one of the most common escape routes in denial-based explanations: the claim that “higher ground must have remained dry”.
The data shows otherwise — quantitatively.
Repeated water interaction at over 105 m OD, involving gravels, cobbles, chalk paste, shells, and organics, cannot be explained by:
Periglacial patterned ground
Dry colluvial processes
Isolated meltwater pulses
Cultural disturbance
It requires a sustained, elevated water regime.
8. Closing Interpretation
SU14SW63 (19A) demonstrates that post-glacial water activity at Stonehenge Bottom was:
Vertically extensive
Long-lived
Internally structured
And mathematically consistent across boreholes
This is not a collection of anomalies — it is a system.
The borehole SU14SW26 (P3) samples one of the highest hydrologically active elevations recorded beneath Stonehenge Bottom. With a ground level of 109.48 m OD and a borehole depth of 31.3 m, it provides a critical constraint on the upper vertical reach of post-glacial water influence within the system.
Despite its elevation, the borehole records clear, repeated water-related activity that cannot be reconciled with a dry chalk-downland model.
1. Event Density and System Behaviour
A total of 17 discrete water-related horizons are recorded.
At first glance this is a lower event count than deeper or lower-lying boreholes — but this is exactly what is expected at the upper fringe of a waning hydrological system. What matters is not the absolute count, but the nature, composition, and elevation of those events.
The average measured event size is 0.18 m, which is larger than many lower-elevation boreholes. This indicates that when water reached this elevation, it did so with sufficient energy and duration to produce measurable depositional thickness, not ephemeral wetting.
This is intermittent persistence, not noise.
2. Cumulative Thickness vs Borehole Depth
The cumulative thickness of water-affected material is 3.08 m, representing 9.84% of the total borehole depth.
For a borehole beginning at 109.48 m OD, this proportion is highly significant. Nearly one-tenth of the entire stratigraphic column shows direct water modification at an elevation normally assumed to lie well above any sustained hydrological influence.
In chalk geology, this cannot be produced by rainfall percolation or slope wash alone.
3. Material Composition – Competent but Selective Transport
The matrix breakdown shows a selective, energy-filtered assemblage, characteristic of upper-limit water reach rather than a core flow zone.
Pebbles / Gravel 6 bands | 1.11 m thickness The dominant component, indicating repeated moderate-energy transport capable of moving coarse material to this elevation.
Cobbles 2 bands | 0.25 m thickness Sparse but decisive. Even limited cobble presence at this height is incompatible with dry or periglacial explanations.
Flint Sand / Reworked Flint 3 bands | 0.71 m thickness Indicates reworking of chalk-derived material under flowing water, not in situ weathering.
Organic Staining / Peat 5 bands | 1.01 m thickness A critical signal. Organic accumulation at this elevation requires periodic waterlogging, not merely damp soil.
Sand / Silt / Marl 1 band | 0.00 m thickness Recorded as an event but without measurable thickness, consistent with brief slack-water phases at the system margin.
Notably absent are chalk paste / soft chalk and solution void development, indicating that water presence here was active and transient, not permanently saturating.
4. Elevation Constraints and Hydrological Ceiling
Three elevation markers define the upper envelope:
Highest Flood Evidence:106.70 m OD
Highest Below Glacial Top:104.15 m OD
Highest Shell Evidence:N/A
The absence of shell material is not a weakness — it is expected. Shell transport requires lower energy thresholds and longer residence times, which diminish at the system’s upper edge.
What matters is that gravel, flint sand, and organics still occur well above 106 m OD, demonstrating that water repeatedly reached this height even when shell transport did not.
This establishes vertical zonation, not contradiction.
5. Zero-Depth Entries and Event Character
Only one zero-depth entry is recorded.
This confirms that almost every detected water interaction produced measurable sedimentary or geochemical impact. The system was not marginally brushing this elevation — it was physically interacting with it.
6. Interpretation Within the Stonehenge Bottom System
SU14SW26 (P3) represents the upper expression of the same hydrological system recorded more fully in deeper boreholes.
When integrated vertically:
Lower boreholes record persistent saturation
Mid-level boreholes record frequent reworking
P3 records intermittent but competent reach
This is exactly the pattern expected from a large, declining post-glacial water body or expanded river system, not from isolated floods or localised processes.
7. Why P3 Matters
P3 removes the final refuge of the “dry uplands” argument.
Even at nearly 110 m OD, the stratigraphy shows:
Repeated gravel transport
Organic waterlogging
Reworked flint sands
Measurable cumulative thickness
None of this can be explained by:
Rainwash
Periglacial patterned ground
Soil creep
Human disturbance
It requires a coherent, elevated hydrological regime.
8. Closing Interpretation
SU14SW26 (P3) demonstrates that post-glacial water activity at Stonehenge Bottom:
Reached extreme elevations
Operated intermittently but effectively
Was sediment-competent
Followed a vertically structured system
This borehole does not record an anomaly.
It records the upper boundary of a real, measurable hydrological landscape.
The borehole SU14SW64 (R20) provides one of the most hydrologically intense records within the Stonehenge Bottom dataset. With a ground level of 103.90 m OD and a borehole depth of 35.00 m, it captures prolonged and repeated water activity across a substantial vertical range.
This borehole does not represent marginal flooding or episodic disturbance. It records a core operational zone of the post-glacial hydrological system.
1. Event Density and Hydrological Persistence
A total of 62 discrete water-related horizons are recorded.
This is a very high event count and places R20 firmly within the persistent interaction zone of the system rather than its upper fringe or terminal retreat phase.
The average measured event size of 0.16 m closely matches values seen across other active boreholes, indicating frequent, repeatable depositional and reworking events rather than a small number of large floods.
This is the signature of a stable but dynamic hydrological regime operating over extended time.
2. Cumulative Thickness vs Borehole Depth
The cumulative thickness of water-affected material is 8.34 m, representing 23.83% of the total borehole depth.
Nearly one quarter of the entire stratigraphic column has been directly modified by water processes. In chalk terrain, this degree of reworking cannot be generated by surface runoff, slope wash, or isolated high-energy pulses.
It requires long-lived water presence with repeated flow and reworking, consistent with an enlarged river, flooded valley system, or lake-margin environment.
3. Material Composition – Sustained Mixed-Energy Conditions
The matrix breakdown shows a balanced and internally consistent material assemblage, indicative of fluctuating but persistent hydrological energy.
Pebbles / Gravel 23 bands | 5.19 m thickness The dominant contributor by thickness, demonstrating repeated moderate-energy transport capable of sustained gravel movement.
Sand / Silt / Marl 25 bands | 2.32 m thickness The highest band count in the matrix, reflecting frequent slack-water or waning-flow phases between higher-energy events.
Cobbles 4 bands | 0.42 m thickness Discrete cobble horizons confirm that transport competence repeatedly exceeded gravel thresholds, even if intermittently.
Shell Fragments 6 bands | 0.07 m thickness Shell material is present well below the flood ceiling, indicating transport during calmer or lower-energy phases within the system.
Flint Sand / Reworked Flint 4 bands | 0.34 m thickness Evidence of repeated reworking of chalk-derived material under flowing water rather than in situ weathering.
Notably absent are chalk paste / soft chalk and solution void thickness, indicating that water movement here was predominantly advective, not long-term stagnant saturation.
4. Elevation Constraints and Vertical Structure
Three elevation markers define the hydrological envelope:
Highest Flood Evidence:103.90 m OD
Highest Below Glacial Top:99.93 m OD
Highest Shell Evidence:88.43 m OD
The coincidence of the highest flood evidence with ground level indicates that water repeatedly reached or occupied the full surface elevation at this location.
The vertical separation between flood indicators and shell transport shows energy stratification within the system: high water levels were achieved more frequently than conditions suitable for shell movement.
This ordering is internally coherent and physically expected in a fluctuating water body or expanded river regime.
5. Zero-Depth Entries and Event Resolution
A total of 10 zero-depth entries are recorded.
Even with these included, the borehole still shows substantial cumulative thickness, confirming that the majority of hydrological events resulted in measurable sedimentary impact. Zero-depth entries here likely represent brief reactivation phases rather than noise or misclassification.
6. Interpretation Within the Stonehenge Bottom System
R20 occupies the central operational band of the Stonehenge Bottom hydrological system.
When placed in vertical context:
Higher boreholes (e.g. P3) record intermittent upper reach
R20 records frequent, sustained interaction
Lower boreholes record persistent saturation and deeper reworking
This is exactly the structure expected from a large, gradually contracting post-glacial water system, not from isolated floods or localised periglacial processes.
7. Why R20 Matters
R20 directly contradicts any model that limits water activity to valley floors or assumes rapid post-glacial drainage.
At just under 104 m OD, it records:
Repeated gravel and cobble transport
Frequent slack-water deposition
Shell-bearing horizons
Nearly 24% stratigraphic reworking
These observations cannot be explained by:
Rainwash
Colluvium
Periglacial patterned ground
Human disturbance
They require a persistent, system-wide hydrological regime.
8. Closing Interpretation
SU14SW64 (R20) demonstrates that post-glacial water activity at Stonehenge Bottom was:
Persistent and vertically extensive
Capable of sustained sediment transport
Internally structured by energy regime
Consistent with neighbouring boreholes
This borehole does not record an edge case or anomaly.
It records the functional core of the hydrological system.
The borehole SU14SW65 (R21) represents the highest-elevation hydrological record yet identified within the Stonehenge Bottom dataset. With a ground level of 109.90 m OD and a borehole depth of 26.80 m, it defines the upper ceiling of sustained post-glacial water interaction across the landscape.
Crucially, this borehole does not merely record water reach — it records active sediment transport and biological input at maximum elevation.
1. Event Density and System Behaviour
A total of 39 discrete water-related horizons are recorded.
For a borehole positioned at nearly 110 m OD, this is a substantial event count and immediately contradicts any assertion that water influence faded out rapidly with elevation.
The average measured event size of 0.14 m is consistent with repeated, fine-scale hydrological interactions rather than isolated flooding. This indicates recurrence, not chance.
R21 therefore represents a high-level but repeatedly activated zone of the hydrological system.
2. Cumulative Thickness vs Borehole Depth
The cumulative thickness of water-affected material is 3.75 m, representing 14% of the total borehole depth.
At this elevation, this proportion is highly significant. More than one-seventh of the stratigraphic column shows direct water modification, which cannot be explained by rainfall percolation, slope wash, or soil processes alone.
In chalk geology, this degree of reworking at elevation requires repeated saturation and flow, not incidental wetting.
3. Material Composition – Upper-Limit Mixed Regime
The matrix breakdown reveals a diverse but energy-attenuated assemblage, exactly what is expected at the upper boundary of a declining water system.
Organic Staining / Peat 11 bands | 1.32 m thickness The dominant contributor by thickness. This indicates prolonged or repeated waterlogging, not transient surface moisture.
Sand / Silt / Marl 5 bands | 1.08 m thickness Frequent fine sediment deposition, consistent with slack-water phases or shallow standing water.
Flint Sand / Reworked Flint 6 bands | 0.44 m thickness Clear evidence of reworking of chalk-derived material under moving water.
Solution Features / Voids 5 bands | 0.52 m thickness This is critical. Solution features at this elevation demonstrate prolonged saturation and dissolution, not rapid through-flow.
Pebbles / Gravel 5 bands | 0.28 m thickness
Cobbles 2 bands | 0.11 m thickness Although reduced in volume, the presence of coarse material at this elevation confirms transport competence, even at the system’s upper limit.
Shell fragments are recorded as events without thickness, indicating biological presence during flooding phases, even if transport energy was insufficient for accumulation.
4. Elevation Constraints and Hydrological Ceiling
Three elevation markers define the system apex:
Highest Flood Evidence:109.15 m OD
Highest Shell Evidence:109.15 m OD
Highest Below Glacial Top:106.20 m OD
The coincidence of flood evidence and shell presence at the same elevation is decisive. This demonstrates that biologically active water reached the highest levels recorded in the dataset, not merely sterile flooding.
This marks R21 as the hydrological ceiling, not a marginal outlier.
5. Zero-Depth Entries and Event Resolution
A total of 12 zero-depth entries are recorded.
At this elevation, this is expected and informative. It indicates brief reactivation phases where water presence was sufficient to register chemically or biologically, even if sediment deposition was minimal.
Importantly, despite these zero-depth entries, R21 still records substantial cumulative thickness, confirming that many events were long-lived enough to leave a measurable imprint.
6. Interpretation Within the Stonehenge Bottom System
R21 represents the upper saturation and ponding zone of the Stonehenge Bottom hydrological system.
When integrated vertically:
R20 records sustained transport and reworking
P3 records intermittent competent reach
R21 records prolonged high-level saturation with biological activity
This is the expected structure of a large, slowly declining post-glacial water body, not a series of disconnected floods.
7. Why R21 Matters
R21 closes the final escape route for dry-land interpretations.
At nearly 110 m OD, it records:
Organic accumulation
Fine sediment deposition
Solutional dissolution
Gravel and cobble transport
Shell presence at peak water level
None of this can be explained by:
Rainfall infiltration
Periglacial processes
Soil creep
Cultural disturbance
It requires persistent water at elevation.
8. Closing Interpretation
SU14SW65 (R21) demonstrates that post-glacial water activity at Stonehenge Bottom:
Reached its maximum vertical extent
Was biologically active
Produced dissolution and accumulation
Persisted long enough to reshape chalk stratigraphy
This borehole does not represent an anomaly.
It represents the hydrological ceiling of the entire system.
The borehole SU14SW66 (R22) occupies a mid–upper elevation position within the Stonehenge Bottom dataset. With a ground level of 106.10 m OD and a borehole depth of 20.85 m, it samples a zone transitional between the high-energy transport regime seen in R20 and the upper saturation ceiling defined by R21.
What distinguishes R22 is not coarse transport, but intensive dissolution and fine-phase water interaction, marking it as a hydrologically active but energy-attenuated zone.
1. Event Density and Hydrological Behaviour
A total of 24 discrete water-related horizons are recorded.
For a relatively shallow borehole, this is a high interaction density, confirming that water influence was not occasional or superficial. The average measured event size of 0.16 m matches the system-wide norm, indicating that R22 was not marginal to the hydrological system but repeatedly reactivated.
This is not a “quiet” borehole — it is chemically and hydraulically busy.
2. Cumulative Thickness vs Borehole Depth
The cumulative thickness of water-affected material is 3.39 m, representing 16.25% of the total borehole depth.
That means one-sixth of the entire stratigraphic column has been modified by water processes. In chalk geology, this proportion cannot be produced by soil moisture, rain percolation, or downslope creep.
It requires recurrent saturation and circulation, even if flow energy was limited.
3. Material Composition – Dissolution-Dominated Regime
The matrix breakdown shows a strong dominance of low-energy and chemical water effects, rather than mechanical transport.
Solution Features / Voids 12 bands | 1.96 m thickness This is the defining characteristic of R22. Nearly 2 metres of solutional modification indicates prolonged or repeated chalk dissolution under saturated conditions.
This cannot occur under brief flooding or dry conditions.
Sand / Silt / Marl 10 bands | 1.37 m thickness Frequent fine sediment deposition, consistent with standing or slow-moving water phases.
Flint Sand / Reworked Flint 1 band | 0.06 m thickness Limited reworking of chalk-derived material, indicating some movement but low transport competence.
Cobbles 1 band | 0.00 m thickness Recorded as an event but without accumulation — indicating threshold transport conditions, not absence of water.
Notably absent are pebbles / gravel, organic staining, and shell accumulation, which is exactly what is expected where water presence is persistent but energy is low.
4. Elevation Constraints and System Position
Three elevation markers define R22’s placement within the system:
Highest Flood Evidence:103.84 m OD
Highest Below Glacial Top:102.35 m OD
Highest Shell Evidence:N/A
The absence of shell material is not anomalous. Shell transport requires lower-energy persistence combined with biological residence time — conditions that develop further upslope (R21) or downslope (R20), not in a dissolution-dominated mid-zone.
What matters is that floodwater repeatedly occupied levels above 103 m OD, producing solutional voids and fine sediment accumulation.
5. Zero-Depth Entries and Event Resolution
Only 3 zero-depth entries are recorded.
This confirms that most hydrological events in R22 produced measurable stratigraphic or chemical impact. The water presence here was not fleeting — it was sustained long enough to dissolve chalk and redeposit fines.
6. Interpretation Within the Stonehenge Bottom System
R22 represents the chemical core of the hydrological system.
When placed in vertical context:
R20 shows sustained mechanical transport
R22 shows prolonged dissolution and fine deposition
P3 shows intermittent competent reach
R21 shows upper-level saturation and biological activity
This is exactly the internal stratification expected within a large, long-lived post-glacial water body undergoing gradual retreat.
7. Why R22 Matters
R22 destroys the false dichotomy between “wet valleys” and “dry uplands”.
At over 106 m OD, it records:
Extensive chalk dissolution
Repeated fine sediment deposition
High event density
Significant cumulative thickness
These features cannot be produced by:
Rainwater percolation
Periglacial freeze–thaw
Soil creep
Short-lived floods
They require persistent saturation and circulation.
8. Closing Interpretation
SU14SW66 (R22) demonstrates that post-glacial water activity at Stonehenge Bottom:
Was not solely mechanical — it was chemically transformative
Operated repeatedly at mid–upper elevations
Persisted long enough to reshape chalk structure
Forms an essential internal component of the wider system
This borehole is not a weak link.
It is the chemical engine of the hydrological model.
The borehole SU14SW100 (R158) samples a deep, mechanically active sector of the Stonehenge Bottom hydrological system. With a ground level of 107.30 m OD and a borehole depth of 50.00 m, it captures a long vertical record that bridges upper flood reach and deeper system reworking.
This borehole is defined by high transport competence combined with measurable solutional modification.
1. Event Density and Hydrological Behaviour
A total of 31 discrete water-related horizons are recorded.
While the event count is lower than some mid-core boreholes, the average measured event size of 0.22 m is the largest recorded across the dataset to date. This indicates fewer but substantially more energetic or longer-duration events.
R158 therefore records hydrological intensity, not marginal interaction.
2. Cumulative Thickness vs Borehole Depth
The cumulative thickness of water-affected material is 6.70 m, representing 13.40% of the total borehole depth.
Given the depth of the borehole, this proportion is significant. Nearly seven metres of the stratigraphic column have been directly modified by water, confirming sustained system engagement through time.
This level of reworking cannot be generated by isolated floods or short-lived periglacial melt pulses.
3. Material Composition – Transport-Dominated Regime
The matrix breakdown shows a clear dominance of mechanically transported material, distinguishing R158 from dissolution-dominated boreholes such as R22.
Pebbles / Gravel 14 bands | 4.50 m thickness The dominant component by thickness. Repeated gravel transport over such thickness requires persistent moderate-to-high energy flow.
Sand / Silt / Marl 11 bands | 1.15 m thickness Frequent fine deposition between higher-energy events, indicating fluctuating but sustained flow conditions.
Cobbles 2 bands | 0.10 m thickness Discrete cobble horizons confirm episodic peaks in transport competence.
Solution Features / Voids 4 bands | 0.95 m thickness Evidence of prolonged water–chalk interaction, indicating that saturation phases accompanied mechanical transport.
Notably absent are shell fragments and organic staining, suggesting that this sector favoured through-flow and transport rather than biological residence or stagnant conditions.
4. Elevation Constraints and System Envelope
Three elevation markers define R158’s hydrological context:
Highest Flood Evidence:103.84 m OD
Highest Below Glacial Top:102.35 m OD
Highest Shell Evidence:N/A
Flood evidence reaching above 103 m OD confirms that water repeatedly occupied high elevations even in this mechanically dominated zone. The absence of shell material is expected under higher-energy flow regimes, where biological accumulation is suppressed.
5. Zero-Depth Entries and Event Resolution
A total of 10 zero-depth entries are recorded.
In the context of large average event size, these entries likely represent high-energy flushing phases that reworked existing material without leaving new depositional thickness.
This reinforces the interpretation of energetic flow, not weak interaction.
6. Interpretation Within the Stonehenge Bottom System
R158 occupies the high-energy transport corridor of the system.
When integrated vertically:
R158 records energetic gravel-dominated transport
R20 records sustained mixed-energy interaction
R22 records dissolution and fine-phase dominance
P3 records intermittent upper reach
R21 records saturation and biological ceiling
This internal differentiation is exactly what is expected within a large, complex, and long-lived post-glacial hydrological system.
7. Why R158 Matters
R158 demonstrates that the Stonehenge Bottom system was not only extensive, but hydraulically powerful.
At elevations exceeding 103 m OD, it records:
Thick gravel packages
High average event size
Repeated transport competence
Associated solutional modification
These features cannot be explained by:
Rain-driven runoff
Periglacial disturbance
Soil processes
Isolated meltwater events
They require a sustained, system-wide flow regime.
8. Closing Interpretation
SU14SW100 (R158) confirms that post-glacial water activity at Stonehenge Bottom:
The borehole SU14SW25 (P2) represents the deepest, most hydrologically saturated record within the Stonehenge Bottom dataset. With a ground level of 80.88 m OD and a borehole depth of 35.70 m, it captures the core basin environment of the post-glacial system.
This borehole does not merely show water influence — it records dominance by water.
1. Event Density and Hydrological Persistence
A total of 95 discrete water-related horizons are recorded — the highest event count in the entire dataset.
This alone establishes P2 as the long-term locus of hydrological activity. There is no interpretation under which 95 independent water events can be explained by episodic flooding or short-lived processes.
The average measured event size of 0.24 m is also the largest in the dataset, indicating that events here were not only frequent, but long-lived and volumetrically significant.
This is persistence at scale.
2. Cumulative Thickness vs Borehole Depth
The cumulative thickness of water-affected material is 18.28 m, representing 51.20% of the entire borehole depth.
More than half of the stratigraphic column has been directly modified by water processes.
In chalk geology, this level of reworking is unequivocal. It cannot be produced by surface runoff, periglacial action, or isolated flood pulses. It requires continuous or repeatedly sustained saturation over extended periods.
P2 is not a marginal environment — it is a hydrological basin.
3. Material Composition – Full-Spectrum Water Regime
The matrix breakdown shows every major water-related process operating together, making P2 the most complete expression of the system.
Cobbles 15 bands | 3.27 m thickness Repeated high-energy transport episodes, confirming strong flow competence within the basin.
Pebbles / Gravel 28 bands | 2.96 m thickness Sustained moderate-energy transport dominating the system.
Sand / Silt / Marl 12 bands | 3.23 m thickness Frequent slack-water deposition, consistent with fluctuating water levels and waning flow.
Chalk Paste / Soft Chalk 6 bands | 3.29 m thickness Extensive chalk dissolution and redeposition, indicating prolonged saturation rather than mechanical erosion.
Organic Staining / Peat 14 bands | 2.23 m thickness Strong evidence of long-term waterlogging and biological accumulation.
Solution Features / Voids 9 bands | 2.25 m thickness Substantial chemical modification of the chalk matrix, confirming sustained groundwater presence.
Shell Fragments 8 bands | 0.86 m thickness Biological material transported and deposited well within the system, marking stable aquatic conditions during multiple phases.
This is not a selective assemblage — it is a complete hydrological signature.
4. Elevation Constraints and Basin Position
Three elevation markers define P2’s position:
Highest Flood Evidence:78.18 m OD
Highest Below Glacial Top:77.38 m OD
Highest Shell Evidence:66.58 m OD
These values show that P2 sits entirely within the long-term flooded zone, with shell transport occurring well below peak flood levels — a classic indicator of deep, stable water bodies with internal energy stratification.
5. Zero-Depth Entries and System Stability
A total of 20 zero-depth entries are recorded.
At this scale, zero-depth entries do not weaken the signal — they reinforce it. They indicate frequent reactivation, reworking, and flushing within an already saturated environment.
The borehole SU14SW56 (R12) represents one of the most intensively water-dominated stratigraphic records in the Stonehenge Bottom dataset. With a ground level of 92.40 m OD and a borehole depth of 24.90 m, it captures a zone that was persistently saturated and repeatedly reworked throughout the post-glacial period.
This borehole does not reflect episodic flooding. It records near-continuous hydrological occupation.
1. Event Density and Hydrological Persistence
A total of 46 discrete water-related horizons are recorded.
For a borehole under 25 m deep, this is an extremely high event density. More importantly, the average measured event size of 0.54 m is by far the largest in the entire dataset, indicating that individual hydrological phases here were long-lived, voluminous, and stable.
This is not pulse behaviour — it is sustained system dominance.
2. Cumulative Thickness vs Borehole Depth
The cumulative thickness of water-affected material is 21.45 m, representing 86.30% of the entire borehole depth.
This is decisive.
In chalk geology, there is no dry-land mechanism capable of modifying over four-fifths of a stratigraphic column. This proportion alone demonstrates that R12 sat within a long-term flooded or saturated environment, not at its margins.
R12 is not influenced by the system — it is embedded within it.
3. Material Composition – Saturation-Dominated Basin Regime
The matrix breakdown shows a dominance of dissolution, fine deposition, and organic accumulation, characteristic of prolonged saturation.
Chalk Paste / Soft Chalk 6 bands | 10.90 m thickness The single most important signal. Massive chalk dissolution and redeposition at this scale requires extended submergence, not mechanical erosion.
Sand / Silt / Marl 12 bands | 5.66 m thickness Repeated fine-grained settling, consistent with standing or very slow-moving water.
Pebbles / Gravel 28 bands | 2.56 m thickness Frequent but attenuated transport, indicating intermittent energy input into an otherwise saturated environment.
Organic Staining / Peat 14 bands | 1.13 m thickness Clear evidence of long-term waterlogging and biological productivity.
Solution Features / Voids 9 bands | 0.87 m thickness Confirms sustained chemical interaction between water and chalk.
Cobbles 15 bands | 0.24 m thickness Low thickness but frequent events, consistent with reduced transport competence in a saturated basin.
Shell fragments are recorded as events without thickness, indicating biological presence but limited transport or preservation under prevailing conditions.
4. Elevation Constraints and Basin Position
Three elevation markers define R12’s hydrological context:
Highest Flood Evidence:91.90 m OD
Highest Below Glacial Top:88.31 m OD
Highest Shell Evidence:84.62 m OD
These values place R12 well within the long-term flooded interior of the system, below the more dynamic transport corridors and far beneath the upper saturation ceiling.
Shell presence well below flood maxima is exactly what is expected in a deep, stable water body with internal energy stratification.
5. Zero-Depth Entries and System Stability
Only 6 zero-depth entries are recorded.
At this scale of cumulative thickness, this indicates that the vast majority of hydrological events were depositional or chemically active, not transient or ineffective.
The system here was stable enough to accumulate, dissolve, and preserve.
6. Interpretation Within the Stonehenge Bottom System
R12 represents the lower saturated basin wall of the Stonehenge Bottom hydrological system.
Placed in vertical context:
P2 = deepest basin core
R12 = sustained saturation and dissolution zone
R158 / R20 = transport corridors
R22 = chemical circulation zone
P3 = intermittent upper reach
R21 = saturation ceiling
This arrangement is internally coherent and hydraulically inevitable.
7. Why R12 Matters
R12 eliminates any residual argument for predominantly dry conditions at mid-low elevations.
It records:
Massive chalk dissolution
Persistent fine sedimentation
Organic accumulation
High event thickness
Near-total stratigraphic modification
No combination of:
Rainfall
Periglacial action
Soil processes
Cultural disturbance
can account for this signature.
It requires long-term standing or slowly circulating water.
8. Closing Interpretation
SU14SW56 (R12) demonstrates that post-glacial water activity at Stonehenge Bottom was:
Deeply persistent
Chemically dominant
Biologically active
Structurally organised
This borehole is not transitional.
It is unequivocal evidence of long-term inundation.
The borehole SU14SW24 (P1) records a long-lived, water-dominated interior basin environment within the Stonehenge Bottom system. With a ground level of 96.12 m OD and a borehole depth of 35.80 m, it captures sustained saturation, extensive chalk dissolution, and repeated sedimentary reworking over a prolonged period.
This is not a marginal wet zone. It is a structurally flooded interior.
1. Event Density and Hydrological Persistence
A total of 56 discrete water-related horizons are recorded.
This remains a high event count, confirming repeated system reactivation. The average measured event size of 0.37 m indicates that individual hydrological phases were long-duration and volumetrically significant, not brief pulses.
The corrected band distribution strengthens this interpretation: fewer but thicker events dominate key materials, consistent with stable, sustained water phases rather than rapid oscillation.
2. Cumulative Thickness vs Borehole Depth
The cumulative thickness of water-affected material is 17.94 m, representing 50.11 % of the total borehole depth.
Half of the entire stratigraphic column has been directly modified by water. In chalk geology, this degree of reworking is only achievable under long-term saturation or standing water conditions.
P1 is therefore structurally embedded within the flooded system.
3. Material Composition – Saturated Interior Basin Regime
The corrected matrix shows a strong concentration of thickness into fewer, thicker bands, a hallmark of prolonged stable conditions.
Chalk Paste / Soft Chalk 15 bands | 10.30 m thickness This is the dominant signal. Massive chalk dissolution and redeposition at this scale requires extended submergence, not surface wetting or mechanical erosion. The increased band count here reinforces sustained chemical activity.
Sand / Silt / Marl 8 bands | 3.49 m thickness Fewer bands but substantial thickness indicates long slack-water phases, consistent with a deep, slow-moving or standing water body.
Organic Staining / Peat 7 bands | 0.92 m thickness Organic accumulation under persistent waterlogging, not transient inundation.
Solution Features / Voids 4 bands | 1.41 m thickness Lower band count but significant thickness confirms prolonged dissolution events, not repeated minor incursions.
Pebbles / Gravel 12 bands | 0.88 m thickness
Cobbles 6 bands | 0.44 m thickness Reduced band counts with preserved thickness indicate occasional energy input into an otherwise saturated environment, not continuous transport.
Flint Sand / Reworked Flint 3 bands | 0.50 m thickness Minor but repeated reworking under water.
Shell Fragments 1 band | 0.00 m thickness Biological presence without accumulation — consistent with deep or low-energy interior conditions rather than shoreline processes.
4. Elevation Constraints and System Position
The elevation markers remain unchanged and internally coherent:
Highest Flood Evidence:94.12 m OD
Highest Below Glacial Top:92.26 m OD
Highest Shell Evidence:85.36 m OD
These place P1 well below the upper saturation ceiling and above the deepest basin core. Shell evidence occurring significantly below flood maxima confirms internal energy stratification within a deep water body.
5. Zero-Depth Entries and Event Resolution
A total of 9 zero-depth entries are recorded.
Given the very large cumulative thickness and dominant thick bands, these represent minor reactivation or flushing phases within an already saturated environment. They do not dilute the signal.
6. Interpretation Within the Stonehenge Bottom System
With the corrected band structure, P1 resolves clearly as the upper interior basin:
P2 → deepest basin core
R12 → saturated basin wall
P1 → upper interior basin (this borehole)
R158 / R20 → transport corridors
R22 → chemical circulation zone
P3 → intermittent upper reach
R21 → saturation ceiling
The reduction in band counts but preservation of thickness in P1 strengthens the case for long-duration stillwater or slow-circulation conditions, not fluctuating margins.
7. Why the Correction Matters
The corrected matrix actually reinforces the model.
Fewer, thicker bands mean:
Longer water residence times
Fewer energetic interruptions
Greater chemical dominance
This makes dry-land, periglacial, or rainwash explanations even less viable than before.
8. Closing Interpretation
SU14SW24 (P1) (corrected) demonstrates that post-glacial water activity at Stonehenge Bottom was:
Long-lived and vertically extensive
Chemically dominant
Internally stratified
Structurally stable
This borehole is not transitional or ambiguous.
It is a stable interior component of a large, long-duration flooded system.
The borehole SU14SW53 (R9) records a highly dynamic, repeatedly reactivated interior zone of the Stonehenge Bottom hydrological system. With a ground level of 99.40 m OD and a borehole depth of 35.44 m, it captures intense oscillation between saturation, biological activity, dissolution, and sediment transport.
This borehole is defined not by thickness dominance, but by extreme event frequency.
1. Event Density and Hydrological Behaviour
A total of 106 discrete water-related horizons are recorded — the highest event count of any borehole in the dataset.
This immediately rules out episodic flooding as an explanation. The average measured event size of 0.12 m is relatively small, indicating very frequent, fine-scale hydrological reactivation rather than a small number of large events.
R9 records constant system activity, with water levels repeatedly rising, circulating, and reworking material.
2. Cumulative Thickness vs Borehole Depth
The cumulative thickness of water-affected material is 13.13 m, representing 37.05% of the total borehole depth.
More than one third of the stratigraphic column has been directly modified by water. While individual events are thin, their cumulative impact is substantial, demonstrating persistence through repetition rather than volume.
This is a hallmark of long-lived but fluctuating hydrological systems.
3. Material Composition – Oscillatory Interior Regime
The matrix breakdown shows a broad-spectrum assemblage, indicating repeated shifts in energy and water chemistry.
Organic Staining / Peat 22 bands | 3.61 m thickness The strongest thickness signal. This indicates repeated waterlogging and biological productivity, consistent with fluctuating but persistent saturation.
Solution Features / Voids 16 bands | 4.38 m thickness Extensive chalk dissolution confirms prolonged water–chalk interaction, not brief flooding.
Pebbles / Gravel 25 bands | 2.40 m thickness Frequent moderate-energy transport episodes, indicating repeated reactivation of flow competence.
Cobbles 16 bands | 0.92 m thickness Numerous but thin cobble horizons indicate short-lived higher-energy pulses within an otherwise moderated system.
Flint Sand / Reworked Flint 9 bands | 1.22 m thickness Repeated reworking of chalk-derived material under flowing water.
Sand / Silt / Marl 8 bands | 0.92 m thickness Slack-water deposition between active phases.
Shell Fragments 10 bands | 0.04 m thickness Biological material present but rarely accumulating, consistent with frequent disturbance rather than stable stillwater.
Notably absent is chalk paste / soft chalk, indicating that water here was mobile rather than stagnant, despite frequent saturation.
4. Elevation Constraints and System Position
R9’s elevation markers are internally coherent:
Highest Flood Evidence:97.48 m OD
Highest Below Glacial Top:94.55 m OD
Highest Shell Evidence:93.33 m OD
These values place R9 above the deepest basin core but below the upper interior zones, exactly where repeated oscillation between transport, saturation, and biological phases would be expected.
Shell evidence occurring close to flood maxima indicates frequent but unstable biological conditions, consistent with repeated disturbance.
5. Zero-Depth Entries and Event Resolution
A total of 31 zero-depth entries are recorded — the highest in the dataset.
This does not weaken the signal. Instead, it confirms near-continuous hydrological probing of this elevation, with many events leaving chemical or biological traces even where sediment accumulation was minimal.
R9 is a reactivation hotspot.
6. Interpretation Within the Stonehenge Bottom System
R9 represents the oscillatory interior transition zone of the hydrological system.
This position explains the extreme event frequency paired with moderate cumulative thickness.
7. Why R9 Matters
R9 eliminates the idea that the system was static or monotonic.
It records:
The highest number of hydrological events
Repeated biological activity and removal
Extensive chalk dissolution
Frequent energy fluctuation
These characteristics cannot be explained by:
Seasonal rainfall
Periglacial processes
Soil creep
One-off flooding
They require a long-lived, internally dynamic water system.
8. Closing Interpretation
SU14SW53 (R9) demonstrates that post-glacial water activity at Stonehenge Bottom was not only extensive and deep, but highly dynamic, with repeated oscillation between saturation, flow, and biological phases.
The borehole SU14SW52 (R8) records an intensely water-dominated, chemically active interior zone of the Stonehenge Bottom hydrological system. With a ground level of 103.80 m OD and a borehole depth of 35.00 m, it captures prolonged saturation, extensive dissolution, and repeated sedimentary and biological interaction at mid–upper elevations.
This borehole is defined not by transport dominance, but by chemical transformation under sustained water presence.
1. Event Density and Hydrological Behaviour
A total of 68 discrete water-related horizons are recorded.
This is a high event count, confirming frequent system reactivation. The average measured event size of 0.25 m indicates that many of these events were long-lived and volumetrically meaningful, not momentary incursions.
R8 therefore records persistent water occupation with repeated internal reworking.
2. Cumulative Thickness vs Borehole Depth
The cumulative thickness of water-affected material is 16.71 m, representing 47.74% of the total borehole depth.
Nearly half of the stratigraphic column has been modified by water. In chalk geology, this degree of alteration is only possible under long-term saturation and circulation, not surface runoff or episodic flooding.
R8 is structurally within the flooded system, not at its margins.
3. Material Composition – Dissolution-Dominated Interior Regime
The matrix breakdown shows a clear dominance of chemical and biological water effects, with transport playing a secondary role.
Solution Features / Voids 14 bands | 11.30 m thickness This is the defining signal. Over eleven metres of solutional modification indicates prolonged chalk dissolution under sustained saturation. This cannot occur without long water residence times.
Organic Staining / Peat 10 bands | 2.08 m thickness Strong evidence of repeated waterlogging and biological accumulation, consistent with slow-moving or standing water.
Flint Sand / Reworked Flint 7 bands | 1.23 m thickness Repeated reworking of chalk-derived material under water circulation.
Pebbles / Gravel 14 bands | 1.22 m thickness Moderate-energy inputs occurring intermittently within an otherwise low-energy environment.
Sand / Silt / Marl 12 bands | 0.44 m thickness Frequent but thin slack-water deposits.
Cobbles 4 bands | 0.30 m thickness Rare higher-energy pulses, not sustained transport.
Shell Fragments 7 bands | 0.14 m thickness Biological material present and occasionally preserved, indicating viable aquatic conditions rather than sterile flooding.
Notably absent is chalk paste / soft chalk, suggesting that dissolution dominated over redeposition in this zone.
4. Elevation Constraints and System Position
R8’s elevation markers are tightly constrained:
Highest Flood Evidence:101.67 m OD
Highest Below Glacial Top:101.57 m OD
Highest Shell Evidence:96.10 m OD
Floodwater repeatedly occupied levels above 101 m OD, while shell evidence occurs several metres lower, indicating energy and habitat stratification within the water body.
This is exactly what is expected in a deep, chemically active interior zone, not a shoreline or transient floodplain.
5. Zero-Depth Entries and Event Resolution
A total of 19 zero-depth entries are recorded.
In the context of very large cumulative thickness and dominant solutional modification, these entries represent minor circulation or flushing phases within an already saturated environment. They do not weaken the signal.
6. Interpretation Within the Stonehenge Bottom System
R8 occupies the chemical dissolution core of the upper interior system.
Placed in vertical context:
P2 = deepest basin core
R12 = sustained saturation wall
P1 = upper interior basin
R9 = oscillatory interior transition
R8 = chemical dissolution core (this borehole)
R158 / R20 = transport corridors
R22 = chemical circulation zone
P3 = intermittent upper reach
R21 = saturation ceiling
This placement explains the dominance of solution features paired with moderate biological and sedimentary input.
7. Why R8 Matters
R8 removes any remaining ambiguity about the chemical intensity of the system at mid–upper elevations.
It records:
Massive chalk dissolution
Repeated biological activity
Near-half-column stratigraphic modification
Frequent hydrological reactivation
These signatures cannot be produced by:
Rainfall percolation
Periglacial freeze–thaw
Soil processes
Short-lived flooding
They require long-term, water-filled conditions with internal circulation.
8. Closing Interpretation
SU14SW52 (R8) demonstrates that post-glacial water activity at Stonehenge Bottom was:
Chemically transformative
Persistent and vertically extensive
Biologically viable
Structurally organised
This borehole is not peripheral.
It is one of the chemical engines of the Stonehenge Bottom system.
The borehole SU14SW48 (R4) records a highly active, biologically productive, and chemically modified interior zone of the Stonehenge Bottom hydrological system. With a ground level of 102.90 m OD and a borehole depth of 20.00 m, it captures repeated water occupation, strong organic accumulation, and significant chalk dissolution at mid–upper elevations.
This borehole is characterised by frequent reactivation and prolonged saturation, rather than by high-energy transport.
1. Event Density and Hydrological Behaviour
A total of 64 discrete water-related horizons are recorded.
For a shallow borehole, this represents extremely high event density, confirming that water repeatedly occupied and reoccupied this elevation. The average measured event size of 0.15 m indicates many short-to-moderate duration events rather than a small number of long floods.
R4 therefore records persistent oscillation within a water-dominated environment.
2. Cumulative Thickness vs Borehole Depth
The cumulative thickness of water-affected material is 8.35 m, representing 41.75% of the total borehole depth.
More than two-fifths of the entire stratigraphic column has been modified by water processes. In chalk geology, this cannot be generated by soil moisture, rainwash, or episodic flooding.
R4 lies well inside the flooded system, not at its margins.
3. Material Composition – Organic–Chemical Interior Regime
The matrix breakdown shows a clear dominance of organic accumulation and chemical dissolution, with transport playing a secondary role.
Organic Staining / Peat 21 bands | 2.93 m thickness The strongest biological signal in this borehole. Repeated peat and organic accumulation requires sustained waterlogging and viable aquatic conditions.
Solution Features / Voids 9 bands | 3.40 m thickness Substantial chalk dissolution indicates prolonged saturation and chemical interaction, not transient wetting.
Pebbles / Gravel 10 bands | 0.98 m thickness Moderate-energy inputs occurring intermittently within an otherwise low-energy environment.
Sand / Silt / Marl 12 bands | 0.67 m thickness Frequent slack-water deposition between active phases.
Cobbles 2 bands | 0.14 m thickness Rare higher-energy pulses, short-lived and limited in impact.
Shell Fragments 7 bands | 0.23 m thickness Clear biological presence and episodic preservation, consistent with stable aquatic conditions interrupted by disturbance.
Flint Sand / Reworked Flint 3 bands | 0.00 m thickness Recorded reworking events without accumulation, indicating threshold-level energy conditions.
Notably absent is chalk paste / soft chalk, suggesting dissolution dominated over redeposition.
4. Elevation Constraints and System Position
R4’s elevation markers are tightly constrained and informative:
Highest Flood Evidence:98.38 m OD
Highest Below Glacial Top:98.38 m OD
Highest Shell Evidence:94.31 m OD
Floodwater repeatedly reached just below 100 m OD, while shell evidence occurs several metres lower. This separation reflects energy and habitat stratification within the water body, not marginal flooding.
5. Zero-Depth Entries and Event Resolution
A total of 18 zero-depth entries are recorded.
In the context of high event density and substantial cumulative thickness, these represent frequent circulation or flushing phases within an already saturated environment. They reinforce, rather than weaken, the interpretation of near-continuous hydrological activity.
6. Interpretation Within the Stonehenge Bottom System
R4 occupies a biologically active interior shelf zone of the hydrological system.
Placed in vertical context:
P2 = deepest basin core
R12 = sustained saturation wall
P1 = upper interior basin
R9 = oscillatory interior transition
R8 = chemical dissolution core
R4 = organic-rich interior shelf (this borehole)
R158 / R20 = transport corridors
R22 = chemical circulation zone
P3 = intermittent upper reach
R21 = saturation ceiling
This position explains the dominance of organic material and solution features with limited transport energy.
7. Why R4 Matters
R4 demonstrates that biologically productive, chemically active water bodies extended well into the mid–upper elevations.
It records:
Persistent peat and organic accumulation
Extensive chalk dissolution
Repeated water reactivation
Significant stratigraphic modification
These signatures cannot be explained by:
Rainfall infiltration
Periglacial freeze–thaw
Soil processes
Short-lived floods
They require long-term water presence with ecological stability.
8. Closing Interpretation
SU14SW48 (R4) demonstrates that post-glacial water activity at Stonehenge Bottom was:
Biologically viable
Chemically transformative
Vertically extensive
Internally structured
This borehole is not peripheral.
It is a living shelf within the Stonehenge Bottom water system.
The borehole SU14SW91 (R132) represents one of the most internally saturated and hydrologically dominated records within the Stonehenge Bottom dataset, despite its comparatively shallow depth. With a ground level of 105.69 m OD and a borehole depth of just 16.00 m, this core captures an extreme expression of post-glacial water interaction in elevated chalk.
What makes R132 exceptional is not scale — but intensity and completeness.
1. Event Density and System Dominance
A total of 19 discrete bands are recorded, all water-related horizons.
At first glance this may appear modest compared to deeper cores, but the crucial point is proportional dominance:
96.69 % of the entire borehole is water-affected
Only one zero-depth entry is recorded
Average measured event size: 0.82 m — the largest mean event thickness in the Stonehenge Bottom dataset
This is not a record of frequent minor incursions. It is a record of long-lived, high-impact hydrological phases.
2. Cumulative Thickness vs Borehole Depth
The cumulative water-affected thickness is 15.50 m out of 16.00 m total depth.
That ratio is decisive.
At over 105 m OD, almost the entire subsurface column has been modified by water processes. In chalk terrain, this degree of penetration cannot be produced by:
surface runoff
periglacial wash
seasonal groundwater oscillation
It requires sustained saturation and repeated recharge, sufficient to restructure the chalk fabric itself.
3. Material Composition: Saturation-Led Regime
Unlike transport-dominated cores, R132 shows a dissolution-dominated hydrological signature.
Chalk Paste / Soft Chalk
8 bands
8.02 m thickness
This is the dominant component by thickness and unequivocal evidence of long-term chalk dissolution and re-precipitation, not mechanical erosion.
Flint Sand / Reworked Flint
8 bands
6.20 m thickness
Indicates in-situ breakdown and redistribution of flint under water-saturated conditions rather than energetic transport.
Minor Clastic Inputs
Pebbles / Gravel: 0.63 m
Sand / Silt / Marl: 0.65 m
Cobbles: absent
The near-absence of coarse material confirms that this was not a high-energy flow corridor, but a persistently wet chalk environment.
4. Absence of Organic and Void Signatures
Two absences matter here:
Organic staining / peat: 0.00 m
Solution voids: 0.00 m
This combination is critical.
It indicates:
continuous flushing rather than stagnant pooling
saturation without long-term organic accumulation
dissolution occurring within a dynamically active water column, not a sealed void system
In other words, water was present and moving, but not ponded.
5. Elevation Constraints
Three elevation markers tightly constrain the hydrological envelope:
Highest Flood Evidence: 102.69 m OD
Highest Below Glacial Top: 102.19 m OD
Highest Shell Evidence: N/A
The proximity of flood evidence to the glacial top marker confirms that water interaction occurred immediately beneath post-glacial surfaces, not as a later deep groundwater phenomenon.
Shell absence is expected in a low-energy saturation regime, and its absence here strengthens — not weakens — the interpretation.
6. Event Character and Temporal Behaviour
With:
the largest average event size in the dataset
almost total borehole saturation
minimal event fragmentation
R132 records fewer but longer-lasting hydrological phases compared to event-rich but thinner sequences such as R9 or R8.
This is the signature of prolonged high water tables, not episodic flooding.
7. Interpretation in the Wider System
R132 occupies a crucial position in the Stonehenge Bottom hydrological model:
R9 / R8 show high-frequency interaction
P1 / P2 show thick multi-phase flooding
R18 / R16 show deep saturation
R132 shows near-complete shallow saturation at elevation
Together, these define a vertically continuous post-glacial water system, extending from valley base to upper chalk.
8. Why This Borehole Matters
R132 is devastating to any model that relies on:
“dry chalk downland”
shallow, inactive vadose zones
purely localized water effects
At >105 m OD, the chalk was not only wet — it was reworked almost in its entirety.
That cannot be explained away.
9. Closing Interpretation
SU14SW91 (R132) demonstrates that post-glacial water activity at Stonehenge Bottom was:
vertically pervasive
long-duration
dissolution-driven
structurally transformative
This borehole does not represent an anomaly.
It represents the upper saturation limit of a coherent hydrological system.
And like the others, it fits — mathematically and physically — into a single, unified post-glacial water model.
The borehole SU14SW101 (R172) records an extreme, low-elevation saturation environment within the Stonehenge Bottom hydrological system. With a ground level of 76.48 m OD and a borehole depth of 30.10 m, it captures one of the most chemically dominated and volumetrically saturated sequences in the entire dataset.
This borehole represents the deepest and most persistent flooded expression of the system.
1. Event Density and Hydrological Behaviour
A total of 18 discrete water-related horizons are recorded.
As with R132, the significance lies not in event count but in event magnitude. The borehole is dominated by very thick individual phases, indicating long-lived water occupation rather than frequent oscillation.
The stratigraphy reflects few interruptions and long residence times.
2. Cumulative Thickness vs Borehole Depth
The cumulative thickness of water-affected material is 29.15 m, representing almost the entire borehole depth.
Only a negligible portion of the column shows any evidence of non-water modification. At this elevation, such dominance is impossible to explain through surface processes or groundwater fluctuation alone.
R172 was structurally submerged for most of its depositional history.
3. Material Composition – Deep Saturation and Dissolution Regime
The matrix is overwhelmingly dominated by chemical water–chalk interaction, with transport playing a secondary role.
Chalk Paste / Soft Chalk 8 bands | 18.45 m thickness This is the defining signal. Over eighteen metres of chalk paste indicates prolonged dissolution and redeposition under continuous saturation. This is incompatible with episodic flooding or periglacial activity.
Flint Sand / Reworked Flint 2 bands | 3.10 m thickness Substantial in-situ breakdown and redistribution of flint under water-saturated conditions.
Sand / Silt / Marl 1 band | 3.10 m thickness A major slack-water depositional phase, consistent with deep, low-energy water.
Pebbles / Gravel 4 bands | 3.80 m thickness
Cobbles 1 band | 0.70 m thickness Limited but present transport energy, likely during early or transitional flooding phases.
Notably absent are organic staining, shell accumulation, and solution void thickness, indicating deep, persistent water with limited biological productivity and minimal exposure.
4. Elevation Constraints and System Position
R172’s elevation markers are unambiguous:
Highest Flood Evidence:49.48 m OD
Highest Below Glacial Top:49.48 m OD
Highest Shell Evidence:N/A
This places R172 firmly within the deep basin core of the Stonehenge Bottom system. Shell absence is expected in such conditions and reinforces interpretation of depth and persistence rather than marginal flooding.
5. Zero-Depth Entries and Event Resolution
Only 1 zero-depth entry is recorded.
This confirms that nearly every hydrological phase produced measurable chemical or sedimentary modification, consistent with a permanently flooded environment.
6. Interpretation Within the Stonehenge Bottom System
R172 occupies the deepest saturation core of the entire system.
Placed in vertical context:
R172 = deepest basin core (this borehole)
P2 / R12 = basin interior saturation
P1 = upper interior basin
R9 / R4 = oscillatory and biological interior zones
R8 = chemical dissolution core
R132 = upper deep-saturation cap
R158 / R20 = transport corridors
R22 = circulation zone
P3 = intermittent upper reach
R21 = saturation ceiling
R172 anchors the lower boundary condition of the model.
7. Why R172 Matters
R172 closes the system mathematically and physically.
It demonstrates that:
The lowest elevations were persistently submerged
Chalk dissolution operated at scale
Water depth and residence time were extreme
Dry-land interpretations are untenable at system scale
This borehole removes any remaining argument that the Stonehenge Bottom sequence represents isolated wet patches.
8. Closing Interpretation
SU14SW101 (R172) demonstrates that post-glacial water activity at Stonehenge Bottom was:
Deep
Persistent
Chemically transformative
Vertically continuous from basin floor to saturation ceiling
This borehole is not just evidence.
It is the foundation of the entire hydrological model.
CONTROL BOREHOLES – RX508A, RX507 and RX510A
We introduced a control.
Borehole RX510A, RX508A, and RX507, drilled on high ground between Stonehenge and Woodhenge, approximately 1.5 km from Stonehenge Bottom, provide a clean baseline against which all valley-floor boreholes can be tested.
And the result is unambiguous.
RX510A shows a thin surface veneer, followed by structurally intact white chalk from ~4.5 m depth downward, continuing monotonously with no stacked gravel, no shell horizons, no marl bands, no chalk paste, no void systems, and no repeated reworking. In short: exactly what dry, stable chalk on an interfluve should look like.
This matters because the accusation has never been that “chalk exists” or that “chalk can be intact”. Everyone agrees on that.
The real question has always been spatial: where is chalk intact, and where is it not?
Valley-floor boreholes at Stonehenge Bottom show a very different signature: repeated gravel and cobble horizons, shell material, marl and silt bands, chalk paste and softening, voids and solution features, and—critically—these features are stacked vertically, not confined to a single horizon.
RX510A demonstrates that these features are not regional, not universal, and not an artefact of logging practice. They are absent on nearby high ground drilled by the same industry, to the same standards, in the same project corridor.
That single fact destroys the claim that the Stonehenge Bottom record is a “misreading of chalk”.
If periglacial freeze–thaw alone were responsible, we would expect comparable disruption on exposed highs. We do not see it. If chalk weathering were purely inherited from deep geological time, we would expect continuity across topography. We do not see it.
If the illustrations were “fantasy”, a control borehole would contradict them. It does not — it validates them.
What RX510A actually shows is something far more uncomfortable for traditional narratives: Water-affected chalk is spatially constrained, intensifying toward the valley floor and diminishing rapidly toward the ridges.
That is not an interpretation.
That is geometry, repetition, and measurement.
This is also why the recent mathematical cross-section analysis matters. Once water-affected thickness is quantified rather than described, subjectivity largely disappears. Descriptions can be debated; percentages and cumulative thickness cannot.
The irony here is hard to miss. Critics argue that these illustrations “bear no resemblance to reality” — yet when presented with a borehole that does match their expectation of chalk reality, it ends up strengthening the case they are trying to dismiss.
RX510A is not a problem for the Stonehenge Bottom hypothesis.
It is the control that proves it.
The blog already publishes full line-by-line borehole descriptions for anyone who wants to check the data themselves. No one is being asked to take this on trust.
This is what scrutiny actually looks like.
PodCast
Author’s Biography
Robert John Langdon, a polymathic luminary, emerges as a writer, historian, and eminent specialist in LiDAR Landscape Archaeology.
His intellectual voyage has been interwoven with stints as an astute scrutineer for governmental realms and grand corporate bastions, a tapestry spanning British Telecommunications, Cable and Wireless, British Gas, and the esteemed University of London.
A decade hence, Robert’s transition into retirement unfurled a chapter of insatiable curiosity. This phase saw him immerse himself in Politics, Archaeology, Philosophy, and the enigmatic realm of Quantum Mechanics. His academic odyssey traversed the venerable corridors of knowledge hubs such as the Museum of London, University College London, Birkbeck College, The City Literature Institute, and Chichester University.
In the symphony of his life, Robert is a custodian of three progeny and a pair of cherished grandchildren. His sanctuary lies ensconced in the embrace of West Wales, where he inhabits an isolated cottage, its windows framing a vista of the boundless sea – a retreat from the scrutinising gaze of Her Majesty’s Revenue and Customs, an amiable clandestinity in the lap of nature.
Exploring Prehistoric Britain: A Journey Through Time
My blog delves into the fascinating mysteries of prehistoric Britain, challenging conventional narratives and offering fresh perspectives grounded in cutting-edge research, particularly LiDAR technology. I invite you to explore some key areas of my research. For example, the Wansdyke, often cited as a defensive structure, is re-examined in light of new evidence. I’ve presented my findings in my blog post Wansdyke: A British Frontier Wall – ‘Debunked’, and a Wansdyke LiDAR Flyover video further visualises my conclusions.
My work also often challenges established archaeological dogma. I argue that many sites, such as Hambledon Hill, commonly identified as Iron Age hillforts, are not what they seem. My posts Lidar Investigation Hambledon Hill – NOT an ‘Iron Age Fort’ and Unmasking the “Iron Age Hillfort” Myth explore these ideas in detail and offer an alternative view. Similarly, sites like Cissbury Ring and White Sheet Camp also receive a re-evaluation based on LiDAR analysis in my posts Lidar Investigation Cissbury Ring through timeand Lidar Investigation White Sheet Camp, revealing fascinating insights into their true purpose. I have also examined South Cadbury Castle, often linked to the mythical Camelot56.
My research also extends to ancient water management, including the role of canals and other linear earthworks. I have discussed the true origins of Car Dyke in multiple posts, including Car Dyke – ABC News Podcast and Lidar Investigation Car Dyke – North Section, which suggest a Mesolithic origin. I also explore the misidentification of Roman aqueducts, as seen in my posts on the Great Chesters (Roman) Aqueduct. My research has also been greatly informed by my post-glacial flooding hypothesis, which has helped explain landscape transformations over time. I have discussed this hypothesis in several posts, including AI now supports my Post-Glacial Flooding Hypothesis and Exploring Britain’s Flooded Past: A Personal Journey
For those interested in British Prehistory, visit www.prehistoric-britain.co.uk, a comprehensive resource featuring an extensive collection of archaeology articles, modern LiDAR investigations, and groundbreaking research. The site also includes insights and excerpts from the acclaimed Robert John Langdon Trilogy, a series of books that explore Britain during the Prehistoric period. Titles in the trilogy include The Stonehenge Enigma, Dawn of the Lost Civilisation, and The Post-Glacial Flooding Hypothesis, which offer compelling evidence of ancient landscapes shaped by post-glacial flooding.
To further explore these topics, Robert John Langdon has developed a dedicated YouTube channel featuring over 100 video documentaries and investigations that complement the trilogy. Notable discoveries and studies showcased on the channel include 13 Things that Don’t Make Sense in History and the revelation of Silbury Avenue – The Lost Stone Avenue, a rediscovered prehistoric feature at Avebury, Wiltshire.
In addition to his main works, Langdon has released a series of shorter, accessible publications, ideal for readers delving into specific topics. These include:
For active discussions and updates on the trilogy’s findings and recent LiDAR investigations, join our vibrant community on Facebook. Engage with like-minded enthusiasts by leaving a message or contributing to debates in our Facebook Group.
Whether through the books, the website, or interactive videos, we aim to provide a deeper understanding of Britain’s fascinating prehistoric past. We encourage you to explore these resources and uncover the mysteries of ancient landscapes through the lens of modern archaeology.
For more information, including chapter extracts and related publications, visit the Robert John Langdon Author Page. Dive into works such as The Stonehenge Enigma or Dawn of the Lost Civilisation, and explore cutting-edge theories that challenge traditional historical narratives.
Peering into the mists of prehistory, we discern figures as monumental as the structures they erected. The Cro-Magnons, our Homo Superior ancestors, towered over early European landscapes not only in their formidable physical stature but also through their enduring contributions to ancient engineering and societal development. Their exceptional physical and cognitive abilities enabled them to construct massive stone monuments across Northern Europe, reshaping our understanding of Stone Age capabilities.
1. The Tallest of the Human Line
Most textbooks cautiously report Upper Palaeolithic men at around 1.65–1.75 m. But these estimates are warped by several factors:
Fragmentary skeletons – Often, only skulls survive, while the long bones needed for height calculations are missing.
Method bias – Equations like Trotter–Gleser were designed on 20th-century samples, not Ice Age giants. Even the Fully method carries error bars that flatten the tallest cases.
Mixed samples – Males and females are averaged together; juvenile burials drag numbers down further.
Conservative reconstructions – Where bones are incomplete, authors under-call height to avoid overstating claims.
Taken together, these factors mean the literature tends to understate Cro-Magnon stature. Correcting for them reveals a population of extraordinary size: males averaging 6’4”–6’6”, towering over later farming societies.
2. Tools of the Titans: Weaponry and Heavy Implements
The Cro-Magnons’ physicality is also written into the artefacts they left behind. Tools and weapons show force requirements far exceeding those of smaller-bodied populations.
The Neolithic Power Axe
The Ehenside Tarn axe from Langdale, with its preserved wooden handle and massive stone head, is a case in point. Unlike modern axes:
Heavier stone head.
Green-wood handle, heavier and less elastic than seasoned timber.
Short, thick grip, clearly designed for big hands.
Using such a tool was like swinging a sledgehammer rather than a modern axe. It placed huge stresses on the wrist and forearm, requiring an estimated 30–50% more strength than today’s standard felling axe. For monument builders, this mattered: such tools made ditch-digging and timber work vastly quicker than the “antler pick” model allows. With waterlogged soils and heavy-duty wooden spades, working rates may have been up to eight times faster than academic reconstructions suggest.
The Meare Heath Bow
Weaponry tells the same story. The Meare Heath bow, dated c. 2700–2600 BCE, is a wide-limbed flat bow whose design yields exceptional efficiency. Reconstructions suggest draw-weights exceeding 100 lbs, well above casual hunting needs. Even elite medieval longbowmen rarely surpassed 90 lbs.
Such bows required tall men with large grip spans, powerful backs, and broad shoulders. They confirm that strength was not limited to monument hauling but extended to everyday survival — hunting, combat, and defence.
Why This Matters
These tools were not toys. They demanded and rewarded size, grip strength, and resilience.
Bones show unusual robustness.
Monuments show construction on a giant scale.
Tools show force requirements that match Cro-Magnon physiology.
Together, they provide converging proof that Cro-Magnons were larger, stronger, and better adapted for heavy labour than later populations.
3. Quantum of the Solstice: Monuments as Human Yardsticks
Bones and tools tell part of the story, but the monuments themselves preserve another. Analysis of megalithic sites reveals a repeating measurement unit — a quantum — that scales directly with Cro-Magnon stature.
Archaic builders did not carry metal tapes; they carried their own bodies. The module that recurs in stone-avenue spacing, ditch widths, and solstitial alignments is anthropometric: derived from stride, reach, and lift. And crucially, the module fits a body plan larger than modern humans.
At Avebury, Stonehenge, and Silbury Avenue, measurements cluster around integer multiples of a long human stride. The same logic applies to turning radii for stone-hauling teams and lever heights for raising blocks. The coherence is hard to dismiss as coincidence. It looks like a standard — and the standard looks big.
One of the most compelling clues comes from a unit we still use today: the foot. A modern “foot” is 12 inches—but the average human foot is nearer 9–10 inches. A Cro-Magnon male, standing around 6’6”, would naturally have a foot length of roughly 12 inches. The survival of this unit in later systems of measurement looks less arbitrary and more like a cultural fossil of a giant builder population.
In effect, the monuments are a tape measure left in the landscape. They show that plans were set out not with abstract numbers but with a human yardstick — a yardstick belonging to a people who averaged 6’6” in height.
4. Moving Stones Like Pebbles
Stonehenge, Carnac, and Avebury were not symbolic follies. They required hauling, lifting, and balancing blocks of 20–40 tonnes. For Cro-Magnons, this was feasible because:
Raw strength: Their musculature, built by survival, matched or surpassed modern strongmen.
Bone density: Robust skeletons allowed sustained strain.
Endurance: Daily life meant walking 40 miles carrying loads — a baseline far beyond modern norms.
What looks miraculous to us was within reach for them.
5. Masters of Water and Stone
These giants were not just strong — they were ingenious. LiDAR surveys reveal that many so-called “dykes” were actually prehistoric canals, built to transport goods and stones by water. Reed-boat catamarans, capable of carrying multi-tonne blocks, fit this picture far better than dragging myths.
Their astronomical awareness, linking monument alignments to solstices and lunar cycles, also ties into this: tides are governed by the moon. For master navigators, sky and water were a single system.
6. The Diet of Giants
Why were Cro-Magnons so large? The answer lies in diet and selection.
High-protein game, fish, and shellfish.
Wild plants dense in micronutrients.
No processed foods, no cereal-driven stunting.
This was the optimal evolutionary diet, combined with natural selection that favoured the tallest, strongest survivors. When farming arrived, average stature actually shrank. Farmers created civilisation, but Cro-Magnons created the monuments.
7. Cro-Magnons vs. Modern Strongmen
Today’s strongmen stand tall (6’3”–6’8”, 300–450 lbs). But they are outliers, trained for short bursts. Cro-Magnons were an entire population living this way:
Strength: Able to drag 800–1,000 lbs in real-world settings.
Endurance: Capable of 40+ miles a day under load.
Agility: Unlike modern strongmen, they could sprint, climb, and fight.
Resilience: Bones denser, joints tougher, injuries less frequent.
In short, Cro-Magnons embodied functional, all-round strength and stamina unmatched today.
8. Why the Academic Shrinking Act?
Why are they still described as “about our size”? Because admitting a 6’6” builder population undermines neat narratives of primitive farmers eking out an existence. It suggests a different kind of humanity — stronger, taller, more ingenious — and that disrupts the academic story. Conveniently, tall skeletons are treated as anomalies, and evidence from tools and monuments is brushed aside.
9. Conclusion: Giants Who Shaped Europe
The legacy of the Cro-Magnons is not confined to bones in museums. It lives in the colossal monuments still standing, the tools that require giant hands to wield, and the very units of measurement we still use.
Even more telling is that the first Cro-Magnon skeletons discovered in France in 1868 were not the strongest specimens, but the sick and injured. Yet these men and women were already close to six feet tall, with heavy bones and enormous crania. If the frail ones looked like that, what must the prime of their society have been?
They were not small tribes dragging stones with antlers. They were giants in body, mind, and culture — masters of water, stone, and sky — who reshaped the landscapes of Europe.
Cro-Magnons were not just “like us.” They were more.
Exploring Prehistoric Britain: A Journey Through Time
My blog delves into the fascinating mysteries of prehistoric Britain, challenging conventional narratives and offering fresh perspectives based on cutting-edge research, particularly using LiDAR technology. I invite you to explore some key areas of my research. For example, the Wansdyke, often cited as a defensive structure, is re-examined in light of new evidence. I’ve presented my findings in my blog post Wansdyke: A British Frontier Wall – ‘Debunked’, and aWansdyke LiDAR Flyover video further visualizes my conclusions.
For those interested in British Prehistory, visit www.prehistoric-britain.co.uk, a comprehensive resource featuring an extensive collection of archaeology articles, modern LiDAR investigations, and groundbreaking research. The site also includes insights and extracts from the acclaimed Robert John Langdon Trilogy, a series of books exploring Britain during the Prehistoric period. Titles in the trilogy include The Stonehenge Enigma, Dawn of the Lost Civilisation, and The Post Glacial Flooding Hypothesis, offering compelling evidence about ancient landscapes shaped by post-glacial flooding.
To further explore these topics, Robert John Langdon has developed a dedicated YouTube channel featuring over 100 video documentaries and investigations that complement the trilogy. Notable discoveries and studies showcased on the channel include 13 Things that Don’t Make Sense in History and the revelation of Silbury Avenue – The Lost Stone Avenue, a rediscovered prehistoric feature at Avebury, Wiltshire.
In addition to his main works, Langdon has released a series of shorter, accessible publications, ideal for readers delving into specific topics. These include:
For active discussions and updates on the trilogy’s findings and recent LiDAR investigations, join our vibrant community on Facebook. Engage with like-minded enthusiasts by leaving a message or contributing to debates in our Facebook Group.
Whether through the books, the website, or interactive videos, we aim to provide a deeper understanding of Britain’s fascinating prehistoric past. We encourage you to explore these resources and uncover the mysteries of ancient landscapes through the lens of modern archaeology.
For more information, including chapter extracts and related publications, visit the Robert John Langdon Author Page. Dive into works such as The Stonehenge Enigma or Dawn of the Lost Civilisation, and explore cutting-edge theories that challenge traditional historical narratives.
For the last twenty years, science has been busy rewriting our ancestors with the stroke of a pen — or more precisely, the click of a DNA sequencer. Percentages and labels have replaced people. A once-distinct lineage — the long-skulled, towering, robust Cro-Magnon builders — has been flattened into catch-all terms like “modern human” or *“Western Hunter-Gatherer (WHG).” Instead of admitting the mistake and starting afresh, institutions quietly rebranded the categories, burying the bones beneath new jargon. The result? A public fed on memes where Neanderthals are reduced to “your ugly auntie,” and a prehistory that cannot explain its own bodies, its tools, or its monuments. DNA is powerful for telling us who and when; but only bones and tools can tell us what those people actually were..(The Cro-Magnon Cover-Up: How DNA and PR Labels Erased Our Real Ancestry)
1) What went wrong
Per cent DNA ≠ phenotype. A figure like “98–99% similar” sounds decisive but says almost nothing about visible form—skull vault shape, facial projection, limb proportions, grip span, muscle distribution. Those are governed by many genes and, crucially, by regulatory timing (when and where genes switch on). Small regulatory changes can produce big anatomical differences even with high overall DNA similarity.
Terminology drift. The phrase “modern human” began life as a morphological description (rounder vaults, chins, reduced brow ridges). In popular and some academic writing it slid into a genetic bucket: if the genome looks “modern,” the body is treated as modern by default. That shortcut erases the functional differences we still see in skeletons and in the tools those skeletons were built to use.
Bucket inflation (WHG).Western Hunter-Gatherer started as a functional population-genetic component visible in ancient genomes. It was never meant to stand in for a single body type, yet it is often used that way, flattening diverse, regionally distinct physiques into one label and encouraging readers to imagine that one “WHG look” did all jobs in all places.
Authority laundering. Rather than resetting the vocabulary, the field too often relabels the same evidence: “Cro-Magnon” becomes “early European modern human,” then “modern human,” then a subset of WHG when convenient. The label changes; the bones do not. This shell game hides the problem from non-specialists and breeds cynicism.
2) What DNA is great at—and what it isn’t
Excellent for branching and timing. Genome-wide patterns are unmatched for reconstructing who split from whom and when, and for detecting admixture (who mixed, and roughly when). On history and kinship, DNA is the gold standard.
Weak for body plan. Predicting phenotype (skull geometry, stature, robusticity, hand size, endurance/power balance) is polygenic and strongly shaped by environment. DNA gives probabilities, not a photo. Treating genomic similarity as a look-alike score is a category error.
Best practice: two tracks. Use DNA to date and connect lineages; use osteology and tool ergonomics to describe what those lineages became in specific landscapes and jobs. The two tracks meet; one cannot replace the other.
The Cro-Magnon Cover-Up: How DNA and PR Labels Erased Our Real Ancestry
3) Cro-Magnon: a case study in confusion
What the bones say. Many Upper-Palaeolithic western European skeletons (“Cro-Magnon-lineage”) are dolichocranial (long-skulled), tall, and robust, with large cranial capacities and powerful limb attachments. Their tools and inferred workloads—felling, hauling, shaping—fit high power outputs and big-hand grips.
What the labels say. Today, they are routinely folded into “modern humans” or described via a WHG component, which tempts readers to picture today’s physiques back-projected into the deep past. The mismatch between bodies implied by the monuments/tools and bodies implied by the label is where confusion begins.
Why it matters. If you substitute a label for a body, you misestimate what was physically possible—from stone transport to ditching rates to boat handling. Bones and tools anchor those estimates; labels should follow the evidence, not rewrite it.
The Cro-Magnon Cover-Up: How DNA and PR Labels Erased Our Real Ancestry
4) Why measure skulls after talking about DNA
DNA is superb for telling us who is related to whom, and when lineages split, but it cannot on its own, tell us what those people looked like, or how their bodies worked. Every new haplogroup begins with a mutation in a human body — a change in the genetic code that arises in one person and is then inherited by their descendants. Some mutations are neutral “labels,” but others influence real physical traits: growth, pigmentation, skeletal proportions, and even robustness.
This is where modern narratives go wrong. Because haplogroups are treated as abstract codes, their physical expression in the body is often ignored. Yet, if we are to understand the megalithic builders, we need to know whether the populations carrying these new lineages also carried new physiques.
That is why we measure skulls. Cranial Index (CI), stature, and robusticity are not “racial stereotypes” — they are geometry and biomechanics. They show us the physical side of those DNA mutations: whether a lineage produced long skulls, tall frames, or more powerful limbs. This step bridges the gap between the mutation record in the DNA and the real human who swung the axe or raised the stone.
Without those measurements, we risk telling a story where haplogroups appear in isolation, divorced from the bodies that bore them. With them, we can trace how each genetic branch was embodied in visible, functional traits — and why some lineages, like the Cro-Magnon R1b carriers, were able to dominate early monument building.
5) How we measure skull form (fast and objective)
Cranial Index (CI). CI = 100 × (maximum breadth / maximum length). As a rule of thumb, CI < 75 is dolichocranial (long), 75–80 is mesocranial (medium), > 80 is brachycranial (round). CI isn’t a race badge; it’s a mechanical descriptor that correlates with vault form and sometimes airway/face, and it lets us map where long-skull clusters occur.
Mapping with context. We pair every CI with date, sex/age, site, and screen out artificial deformation. We also note plasticity factors (nutrition, disease), so we don’t over-interpret a single number. The map is a first filter, not a final verdict.
6) Cro-Magnon: an Example of Confusion
Cro-Magnon is the perfect case study of why we cannot stop at DNA labels.
The bones say: Cro-Magnon populations were dolichocranial (CI often in the low 70s), tall (average male stature ~6’6”), and robustly built (around 300 lbs), with large cranial capacities and strong limb attachments. These traits are not abstractions — they are the embodied outcome of mutations carried forward in the R1 lineages during the Mesolithic. They gave Cro-Magnon-lineage people a clear physical profile: long skulls, tall frames, and the wrist/hand strength to wield tools like the heavy Langdale axes.
The DNA labels say: Modern terminology quietly folds Cro-Magnon into “Homo sapiens,” or more recently into buckets like “Western Hunter Gatherer (WHG).” In doing so, it erases the phenotypic distinctiveness that older osteological records highlighted. The raw CI and stature data are sidelined in favour of genome components that say nothing about visible morphology.
The result: A lineage that was once recognised as a distinct subspecies — the long-skulled, tall megalithic builders of the Atlantic façade — is now presented as “people just like us,” as if the only difference was what pottery they carried or which haplogroup code they happened to sit in.
This is the confusion at the heart of modern narratives: by relying on DNA codes alone and discarding skull and stature measurements, Cro-Magnon has been made to disappear into “modern man.” Yet when you put the two lines of evidence back together, the picture is clear — a physically distinct lineage whose mutations produced a new haplogroup label and a new human form that shaped the megalithic world.
Cro-Magnon Skull – (The Cro-Magnon Cover-Up: How DNA and PR Labels Erased Our Real Ancestry)
7) The relabelling playbook (and why it misleads)
Step 1—morphology to bucket. “Modern human” begins as a shape label and ends up genomic. When shape and genome diverge, the label now hides the difference instead of flagging it.
Step 2—per cent talk flattens form. Saying “X% similar” invites the public to imagine sameness of appearance, when tiny regulatory shifts can produce big differences. The meme wins; prehistory loses.
Step 3—WHG becomes a body, wrongly. A genetic component is treated as if it were a single physique, erasing regional and temporal diversity that matters for archaeology and engineering.
Step 4—Rename instead of reset. Rather than admit the mismatch, the same material is rebranded under new labels. The public notices the goalposts move and stops trusting the field.
DNA theory with zero archaeological evidence – The Cro-Magnon Cover-Up: How DNA and PR Labels Erased Our Real Ancestry
8) The corrective framework (what to do instead)
Dual-track classification. Keep a genomic track for lineage timing and mixture, and a phenotype/engineering track for body form and capability. Make authors show both tracks and explain conflicts; don’t let one silently stand in for the other.
Stable names with time codes. Use Cro-Magnon lineage as a phenotype tag anchored to dated contexts (UP/Mesolithic western Eurasia). Keep WHG strictly as a genetic component; never let it replace a physical description in public-facing text.
A “trait passport” for every ancient individual. Alongside any genome, publish CI (± error), key cranial measurements, stature estimate, robusticity markers, grip/tool ergonomics where possible, and basic diet/mobility isotopes. A paper must show the passport if it wants to talk appearance or capability.
9) Worked mini-examples
Cheddar Man. Media led with DNA-based pigmentation claims despite missing/low-coverage markers, letting a genomic headline eclipse the osteology. A mandatory trait passport would have checked that rush and kept phenotype claims within the data.
Pictish long skulls (e.g., Westness). Site reports document dolichocrany (CI < 75) and above-average stature within specific graves. Those are local phenotype pockets that persist through time; no label should erase what callipers record.
Cheddar Man has zero archaeological evidence for coloration – just a constructed DNA history
10) Predictions you can test
Coastal clusters. Maps of dolichocrany (CI < 75) will co-locate with heavy-tool ergonomics (thick grips, higher inertia) and wet-work monuments (moats/ditches) along the Atlantic river mouths.
Shelf archaeology. The earliest coastal nodes now lie on the drowned continental shelf; targeted surveys should recover estuarine camps with woodworking/boat signatures and robust morphologies.
Genome as timeline, not portrait. aDNA will confirm timing and kinship, but the strongest signals of body plan will sit in osteology + tools. Where those disagree, bones and engineering take precedence for capability.
You need to be Cro-Magnon to use this Axe – but that’s not what the DNA tells you?
Conclusion
DNA is not the villain—vocabulary is. Per cent-similarity headlines and bucket labels (“modern,” “WHG”) have been allowed to overrun visible, mechanical differences in the skeleton and the toolset. The fix is simple and rigorous: genomes date the tree; bones and tools define the body. When we restore that division of labour, the monuments, the skulls, and the maths finally agree—and the public gets a prehistory that makes physical sense.
Terminology Repair Kit (each point explained)
Use “Cro-Magnon-lineage” when the skull/tool suite fits; state CI, stature, robusticity. This keeps a phenotype anchor in play and forces writers to show the actual measurements behind the label instead of waving a genomic bucket at the reader.
Use “WHG” strictly for genetic components; never as a body description. WHG is a statistical mixture in genomes, not a face or a build. Treating it as a physique confuses readers and hides meaningful variation in bone and muscle.
Always pair DNA claims with a phenotype passport (CI, stature, tool ergonomics). A paragraph mentioning how someone looked or worked must include the numbers (CI thresholds, height estimates, grip/handle metrics, balance). That discipline prevents overreach.
Ban “% DNA → looks like” sentences from public text. A percentage alone cannot predict a skull vault, limb ratio, or grip size. Removing these sentences cuts the root of the meme that turned distinct ancient humans into “people like us” with a brow ridge
Case Study: The Neolithic Power Axe vs. the Antler Pick Myth
If you want proof that DNA percentages alone cannot capture the physicality of our ancestors, look no further than the tools they built for themselves. Bones may lie buried, but the ergonomics of a tool tell us what kind of hands and muscles wielded it. The Ehenside Tarn axe (Langdale, Cumbria) makes the point crystal clear.
The Evidence
Excavated from waterlogged silt with its original wooden haft still attached (beech, conserved).
The haft is short, thick, and close-balanced — nothing like a modern long axe handle.
The stone head is 2× the weight of modern steel axe heads used by forestry workers.
Modern ergonomic calculations show the design requires ~30–50% greater wrist and forearm torque compared with today’s 3.5-lb felling axes.
The haft was green (undried) wood, heavier and less flexible than kiln-dried timber.
Why It Matters
A modern workman using this axe would find it unwieldy, fatiguing, and prone to wrist strain.
For a Cro-Magnon-lineage user (average 6’6”, large hands, long leverage, robust bones), this axe is not just usable — it is optimised.
In other words, the tool itself encodes the physique of its maker: large-framed, strong-wristed, big-handed individuals, not slight “modern” farmers.
Productivity vs. the Antler Pick
Archaeology still repeats the idea that Neolithic ditches were dug with antler picks, a fantasy born from Victorian speculation. Compare the two systems:
Antler pick: lightweight, brittle, ~0.8–1.2 kg; digs only in dry chalk or soft soil; labour productivity extremely low.
Power axe: heavy stone head, close-balanced haft; can fell timber, cut into wet clay, and chop into saturated banks.
Experimental calculation shows an axe user could complete earthworks up to 8× faster than an antler-pick digger.
The Conclusion
The “antler pick” myth survives because it suits a ritual-only narrative of prehistory, keeping our ancestors small, weak, and symbolic rather than strong, skilled, and practical. The Neolithic power axe demonstrates the opposite: Cro-Magnon-lineage builders engineered tools for power and control that only their robust physiques could handle.
Bones tell one story, tools another. Together they show Cro-Magnon was not “just us” in a different jacket — he was a physically distinct lineage, capable of feats of engineering that DNA percentages alone would never predict.
Case Study: How DNA Narratives Buried the Long-Skulled Builders
If the power axe shows us what kind of body was needed to shape wood and stone, the skulls in our museums show us what kind of head sat on those shoulders. Yet here, too, modern science has allowed itself to be blinded — not by lack of evidence, but by terminology, politics, and selective access to data.
The Victorian Record
19th- and early 20th-century craniologists measured hundreds of skulls across Britain and Europe.
Their methods were often crude and their racial typologies wrong, but their raw measurements were sound: cranial index (CI), vault length, vault breadth.
Many of these skulls showed CI values well below 75, firmly dolichocranial (long-skulled) — exactly the morphology associated with Cro-Magnon populations.
Some of the tallest and most robust burials in long barrows and chambered tombs fit this same pattern.
The Modern Erasure
Instead of separating bad interpretation from useful data, modern anthropology has thrown the baby out with the bathwater.
The measurements themselves are rarely re-published or made accessible — replaced by blanket genetic categories such as “Western Hunter Gatherer” or “Early Farmer”, which say nothing about body plan.
By rebranding Cro-Magnon as simply “modern humans,” science sidesteps the physical distinctiveness that older osteological data captured.
Political sensitivity over the misuse of skull data in racial science has meant the raw numbers are buried, leaving the public and even many researchers ignorant.
The Cost of Silence
Without access to those measurements, we cannot easily see the pattern of long-skulled, tall, robust individuals who dominate early megalithic contexts.
Instead, the public is told that “Neolithic farmers like us” raised stone circles with antler picks.
The result is a false history: robust Cro-Magnon-lineage builders are erased, replaced by generic “modern man” labels justified by DNA percentages.
Why It Matters
CI data is not ideology — it’s geometry. A skull with a CI of 70 is long-headed, regardless of politics.
Making this information public would allow anyone to see that early monument builders had distinct body types: long skulls, tall stature, strong frames.
The loss of this data has not protected truth — it has protected orthodoxy.
In short: DNA labels plus political caution have silenced the very measurements that prove our megalithic ancestors were not “just like us.” If Victorian skull collections were openly published today, the Cro-Magnon lineage would stand out plainly, and we would no longer be ignorant of our own prehistory.
Case Study : The Dating Mirage — Why C14 and DNA “Chronologies” Mislead
Modern prehistory is smothered in dates. Every monument, pit, or antler pick comes with a neat label — 2800 BCE, 2500 BCE, “Western Hunter-Gatherer,” or “Steppe Ancestry.” But behind this façade is guesswork disguised as certainty.
The problem of calibration:
Carbon-14 dating was once hailed as absolute science, until tree-ring sequences showed systematic errors. Since then, the calibration curve has been revised more than twenty times, and every update moves sites backwards or forwards centuries. Like early “absolute” radiocarbon dates, today’s DNA chronologies often rest on unverified assumptions.
Absence of direct context:
As shown in Echoes of Atlantis and Stonehenge 8300 BCE, monuments like Stonehenge, Avebury, and Silbury are often dated by antler picks or flint fragments — objects that could have been redeposited centuries later. In one famous example, Hawley’s 1920s excavation at Stonehenge uncovered an 1801 port bottle in situ. By the same logic archaeologists apply today, Stonehenge should then be Victorian. That absurdity demonstrates the flaw of associating stray finds with construction phases.
DNA without skeletons:
Much the same applies to DNA. Research shows that the number of secure pre-Bronze Age genomes with associated skeletons is vanishingly small (0.1%) — a handful out of thousands of claimed lineages. Yet academics build sweeping stories of “Western Hunter-Gatherers” or “Steppe migrations” on a data set thinner than a single strand of hair. Most so-called “chronologies” are statistical projections, not hard evidence.
Why it matters:
This is not just a technical quibble. Archaeologists have obscured the physical evidence — long skulls, giant axes, hydraulic monuments — that tell us who the builders really were by presenting speculative DNA clusters and radiocarbon models as absolute. Like the suppression of Victorian cranial studies, the effect has been replacing empirical observation with politically safe labels.
The lesson: C14 and DNA dates are not facts, but provisional models. Without physical context, they are educated guesses, prone to revision. The megalithic builders deserve better than to be buried under bad science.
PodCast
Author’s Biography
Robert John Langdon, a polymathic luminary, emerges as a writer, historian, and eminent specialist in LiDAR Landscape Archaeology.
His intellectual voyage has interwoven with stints as an astute scrutineer for governmental realms and grand corporate bastions, a tapestry spanning British Telecommunications, Cable and Wireless, British Gas, and the esteemed University of London.
A decade hence, Robert’s transition into retirement unfurled a chapter of insatiable curiosity. This phase saw him immerse himself in Politics, Archaeology, Philosophy, and the enigmatic realm of Quantum Mechanics. His academic odyssey traversed the venerable corridors of knowledge hubs such as the Museum of London, University College London, Birkbeck College, The City Literature Institute, and Chichester University.
In the symphony of his life, Robert is a custodian of three progeny and a pair of cherished grandchildren. His sanctuary lies ensconced in the embrace of West Wales, where he inhabits an isolated cottage, its windows framing a vista of the boundless sea – a retreat from the scrutinous gaze of the Her Majesty’s Revenue and Customs, an amiable clandestinity in the lap of nature’s embrace.
Exploring Prehistoric Britain: A Journey Through Time
My blog delves into the fascinating mysteries of prehistoric Britain, challenging conventional narratives and offering fresh perspectives based on cutting-edge research, particularly using LiDAR technology. I invite you to explore some key areas of my research. For example, the Wansdyke, often cited as a defensive structure, is re-examined in light of new evidence. I’ve presented my findings in my blog post Wansdyke: A British Frontier Wall – ‘Debunked’, and aWansdyke LiDAR Flyover video further visualizes my conclusions.
For those interested in British Prehistory, visit www.prehistoric-britain.co.uk, a comprehensive resource featuring an extensive collection of archaeology articles, modern LiDAR investigations, and groundbreaking research. The site also includes insights and extracts from the acclaimed Robert John Langdon Trilogy, a series of books exploring Britain during the Prehistoric period. Titles in the trilogy include The Stonehenge Enigma, Dawn of the Lost Civilisation, and The Post Glacial Flooding Hypothesis, offering compelling evidence about ancient landscapes shaped by post-glacial flooding.
To further explore these topics, Robert John Langdon has developed a dedicated YouTube channel featuring over 100 video documentaries and investigations that complement the trilogy. Notable discoveries and studies showcased on the channel include 13 Things that Don’t Make Sense in History and the revelation of Silbury Avenue – The Lost Stone Avenue, a rediscovered prehistoric feature at Avebury, Wiltshire.
In addition to his main works, Langdon has released a series of shorter, accessible publications, ideal for readers delving into specific topics. These include:
For active discussions and updates on the trilogy’s findings and recent LiDAR investigations, join our vibrant community on Facebook. Engage with like-minded enthusiasts by leaving a message or contributing to debates in our Facebook Group.
Whether through the books, the website, or interactive videos, we aim to provide a deeper understanding of Britain’s fascinating prehistoric past. We encourage you to explore these resources and uncover the mysteries of ancient landscapes through the lens of modern archaeology.
For more information, including chapter extracts and related publications, visit the Robert John Langdon Author Page. Dive into works such as The Stonehenge Enigma or Dawn of the Lost Civilisation, and explore cutting-edge theories that challenge traditional historical narratives.
Most people imagine Stonehenge as the great sarsen trilithons. In fact, those belong to Phase 2, constructed around 4300 BCE. The real story begins much earlier — Phase 1, built around 8300 BCE, and it was entirely different in form and function.
This earliest version of Stonehenge was a working health and mortuary site. It featured a chalk-cut moat that held water, 58 imported Preseli bluestones, and a timber palisade enclosing raised stone platforms for excarnation. Birds were allowed to clean the dead — a practice still seen today in India’s towers of silence. The Y and Z holes marked the outer limits of the palisade; the Q and R holes defined where excarnation slabs once stood. The entire setup was pragmatic, not ritualistic.
The Monument was surrounded by a watery moat and 58 Bluestones – Stonehenge Phase 1 — Britain’s First Monument
2. How We Know Stonehenge Phase 1 Was Built in 8300 BCE
The date for Stonehenge Phase 1 is not speculative — it is supported by radiocarbon dating from multiple sites. Charcoal samples from postholes discovered in the Stonehenge car park excavation have been dated to around 8300 BCE. This corresponds closely with two quarry sites in the Preseli Hills of Wales, where evidence of human activity — including hearths associated with stone extraction — has also produced C14 dates from the same period. These sites are not random campfires but appear to be linked directly to quarrying activity associated with the bluestones.
This level of coordination between quarrying and monument construction suggests an advanced society operating across hundreds of miles, capable of planning and logistics long before the Neolithic. The matched radiocarbon dates from the quarry and monument provide strong empirical support for the theory that bluestones were transported and erected at Stonehenge in the 9th millennium BCE.
While hydrological modelling still reinforces the idea that this was the only period when the chalk aquifer would have provided a permanent water source at the monument, it is the radiocarbon evidence — independently dated at both source and site — that fixes Stonehenge Phase 1 to approximately 8300 BCE. This makes it the earliest scientifically verified monumental construction in the British Isles.
C14 dates reveal a 10,000 year old secret – Stonehenge Phase 1 — Britain’s First Monument
3. Layout and Function — The Real Purpose of the Site
The layout of Phase 1 was deliberate and practical. At the centre were the Q and R holes, which supported dolmen-style excarnation slabs — single flat stones balanced precisely on pointed supports to deter rodents. These slabs were used to expose bodies to the elements and scavenger birds, an efficient and sanitary method of processing the dead. The palisade surrounding the structure, marked by the Y and Z holes, enclosed this inner space to protect the area while allowing avian access. The design shows a clear understanding of decomposition cycles and scavenger behaviour.
The northwest orientation of the Q and R hole alignment corresponds to the moon’s setting position, reinforcing the functional connection to death and timing. The number of bluestones — 58 — was not arbitrary. It matches the synodic cycle of the moon, used to track its 18.6-year cycle of eclipses and nodal variation. This was likely vital for excarnation timing, navigation, tidal awareness, and critical knowledge for a riverine trading society.
The bluestones themselves were never meant to remain intact. As noted by Darvill and Wainwright, the bluestones were chipped down almost immediately. Over 3,675 fragments have been discovered — a remarkable total given that only half the site has been excavated. These fragments were deliberately introduced into the chalk moat. With their high rock salt content, the bluestone chips enriched the water with medicinal minerals, enhancing its curative potential. This suggests that Stonehenge Phase 1 was not a ceremonial temple, but a sophisticated facility for managing death, disease, and recovery.
The Platforms are facing the Solstice Moon Setting NW Location – Stonehenge Phase 1 — Britain’s First Monument
4. The Bluestones — Transport, Composition, and Use
The Preseli bluestones used at Stonehenge were transported from southwest Wales, likely via river and canal networks, rather than being dragged over land. The discovery of an ancient prehistoric catamaran boatyard dating to the Neolithic in Wales suggests they were moved by double-hulled craft suitable for carrying heavy loads. Britain’s river levels were significantly higher at the time, which enabled direct water transport to the site without the need for sea voyages.
What matters more than their origin is their composition. The Preseli stones are rich in rock salt, copper, and trace minerals, which leach into water when submerged or broken. This is not theoretical — over 3,675 bluestone fragments have been found in the moat area. This suggests the stones were intentionally broken up to release minerals into the water, creating a kind of early mineral spa.
This theory is further supported by Darvill and Wainwright, who observed that the stones were being chipped away from the time of their erection and even proposed the site may have served as a healing centre. This evidence strengthens the argument that Stonehenge functioned primarily as a public health structure, specifically for sepsis and infection, the leading causes of death in prehistoric times.
Welsh Catamarans made to carry stones on rivers – Stonehenge Phase 1 — Britain’s First Monument
5. The Water — How It Worked, and Why It Mattered
The chalk-cut ditch surrounding the central enclosure was not ornamental. It was a functional water feature, drawing from a naturally high water table during the Mesolithic. The aquifer-fed ditch would have constantly circulated mineral-rich water through the site, turning the enclosed area into a therapeutic environment.
Bluestone chippings, deliberately broken and deposited in this moat, would have slowly released rock salt and trace elements into the water. Salt has antiseptic properties and is still used today in wound care. Soaking in this solution could have helped prevent or treat infections in a world without antibiotics.
The antler picks found in the ditch have been misinterpreted as construction tools. In fact, they are more logically explained as dredging tools used to maintain the flow and clarity of the water system. These were found in later layers, suggesting periodic cleaning of the moat rather than its original excavation.
Found in the ditch at Stonehenge (not made to dig in chalk) Stonehenge Phase 1 — Britain’s First Monument
6. The Evidence of Reuse and Replacement
Conventional narratives claim the stones were erected once and remained untouched. However, C14 dating and excavation records tell a different story. The bluestones were replaced multiple times over a long period, not just transported once and left to stand. Dating of stone socket fills shows repeated insertion events, sometimes centuries apart.
This supports the idea that the site was actively maintained, not abandoned or commemorated. Replacement intervals appear tied to mineral depletion — once enough salt and trace minerals had leached out of the existing stones, they were broken up and replaced. This explains the high number of fragments despite limited excavation.
With only around 50% of the site dug, over 3,600 fragments have been recovered — meaning the actual number is likely double. These are not random breakages or damage from collapse; they were systematically chipped and deposited into the water.
3,600 fragments from only 50% of the Site – Stonehenge Phase 1 — Britain’s First Monument
7. The Healing Spring at Carn Menyn — Empirical Evidence for Mineral Therapy
A major criticism of the “healing stones” hypothesis has been the supposed lack of empirical evidence. But recent research at Carn Menyn in the Preseli Mountains — one of the key sources of the Stonehenge bluestones — reveals a now-dry sacred springhead that may hold the key to understanding the stones’ original purpose.
Gordon Freeman’s 2013 fieldwork identified a collapsed cromlech and associated cairn built directly over a once-flowing freshwater spring known locally as Pen y Tarddiant Sanctaidd (Holy Springhead). This spring fed a stone-lined stream channel called Rhestr Gerrig (“Stone Row”), wounding through the landscape toward a marshy area called Fat Hazelnut Bog. While this water source has since dried up, its historical importance is undeniable. The spring was sacred enough to warrant a formal burial monument, and the fact that a cromlech capped it suggests a long tradition of ritualised — and likely therapeutic — use.
But this is more than symbolic. The springhead sits directly within the geological formation from which spotted dolerite (bluestone) was quarried — and critically, analysis of this dolerite reveals it contains natural rock salt and trace minerals. This means the spring water would likely have been slightly brined, absorbing salts and mineral ions as it passed through and over the bluestone deposits. Wound irrigation with mineral water would have had antiseptic and soothing properties — a fact observable by prehistoric peoples even without modern biochemistry.
This context gives physical, testable logic to why the same rock was selected and transported over 200 km to the chalk aquifer basin of Stonehenge: to recreate the medicinal properties of the Preseli spring. The deliberate chipping of bluestones into fragments and depositing them into the moat — as confirmed by Darvill and Wainwright — wasn’t ceremonial destruction. It was chemical replication. The stones infused the water with trace minerals, producing a brine bath system that matched the healing waters of the original spring in Wales.
Taken together — the presence of a prehistoric sacred spring, the saline-rich composition of bluestone, and the evidence of engineered mineral dissolution at Stonehenge — make this a rare case where archaeology, geology, and hydrology converge into an empirical explanation for a so-called “ritual” monument. Stonehenge Phase One was not a temple. It was Britain’s first public health sanctuary, and the spring at Carn Menyn was its biochemical blueprint.
The Healing Spring at Carn Menyn – Stonehenge Phase 1 — Britain’s First Monument
8. The Pallisade and the Silent Towers
One of the most overlooked features of Stonehenge Phase 1 is the timber palisade surrounding the inner platforms. This structure wasn’t defensive — it was functional and hygienic, containing excarnation within the central area while restricting access.
This enclosure is clearly defined by the Y and Z holes, which are too consistent and evenly spaced to be symbolic. They formed the foundation for a pair of stone uprights, making the interior a raised series of protected platforms. Birds — especially carrion feeders (mainly Jackdaws, Ravens, and Crows)— were allowed access to clean the bodies. The cleaned bones were then taken to nearby Long Barrows for entombment.
This practice mirrors India’s “silent towers”, where sky burial traditions continue. It reflects a belief not in symbolism but in natural decomposition and purification. Stonehenge’s setup provided a sanitary, repeatable method for body disposal — highly advanced for its time.
Towers of Silence (Silent Towers) – Stonehenge Phase 1 — Britain’s First Monument
9. Decline and Transition to Phase 2
Over time, the water table dropped as the aquifer drained and post-glacial rebound altered the landscape. The once-functioning moat began drying up, and the mineral bath lost efficacy. This environmental shift marks the end of Phase 1 and the beginning of a new chapter in the site’s life.
The bluestones were gradually replaced by larger sarsen stones, marking a transition from a practical medical site to something more monumental. These sarsens were installed around 4300 BCE, beginning what most people today incorrectly consider the start of Stonehenge.
This change is visible in the construction of The Avenue, a wide processional route that leads away from the original riverfront location to the new shoreline further northeast. This redirection reflects both cosmic alignments and the simple reality of hydrological change.
The Avon shrank to just Stonehenge Bottom were they connected a road for Phase 2 -Stonehenge Phase 1 — Britain’s First Monument
10. Conclusion — A Monument Built on Function, Not Fantasy
The first phase of Stonehenge was not a mystical temple, a ceremonial gathering place, or a stone calendar. It was a public health structure, grounded in the harsh realities of Mesolithic life — infection, injury, and death. Its foundation wasn’t spiritual conjecture, but practical science: built on a prehistoric shoreline, maintained by a saturated aquifer, and enriched by mineral-laden bluestone chips dissolved into the water. It was a place of triage, treatment, and transformation.
Thanks to a new mathematical dating model — one grounded in radiocarbon evidence from quarry hearths, site postholes, and hydrological mapping — we now know Phase 1 began around 8300 BCE. This places Stonehenge among the oldest monumental structures in Europe, second only to Carnac in France, and dismantles the false timeline held by mainstream archaeology. It was not a late Neolithic curiosity but a pioneering Mesolithic achievement. And this was a rational, functional innovation centuries ahead, unlike the speculative calendars or solar temples peddled by tradition.
Archaeologists have consistently failed to interpret key features of the site. Once thought irrelevant, the postholes forming the central crescent pattern align exactly with where excarnation slabs would have stood. Their curious shape and placement remain unacknowledged in academic literature. Even the surrounding palisade, indicated by the Y and Z holes, has gone largely ignored, despite its obvious protective function. Traditionally described as ceremonial, the ditch is no ditch at all — it is a ring of pits, designed to house seating platforms below water level for therapeutic bathing. This unique design, found nowhere else in Britain, is left undiscussed because it breaks too many taboos about what Stonehenge might truly have been.
The fog is lifting with advances in LiDAR, mineral analysis, hydrology, and radiocarbon calibration. Stonehenge Phase 1 must now be recognised as Britain’s first scientific structure — a masterpiece of Mesolithic engineering, biology, and community medicine — misunderstood for thousands of years by a profession still reluctant to let go of fantasy.
Bathing at health spas are prehistoric in origin – Stonehenge Phase 1 — Britain’s First Monument
PodCast
Author’s Biography
Robert John Langdon, a polymathic luminary, emerges as a writer, historian, and eminent specialist in LiDAR Landscape Archaeology.
His intellectual voyage has interwoven with stints as an astute scrutineer for governmental realms and grand corporate bastions, a tapestry spanning British Telecommunications, Cable and Wireless, British Gas, and the esteemed University of London.
A decade hence, Robert’s transition into retirement unfurled a chapter of insatiable curiosity. This phase saw him immerse himself in Politics, Archaeology, Philosophy, and the enigmatic realm of Quantum Mechanics. His academic odyssey traversed the venerable corridors of knowledge hubs such as the Museum of London, University College London, Birkbeck College, The City Literature Institute, and Chichester University.
In the symphony of his life, Robert is a custodian of three progeny and a pair of cherished grandchildren. His sanctuary lies ensconced in the embrace of West Wales, where he inhabits an isolated cottage, its windows framing a vista of the boundless sea – a retreat from the scrutinous gaze of the Her Majesty’s Revenue and Customs, an amiable clandestinity in the lap of nature’s embrace.
Exploring Prehistoric Britain: A Journey Through Time
My blog delves into the fascinating mysteries of prehistoric Britain, challenging conventional narratives and offering fresh perspectives based on cutting-edge research, particularly using LiDAR technology. I invite you to explore some key areas of my research. For example, the Wansdyke, often cited as a defensive structure, is re-examined in light of new evidence. I’ve presented my findings in my blog post Wansdyke: A British Frontier Wall – ‘Debunked’, and aWansdyke LiDAR Flyover video further visualizes my conclusions.
For those interested in British Prehistory, visit www.prehistoric-britain.co.uk, a comprehensive resource featuring an extensive collection of archaeology articles, modern LiDAR investigations, and groundbreaking research. The site also includes insights and extracts from the acclaimed Robert John Langdon Trilogy, a series of books exploring Britain during the Prehistoric period. Titles in the trilogy include The Stonehenge Enigma, Dawn of the Lost Civilisation, and The Post Glacial Flooding Hypothesis, offering compelling evidence about ancient landscapes shaped by post-glacial flooding.
To further explore these topics, Robert John Langdon has developed a dedicated YouTube channel featuring over 100 video documentaries and investigations that complement the trilogy. Notable discoveries and studies showcased on the channel include 13 Things that Don’t Make Sense in History and the revelation of Silbury Avenue – The Lost Stone Avenue, a rediscovered prehistoric feature at Avebury, Wiltshire.
In addition to his main works, Langdon has released a series of shorter, accessible publications, ideal for readers delving into specific topics. These include:
For active discussions and updates on the trilogy’s findings and recent LiDAR investigations, join our vibrant community on Facebook. Engage with like-minded enthusiasts by leaving a message or contributing to debates in our Facebook Group.
Whether through the books, the website, or interactive videos, we aim to provide a deeper understanding of Britain’s fascinating prehistoric past. We encourage you to explore these resources and uncover the mysteries of ancient landscapes through the lens of modern archaeology.
For more information, including chapter extracts and related publications, visit the Robert John Langdon Author Page. Dive into works such as The Stonehenge Enigma or Dawn of the Lost Civilisation, and explore cutting-edge theories that challenge traditional historical narratives.
(Ten Things You Didn’t Know About Britain’s Prehistoric Flooded Past)
We look at our hills, rivers, and coasts… and think they’ve always been there. Stable. Permanent.
But that picture… is a lie. At the end of the last Ice Age, Britain was a land in chaos. Seas surged sixty metres higher. Rivers swelled beyond imagination. Entire countries… disappeared beneath the waves.
Archaeology often ignores this truth. Too many theories are drawn on a modern map — a map our ancestors would barely recognise. After two decades of fieldwork and over two hundred and sixty research blogs, I can tell you: to understand prehistoric Britain… you must redraw it. Here are ten things you probably didn’t know about the drowned, shifting, waterlogged world our ancestors truly lived in.
A Landscape full of enlarged rivers – (Ten Things You Didn’t Know About Britain’s Prehistoric Flooded Past)
1 — The Britain You Know Is Only 8,000 Years Old
When the Holocene began, Britain wasn’t an island. A land bridge linked us to Europe — until rising seas finally severed it around six thousand BCE. The change wasn’t gentle. Meltwater pulses sent the tide racing inland, flooding valleys in years… not centuries.
Sea levels rose faster than our worst climate forecasts for 2100. Every coastline shifted. The mouth of the Thames moved inland. Estuaries formed where farmland now lies. Your hometown… could have been seabed
If you stood there then, your mental map of Britain would be unrecognisable. The “island nation” idea? A very recent reality. For most of prehistory… Britain was part of a wider European landscape.
Doggerland was once jus one enlarged continent (Ten Things You Didn’t Know About Britain’s Prehistoric Flooded Past)
2 — Stonehenge’s Bluestones Couldn’t Have Rolled Here
The romantic image is familiar: teams of men with ropes and ox-carts dragging stones two hundred kilometres from Preseli to Salisbury Plain. But around eight thousand BCE, ninety percent of that “route” was deep wildwood. Valleys in between? Bog-soaked mires. Wheels would have sunk without a trace.
The real transport network wasn’t overland — it was water. Seasonal floods. Frost-hardened winter ground. And above all… rivers. LiDAR mapping shows prehistoric waterways were the true highways.
This single fact changes the Stonehenge story entirely. It wasn’t a land-locked haul of brute force — it was a calculated, water-based operation using the landscape to its advantage.
The idea of dragging Stones of 20 – 30 tonnes is pure folly – (Ten Things You Didn’t Know About Britain’s Prehistoric Flooded Past)
3 — Britain Once Had a Country Twice the Size of Wales — and Lost It Overnight
Doggerland was no myth. It was a vast lowland stretching from East Anglia to the Netherlands. Its marshes, rivers, and lakes supported thousands of people. For centuries, it was a bridge between Britain and Europe.
Then it drowned. Whether through steady sea rise, sudden flooding, or both — the result was the same. Communities found themselves separated by water where there had once been solid ground.
That shock forced a new reality. Boats were no longer optional… they were survival. In my Maritime Diffusion Model, this moment explains why megalithic architecture suddenly spread so quickly along Atlantic coasts — the sea became the new road.
The drowning of Doggerland was a major catastrophic event in History of the World – (Ten Things You Didn’t Know About Britain’s Prehistoric Flooded Past)
4 — Raised Beaches… Or the Fingerprints of a Flooded Britain?
On Britain’s south coast, geologists point to “raised beaches” — sand and gravel layers perched far above today’s tide line. The standard explanation is a mix of ancient shorelines and “isostatic rebound.” But the data… doesn’t match the story.
My research shows these aren’t fossil beaches at all. They’re concave, river-shaped deposits. They sit under layers of unstructured chalk — exactly what you’d expect if catastrophic meltwater floods carved paleochannels down to the sea. British Geological Survey maps confirm the pattern: huge branching flows, not static coastlines.
Once you see it, you can’t unsee it. These are not tranquil remnants of a higher tide… they are scars of a country in flood</emphasis>. And they tell a far more dynamic, violent story than the textbooks admit.
If geologists used Lidar such misidentification would be avoided – (Ten Things You Didn’t Know About Britain’s Prehistoric Flooded Past)
5 — The Thames Was Once Seven Kilometres Wide
Beneath London, boreholes reveal up to ten metres of early-Holocene silt. This was not the neat, channelled Thames we know — it was a vast, braided tidal delta up to seven kilometres across.
Such a river wasn’t just wider… it was a different creature entirely. Settlements clung to the high ground like islands. Boats connected them. Trade and travel followed water channels, not overland tracks. This wasn’t an obstacle — it was a superhighway.
And here’s the myth-buster: London’s lack of prehistoric sites isn’t due to modern building wiping them out. LiDAR shows that much of the Thames Valley floor was too wide and flood-prone to build on. Only a few habitable high points existed — the places we now call the “Home Counties.”
The Thames was not swollen it was swamped in the Mesolithic – (Ten Things You Didn’t Know About Britain’s Prehistoric Flooded Past)
6 — The Isle of Wight Was Cut Off by a Flooded River Valley
The Solent started as a river. Then, around seven thousand five hundred years ago, rising seas burst through the valley, flooding it completely. A short walk became an open-water crossing — and life on both sides changed overnight.
Suddenly, trade required boats. Communities reorganised. Control of crossing points likely meant influence and power. Archaeology along the submerged Solent shows drowned forests, hearths, and even worked timbers… frozen in place beneath the waves.
Most extraordinary of all is Bouldnor Cliff. Here, eleven metres underwater, lies the world’s first known boat-building site — a sixth-millennium BCE harbour that imported Einkorn wheat from mainland Europe. This was no primitive backwater… it was a maritime hub centuries ahead of its time.
Bouldnor Cliff – Einkorn wheat – (Ten Things You Didn’t Know About Britain’s Prehistoric Flooded Past)
7 — Somerset’s Levels Were a Salt-Water Swamp
Between 5600 and 4450 BCE, the Somerset Levels were not the patchwork of fields we know today. They were alder-carr woodland slowly drowning under advancing salt marsh.
Peat cores show the shift layer by layer — from fresh water to brackish tidal intrusion. To prehistoric people, this meant constant adaptation: moving camps, changing food sources, finding safe ground.
Centuries later, societies would turn this swamp into a managed landscape of canals and raised trackways. But in its early days, it was a shifting, dangerous maze of water… a place that could swallow your settlement in a season.
It started as freshwater swamp then turned into salt water swamp – (Ten Things You Didn’t Know About Britain’s Prehistoric Flooded Past)
8 — Stonehenge Stood on a Peninsula Fed by a Healing Spring
Stonehenge didn’t stand beside a ceremonial pool or a “ritual lagoon.” It was built on a peninsula jutting into the River Avon, fed by a natural spring at Stonehenge Bottom. This fresh, flowing water made the site an ideal meeting place and a reliable refuge.
The bluestones, brought from Preseli, were more than decorative. They contain minerals with natural antibacterial properties. In a world where sepsis from a cut could be fatal, those stones were medicine.
Water from the spring flowing past them created a setting believed to aid recovery from infections and wounds. Forget the star-gazing theories — Stonehenge was a healing centre, built with purpose and grounded in survival.
The Bluestones were broken up like bath salts when they arrived at Stonehenge – (Ten Things You Didn’t Know About Britain’s Prehistoric Flooded Past)
9 — Our “Iron Age Hillforts” May Be Older — and Wetter — Than We Think
From the air, hillforts look like defensive enclosures. But LiDAR tells a different story — many sit in wet, low-lying areas with evidence of ditches that once held water.
These weren’t forts braced for battle… they were moated settlements designed for trade and control of water routes. In a wetter prehistoric Britain, that was often more important than any wall.
Re-examining these sites with hydrology in mind reveals a network of connected hubs — places where goods, people, and ideas moved not along ridge-tops, but through waterways. It’s a complete rethink of “forts” as we know them.
Old Sarum is in the middle of a River – although its called an ‘Iron Age Fort’? – (Ten Things You Didn’t Know About Britain’s Prehistoric Flooded Past)
10 — The Map in Your Head Is a Mirage
When we think of Britain, we picture a static shape — familiar coastlines, steady rivers. But in prehistory, those lines were always on the move.
Rivers cut new paths. Valleys flooded. Islands appeared and vanished. The Britain of twelve thousand years ago was nothing like the Britain of eight thousand years ago — and both were strangers to the Britain we know now.
The Post-Glacial Flooding Hypothesis forces us to redraw that mental map. Once you do, everything changes — from how Stonehenge was built, to why Doggerland mattered, to the true nature of “hillforts.” It’s not just a new map… it’s a new past.
Boats were the only way to travel and trade in the Mesolithic Period – (Ten Things You Didn’t Know About Britain’s Prehistoric Flooded Past)
Conclusion — Redraw the Map. Rethink the Past.
Prehistoric Britain was not a gentle green land. It was a place of rapid change, flooded valleys, and disappearing coasts. Ignore that… and you get bad archaeology.
Factor it in — and new explanations open up for the monuments, settlements, and journeys of our ancestors. The evidence is there. The map is wrong. <emphasis level=”moderate”>It’s time to set it right</emphasis>.
(Ten Things You Didn’t Know About Britain’s Prehistoric Flooded Past)
Update
Where to see Britain’s post-glacial high water table
The caves are the evidence. Karst systems preserve the height of former water tables:
Mendip Hills (Cheddar Gorge / Wookey Hole): Relic phreatic levels high above modern flow routes show earlier pressurised groundwater; silted tubes and scallops mark sustained high head after deglaciation.
Yorkshire Dales (Malham–Ingleborough): Abandoned risings and perched conduits around Malham Cove & Gaping Gill record higher Holocene heads; modern springs sit lower as the aquifer discharged over millennia.
Peak District (Castleton): Upper fossil passages in Peak Cavern/Speedwell are stranded above active streams—classic regression from a post-glacial high stand.
Chalk Winterbournes (Downs/Chilterns): The Misbourne, Chess, Kennet headwaters and Dorset winterbournes switch on when the head rises—same physics, small timescale. Early Holocene = the “on” position for much longer.
Chalk dew-ponds: Longevity on permeable chalk relies on self-sealing skins—the same lining behavior that helps Phase-1 Stonehenge’s moat retain water under high head.
Why this matters for Stonehenge Phase 1
Mechanism: High head + chalk colmation = standing water in the ditch.
Analogue: Cave high-stands are the geological logbook of that head.
Fit: The moat enables the mineralised bluestone baths and excarnation workflow documented in the Phase-1 model.
Quick Evidence: Britain’s Aquifers, Made Visible
Karst plumbing on show. In chalk/limestone belts, groundwater carved conduits, phreatic tubes, risings, and sinkholes—the aquifer made visible in places like the Mendips, Yorkshire Dales, and the Peak District.
High-stand markers. Abandoned phreatic passages perched high on cave walls, scalloped ceilings (pressurised flow), and silt beds record past water-table positions—higher than today during the early Holocene.
Seasonal analogue. Modern winterbournes (dry valleys that flow only when the head rises) prove the mechanism: when the potentiometric surface sits above cut level, water holds—exactly what Phase 1 required.
Self-sealing ditches. Fresh chalk cuts develop clay/carbonate skins (colmation), reducing leakage. With high head + recharge, a “ditch” becomes a moat.
PodCast
Author’s Biography
Robert John Langdon, a polymathic luminary, emerges as a writer, historian, and eminent specialist in LiDAR Landscape Archaeology.
His intellectual voyage has interwoven with stints as an astute scrutineer for governmental realms and grand corporate bastions, a tapestry spanning British Telecommunications, Cable and Wireless, British Gas, and the esteemed University of London.
A decade hence, Robert’s transition into retirement unfurled a chapter of insatiable curiosity. This phase saw him immerse himself in Politics, Archaeology, Philosophy, and the enigmatic realm of Quantum Mechanics. His academic odyssey traversed the venerable corridors of knowledge hubs such as the Museum of London, University College London, Birkbeck College, The City Literature Institute, and Chichester University.
In the symphony of his life, Robert is a custodian of three progeny and a pair of cherished grandchildren. His sanctuary lies ensconced in the embrace of West Wales, where he inhabits an isolated cottage, its windows framing a vista of the boundless sea – a retreat from the scrutinous gaze of the Her Majesty’s Revenue and Customs, an amiable clandestinity in the lap of nature’s embrace.
(The Stonehenge Code)
Exploring Prehistoric Britain: A Journey Through Time
My blog delves into the fascinating mysteries of prehistoric Britain, challenging conventional narratives and offering fresh perspectives based on cutting-edge research, particularly using LiDAR technology. I invite you to explore some key areas of my research. For example, the Wansdyke, often cited as a defensive structure, is re-examined in light of new evidence. I’ve presented my findings in my blog post Wansdyke: A British Frontier Wall – ‘Debunked’, and aWansdyke LiDAR Flyover video further visualizes my conclusions.
For those interested in British Prehistory, visit www.prehistoric-britain.co.uk, a comprehensive resource featuring an extensive collection of archaeology articles, modern LiDAR investigations, and groundbreaking research. The site also includes insights and extracts from the acclaimed Robert John Langdon Trilogy, a series of books exploring Britain during the Prehistoric period. Titles in the trilogy include The Stonehenge Enigma, Dawn of the Lost Civilisation, and The Post Glacial Flooding Hypothesis, offering compelling evidence about ancient landscapes shaped by post-glacial flooding.
To further explore these topics, Robert John Langdon has developed a dedicated YouTube channel featuring over 100 video documentaries and investigations that complement the trilogy. Notable discoveries and studies showcased on the channel include 13 Things that Don’t Make Sense in History and the revelation of Silbury Avenue – The Lost Stone Avenue, a rediscovered prehistoric feature at Avebury, Wiltshire.
In addition to his main works, Langdon has released a series of shorter, accessible publications, ideal for readers delving into specific topics. These include:
For active discussions and updates on the trilogy’s findings and recent LiDAR investigations, join our vibrant community on Facebook. Engage with like-minded enthusiasts by leaving a message or contributing to debates in our Facebook Group.
Whether through the books, the website, or interactive videos, we aim to provide a deeper understanding of Britain’s fascinating prehistoric past. We encourage you to explore these resources and uncover the mysteries of ancient landscapes through the lens of modern archaeology.
For more information, including chapter extracts and related publications, visit the Robert John Langdon Author Page. Dive into works such as The Stonehenge Enigma or Dawn of the Lost Civilisation, and explore cutting-edge theories that challenge traditional historical narratives.