The Durrington Mega-Monument Hoax: What Lies Beneath? – Debunked

2026 Update: Why This Article Has Been Rewritten

This article was first written as a critique of the 2020 television interpretation of the Durrington Walls “mega-monument” — the claim that a broken arc of large pits around Durrington Walls represented a vast Late Neolithic ceremonial structure. (The Durrington Mega-Monument Hoax: What Lies Beneath? – Debunked)

At the time, the central problem was already clear: the programme and the published interpretation began with monuments, alignments and ritual meaning, when they should have begun with the physical landscape.

That criticism has now become much stronger.

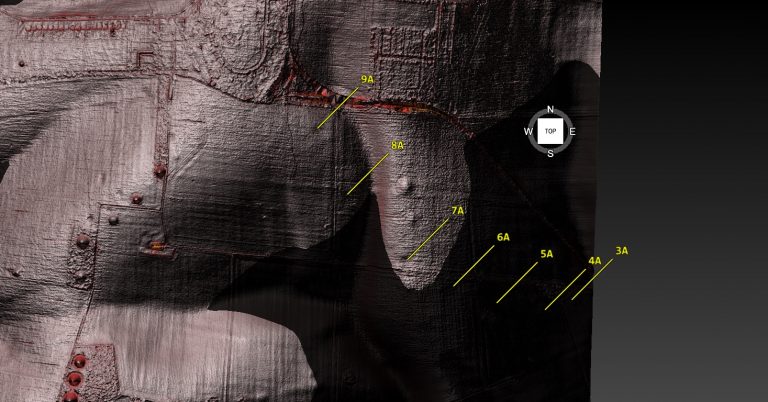
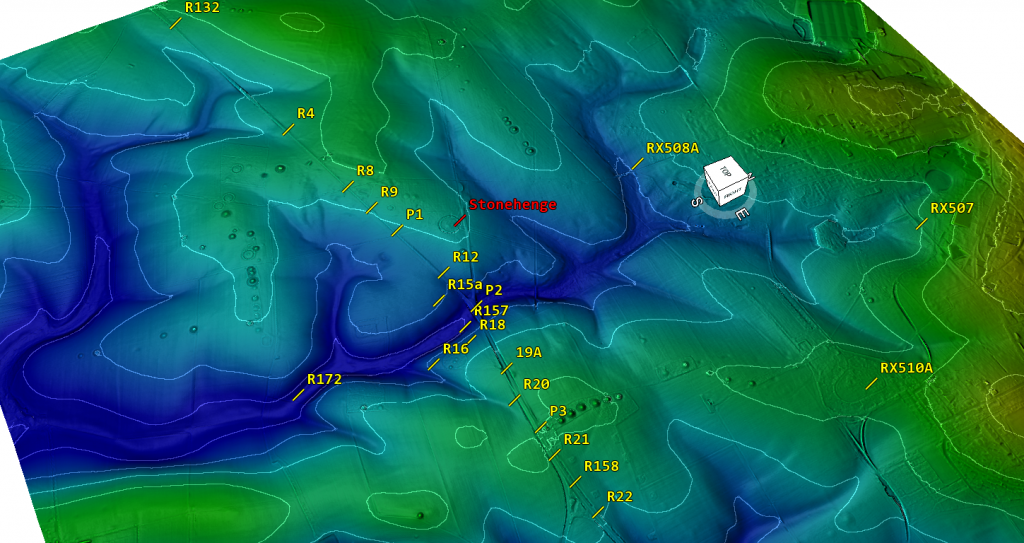
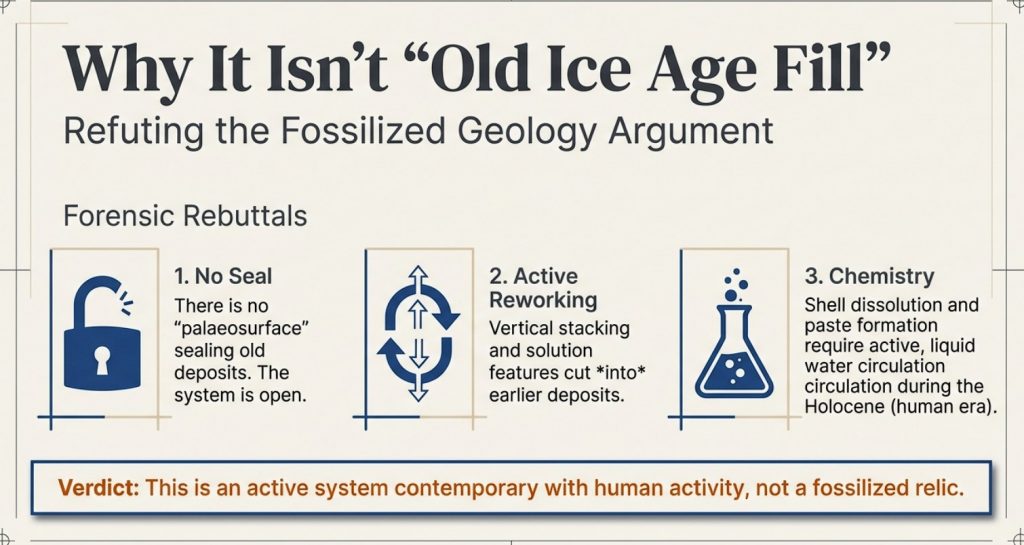
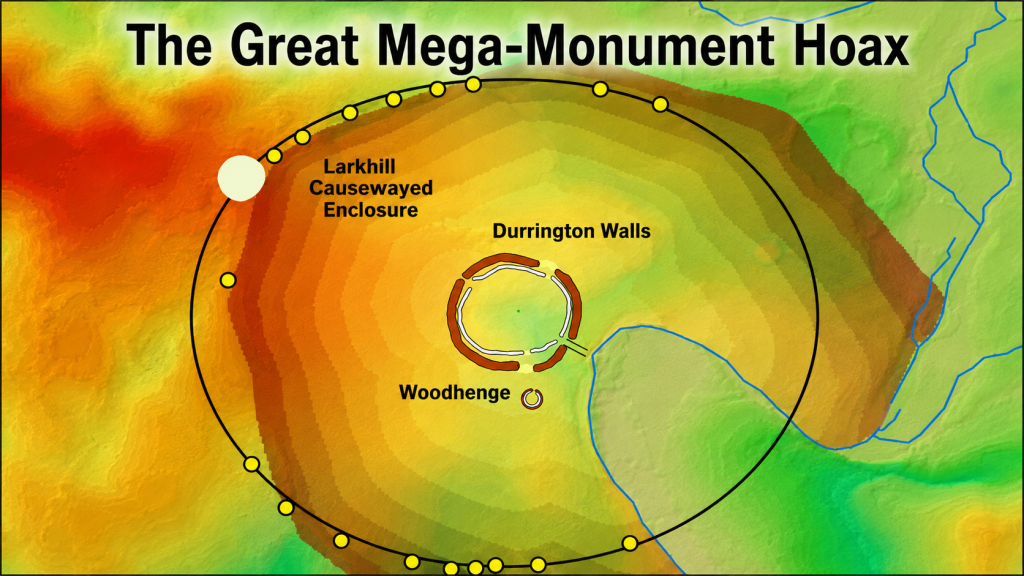
The Durrington pits have now been plotted against LiDAR data, palaeochannels, and former water-affected terrain. That changes the question completely. The issue is no longer simply whether large pits exist around Durrington Walls. Some clearly do. The question is whether those pits form a single planned monument — or whether they are large pits, hollows, modified natural features and sediment traps sitting along former river margins.

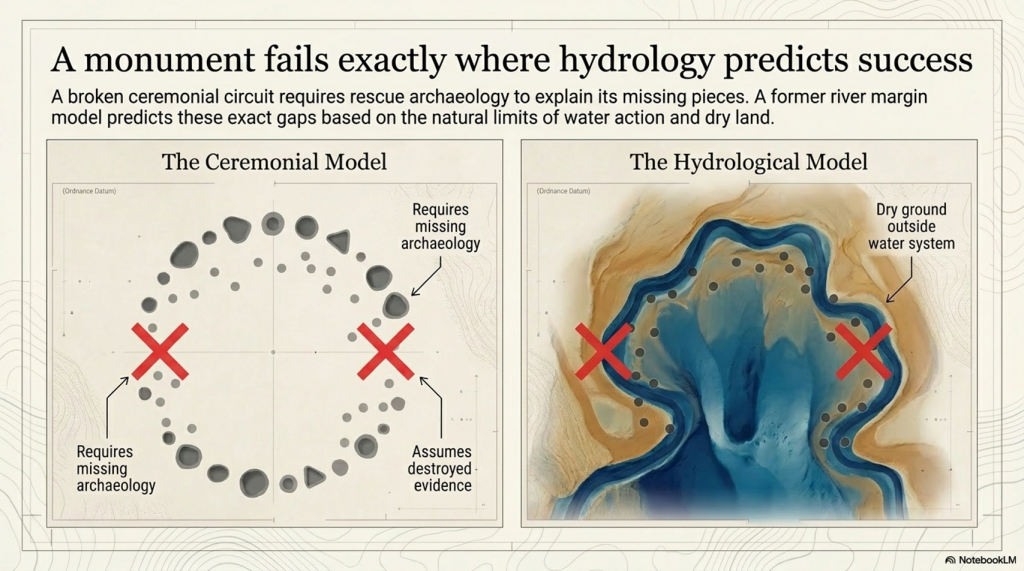
Once the credible pits are mapped against the hydrological landscape, the strange broken “circle” begins to look very different. The pits appear to fit former palaeochannel and shoreline zones. The gaps in the supposed monument are not mysterious missing sections. They are exactly what a water-margin model would predict: areas that were either dry ground outside the former water system, or areas that were once active water where pits would not be dug, would not survive, or would be hidden beneath later river deposits.

This is the key point missed in the original interpretation.

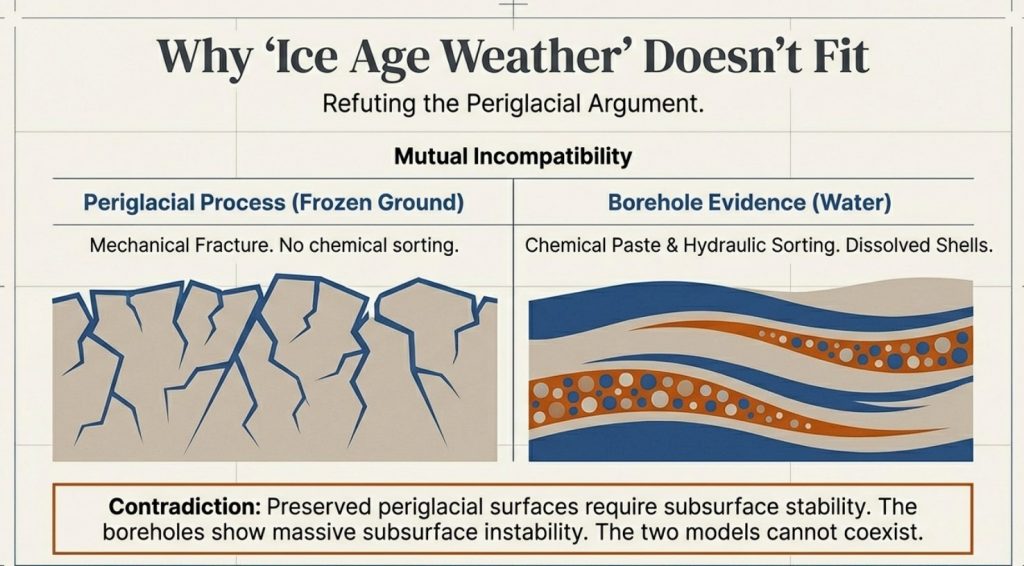
A broken ring of pits does not automatically become a monument because it can be drawn as a circle on a map. A line of holes does not automatically become ritual because it can be linked to the sky. Archaeology has to explain the ground first.

(The Durrington Mega-Monument Hoax: What Lies Beneath? - Debunked)
(The Durrington Mega-Monument Hoax: What Lies Beneath? – Debunked)

The dating evidence also needs to be understood correctly. The Stonehenge Mesolithic post-hole evidence comes from pine wood or charcoal. The Durrington evidence includes shell-bearing deposits from a water-affected chalk landscape. These are different types of material, and they should not be treated as if they all give the same kind of direct construction date.

But that is not the argument being made here.

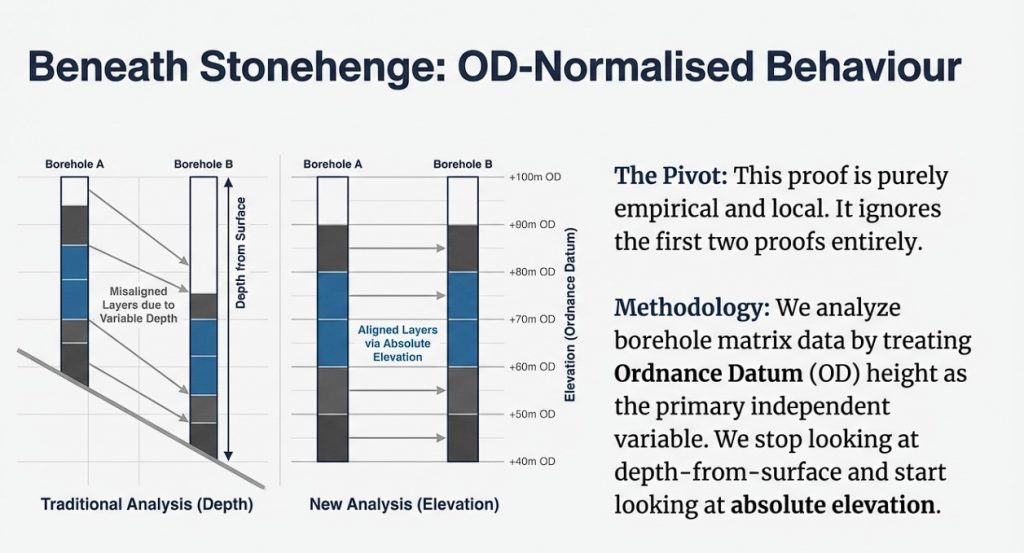
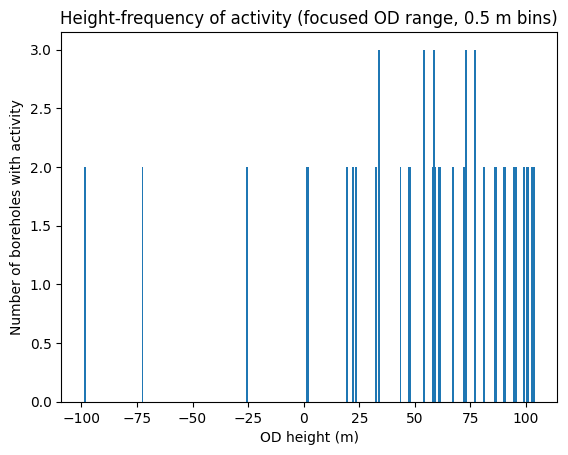
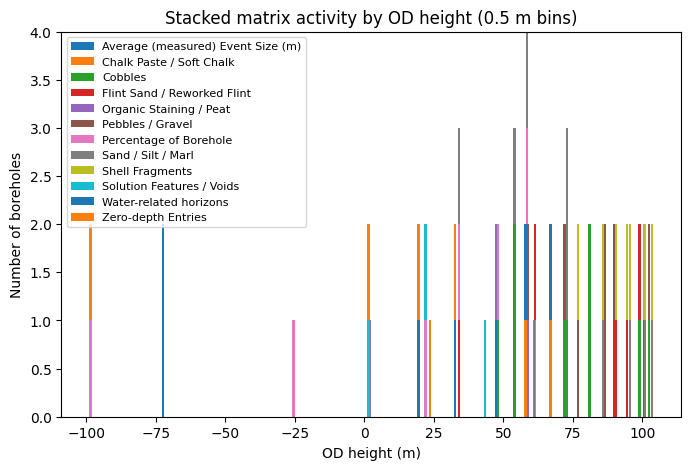
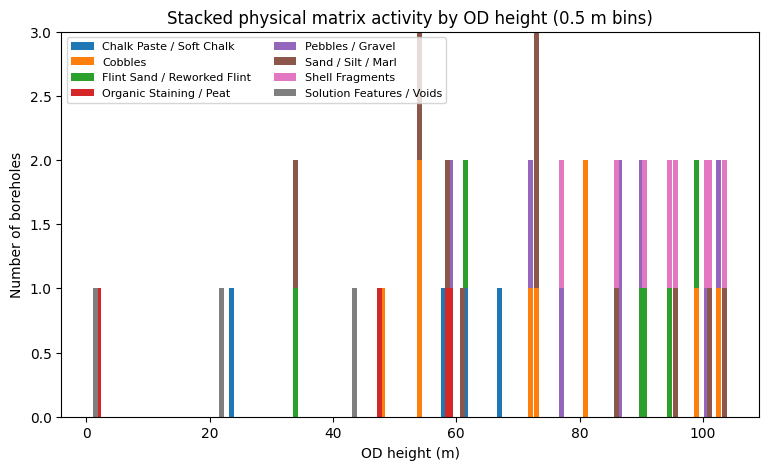
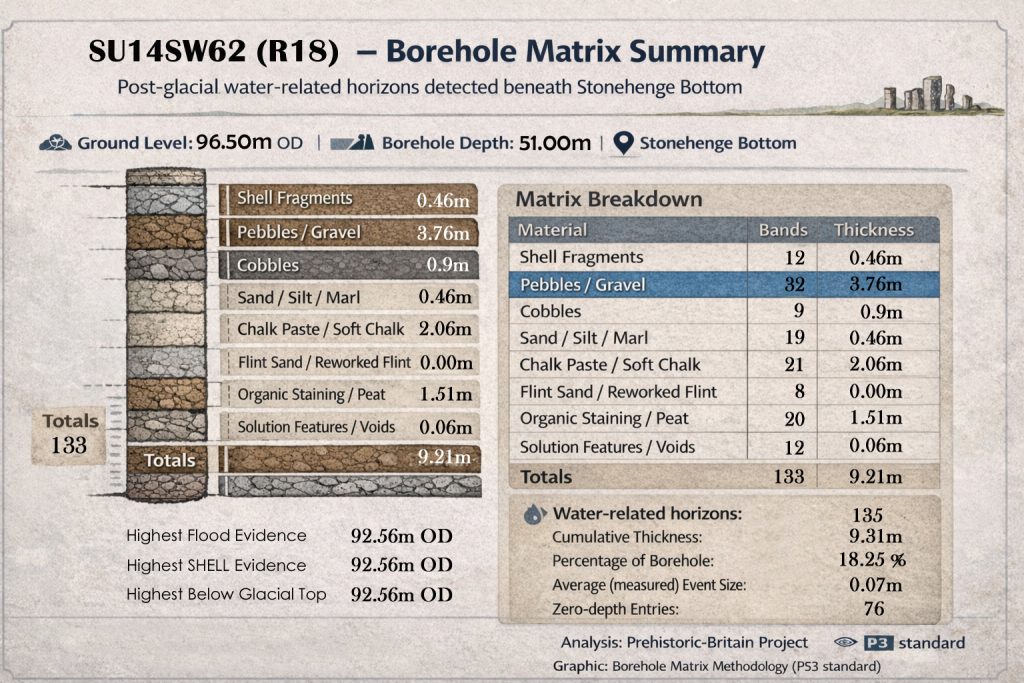
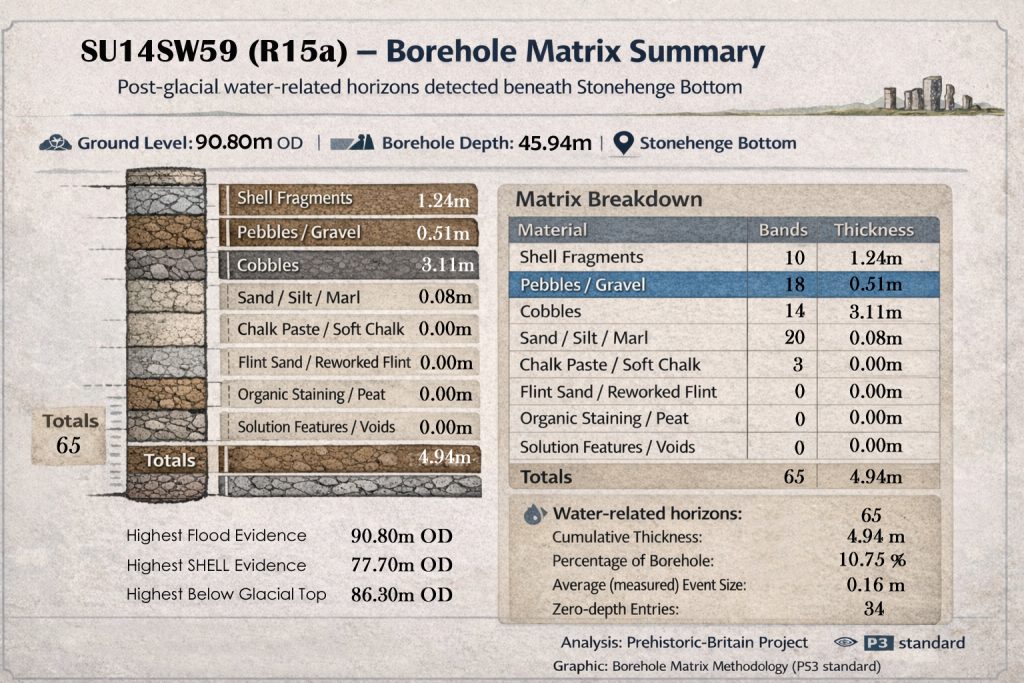
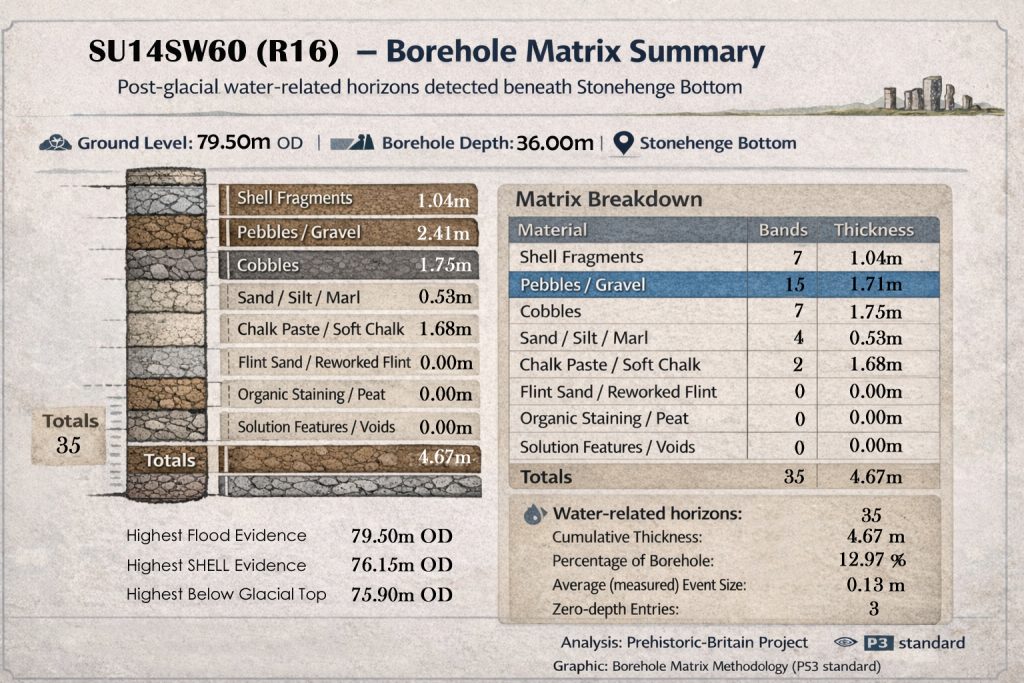
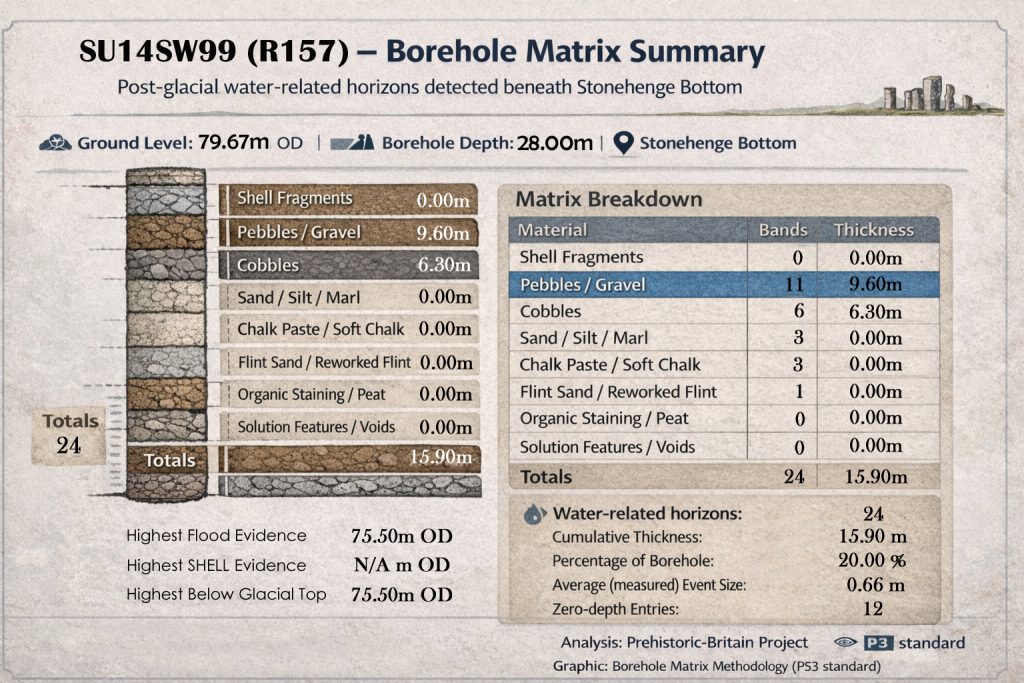
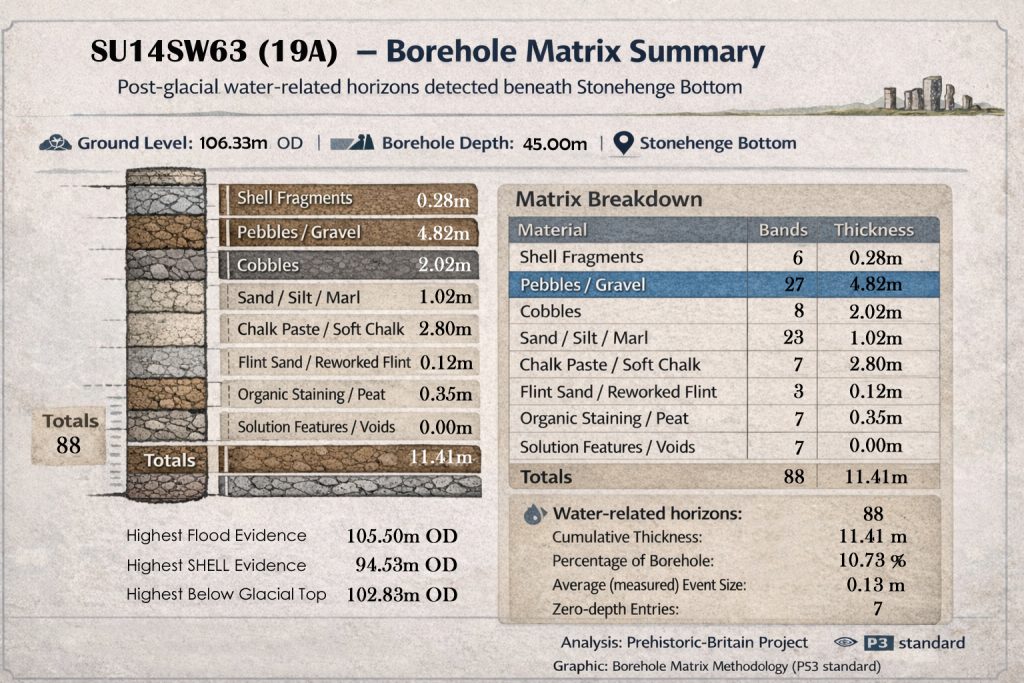
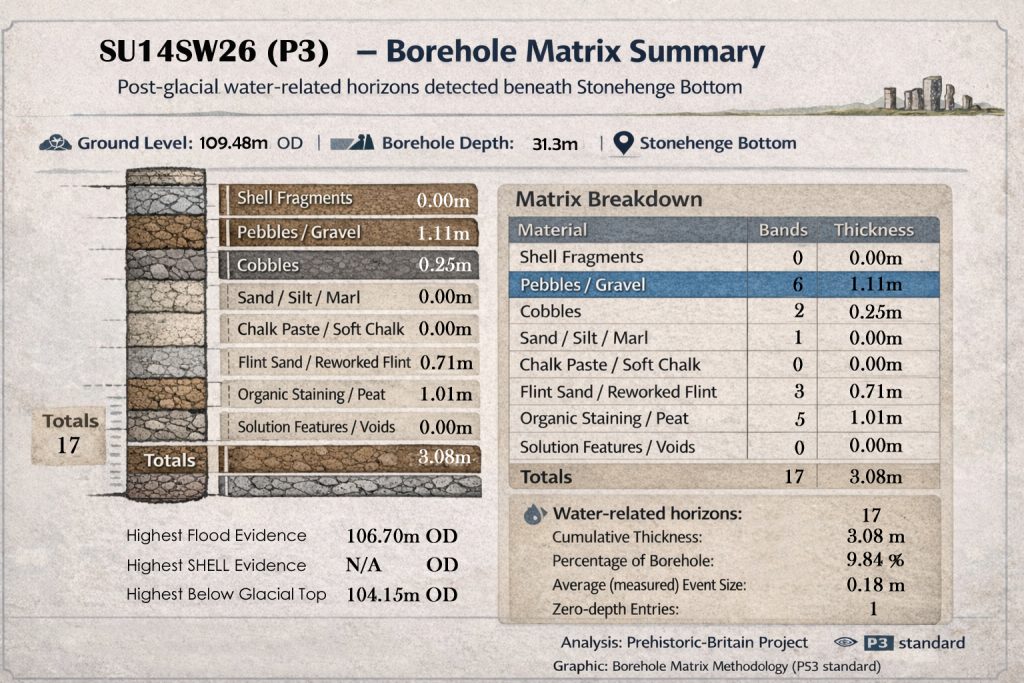
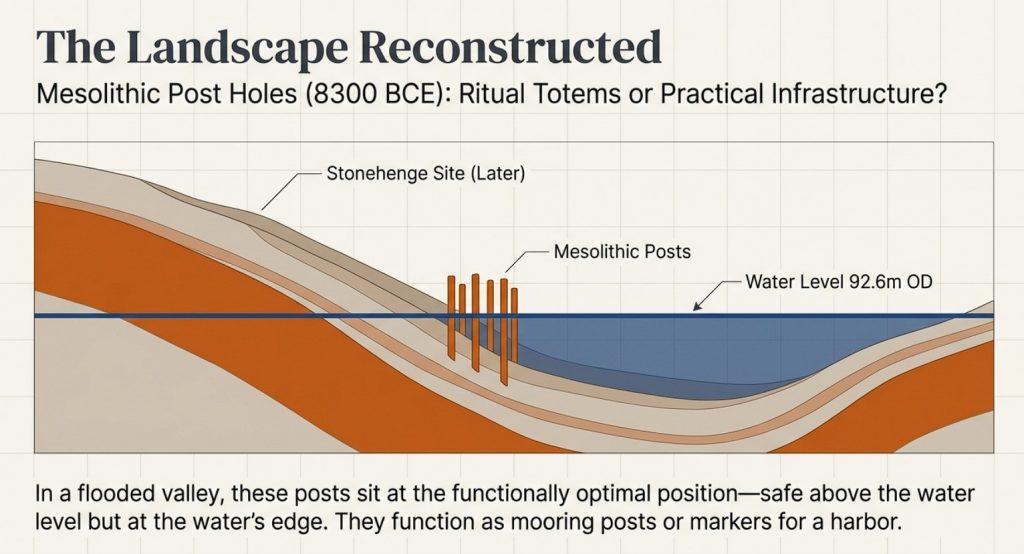
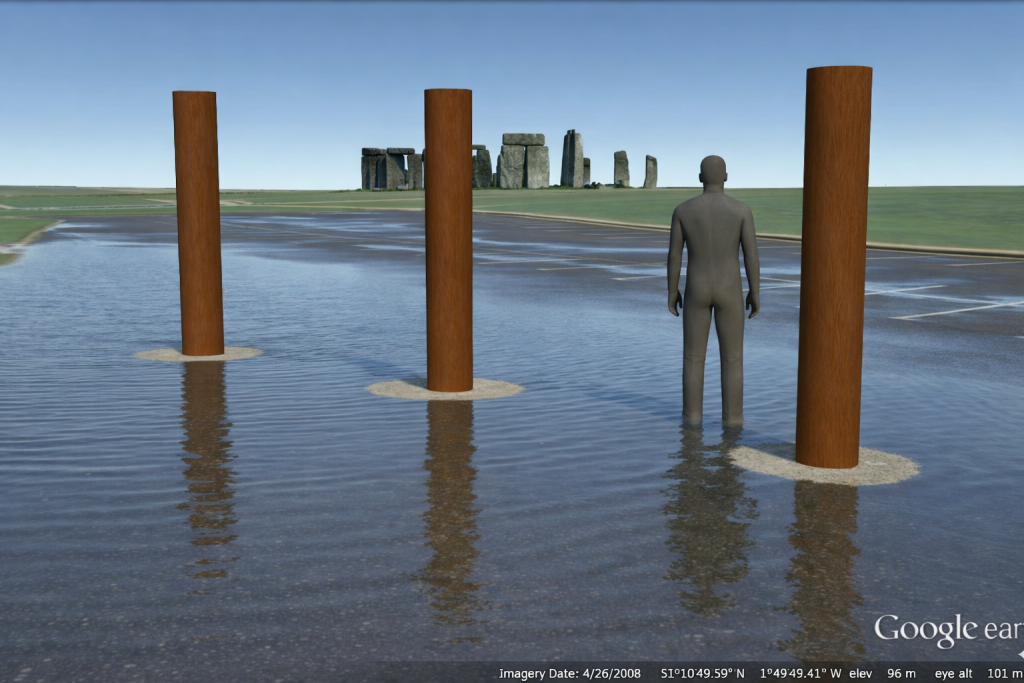
The point is not that every date is exact, identical or directly comparable. The point is that dated and datable evidence appears repeatedly within the same hydrological elevation band. The Stonehenge post-hole evidence shows early Mesolithic activity at a water-margin level. The Durrington shell-bearing horizons show water-derived material at comparable OD levels in the wider landscape. The Stonehenge Bottom boreholes show the same broader pattern of shells, gravels, silts, organic matter, and water-affected deposits.

Taken together, these are not isolated oddities.

They suggest a long-lived water-margin landscape.

This is why the Durrington shell-bearing deposits are so important. They should not be forced into the role of simple “construction dates” for a Late Neolithic monument. Their greater value lies in their ability to record water-derived material at measurable depths and OD levels within the pit system. When those levels correspond with the Stonehenge Bottom borehole evidence and the wider Mesolithic activity horizon, the pattern becomes hydrological rather than ceremonial.

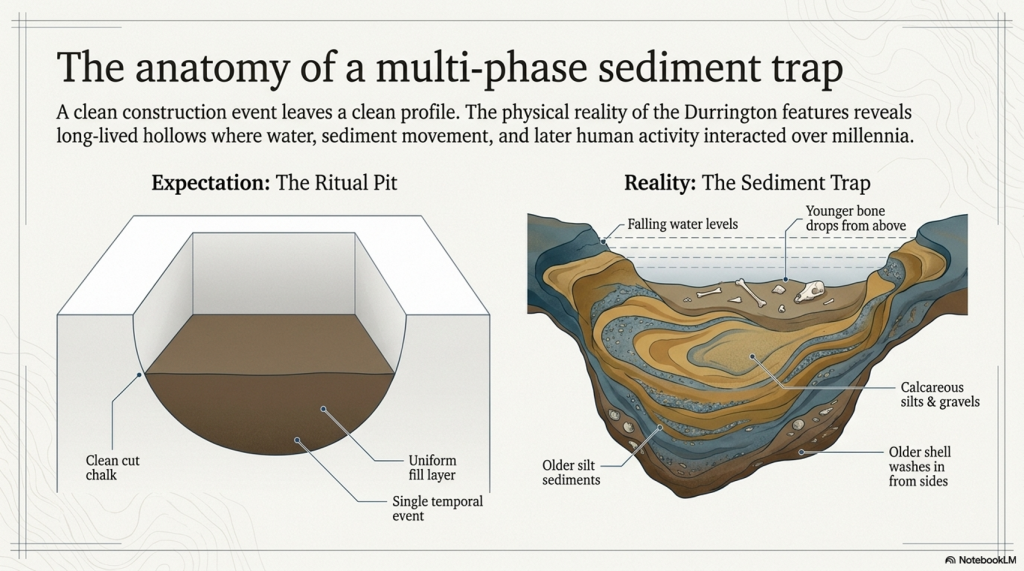
The core evidence is equally awkward for the monument model. Several of the Durrington features contain complex sediments, shell-bearing deposits, calcareous silts, bone, charcoal, flint and reworked material. One of the major features was not even bottomed at seven metres. This is not the clean profile of a single, uniform ceremonial construction event. It is the profile of a long-lived and repeatedly altered landscape.

The 2025 reassessment added more scientific techniques, including further geophysics, boreholes, chemostratigraphy, OSL work and environmental analysis. But the central interpretive problem remains. The new science still has not properly tested the simplest physical explanation: that the pit distribution follows former water margins better than it follows an idealised ritual circle.

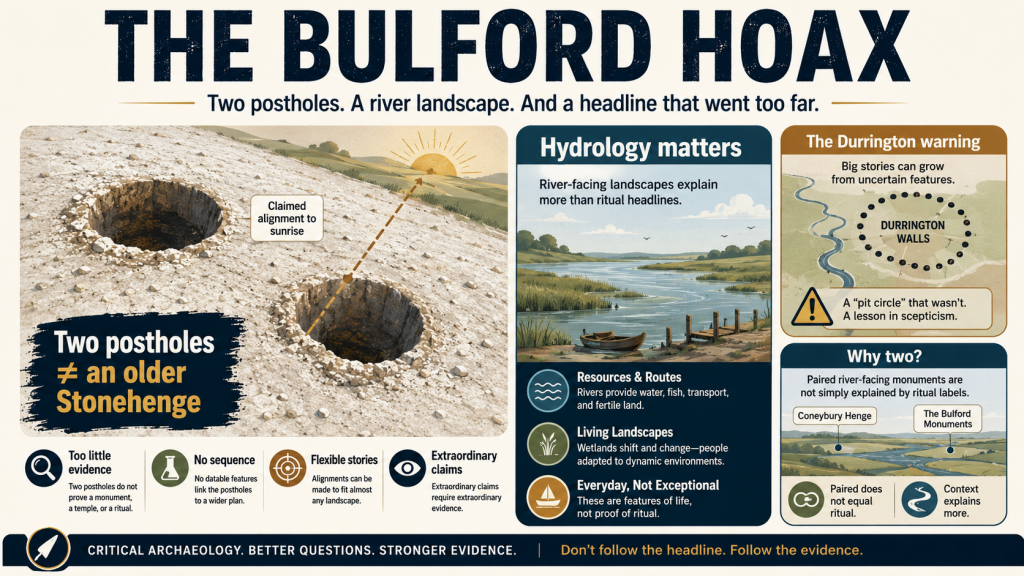
This matters because the same interpretive failure has now reappeared at Bulford. There, two postholes have been promoted as evidence for solar alignment and an “older Stonehenge” style monument before the river-facing landscape, palaeochannels, hydrology and full dating evidence have been properly tested. Durrington and Bulford are not separate mistakes. They are examples of the same problem: pits and postholes are being turned into cosmology before the landscape beneath them has been understood.

This article has therefore been rewritten.

The aim is no longer simply to debunk a television programme. It is to show that the Durrington “mega-monument” may be a classic case of archaeological over-interpretation: a hydrological landscape misread as a ritual structure.

What lies beneath Stonehenge is not just ceremony.

It is water, sediment, shoreline, retreating rivers, buried soils, shell-bearing deposits and a post-glacial landscape that archaeology has still not properly faced.
mega-monument hoax
(The Durrington Mega-Monument Hoax: What Lies Beneath? – Debunked)

1. The Claim Sold to the Public

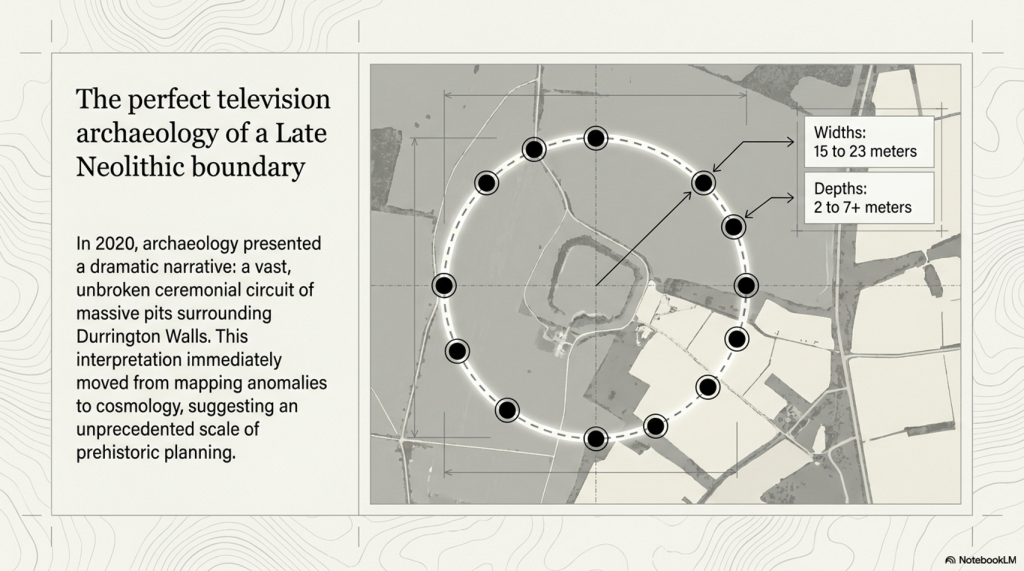
In 2020, the public was presented with one of the most dramatic claims about the Stonehenge landscape in years: a vast circle or circuit of massive pits surrounding Durrington Walls.

The story was simple and powerful. Large pits, some around twenty metres wide and several metres deep, appeared to form a broken arc around Durrington Walls henge. Larkhill causewayed enclosure seemed to sit within the wider arrangement. The pattern was then interpreted as a huge Late Neolithic structure: a boundary, a ceremonial landscape marker, perhaps even a cosmological monument on a scale previously unrecognised in Britain.

It was perfect television archaeology.

There were hidden features beneath the fields. There was a giant lost monument. There was Stonehenge nearby. There were alignments, boundaries, ritual landscapes and the suggestion that Neolithic people had organised the land at an almost unimaginable scale.

But the problem was not the discovery of the pits.

The problem was the story built around them.

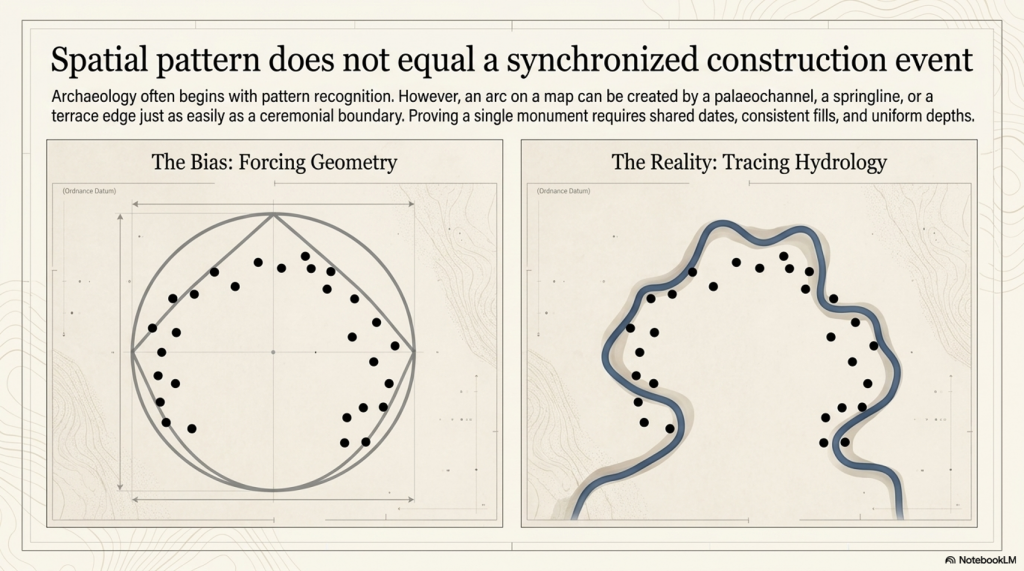
A group of large pits does not automatically prove the existence of a single monument. A broken arc does not automatically prove a planned circle. A pattern on a map does not become ceremonial simply because it can be drawn neatly around a famous henge.

Before the pits are turned into cosmology, the landscape itself has to be explained.

That is where the 2020 interpretation failed.

The 2020 paper presents the features as large pits/anomalies forming arcs around Durrington Walls, and offers a broader interpretation that leans toward a large-pit structure or boundary around the henge.
(The Durrington Mega-Monument Hoax: What Lies Beneath? - Debunked)
(The Durrington Mega-Monument Hoax: What Lies Beneath? – Debunked)

2. The First Problem: Spatial Pattern Is Not a Construction Event

The first problem with the Durrington “mega-monument” interpretation is simple: a spatial pattern is not the same thing as a construction event.

Archaeology often begins with pattern recognition. That is fair enough. If a group of large features appears to form an arc, a circle or a boundary, it deserves investigation. But pattern recognition is only the beginning of analysis. It is not the conclusion.

To prove that the Durrington pits formed a single planned monument, we would need more than a broken arrangement on a map. We would need evidence that the pits were made as part of the same project.

That means asking basic questions.

Were they dug at the same time?

Were they made by the same method?

Do they have consistent dimensions?

Do they have consistent depths?

Do they contain comparable fills?

Do they share the same dating horizon?

Do they show the same construction sequence?

Do they have a clear structural purpose?

Do they relate to posts, banks, ditches or entrances in a consistent way?
(The Durrington Mega-Monument Hoax: What Lies Beneath? - Debunked)
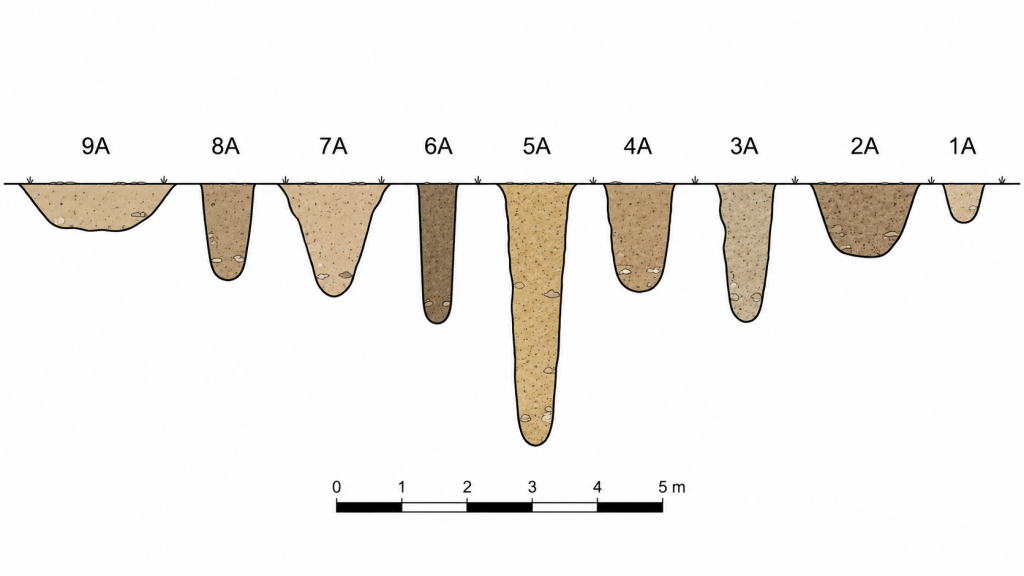
The variuos sized pit shapes and depths is a very clear indication they are not connected – (The Durrington Mega-Monument Hoax: What Lies Beneath? – Debunked)

Without that evidence, the “mega-monument” remains an interpretation placed over a group of features, not a demonstrated construction event.

The published evidence does not show a neat, uniform monument. It shows a mixed landscape of large anomalies, pits, probable pits, possible modified natural features, post alignments, uncertain features, different survey methods, varying levels of excavation, different dates, and varying degrees of confidence.

Some features are known mainly from geophysics. Some were partly excavated. Some were cored. Some were not bottomed. Some were originally interpreted as natural sinkholes or solution hollows. Some have Late Neolithic evidence. Others have Bronze Age, Iron Age, Romano-British or even later material. Feature ii remains particularly weak and should not be used as a secure part of any argument.

This is not how a clean single-event monument should behave.

The dimensions also vary. The published tables show upper diameters ranging from roughly fifteen to twenty-three metres. Depths vary from around two metres to more than seven metres, with several features not bottomed. That is a major problem if the claim is a single designed monument with a shared purpose.

Variation is not fatal by itself. Ancient monuments do not have to be machine-perfect. But variation in size, depth, date, evidence type, fill history, and certainty must be explained before the features are treated as a single structure.

The Durrington interpretation moves too quickly from “these features appear to form arcs” to “these features form a monumental circuit”.

That leap is the problem.

A shoreline can create an arc.

A palaeochannel can create an arc.

A terrace edge can create an arc.

A springline can create an arc.

A former river margin can result in a broken, irregular distribution of large water-affected features.

So, before the pits are treated as a planned ritual boundary, the physical landscape must be tested first. If the same pattern can be explained by palaeochannels, former shorelines and falling water levels, then the monument interpretation is no longer the simplest explanation.

It becomes more complicated.
(The Durrington Mega-Monument Hoax: What Lies Beneath? - Debunked)
(The Durrington Mega-Monument Hoax: What Lies Beneath? – Debunked)

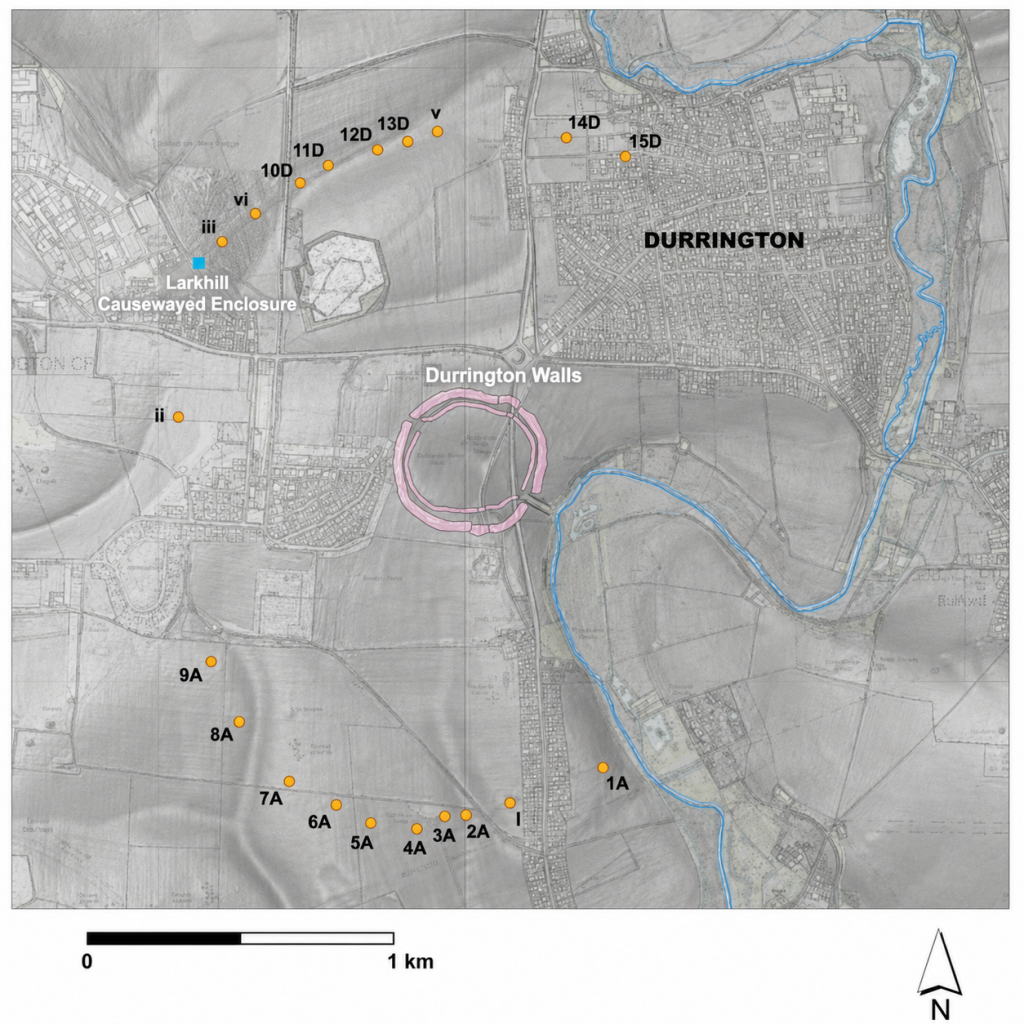
3. The 2026 LiDAR Test: The Pits Fit Palaeochannels

The most important new evidence is not another theory.

It is the map.

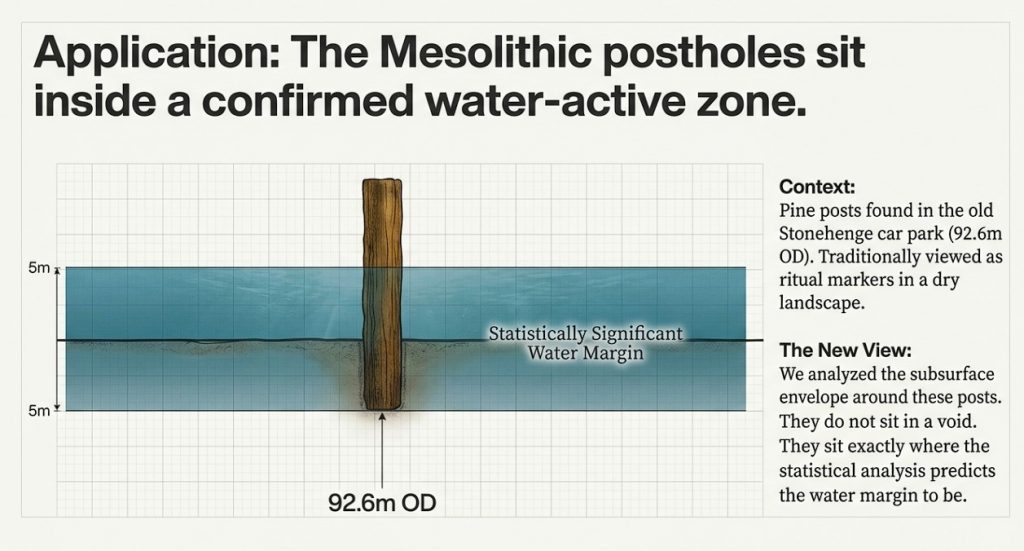
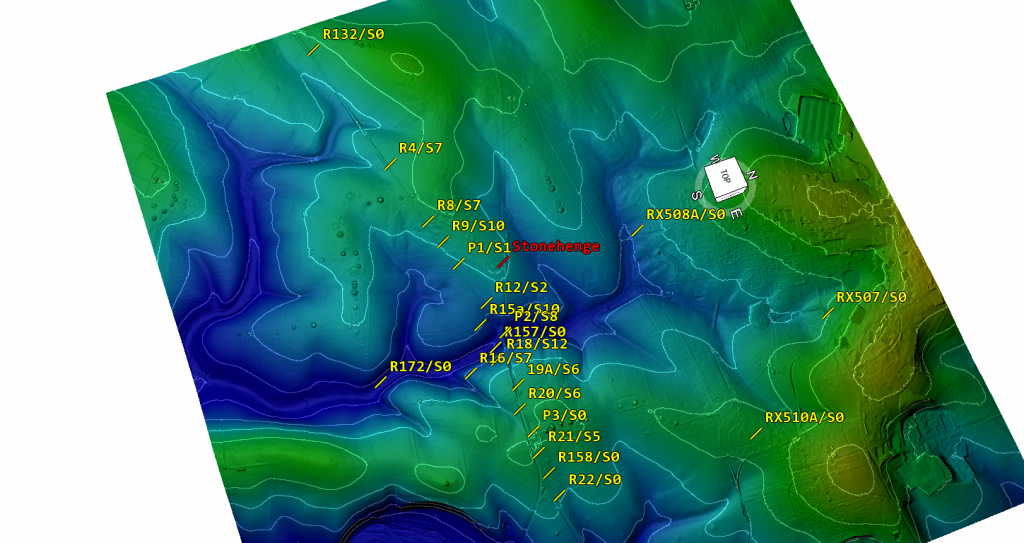
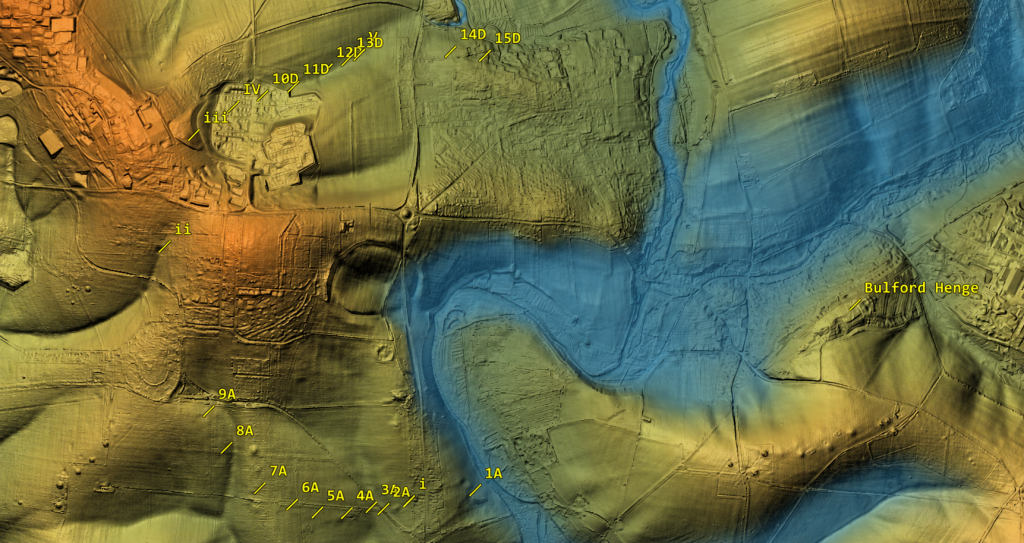
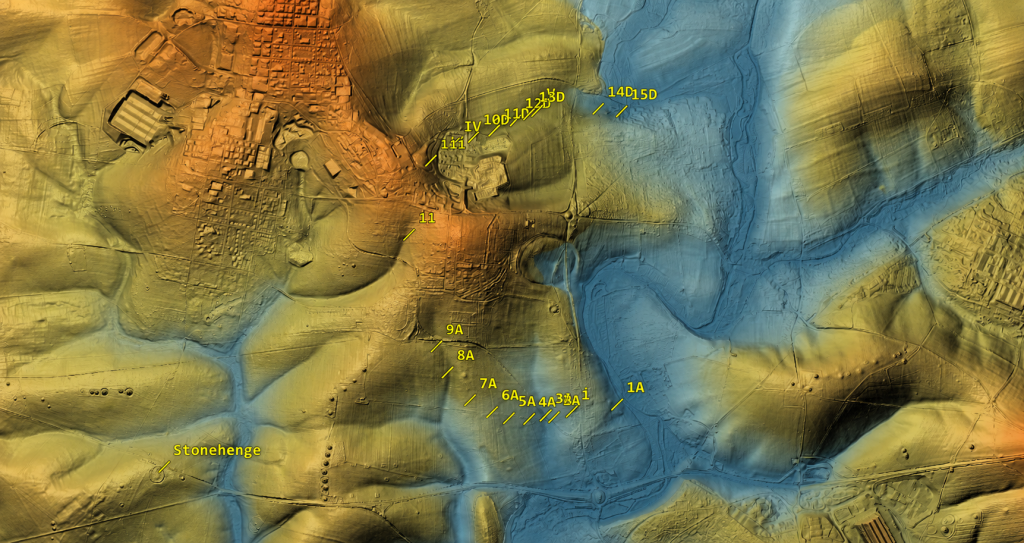
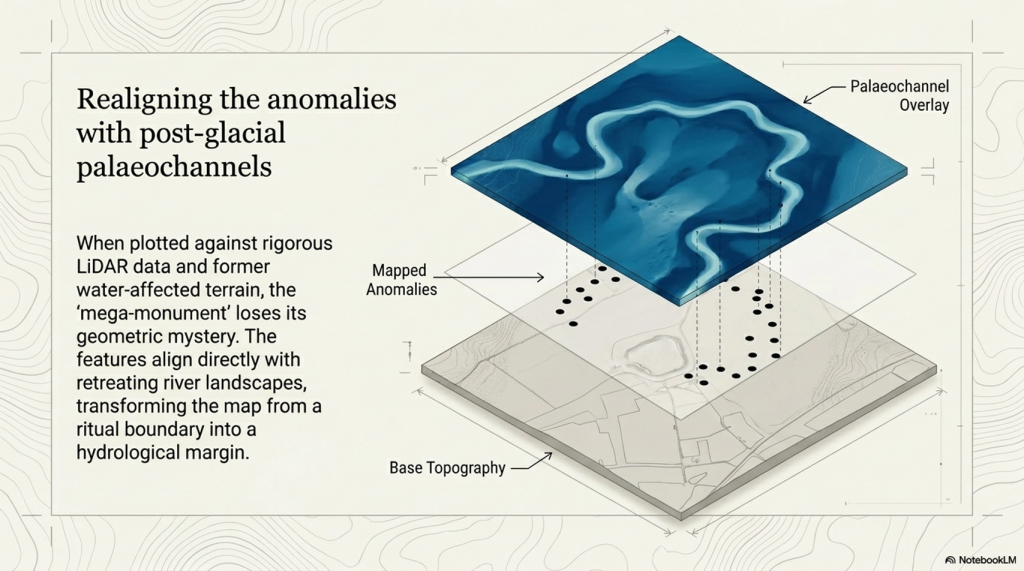
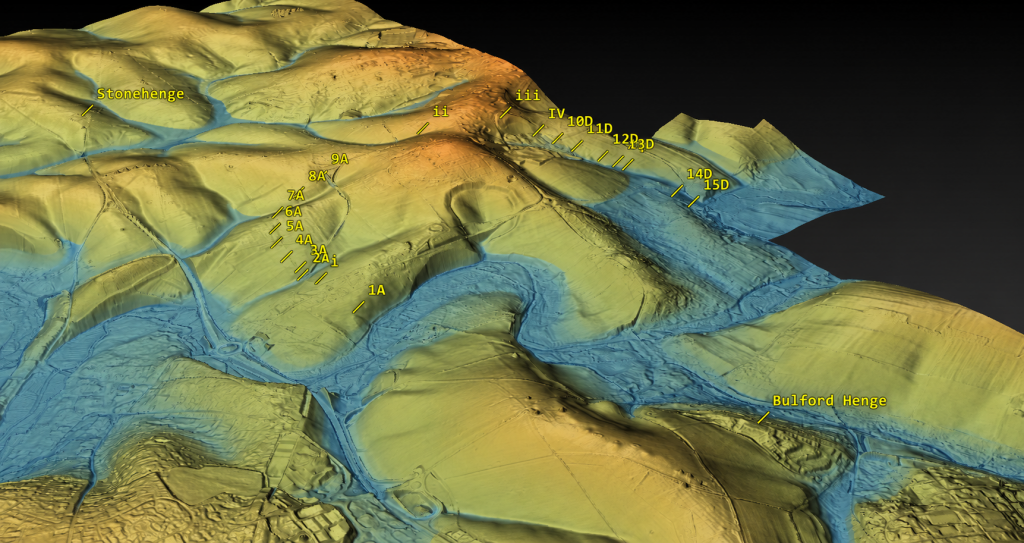
When the Durrington pits are plotted against LiDAR data, palaeochannels, and former water-affected terrain, the supposed “mega-monument” begins to lose its mystery. The pattern no longer looks like a clean, planned circle around Durrington Walls. It looks like a broken distribution of large features sitting on, beside, or within former water-margin terrain.

That changes the interpretation completely.

The credible pits appear to follow palaeochannels and former shoreline zones. They do not need to be forced into a ceremonial circuit to make sense. They make sense as features associated with a changing river landscape.
(The Durrington Mega-Monument Hoax: What Lies Beneath? - Debunked)
(The Durrington Mega-Monument Hoax: What Lies Beneath? – Debunked)

This also explains the gaps.

In the monument model, the gaps are awkward. A huge ceremonial circle with missing sections needs an explanation: lost archaeology, unsurveyed areas, incomplete construction, later destruction, or symbolic absence.

In the hydrological model, the gaps are expected.

Where the land was not affected by the former water system, there is no reason to expect shoreline pits or water-margin sediment traps. Where the ground was once active water, there is also no reason to expect the same kind of pit survival. Features could have been unnecessary, impossible to dig, scoured away, buried beneath later alluvium, or masked by later river change.

So the gaps are not a weakness in the hydrological model.

They are one of its strongest predictions.

This is the point missed by the 2020 interpretation. The question should never have been simply, “Can these features be drawn as a circuit?” The proper question was, “Do these features fit the former river landscape better than they fit an idealised monument?”

Once that test is applied, the answer becomes difficult to ignore.

The pits fit the palaeochannels.

The gaps fit the palaeochannels.

The strange distribution fits the palaeochannels.

Feature ii remains questionable and should not be used to hold the model together. But once that weak outlier is removed, the remaining pattern becomes clearer. The credible features sit where a water-margin model would expect them to sit, while the missing sections occur where a water-margin model would expect them to be missing.

That is not a coincidence. That is landscape logic.

This does not mean every pit must have had the same origin or function. Some may be cut features. Some may be modified natural hollows. Some may be sediment traps. Some may have been reused. Some may have begun naturally and later acquired cultural material. That is exactly what we should expect in a complex river-edge landscape active over long periods.

What it does mean is that the “single mega-monument” interpretation is no longer the simplest explanation.

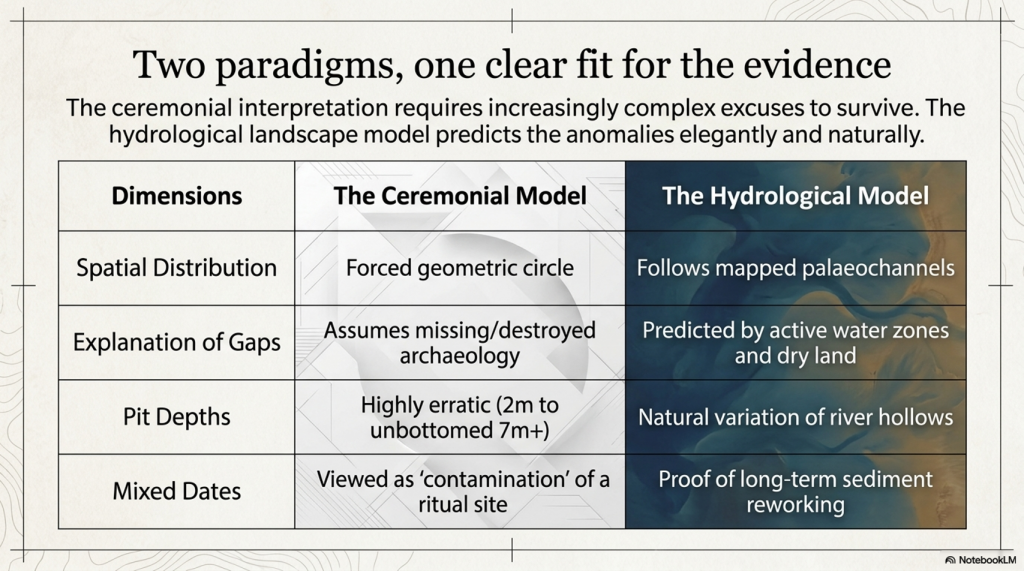
A ritual circle has to explain why the pits vary so much, why some are doubtful, why the dates are mixed, why several fills look reworked, why the circuit is broken, and why the missing parts occur where the hydrology predicts absence.

The palaeochannel model explains all of that more naturally.

The Durrington pits are not just dots around a henge.

They are features in a post-glacial river landscape.

Until the published interpretation can show that the pit distribution is better explained by monument geometry than by palaeochannels and former shorelines, the “mega-monument” claim remains unproven.
(The Durrington Mega-Monument Hoax: What Lies Beneath? - Debunked)
(The Durrington Mega-Monument Hoax: What Lies Beneath? – Debunked)

4. The Gap Problem: A Monument Fails Where Hydrology Predicts Success

The gaps in the Durrington pit distribution are not a minor detail.

They are the test.

If the pits are interpreted as a single planned monument, the missing sections become a problem. A vast ceremonial circuit should have a clear design logic. If large parts of that circuit are absent, the explanation has to be added afterwards: perhaps the pits were destroyed, perhaps they were never found, perhaps they were not visible to survey, perhaps the monument was incomplete, or perhaps the gaps had some symbolic meaning.

That is not evidence.

That is rescue archaeology for a weak interpretation.

In the hydrological model, the gaps do not need to be rescued. They are predicted by the landscape.

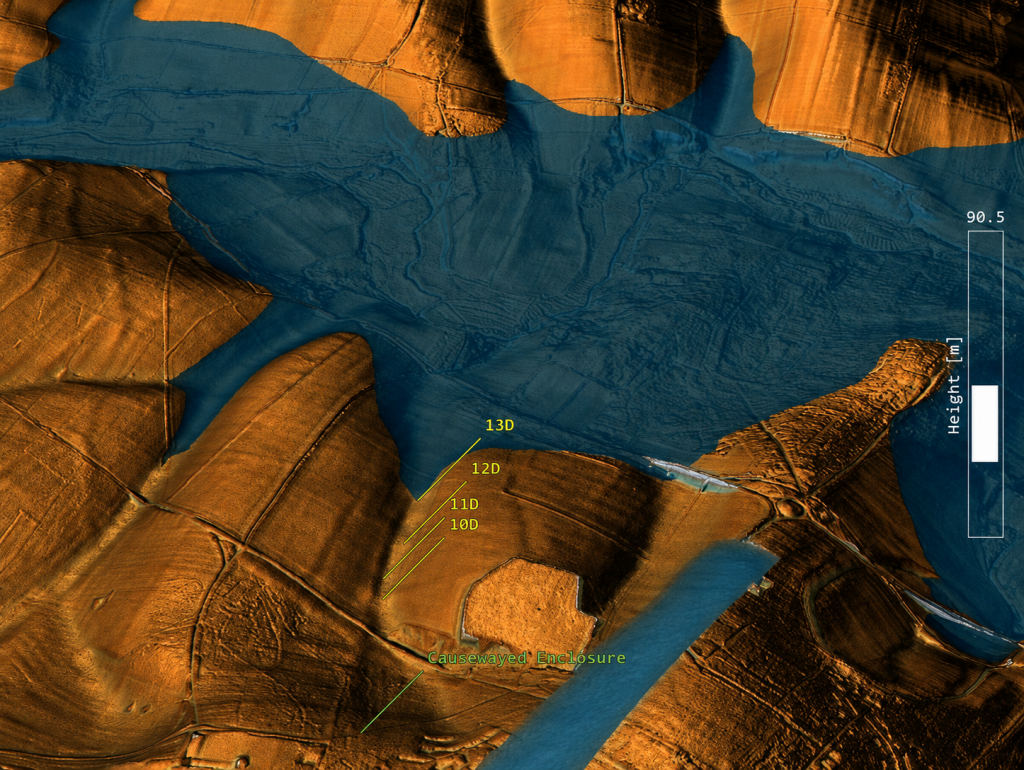
Where the former water system did not reach, there is no reason to expect water-margin pits, shoreline hollows, sediment traps or shell-bearing deposits. Where the former water zone was active, unstable or actually underwater, there is also no reason to expect the same type of pit survival. Features could have been impossible to dig, unnecessary, eroded, buried, masked, or replaced by later river deposits.
(The Durrington Mega-Monument Hoax: What Lies Beneath? - Debunked)
(The Durrington Mega-Monument Hoax: What Lies Beneath? – Debunked)

This is why the broken pattern matters.

The apparent gap on one side of the supposed circuit corresponds with land that does not fit the former water-margin model. No shoreline, no pits.

The apparent gap on the other side corresponds with ground that was once within the active Avon/water system. Active water does not preserve a neat ceremonial pit circuit. It cuts, scours, silts, masks and moves.

So what looks like a failed monument becomes a successful hydrological prediction.

The monument model has to explain why the circuit is missing where it is missing.

The water model already explains it.

This is the central weakness of the “mega-monument” claim. The interpretation begins by drawing a circle and then struggles to explain the broken evidence. But if the pits are plotted against palaeochannels and former shorelines first, the broken pattern is no longer broken. It is exactly what a changing river-edge landscape should produce.

The gaps are not missing archaeology.

They are the landscape telling us that the original interpretation started in the wrong place.
(The Durrington Mega-Monument Hoax: What Lies Beneath? - Debunked)
(The Durrington Mega-Monument Hoax: What Lies Beneath? – Debunked)

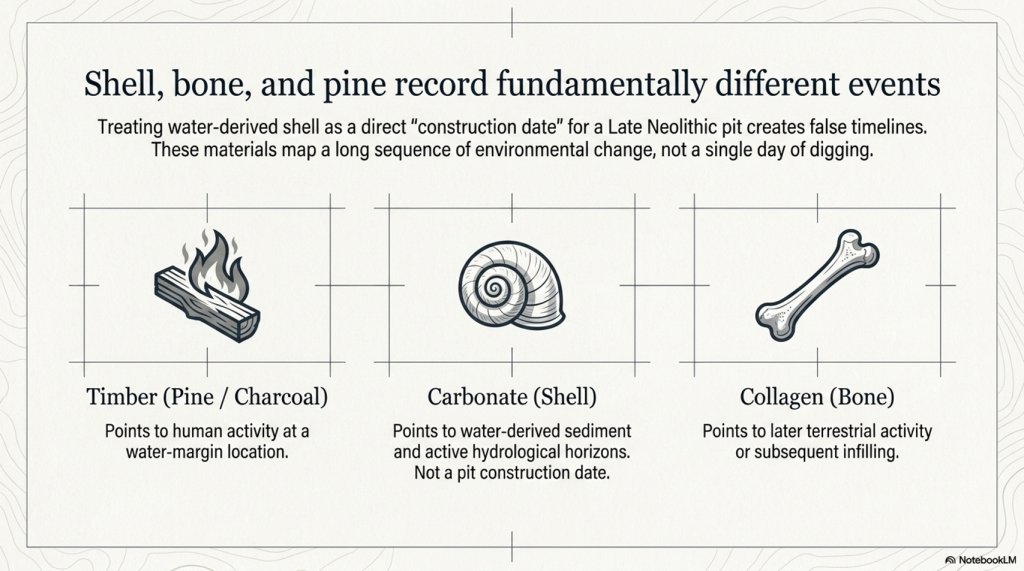
5. The Dating Problem: Shell, Bone and Pine Are Not the Same Evidence

The dating evidence at Stonehenge and Durrington must be handled carefully because not all radiocarbon samples date the same event.

This is where confusion can easily enter the argument.

The Mesolithic post-hole evidence at Stonehenge is associated with pine wood or charcoal. That kind of sample dates human activity involving timber. It does not date the river directly. It tells us that people were active at that location, at that period, and within that landscape setting.

The Durrington shell evidence is different. Shell is not timber. Shell is a carbonate material from a water-affected environment. It is therefore more useful here as evidence for shell-bearing, water-derived sediment at a particular depth and OD level than as a simple “construction date” for a pit.

That distinction matters.

The argument being made here is not that pine charcoal, shell and bone are all identical samples giving identical meanings. They are not.

The argument is that different kinds of dated and datable evidence repeatedly occur within a coherent hydrological landscape.

Pine or charcoal can show human activity at a water-margin location.

Shell can show water-derived material within a specific sediment horizon.

Bone can provide a terrestrial date for later activity, deposition or infilling within the same feature.

These are different kinds of evidence, but together they help build a landscape sequence.

This is why the Durrington shell dates should not be dismissed simply because they differ from bone dates. The report itself recognised that the shell dates do not behave like simple construction dates. That is true. But that does not make the shells meaningless. It means they are telling us something different.

They are not necessarily dating the moment a pit was dug.
(The Durrington Mega-Monument Hoax: What Lies Beneath? - Debunked)
(The Durrington Mega-Monument Hoax: What Lies Beneath? – Debunked)

They are dating, or at least period-associating, shell-bearing material within the water-affected sediment system.

For a dry-land monument model, that is awkward.

For a hydrological model, it is exactly the kind of evidence we would expect.

The Durrington shell horizons occur within deep, complex, calcareous and reworked deposits. Their value is not that they provide a neat construction date for a Late Neolithic monument. Their value lies in their placement of shell-bearing, water-derived material at measurable depths within the pit system. Once those depths are converted to OD levels and compared with Stonehenge Bottom, the pattern becomes more important than any single date.

Bone dates have a different role. Bone collagen is a terrestrial sample and is generally more useful for dating later activity or fill events within the pits. But a later bone date does not cancel the hydrological meaning of an earlier shell-bearing horizon. It simply shows that the feature or sediment system remained open, active, reused, reworked or infilled over a long period.

That is the key point.

If a pit contains older shell-bearing material and later bone-bearing deposits, the correct response is not to force the whole feature into one tidy construction date. The correct response is to recognise a multi-phase sediment sequence.

That is exactly what a water-margin landscape should produce.

Material can be washed in.

Older sediment can be reworked.

Shells can be redeposited.

Bone can enter later.

Charcoal can be introduced by human activity.

Silts, gravels and calcareous sediments can accumulate through repeated environmental change.

The dates are therefore not a weakness in the hydrological interpretation. They are part of the reason the dry “single monument” interpretation is so vulnerable.

A single construction event should produce a cleaner chronological pattern.

The Durrington evidence does not.

The shell evidence points to water-derived deposits.

The bone evidence points to later activity or infilling.

The Stonehenge pine evidence points to earlier human activity at a comparable water-margin landscape.

The important connection is not that every sample gives the same date.

It is that the evidence repeatedly appears within the same kind of hydrological setting.

That is why this article does not treat the Durrington shell dates as simple proof that a pit was dug at one exact moment. Instead, they are used as part of a wider hydrological sequence: dated shell-bearing horizons, measurable OD levels, evidence from the Stonehenge Bottom borehole, Mesolithic activity at Stonehenge, and a falling river system that could remain active for centuries or millennia.

This is the difference between dating a monument and dating a landscape.

The 2020 interpretation tried to use the dating evidence to support a Late Neolithic pit structure.

The hydrological interpretation asks a better question:

What do the dates, materials, depths and OD levels tell us about the former river landscape?

Once that question is asked, the evidence stops looking like a problem.

It starts looking like the answer.
(The Durrington Mega-Monument Hoax: What Lies Beneath? - Debunked)
(The Durrington Mega-Monument Hoax: What Lies Beneath? – Debunked)

6. The C14 Sequence Does Not Behave Like a Simple Dry Pit

The radiocarbon sequence at Durrington does not behave like a clean, sealed, dry-land pit sequence.

That is a major problem for the “single monument” interpretation.

In a simple dry pit, the dating pattern should normally be fairly straightforward: lower material is generally older. Higher material should generally be younger. If the pit was dug and filled as part of one construction event, the dating should cluster around that event or its immediate aftermath.

That is not what we see.

The Durrington dates are mixed, multi-phase and materially different. They include shells from water-derived deposits and bones from later terrestrial/cultural deposits. That alone should prevent anyone from treating the whole pit system as a simple one-date construction event.

The first issue is the labelling problem.

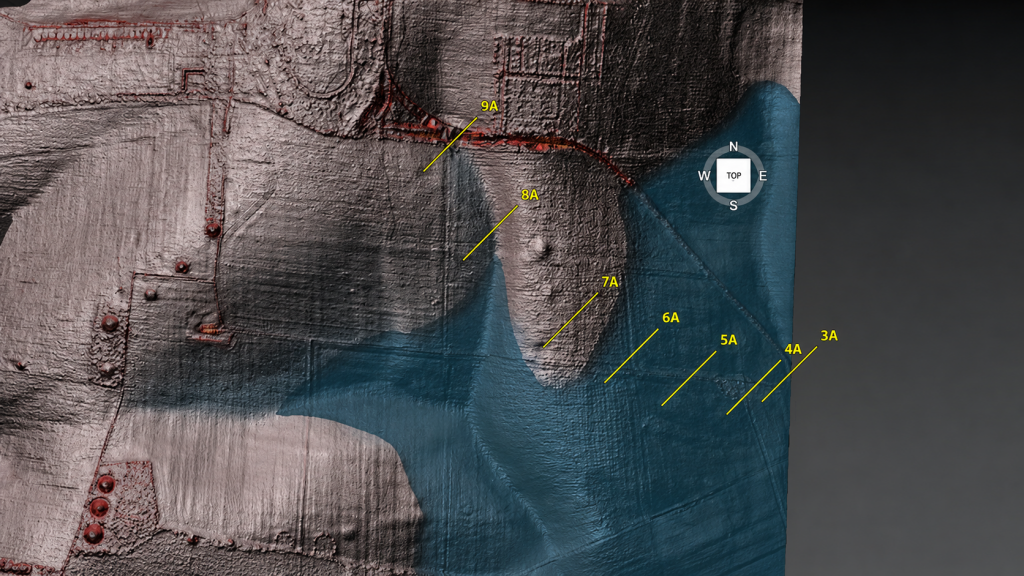
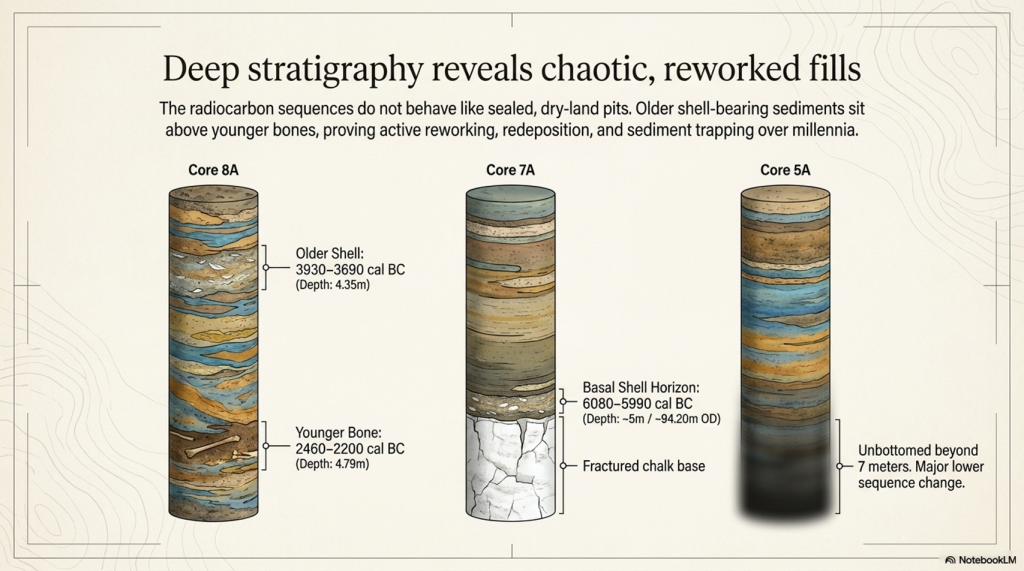
One shell sample, SUERC-92464, is listed from a depth of 4.80–4.85m below ground level and produced a published calibrated date of 6080–5990 cal BC. The feature label is not straightforward. The main paper and core sequence associate BH1 with 7A, while one supplementary radiocarbon listing appears to create a 9A / BH1 confusion.

That matters for database accuracy, but it does not destroy the hydrological argument.

The secure data are the lab number, material, depth and calculated OD horizon. If the surface height used in the LiDAR model is approximately 99m OD, then a sample at 4.80–4.85m below ground sits at about 94.15–94.20m OD. That is the important point. The sample belongs to a shell-bearing horizon at a measurable elevation within the Durrington pit system.

The argument should therefore be anchored to the sample, not the disputed label:

SUERC-92464
shell
4.80–4.85m below ground
published date 6080–5990 cal BC
approximate modelled horizon c.94.15–94.20m OD
feature label requires caution because of the 7A / 9A inconsistency

That is how the evidence should be handled scientifically.

The second issue is 8A.
(The Durrington Mega-Monument Hoax: What Lies Beneath? - Debunked)
(The Durrington Mega-Monument Hoax: What Lies Beneath? – Debunked)

Here, the dating sequence is even more revealing.

8A contains a shell date from 1.50–1.55m below ground, published at 4710–4550 cal BC. It also contains a deeper shell date from 4.35–4.40m below ground, published at 3930–3690 cal BC. Then, near the base, bone from around 4.79m produced a much later date, published at 2460–2200 cal BC.

That is not a simple dry-pit sequence.

A neat monument model would struggle with that order. Older shell-bearing material sits above or within a sequence that later includes much younger bone. The fills are not behaving like a single clean construction deposit.

But a water-margin model does not struggle with this.

In a river-edge or palaeochannel landscape, older shell-bearing sediment can be reworked, washed, slumped or redeposited into later features. As water levels fall, channels shift, margins retreat, sediment is disturbed, and older material can be incorporated into younger fills. Later bone, charcoal, flint, or cultural debris can then enter the same feature during subsequent use, collapse, silting, or reworking.

That is not contamination in the casual sense.

It is a landscape process.

The Durrington evidence makes far more sense if the pits are not treated as sealed ceremonial holes but as complex sediment traps within a changing water-margin landscape.

This also explains why shell evidence should not be dismissed simply because it does not match the bone’s date. The shell is not trying to date the pit as a monument. It records shell-bearing, water-derived material within the pit fill. The bone is recording a later terrestrial or cultural event within the same complex sequence.

Those are different facts.

Both matter.

The real problem is the attempt to compress them into one monument story.

The C14 evidence instead points to a long and complex landscape history. Shell-bearing horizons, later bone deposits, reworked sediments, and deep unbottomed features do not support a simple dry-land construction event. They support a multi-phase environment in which water, sediment and later human activity interacted over long periods.

That is exactly what the LiDAR and palaeochannel model predicts.

The dates do not break the hydrological interpretation.

They break the tidy monument story.
(The Durrington Mega-Monument Hoax: What Lies Beneath? - Debunked)
(The Durrington Mega-Monument Hoax: What Lies Beneath? – Debunked)

7. The OSL Problem: Where Is the Full Chronology?

The OSL evidence is another major weakness in the Durrington “mega-monument” interpretation.

In the 2020 paper, the luminescence work was not presented as a complete, fully resolved OSL dating model for the pit system. What was published was mainly luminescence stratigraphy: OSL and IRSL signal profiling through selected cores, especially 8A and 5A. That is useful, but it is not the same thing as publishing a full chronological model with all age estimates, dose rates, rejected samples, uncertainty ranges and reasons for exclusion.

That distinction matters.

Luminescence stratigraphy can show changes in sediment packages. It can show reworking. It can show breaks. It can show whether lower deposits have a different depositional history from upper deposits. But unless the full dating dataset is published, it cannot be independently tested as a complete chronology.

This is especially important at Durrington because the luminescence evidence was not simple.

In 8A, the signal pattern suggested redeposited material through part of the sequence. That is already significant, because redeposition is exactly what a water-margin or palaeochannel model would predict.

In 5A, the problem becomes even bigger. The feature was not bottomed at seven metres, and the luminescence profile indicated a major change in the lower sequence. There was also a light-exposed section of core, which limited normal OSL sampling. That is not a minor technical detail. It affects how confidently the lower deposits can be understood.

So the question is obvious:

Where is the full chronology?
(The Durrington Mega-Monument Hoax: What Lies Beneath? - Debunked)
(The Durrington Mega-Monument Hoax: What Lies Beneath? – Debunked)

If the interpretation is going to claim a massive Late Neolithic pit structure, then every dating line matters. The full OSL evidence should be available for scrutiny, including:

all sampled depths
all accepted OSL ages
all rejected OSL ages
all dose-rate data
all equivalent-dose estimates
all uncertainty ranges
all light-exposed intervals
all failed or unsuitable samples
all reasons for excluding samples from the final model
all links between OSL samples, core depths, sediment units and OD levels

Without that, the reader is asked to accept the interpretation without being able to properly test its chronological foundations.

This matters because inconvenient dates are not noise if the real question is hydrology.

A date that does not fit a neat Late Neolithic monument story may still be extremely important. It may date an older sediment package. It may identify redeposited water-margin material. It may show that a pit was cut into a much older palaeochannel fill. It may prove that the feature has a longer landscape history than the monument model allows.

In a purely ceremonial interpretation, awkward dates can be labelled residual, redeposited, contaminated or irrelevant.

In a hydrological interpretation, those same dates may be the evidence.

That is why the OSL problem is so important. The 2020 report already showed that the sediment history was complex, but it did not publish a full OSL chronological archive sufficient to test the hydrological alternative. Later work added more OSL dating and environmental analysis, but the same interpretive assumption remained: the features were still being pulled back into the pit-structure model.

That is not good enough.

If these pits are sitting on palaeochannels and former river margins, then the lower, older, reworked or awkward sediment packages are not side issues. They are central to understanding the site.

The full chronology should decide the interpretation.

The interpretation should not decide which chronology matters.
(The Durrington Mega-Monument Hoax: What Lies Beneath? - Debunked)
(The Durrington Mega-Monument Hoax: What Lies Beneath? – Debunked)

8. The Core Logs: These Are Sediment Traps, Not Simple Ritual Holes

The core logs are among the most important pieces of evidence in the entire Durrington debate.

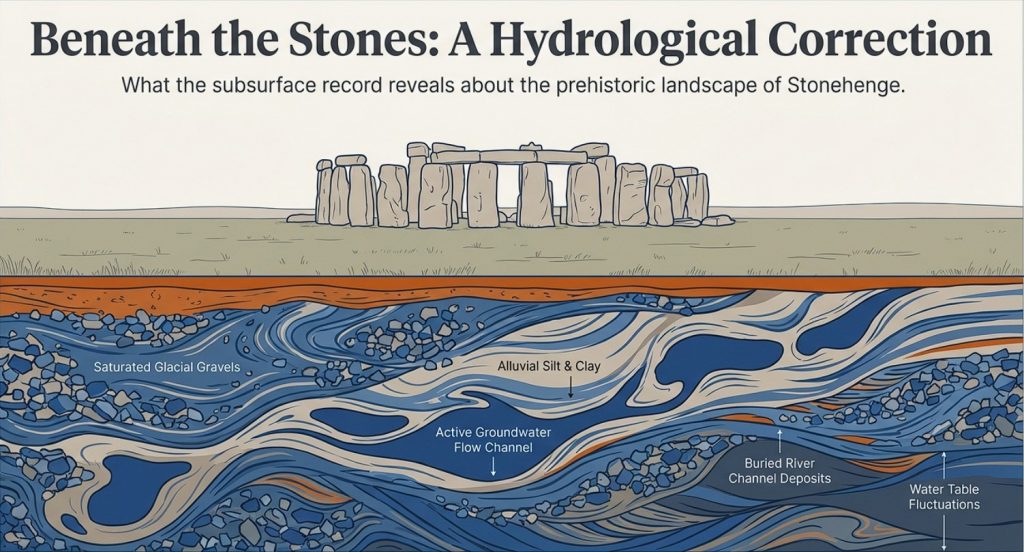
They show that the features are not simple, clean, ceremonial holes with a straightforward construction story. They are deep, complex sediment sequences.

Feature 7A reached fractured chalk at around five metres. Immediately above that lower chalk horizon was a shell / mollusc-bearing sample. That matters because it places water-related material close to the base of the feature, not merely as a casual surface intrusion.

Feature 8A is even more important. Its lower fills contained grey calcareous silts, molluscs, bone fragments and a struck flint. The mollusc-bearing sediment was not an incidental find sitting at the top of the feature. It formed part of a deeper calcareous sequence. That is exactly the sort of deposit expected in a water-affected landscape where older shell-bearing material, silt and cultural debris can be trapped, reworked or redeposited.

Feature 5A is different again. It was cored to seven metres and still not bottomed. Its sequence included bone, charcoal, flint-rich material, fragmentary lower deposits and a major change beneath the upper dated levels. That is not the profile of a simple, uniform pit dug and filled in a single neat event. It is a deep and unresolved sediment archive.

These three cores alone should have stopped the interpretation from becoming too tidy.

7A gives a basal shell-bearing horizon.

8A gives calcareous silts and molluscs within a deeper reworked sequence.

5A gives a deep, unbottomed, and complex fill with bone-, charcoal-, and flint-rich material.
(The Durrington Mega-Monument Hoax: What Lies Beneath? - Debunked)
(The Durrington Mega-Monument Hoax: What Lies Beneath? – Debunked)

Taken together, they point to a landscape of sediment movement, water action, reworking and later activity. They do not point clearly to a single ritual construction event.

This is the difference between seeing the pits as “monumental holes” and seeing them as part of a former river-edge landscape.

A ceremonial interpretation looks at the size of the holes and asks what symbolic boundary they might have formed.

A hydrological interpretation looks at the fills and asks what processes created, altered or filled them.

The core logs favour the second question.

They show that the Durrington features are not just empty spaces in the chalk. They are sediment traps. They contain the history of the landscape that filled them.

That history includes water.
(The Durrington Mega-Monument Hoax: What Lies Beneath? - Debunked)
(The Durrington Mega-Monument Hoax: What Lies Beneath? – Debunked)

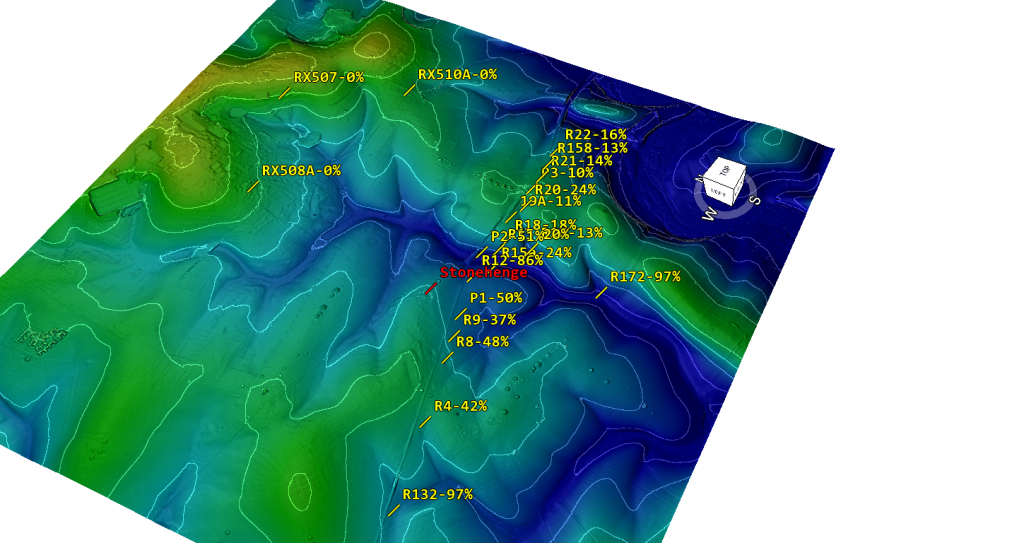
9. The Stonehenge Bottom Connection

The Durrington evidence matters because it does not stand alone.

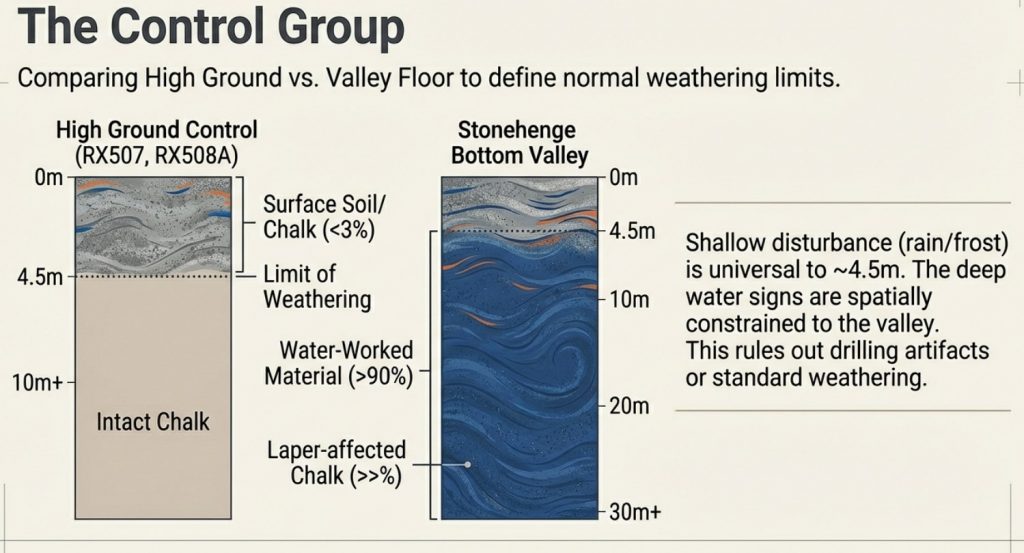
Stonehenge Bottom has long been treated as if its water-affected deposits could be dismissed as background geology, chalk solution, ancient fossil material, or an irrelevant natural disturbance. That position is no longer safe.

The Durrington pits show that shell-bearing, calcareous, and water-affected deposits occur within the wider Stonehenge landscape in contexts that yield Holocene radiocarbon dates. That does not mean every shell at Stonehenge Bottom is the same age as every shell at Durrington. It does not mean that every shell records the same event. It does not mean every deposit belongs to a single flood.

That is not the argument.

The point is simpler and stronger.

Shell-bearing deposits in this landscape cannot just be waved away.
(The Durrington Mega-Monument Hoax: What Lies Beneath? - Debunked)
(The Durrington Mega-Monument Hoax: What Lies Beneath? – Debunked)

They must be tested.

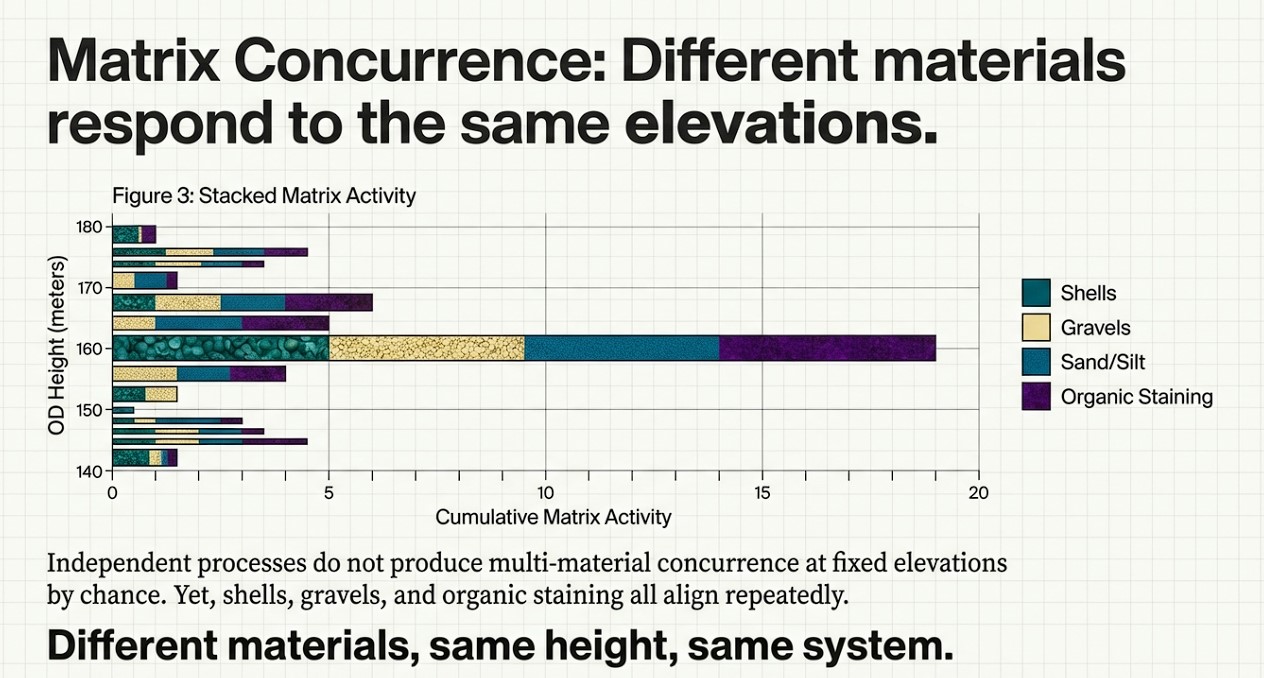
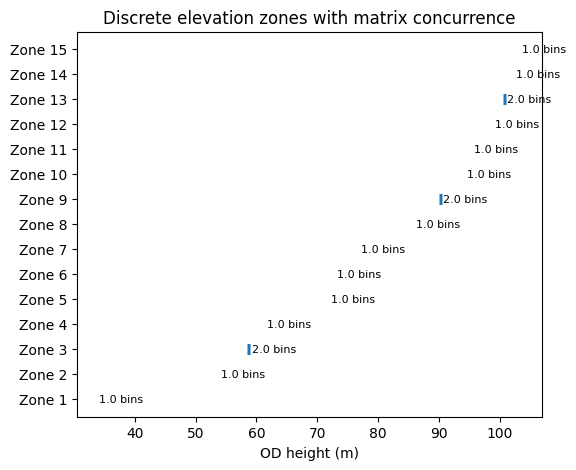
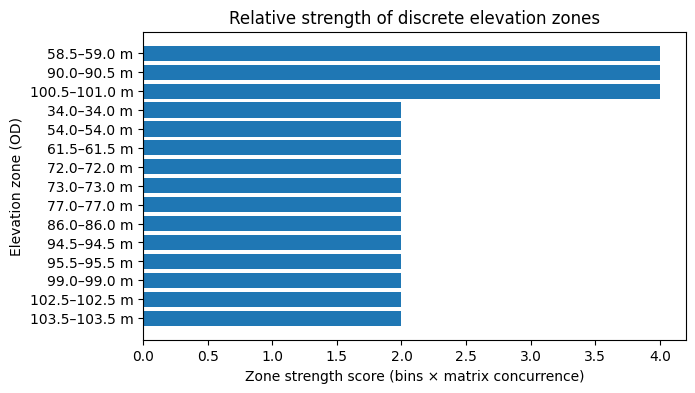
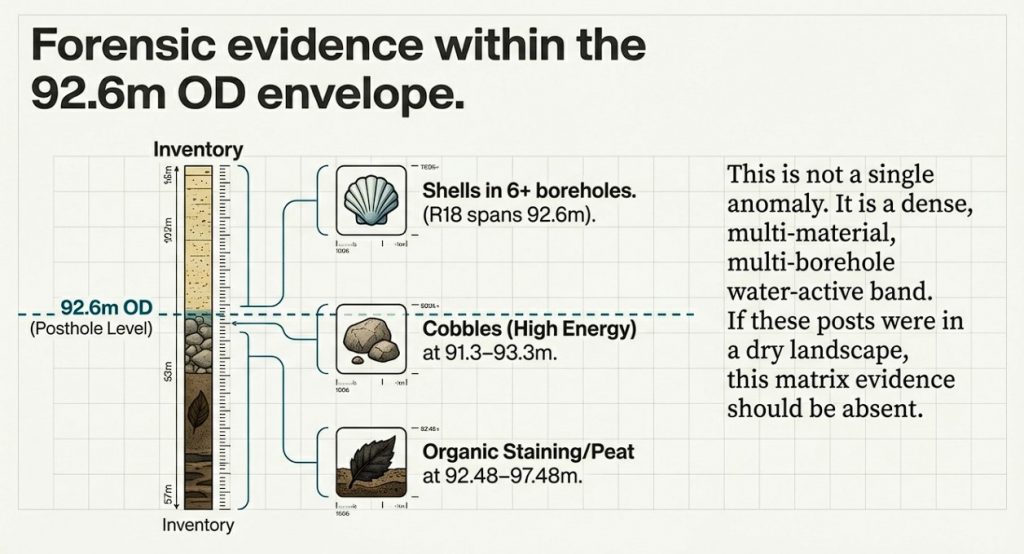
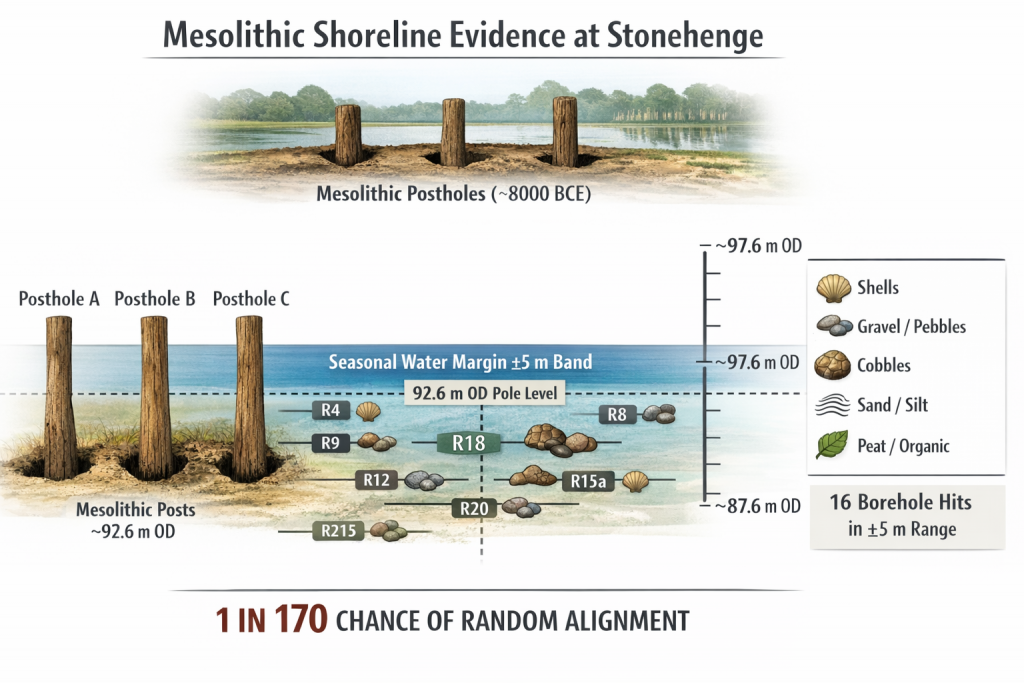
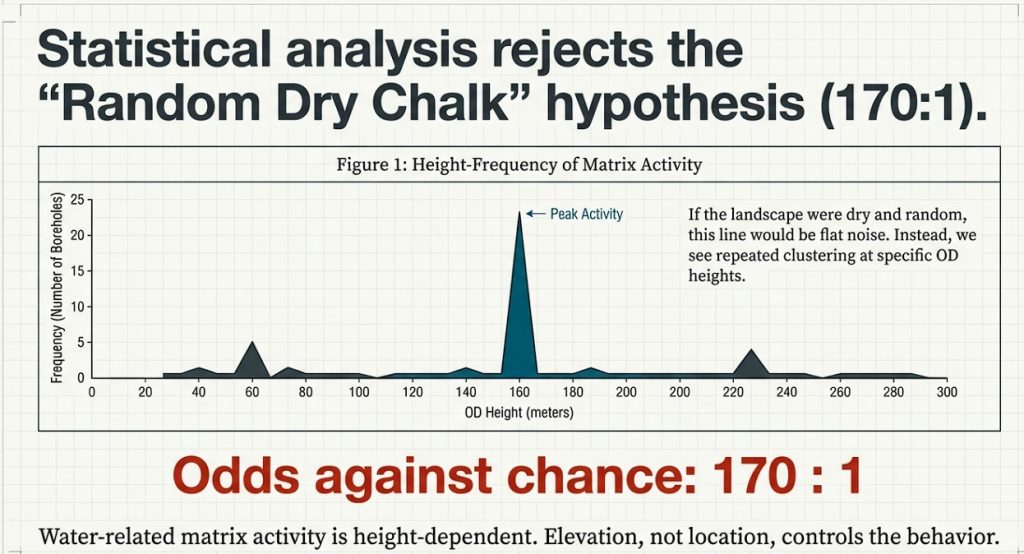
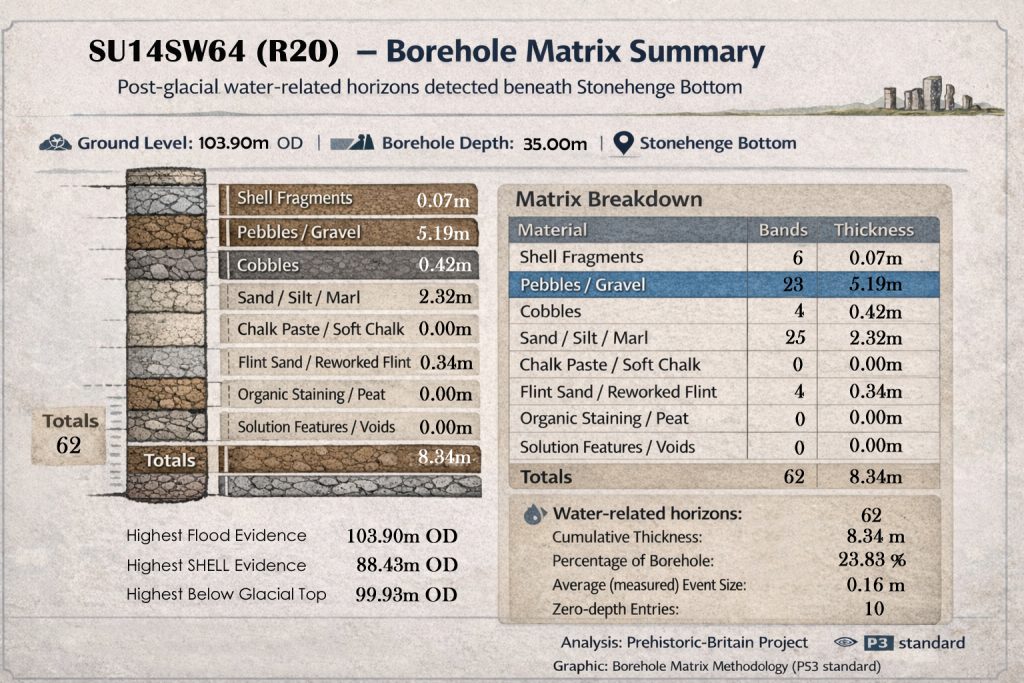
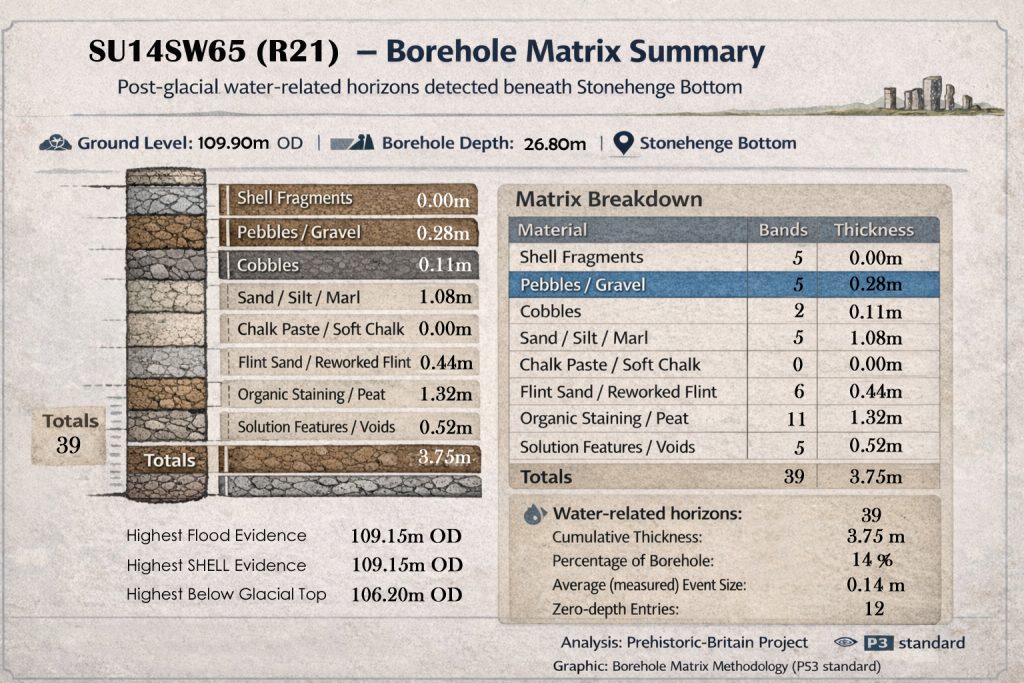
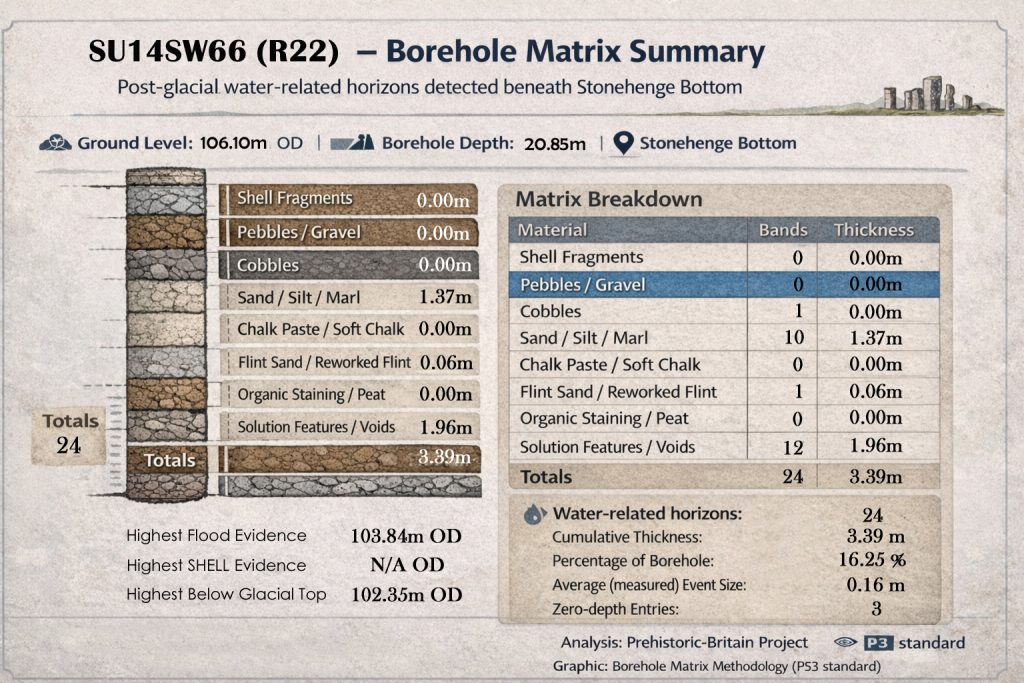
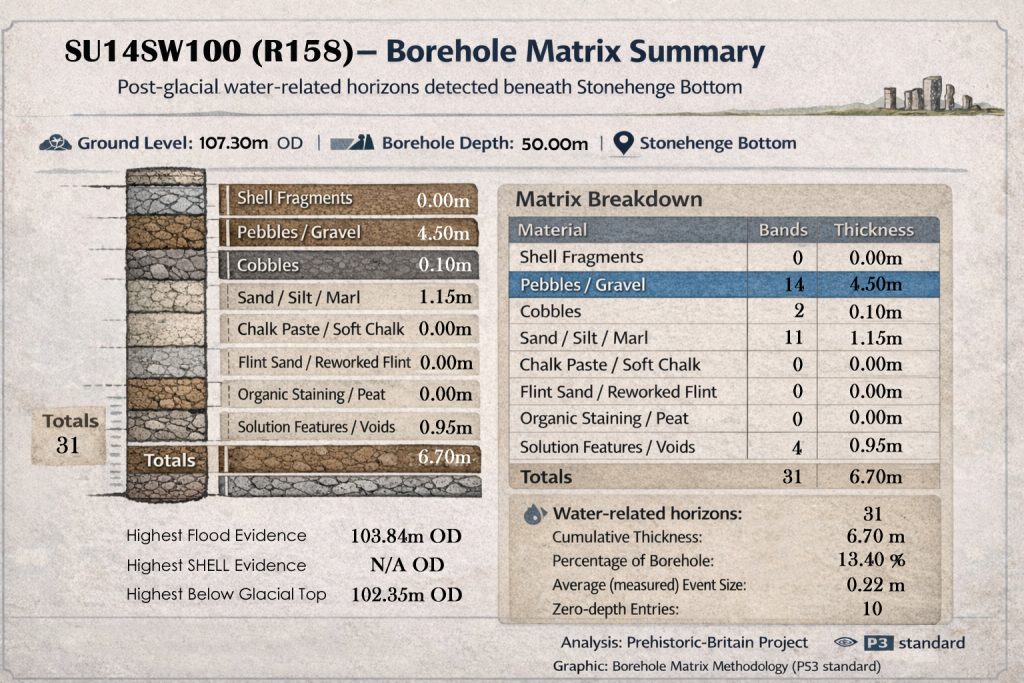
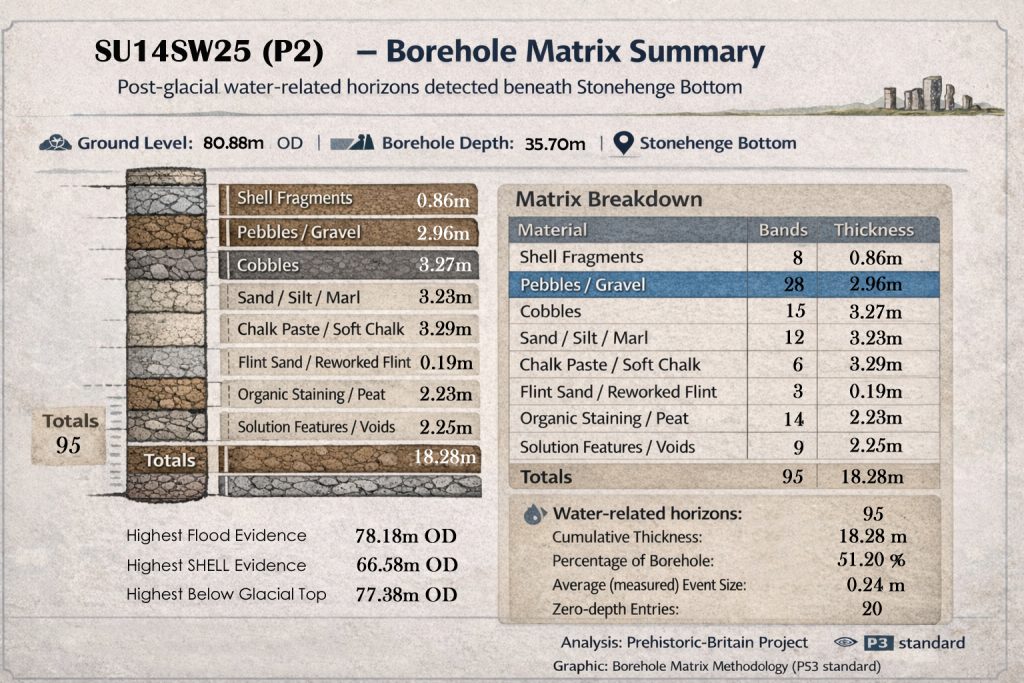
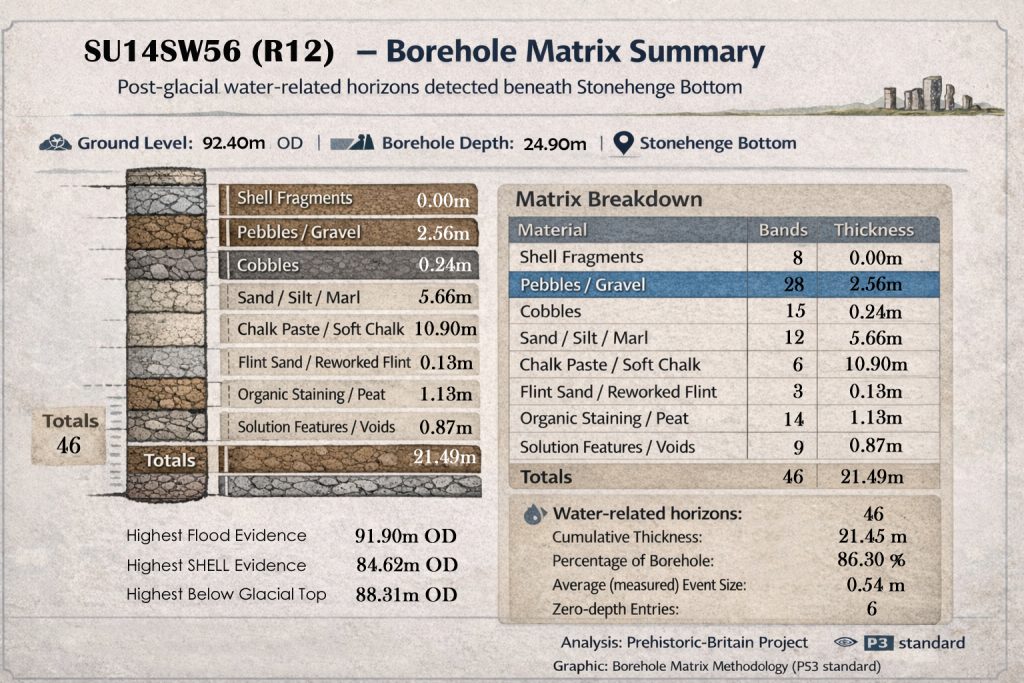
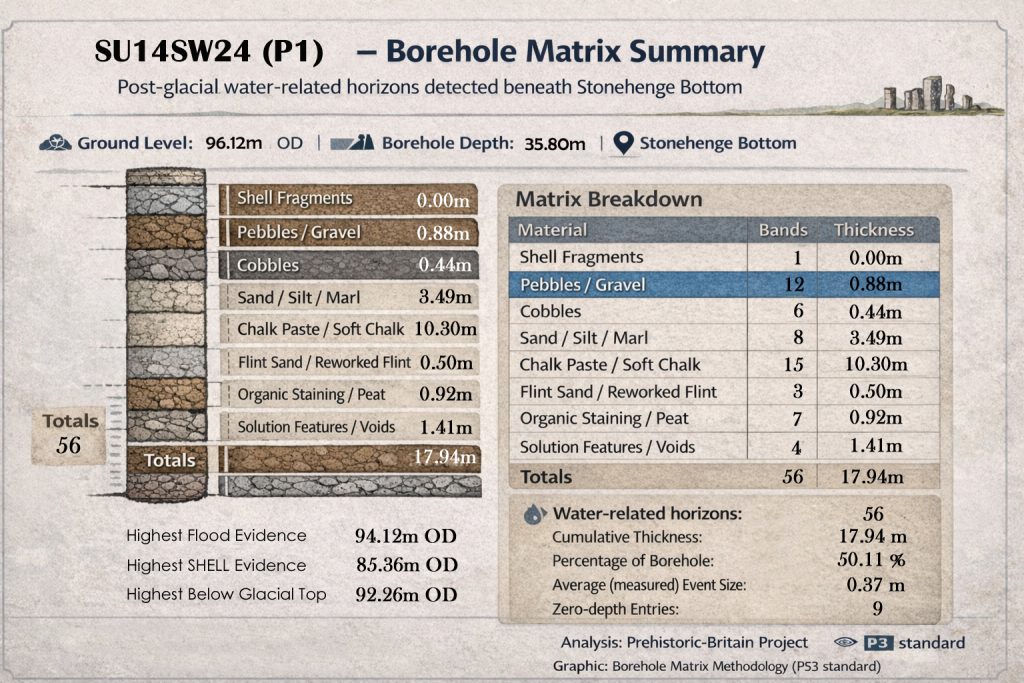
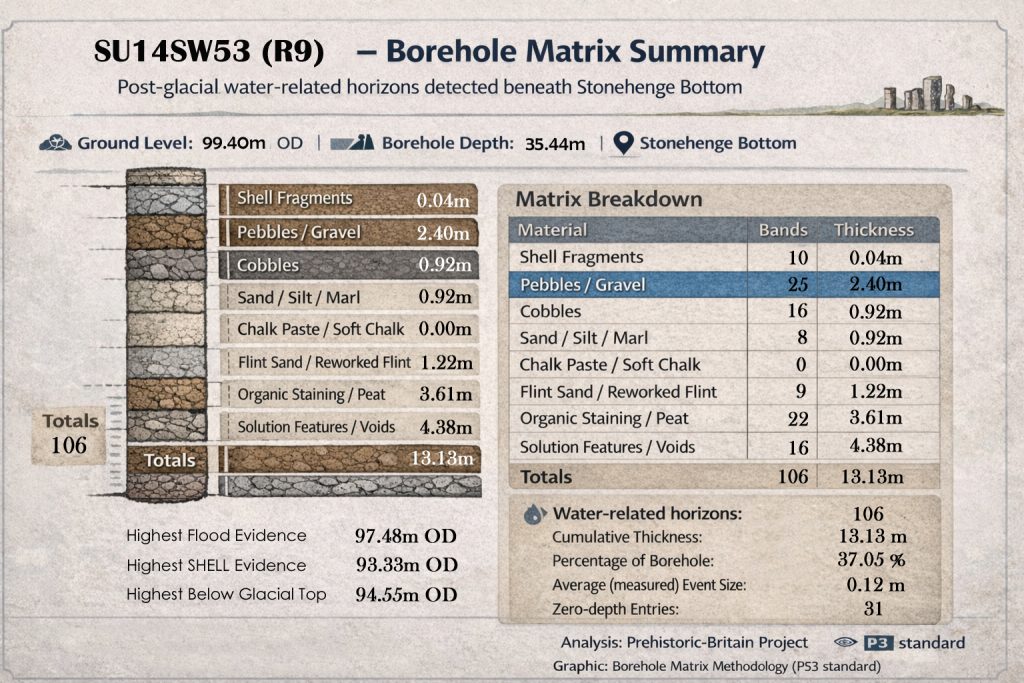
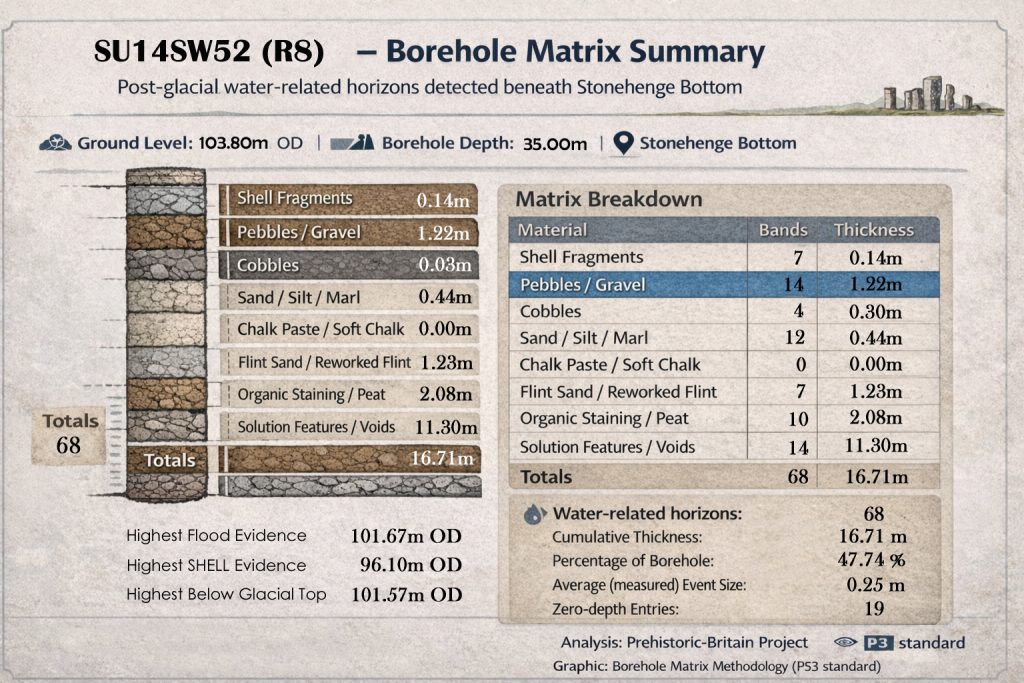
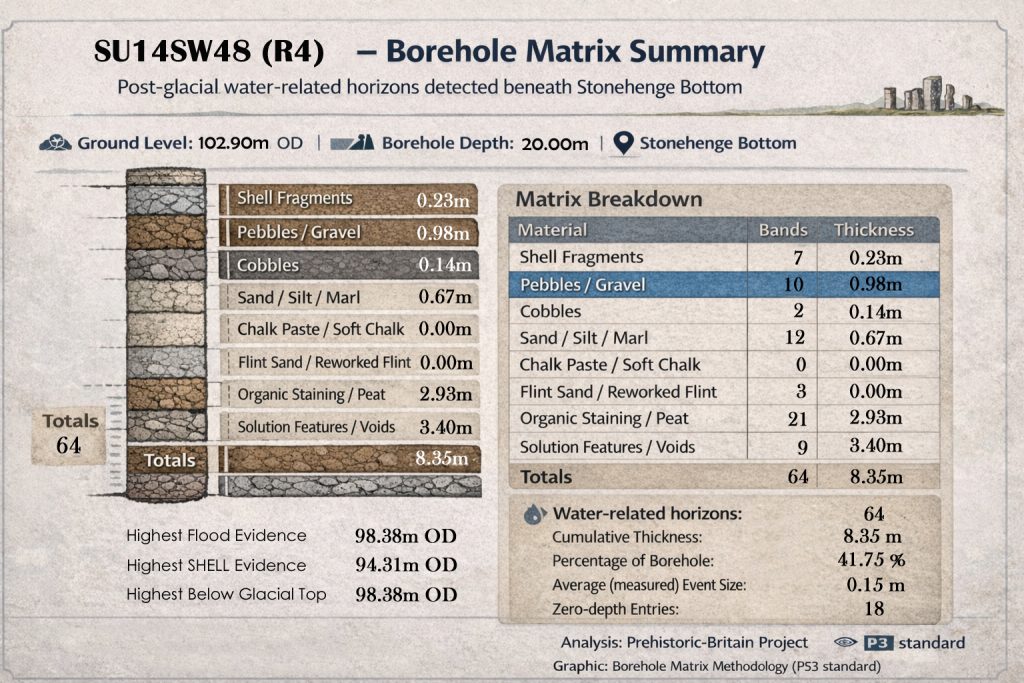
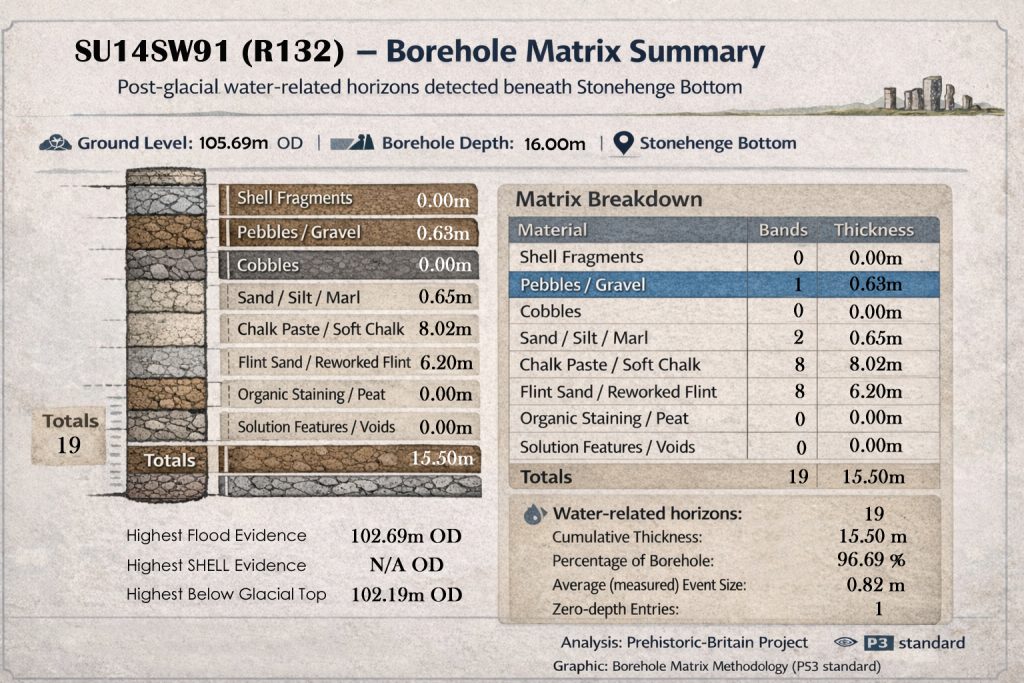
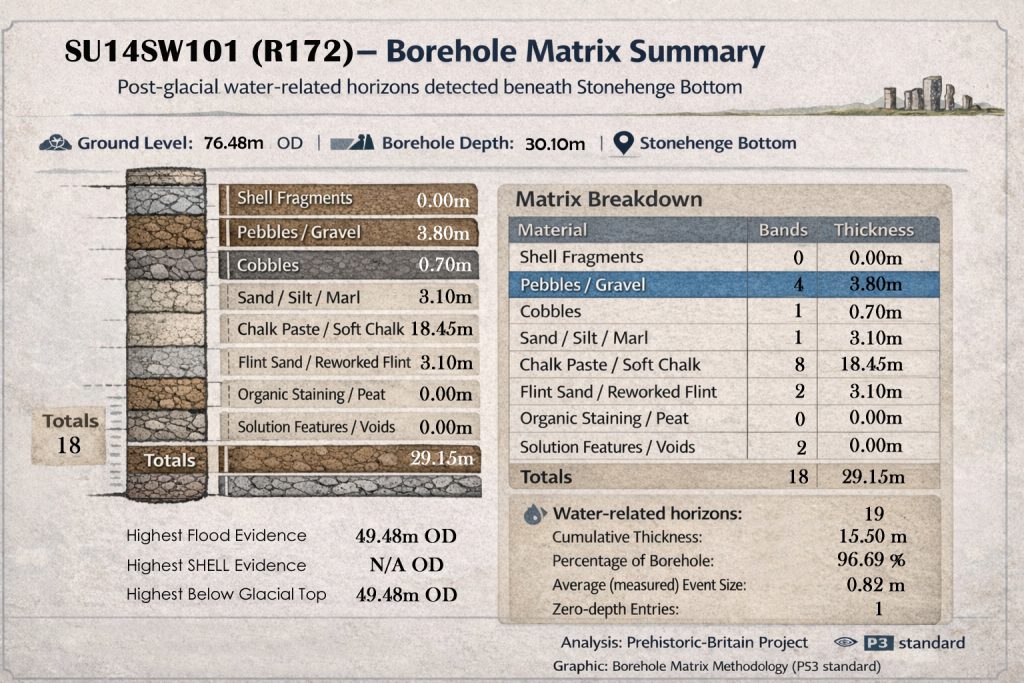
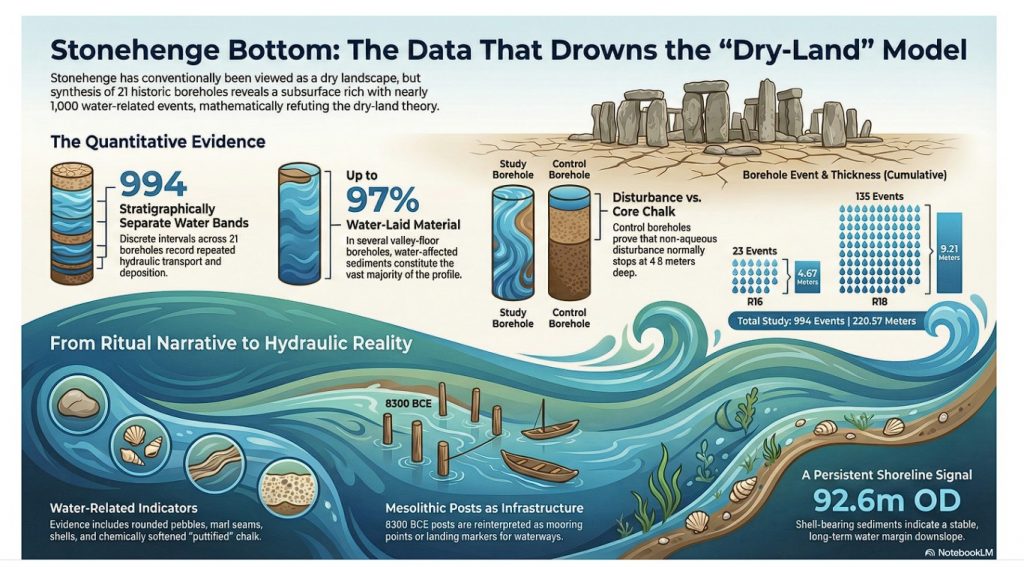
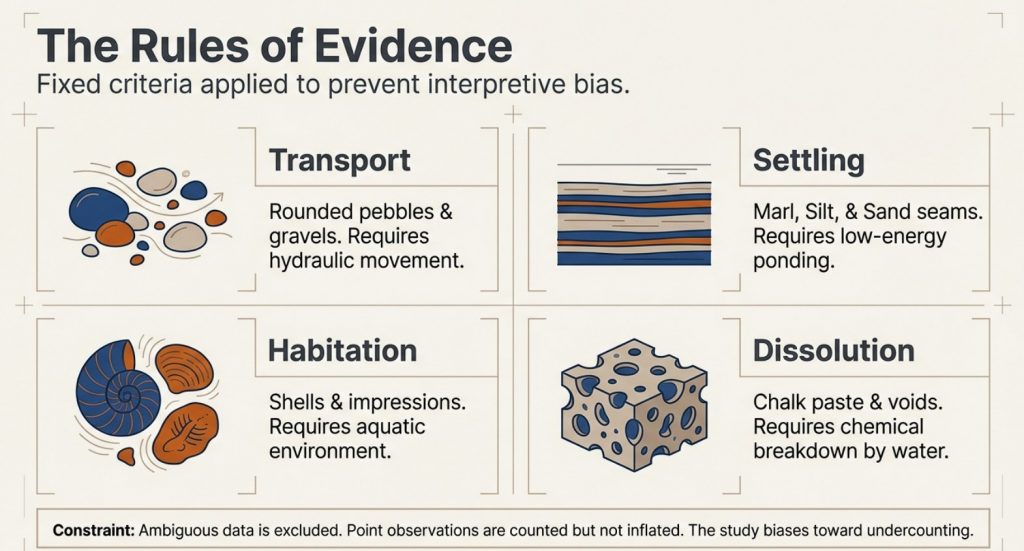
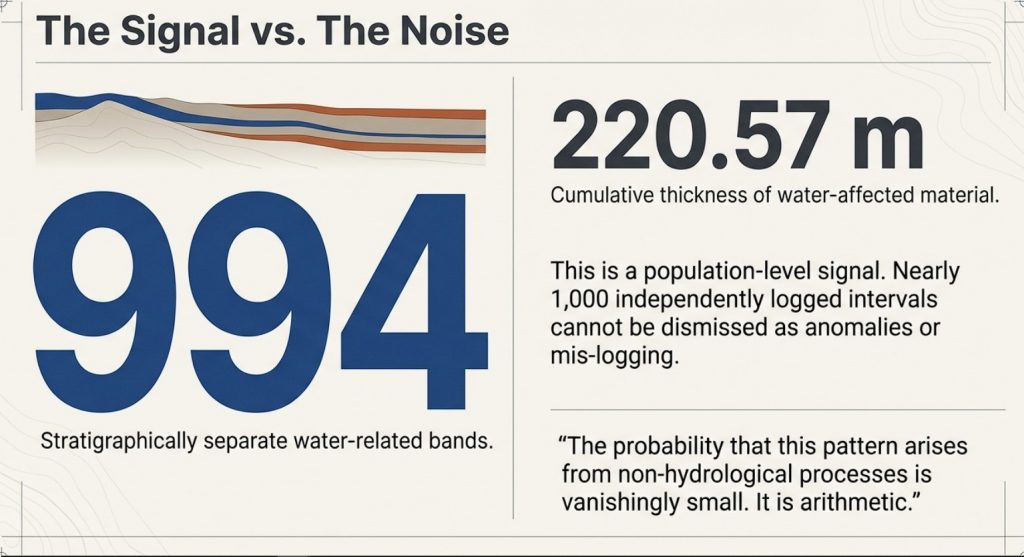
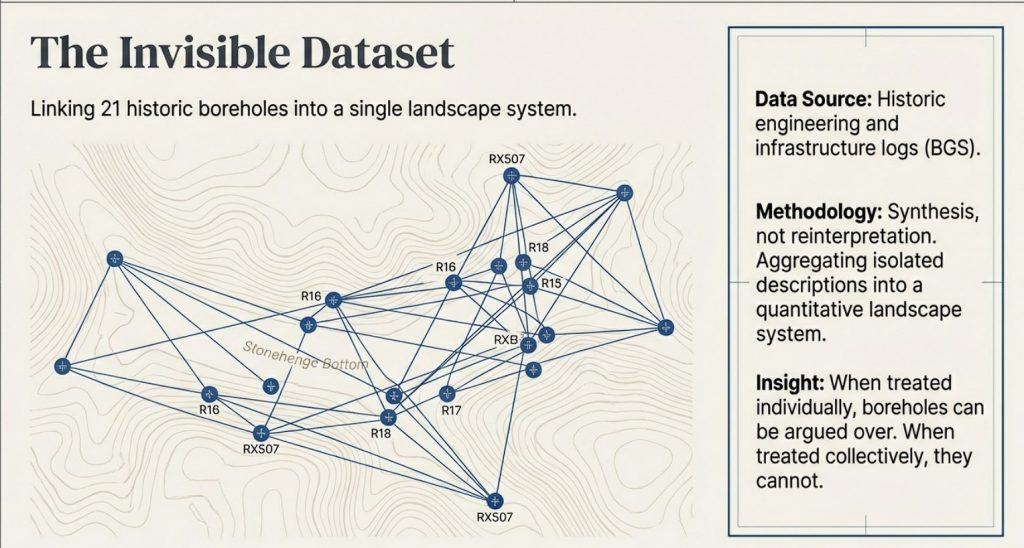
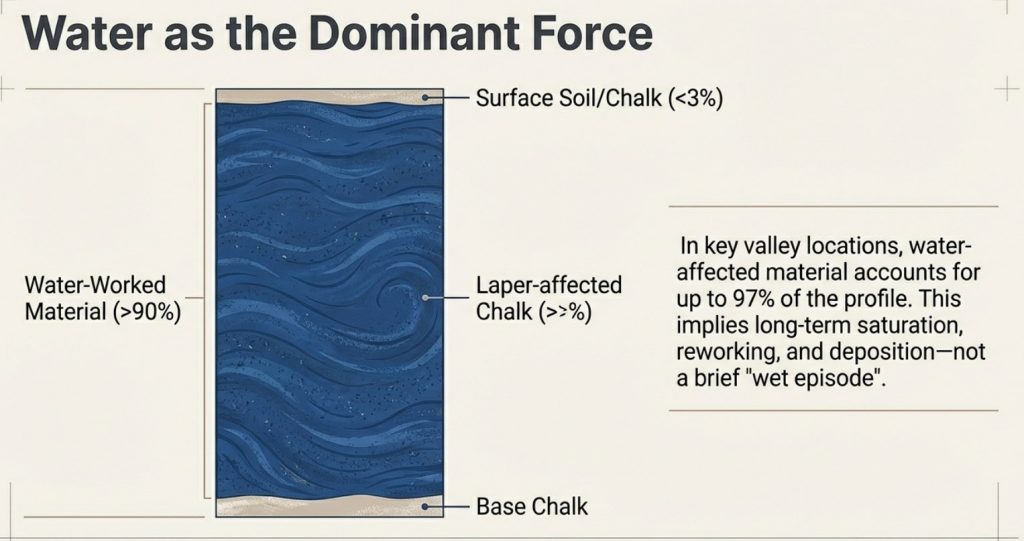
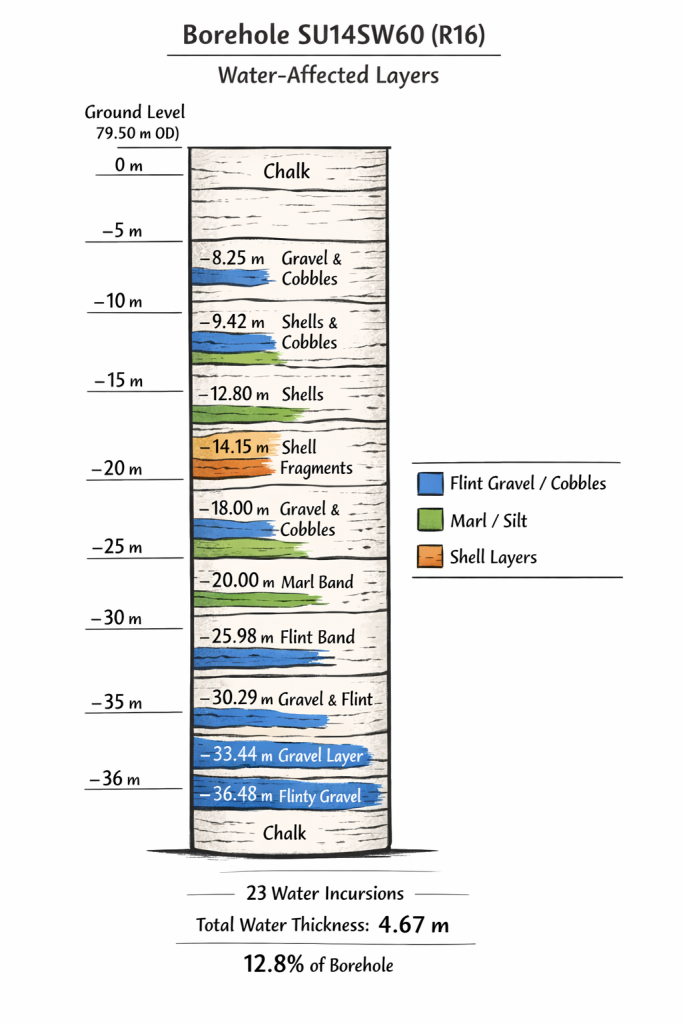
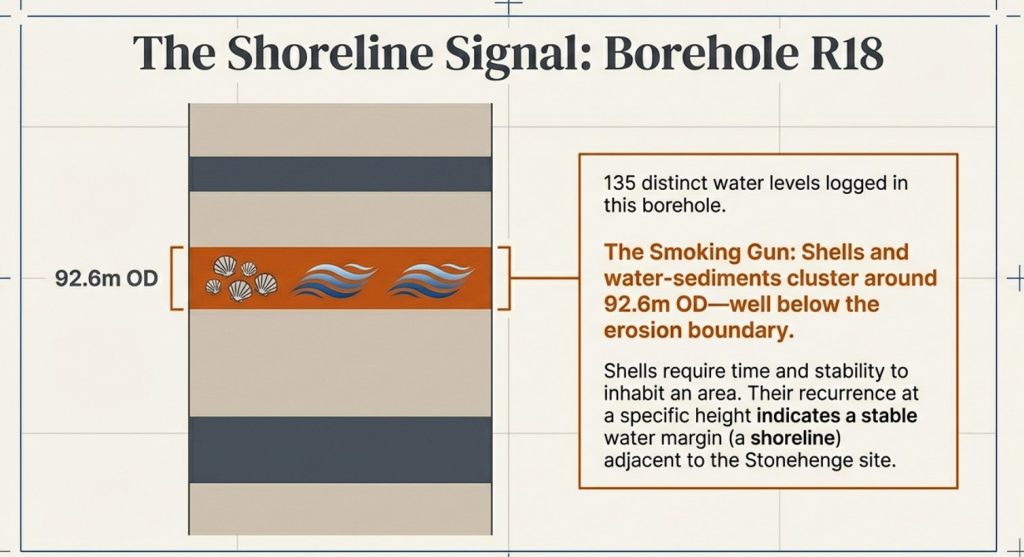
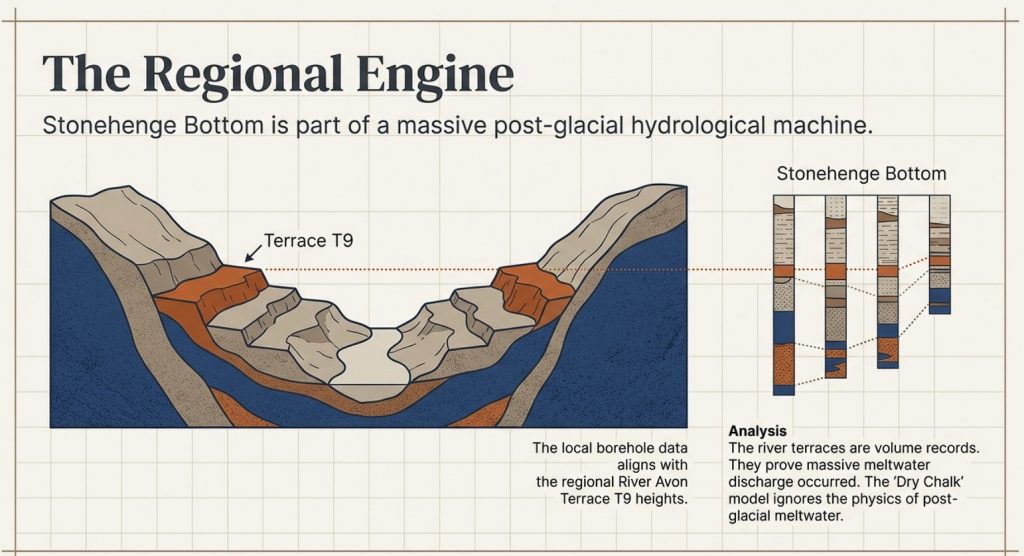
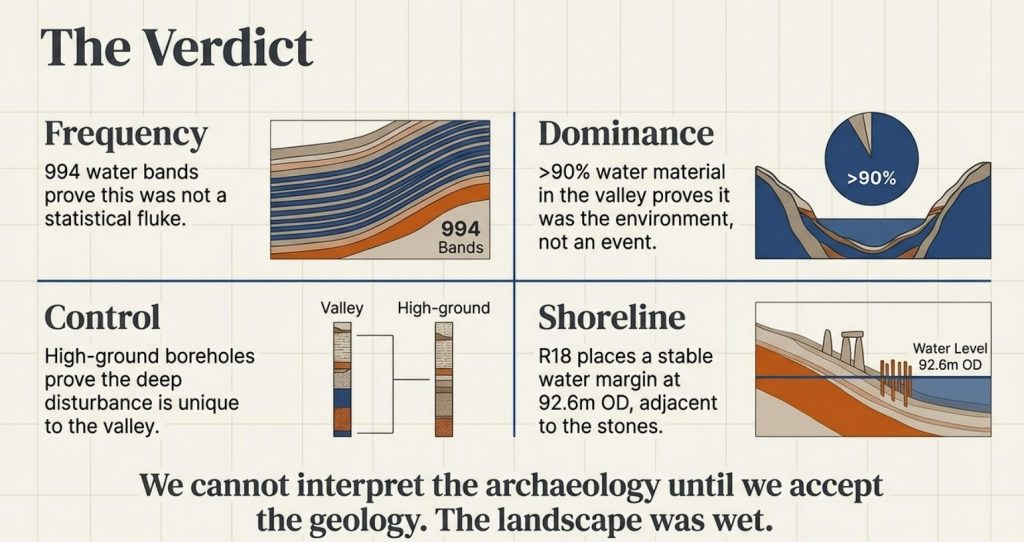
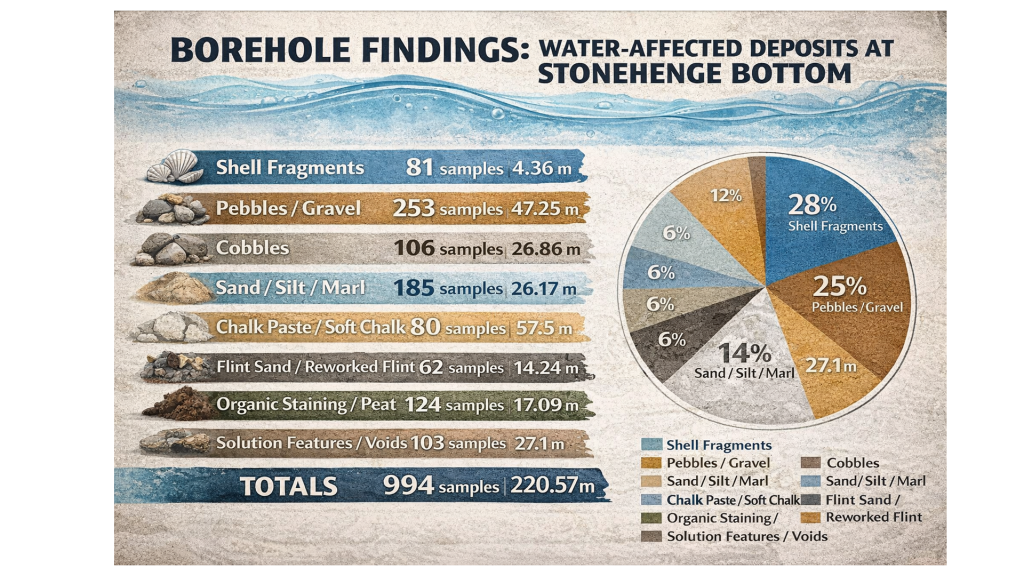
At Stonehenge Bottom, the borehole evidence records repeated water-related material: shells, gravels, sands, silts, marl, organics, peat-like staining, solution features and water-affected chalk. These are not isolated oddities. They occur across multiple boreholes and repeatedly within the same hydrological elevation band.

At Durrington, shell-bearing horizons occur inside deep, complex pit fills associated with calcareous silts, reworked sediments and later material. Again, the correct response is not to dismiss the shells because they complicate the monument’s story. The correct response is to ask what hydrological system placed shell-bearing material at those depths and OD levels.

That is where the connection becomes important.

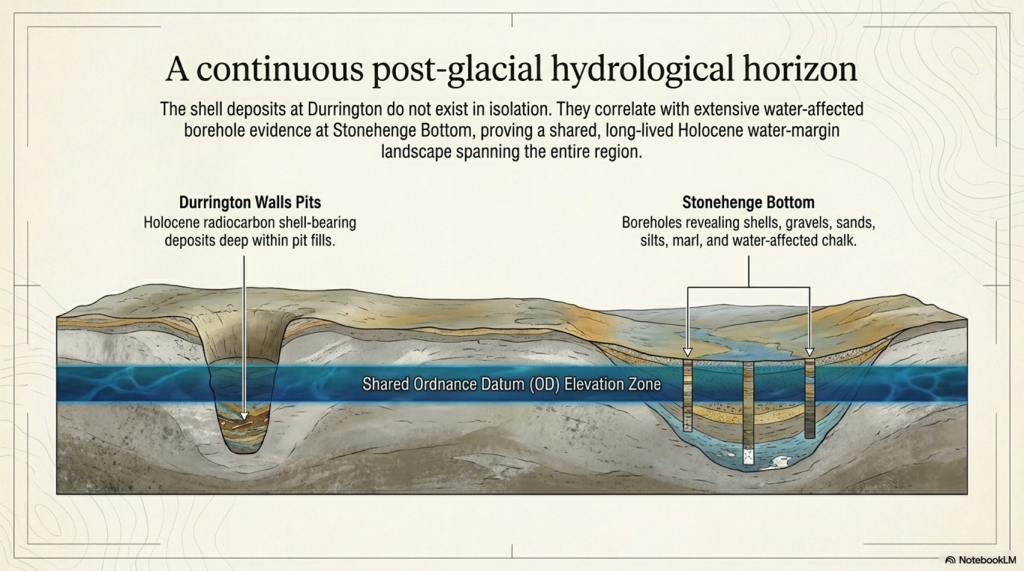
Durrington proves that shell-bearing deposits within the Stonehenge landscape can be part of the Holocene sedimentary record. Stonehenge Bottom shows that similar water-affected material occurs repeatedly across a wider borehole system. Together, they point to a landscape where water, sediment, shells, organics and human activity interacted over long periods.

This does not prove that every feature was flooded at the same time.

It proves that the dry-land assumption is no longer good enough.

If shells at Durrington can be dated, then shells at Stonehenge Bottom should be dated.

If calcareous silts at Durrington can be analysed, then silts and marl at Stonehenge Bottom should be analysed.
(The Durrington Mega-Monument Hoax: What Lies Beneath? - Debunked)
(The Durrington Mega-Monument Hoax: What Lies Beneath? – Debunked)

If Durrington’s deposits require OSL, radiocarbon, sedimentology and environmental testing, then Stonehenge Bottom deserves the same treatment.

The scientific response is obvious:

date the shells
identify the species
test the carbonate source
analyse the sediment
calculate the OD levels
compare the horizons
model the hydrology

Anything less is not science. It is an assumption.

The Durrington evidence, therefore, strengthens the Stonehenge Bottom argument. It shows that shell-bearing, water-affected deposits in this landscape are not archaeological background noise. They may be the record of the landscape itself.

And that is exactly what the “mega-monument” interpretation failed to consider.

The pits were not sitting in an abstract ceremonial diagram.

They were sitting in the same wider post-glacial water landscape that shaped Stonehenge Bottom.
(The Durrington Mega-Monument Hoax: What Lies Beneath? - Debunked)
(The Durrington Mega-Monument Hoax: What Lies Beneath? – Debunked)

10. The 2025 Reassessment: More Science, Same Assumption

The 2025 reassessment is important because it added more evidence.

The new work incorporated additional geophysics, including magnetometry, ground-penetrating radar, electromagnetic ground conductivity, and electrical resistivity tomography. It also added drone survey, boreholes, core analysis, geochemistry, chemostratigraphy, OSL profiling and dating, and sedimentary ancient DNA.

That sounds impressive.

And in one sense, it is. More data is always better than less data.

But more science does not automatically mean a better interpretation.

The problem with the 2025 reassessment is that the additional techniques were still largely used to test and defend the pit-structure interpretation, rather than to properly test the competing hydrological explanation. The paper continued to treat the features as a large prehistoric pit structure surrounding Durrington Walls, even while acknowledging variable features, possible natural origins, unproven anomaly ii, differing depths, complex fills and multiple sediment histories.

That is the central weakness.

The new work improved the description of the pits, but it did not break free from the original assumption.
(The Durrington Mega-Monument Hoax: What Lies Beneath? - Debunked)
(The Durrington Mega-Monument Hoax: What Lies Beneath? – Debunked)

If the features sit on palaeochannels and former water margins, then the correct test is not simply whether they resemble other pits. The correct test is whether their distribution is better explained by hydrology than by monument geometry.

Do the pits follow former river margins?

Do the gaps correspond with dry land outside the water system?

Do the missing sections correspond with former active water?

Do the depths and OD levels match falling water horizons?

Do shell-bearing layers, calcareous silts and reworked sediments align with palaeochannel positions?

Do the dated horizons behave like shoreline deposits rather than construction deposits?

These are the questions that should have been placed at the centre of the reassessment.

Instead, the interpretation still moves back toward monumentality. The features are repeatedly pulled into the language of arcs, alignments, pit structures, boundaries, Durrington Walls and Larkhill. The landscape is still being organised around a ceremonial model rather than a water model.

This is why the 2025 paper does not close the debate.

It actually strengthens the hydrological critique.

The more sediment evidence is added, the less convincing a simple ritual pit-circuit becomes. Boreholes, chemostratigraphy, OSL and sedaDNA are not just tools for confirming monumentality. They are tools for reconstructing the landscape process. They can show reworking, environmental change, sediment movement, palaeoecology, water-derived material and long-term infilling.

That is exactly why the hydrological model must be tested.

The 2025 reassessment shows that the pits are complex. It shows that they contain layered environmental histories. It shows that no recorded pit has been totally excavated. It shows that individual cores cannot provide full geometry. It shows that remote sensing alone cannot completely define these features.

Those admissions matter.

They mean the interpretation should become more cautious, not more confident.

If the features have not been fully excavated, if the lower sequences remain complex, if some pits are unbottomed, if natural origins remain possible, and if the spatial distribution has not been tested against former water margins, then the “mega-monument” claim remains unproven.

The 2025 reassessment added more science.

But it did not ask the most important question:

Are these really the remains of a planned ceremonial pit structure, or are they the archaeological trace of a changing Avon river landscape?

Until that test is done, the extra science has not solved the problem.

It has simply given us more evidence that the original interpretation may have been based on the wrong assumption.
(The Durrington Mega-Monument Hoax: What Lies Beneath? - Debunked)
(The Durrington Mega-Monument Hoax: What Lies Beneath? – Debunked)

11. The Bulford Repeat: Same Mistake, Smaller Site

The Durrington problem is not an isolated case.

The same interpretive failure has now reappeared at Bulford.

At Durrington, large pits, hollows and uncertain features were drawn into a vast “mega-monument” story. The pattern was pushed toward boundary, ceremony, cosmology and large-scale Neolithic planning before the hydrological landscape was properly tested.

At Bulford, the scale is smaller, but the method is familiar.

Two postholes have been promoted as evidence for solar alignment, with suggestions of an earlier Stonehenge-style monument. Once again, the story moves quickly from holes in the ground to sunrise, ritual and Stonehenge.

The problem is not the archaeology.

The problem is the interpretation.

Real features exist at Bulford. Real features exist at Durrington. But real features do not automatically prove the story being built around them.

At Durrington, pits became cosmology.

At Bulford, two postholes became an older Stonehenge.

In both cases, the same method appears:

select a limited number of features
draw a line or circuit
notice a sunrise or horizon relationship
invoke ritual or ceremonial meaning
connect it to Stonehenge
treat the physical landscape as background scenery

That is backwards.

The correct order should be:

landscape first
hydrology second
dating third
interpretation last

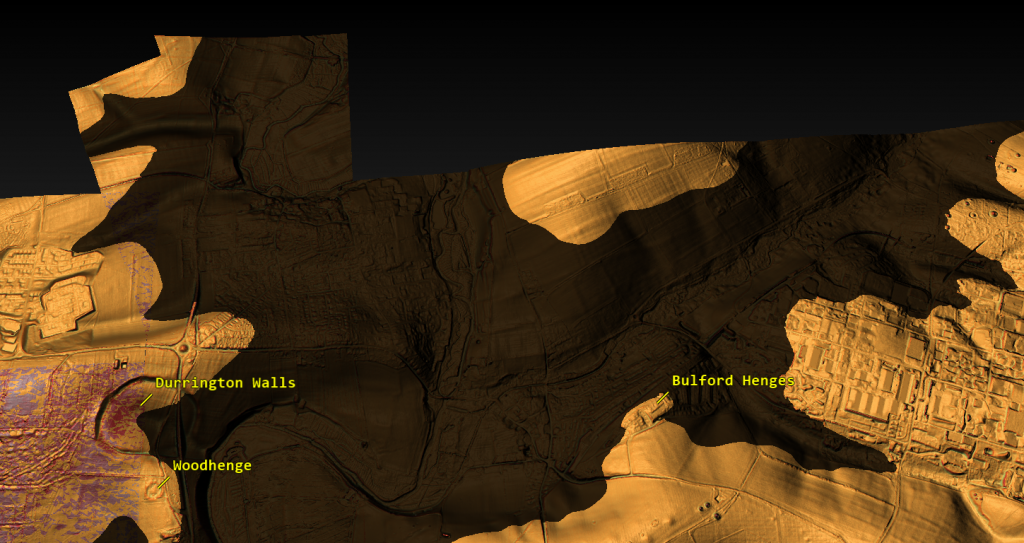
Before Bulford is turned into a solar monument, the river-facing landscape must be tested. Its relationship to the Nine Mile River, the Avon, local topography, former water levels, routeways, palaeochannels and sediment history must come first.
(The Durrington Mega-Monument Hoax: What Lies Beneath? - Debunked)
(The Durrington Mega-Monument Hoax: What Lies Beneath? – Debunked)

Before Durrington is turned into a cosmological pit circle, the same test must be applied there. Do the pits form a monument, or do they fit former palaeochannels and shoreline zones? Do the gaps prove missing ceremony, or do they mark areas of dry land and former active water?

That is why the Bulford case matters.

It shows that the same mistake is still being made.

The Stonehenge landscape is being read from the sky down, when it should be read from the ground up.

This is not how science should work. Two points always make a line. Some lines will point at the sun. A broken arc can always be turned into a symbolic circle if the missing parts are explained away. But that does not prove prehistoric intention.

It proves only that modern interpreters are very good at drawing patterns.

The Bulford Hoax article deals with that problem directly. It shows how quickly a limited set of features can be turned into a headline claim before the full landscape evidence has been published and tested.

Durrington is the larger version of the same failure.

At both sites, the archaeology should have been tested against water, terrain, sediment, dating and palaeochannels before it was dressed up as monumentality.

Until that happens, the lesson is simple:

Stop turning holes into cosmology before the landscape has been understood.
(The Durrington Mega-Monument Hoax: What Lies Beneath? - Debunked)
(The Durrington Mega-Monument Hoax: What Lies Beneath? – Debunked)

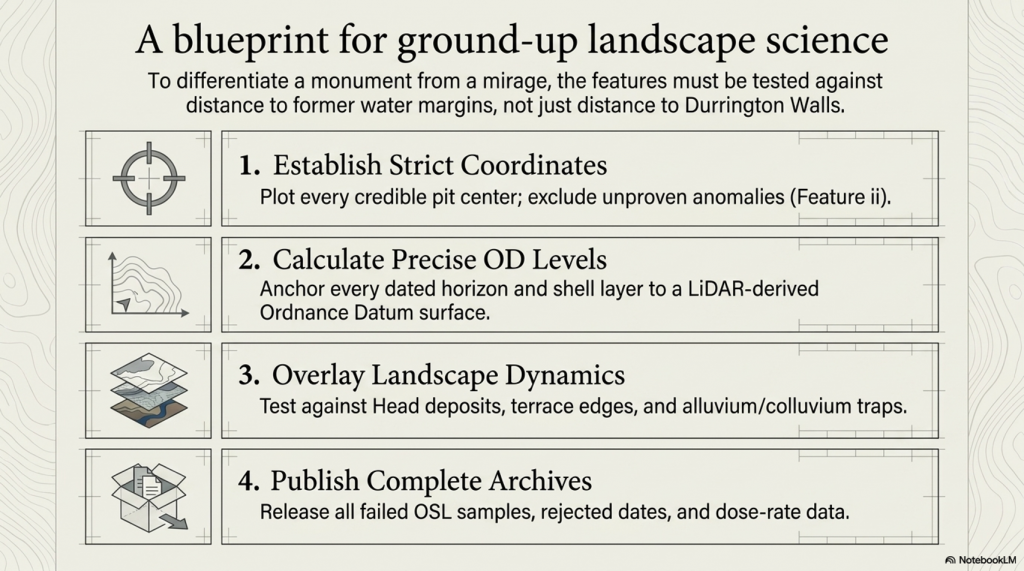
12. What Proper Science Would Test

The Durrington debate does not need more storytelling.

It needs a proper test.

If the pits are indeed a planned Late Neolithic monument, then that interpretation should withstand comparison with the physical landscape. If the hydrological model is wrong, then the evidence should show that too. But that requires testing the two models against each other, not simply assuming the monument model from the start.

The first requirement is simple: plot every credible pit centre accurately.

Not approximate dots.

Not symbolic positions.

Not selected examples.

Every credible feature needs a fixed coordinate, a confidence rating and a source trail. Questionable features, especially ii, should be excluded from the main model unless they are independently proved.

The second requirement is elevation.

Each pit needs a LiDAR-derived surface OD. Each dated or sampled horizon then needs its own calculated OD, based on depth below ground. The same applies to bases, basal chalk contacts, shell-bearing layers, bone horizons, OSL samples, calcareous silts and lower sediment breaks.

Without OD levels, there is no real hydrological test.

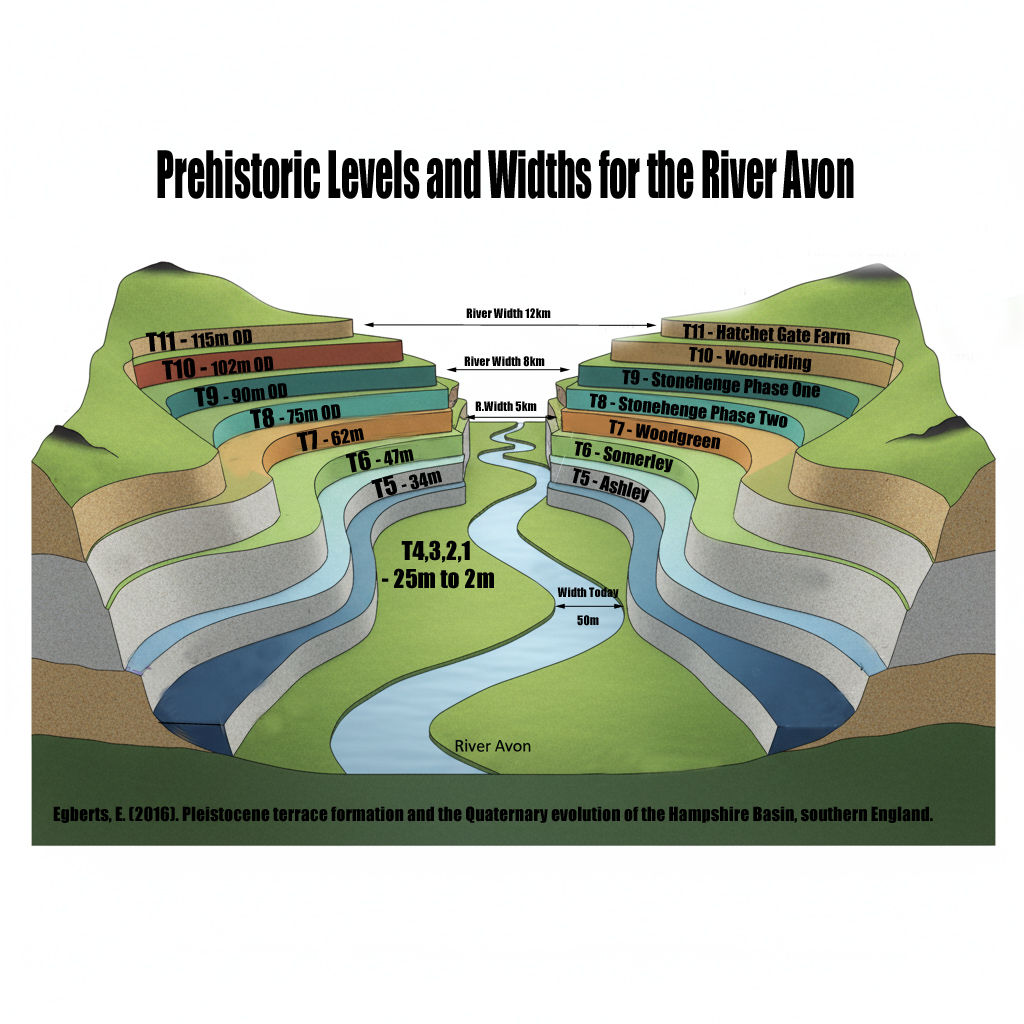
The third requirement is a landscape overlay.

The pit map must be tested against:

palaeochannels
former Avon water levels
former shoreline margins
Head deposits
dry valleys
flow accumulation
slope breaks
terrace edges
springline potential
alluvium and colluvium
sediment traps and solution features

Only then can the interpretation be tested properly.
(The Durrington Mega-Monument Hoax: What Lies Beneath? - Debunked)
(The Durrington Mega-Monument Hoax: What Lies Beneath? – Debunked)

The key comparison is not whether the pits can be drawn around Durrington Walls. We already know they can be made to look like arcs. The real question is whether their distribution is better predicted by distance from Durrington Walls or by distance from former water margins.

That is the test.

If the pits cluster more strongly by distance to Durrington Walls, then the monument model gains strength.

If the pits cluster more strongly by palaeochannel edges, shoreline zones, OD bands and former water levels, then the hydrological model gains strength.

At the moment, the hydrological explanation has not been properly falsified.

That is the failure.

The same applies to the dating evidence. All dating data should be published or archived for scrutiny: radiocarbon lab numbers, material type, sample depths, calibration curves, rejected dates, OSL age estimates, dose-rate data, light-exposed intervals, equivalent-dose values, failed samples and reasons for exclusion.

A scientific chronology does not hide awkward results.

It explains them.

This is especially important because inconvenient dates are not noise if the real question is hydrology. An old shell date, a reworked sediment signal, a light-exposed lower unit, or a mixed fill may be awkward for a simple monument story, but it may be exactly the evidence needed to reconstruct a former river landscape.

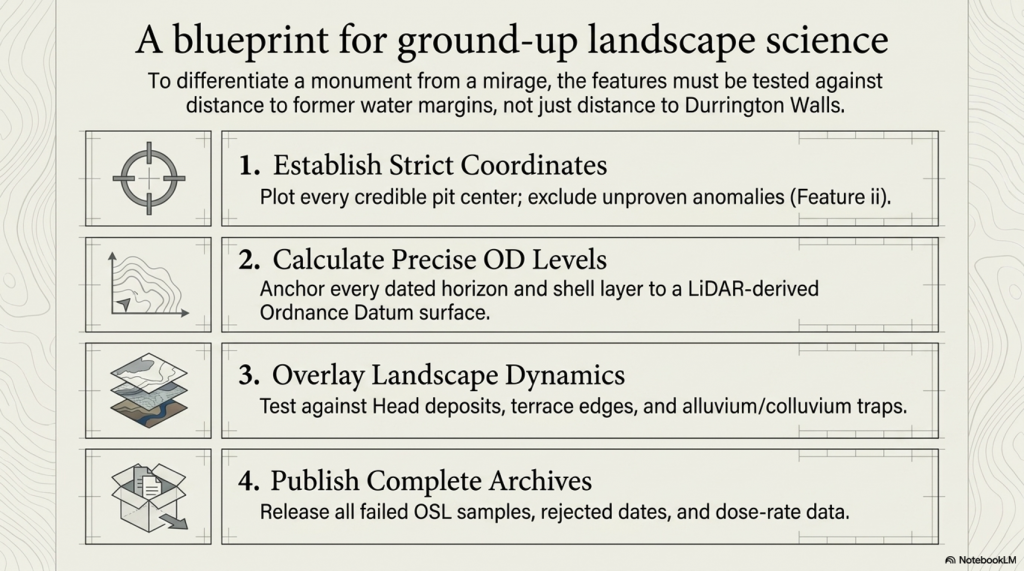
The proper test is therefore straightforward.

Plot the pits.

Calculate the OD levels.

Map the palaeochannels.

Overlay the former water levels.

Publish the full dating archive.

Remove unproven ii from the core model.

Then compare two explanations:

Do the pits form a planned monument around Durrington Walls?

Or do they fit a former Avon shoreline and palaeochannel system?

Until that test is done, the “mega-monument” is not a proven archaeological conclusion.

It is an interpretation awaiting landscape review.
(The Durrington Mega-Monument Hoax: What Lies Beneath? - Debunked)
(The Durrington Mega-Monument Hoax: What Lies Beneath? – Debunked)

13. Conclusion: What Really Lies Beneath?

The Durrington “mega-monument” has not been proved by the pits.

It is an interpretation placed over a broken pattern.

Large pits exist. That is not in dispute. Some are deep. Some are impressive. Some contain important archaeological and environmental evidence. But none of that automatically proves a single planned Late Neolithic ceremonial circuit.

The monument interpretation depends on treating a scattered, uneven and incomplete distribution of features as if it were a designed whole. It takes arcs and turns them into a circle. It takes gaps and explains them away. It takes complex fills and pulls them back into a single story. It treats water-affected sediment as background rather than evidence.

That is the failure.

Once the same features are plotted against LiDAR, palaeochannels, former water margins and dated water-derived deposits, the pattern looks very different.

It no longer looks like a sacred circle.

It looks like a river landscape.
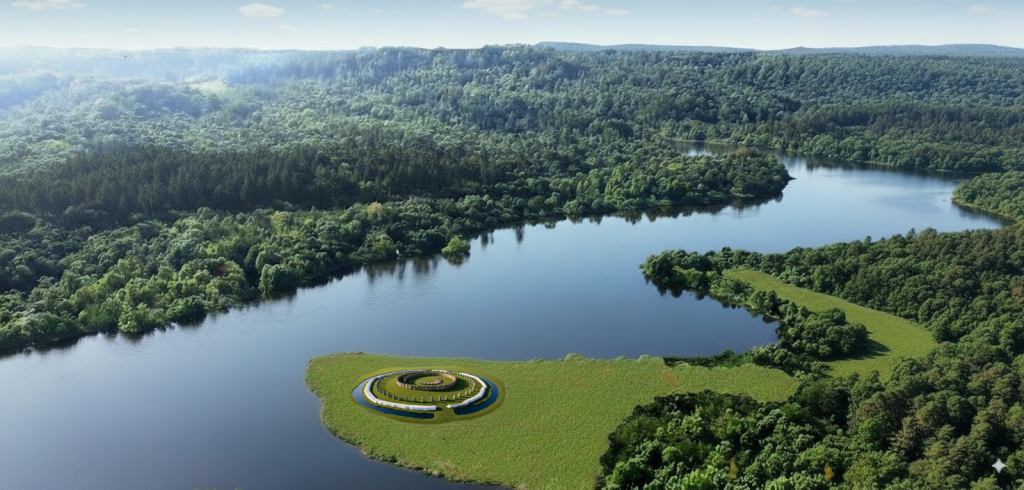
(The Durrington Mega-Monument Hoax: What Lies Beneath? - Debunked)
(The Durrington Mega-Monument Hoax: What Lies Beneath? – Debunked)

The credible pits sit where a changing water-margin landscape would predict them. The gaps occur where a hydrological model would expect gaps: dry ground outside the former water system, or active water zones where pits would not be dug, would not survive, or would be hidden beneath later deposits.

The dating evidence does not rescue the monument model. It exposes its weakness. Shell, bone, charcoal, OSL signals and sediment layers do not form a clean single construction sequence. They point to a longer, messier and more realistic landscape history — one involving water, reworking, sediment movement, later activity and repeated environmental change.

That is what the original interpretation failed to face.

The Stonehenge landscape was not an abstract ceremonial diagram waiting to be decoded from the sky. It was a post-glacial landscape of rivers, springs, palaeochannels, shorelines, gravels, silts, shells, buried soils and changing water levels.

Durrington was part of that landscape.

Stonehenge Bottom was part of that landscape.

Bulford was part of that landscape.

And until archaeological tests of that landscape are conducted, every new “ritual monument”, every sunrise alignment, and every sacred circle should be treated with extreme caution.

The real question is not whether prehistoric people had beliefs, rituals or ceremonies. Of course they did.

The question is whether modern archaeology is mistaking the physical remains of a hydrological landscape for ceremonial architecture.

At Durrington, that is exactly what appears to have happened.

The “mega-monument” may not be a monument at all.

It may be the archaeological shadow of a former Avon river system — a broken pattern of pits, hollows, sediment traps and modified features surviving along palaeochannels and retreating shorelines.

What really lies beneath Stonehenge is not just ritual.

It is water.

And once water is returned to the landscape, the Durrington mystery stops looking mysterious.

It starts looking obvious.
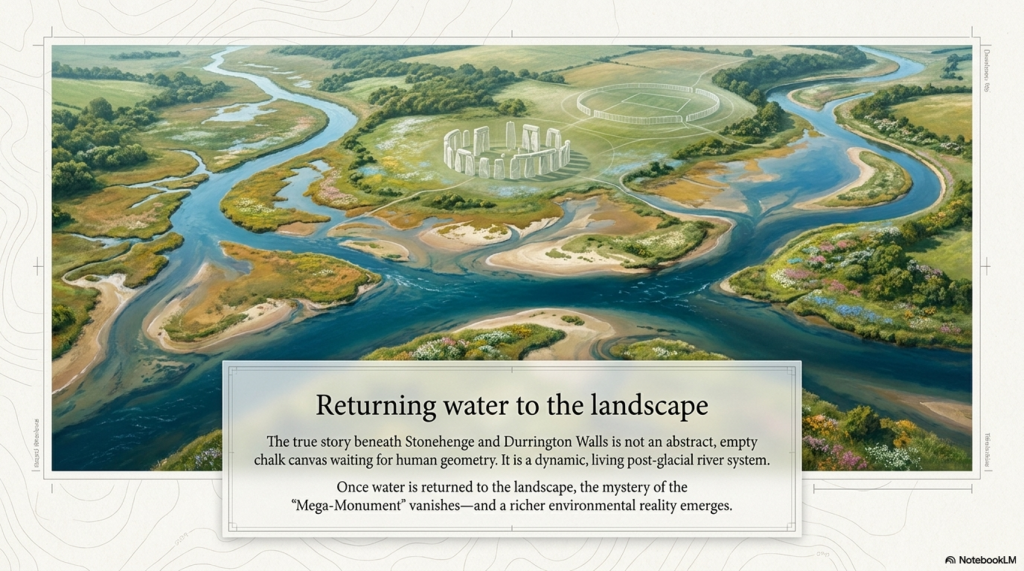
(The Durrington Mega-Monument Hoax: What Lies Beneath? - Debunked)
(The Durrington Mega-Monument Hoax: What Lies Beneath? – Debunked)

Old Article for Reference

How Durrington Walls, Larkhill and the “Mega-Monument” Forgot the Water (2020)

The fundamental problem with the modern interpretation of Stonehenge and its wider landscape is simple.

Archaeologists still do not understand the basic infrastructure of prehistoric society.

They look at pits, ditches, earthworks, dry valleys and monument alignments, but too often interpret them as ritual, ceremonial or symbolic before asking the more important question:

What did the landscape actually look like when these features were built?

Imagine a future historian trying to understand our society without knowing what roads were. They might find motorways, lanes, junctions, roundabouts, bridges and service roads confusing. Some roads are straight. Some curve. Some are wide. Some are narrow. Some stop suddenly. Some have been widened, reused, bypassed or abandoned. Without understanding transport, that historian would never understand the structure of our world.

The same mistake is being made with prehistoric Britain.

The infrastructure was not roads.

It was water.

Rivers, palaeochannels, marshes, flooded valleys, landing places, shoreline routes and dykes were the transport system of early Britain. If that is not understood, then the archaeology becomes distorted before interpretation even begins.

This is precisely the problem with Channel 5’s documentary, The Stonehenge Enigma: What Lies Beneath? The title was cheekily close to my own Stonehenge work, but the interpretation repeated the same old archaeological problem: it treated a changing post-glacial landscape as if it were a mostly dry modern chalkland.

Once that assumption is made, the rest of the story goes wrong.

The Documentary Claim
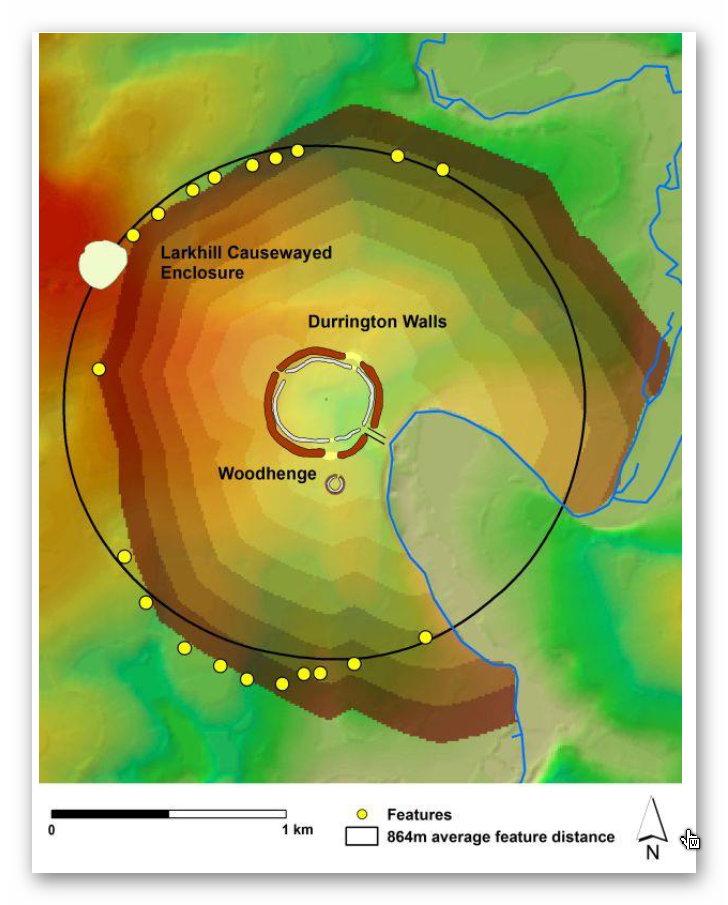
The Stonehenge Enigma: What Lies Beneath? - Debunked
Suggested Pit structure -The Stonehenge Enigma: What Lies Beneath? – Debunked

The programme promoted the idea that new research had identified a huge arc or ring of massive pits beneath fields near Durrington Walls. These were said to form part of a two-kilometre-wide structure, with the great Neolithic settlement of Durrington Walls at its centre.

The popular version was dramatic.

Durrington Walls became a “party city”.

The pits became a monumental boundary.

The wider landscape became part of a sacred ceremonial system.

The implication was that archaeologists had found another giant prehistoric structure in the Stonehenge landscape.

The programme synopsis presented this as another remarkable addition to the Stonehenge mystery. The pits, it suggested, formed part of a huge ring around Durrington Walls, perhaps enclosing or defining a special landscape used during seasonal gatherings.

The academic paper behind the claim, A Massive, Late Neolithic Pit Structure associated with Durrington Walls, argued that the surviving pits might represent an elaboration of the monument complex at a massive and unexpected scale. It also suggested that the pits may have been laid out with respect to the recently discovered Larkhill causewayed enclosure, and that some evidence might even show maintenance of the structure into the Middle Bronze Age.

That sounds impressive.

But it only works if the environmental assumptions are correct.

They are not.

The Landscape Is the Missing Evidence

The interpretation assumes that these pits, hollows, and alignments primarily belong to a monumental or ceremonial system.

But if the landscape were water-active, the same evidence would look very different.

Dry valleys were not always dry.

Palaeochannels were not irrelevant background geology.

Ditches were not automatically symbolic.

Pits were not automatically ritual.

Linear earthworks were not automatically boundaries.

And river-facing monuments were not necessarily ceremonial theatres.

They may have been part of a practical water-based landscape of access, movement, drainage, supply, landing, extraction and trade.

That is the missing context in the Durrington interpretation.

The modern Stonehenge landscape is relatively dry. The prehistoric landscape was not. During the Mesolithic and Neolithic, rivers and groundwater systems were operating under very different post-glacial conditions. Water tables were higher. Valleys were wetter. Springs and seasonal channels were more active. Palaeochannels continued to hold environmental significance long after their formation.

If archaeologists ignore this, they will continue to turn working landscapes into sacred fantasies.

Larkhill: The Supposed Boundary That Follows Water

The Larkhill causewayed enclosure is crucial because it was used in the argument for the Durrington pit structure.

But when we examine the site with LiDAR, the landscape tells a different story.

The supposed northern section of the Durrington pit-circle does not behave like part of a neat circular boundary. It sits within and follows a palaeochannel or dry valley system. These features form a line connected with the ancient water landscape rather than a convincing monumental ring.

That matters.

If the pits are aligned within a palaeochannel, then they are not simply arbitrary points on a ceremonial circle. They may be following the physical logic of an earlier watercourse.

The Larkhill causewayed enclosure itself sits in relation to this water system. It is not isolated on empty chalkland. It is positioned where a water-linked route would have mattered.

This supports a very different interpretation.

Causewayed enclosures may not have been mysterious ceremonial camps. They may have functioned as trading and gathering sites positioned on water-connected routes. Their interrupted ditches make far more sense if we understand them as moated or water-fed enclosures rather than simply symbolic boundaries.

Boats could approach.

Goods could be exchanged.

People could gather.

The enclosure could be supplied, defended, accessed and identified from the water.

That is a practical explanation rooted in landscape use.

The Dyke Problem

The Durrington and Larkhill interpretation also ignores one of the most important but least understood prehistoric feature-types in Britain:

the dyke.

Linear earthworks are everywhere in the British landscape. There are more than 1,500 scheduled sections of dykes and linear earthworks across Britain and Ireland. My own LiDAR research has identified thousands more that remain unclassified or misunderstood. If correct, Britain may contain more than 2,000 miles of ancient dyke systems — a greater total length than the known Roman road network in Britain.

Yet archaeology still struggles to explain them.

Some are called defensive.

Some are called territorial.

Some are called boundaries.

Some are called lynchets.

Some are simply ignored.

But the word dyke itself is water-related. A dyke is a water-management feature. In many cases, that older meaning may be the clue archaeologists have missed.

At Larkhill, the linear earthwork associated with the palaeochannel makes far more sense as part of a water-management or water-supply system than as a symbolic boundary.

At Durrington Walls, the same problem appears again.

The Durrington “Lynchet” That Runs the Wrong Way

Within the Durrington Walls landscape, there is a linear earthwork that once connected the River Avon to the henge’s ditch or moat.

In the report, this feature was described as a modern lynchet.

That interpretation is weak.
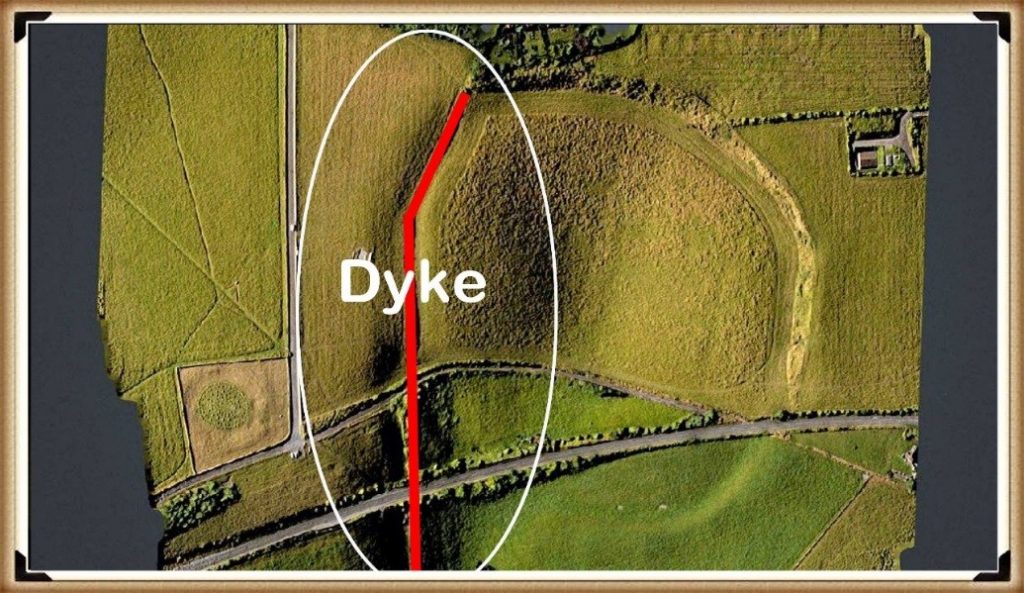
Durrington Walls 'DYKE' - see LiDAR Video for more details - The Stonehenge Enigma: What Lies Beneath? - Debunked
Durrington Walls ‘DYKE’ – see LiDAR Video for more details – The Stonehenge Enigma: What Lies Beneath? – Debunked

A lynchet is normally an agricultural feature formed by ploughing across a slope. Lynchets generally run along the contour of a hillside.

This feature does the opposite.

It runs down the slope towards the River Avon, some 30 metres below.

That is not how a typical lynchet behaves.

It is exactly how a water-linked dyke, channel or supply feature would behave.

LiDAR shows this clearly. The feature is not simply a random agricultural scar. It connects the monument to the river system. If Durrington Walls had a water-fed ditch or moat, it would be logical.

Again, the problem is not a lack of evidence.

The problem is the interpretive framework.

If archaeologists expect ritual, they see ritual.

If they expect agriculture, they see lynchets.

If they begin with hydrology, the landscape suddenly makes more sense.

Removing the Northern Section

Once the northern “pit-circle” elements are understood as features associated with a palaeochannel and possible dyke system linked to Larkhill, the supposed two-kilometre circle begins to weaken.

The “monument” is no longer a clean ring.

It becomes a mixed landscape of natural hollows, palaeochannels, pits, reused features, dykes and water-related deposits.

That does not make the archaeology unimportant.

It makes it more interesting.

But it is no longer the simple story sold to the public: a giant sacred boundary surrounding Durrington Walls.

The remaining southern features then need to be assessed on their own terms. When examined against LiDAR, topography and reconstructed Mesolithic/Neolithic water levels, many of them appear to relate more logically to the raised shoreline and hydrological history of the River Avon than to a single monumental circuit.

Some of these features sit at levels that would have been strongly affected by earlier water regimes.

That brings us to the dating evidence.

The C14 Dates Do Not Support a Simple Monument

The radiocarbon dates associated with these features are not neat.

They range across a long period.
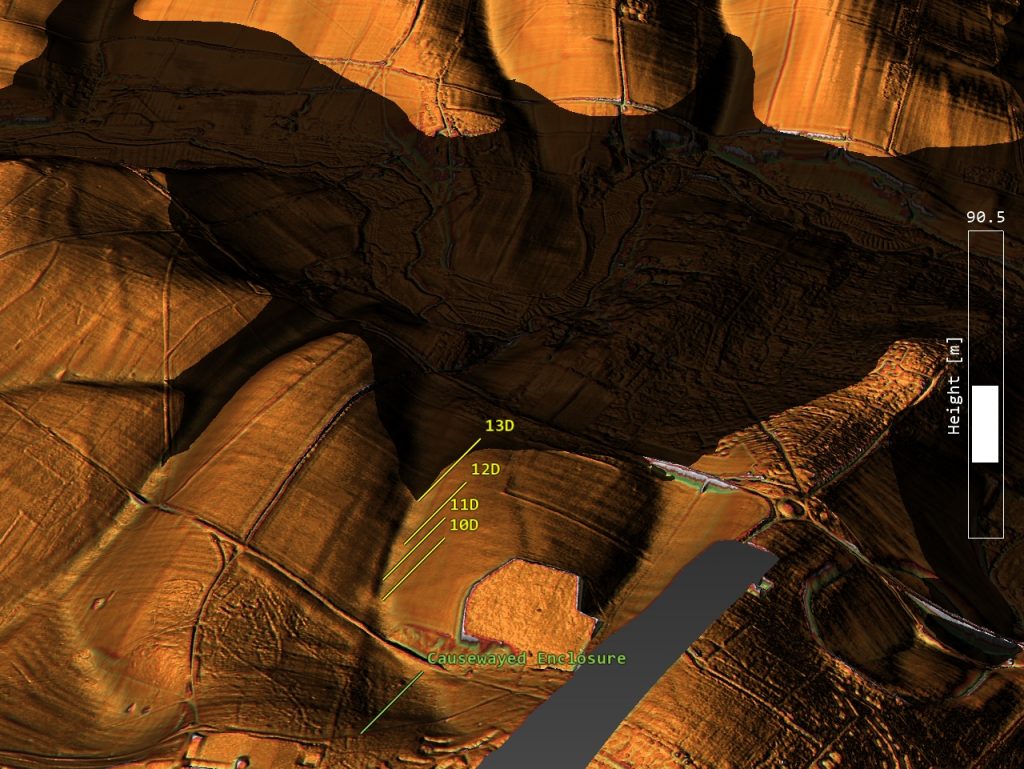
Larkhill Causewayed Camp and its paleochannel with pits - The Stonehenge Enigma: What Lies Beneath? - Debunked
Larkhill Causewayed Camp and its paleochannel with pits – The Stonehenge Enigma: What Lies Beneath? – Debunked

Some of the most important dates come from shell and bone material recovered from the Durrington features. The shell samples are especially important because they produced Holocene dates rather than meaningless ancient fossil ages.

Feature 7A produced a shell date around 6080–5990 cal BC.

Feature 8A produced another shell date around 4710–4550 cal BC.

A further shell date from feature 8A produced a result around 3930–3690 cal BC.

Feature 5A produced later material, with dates reaching into the Bronze Age.

That is not a single construction event.

That is a long-lived, water-affected landscape sequence.
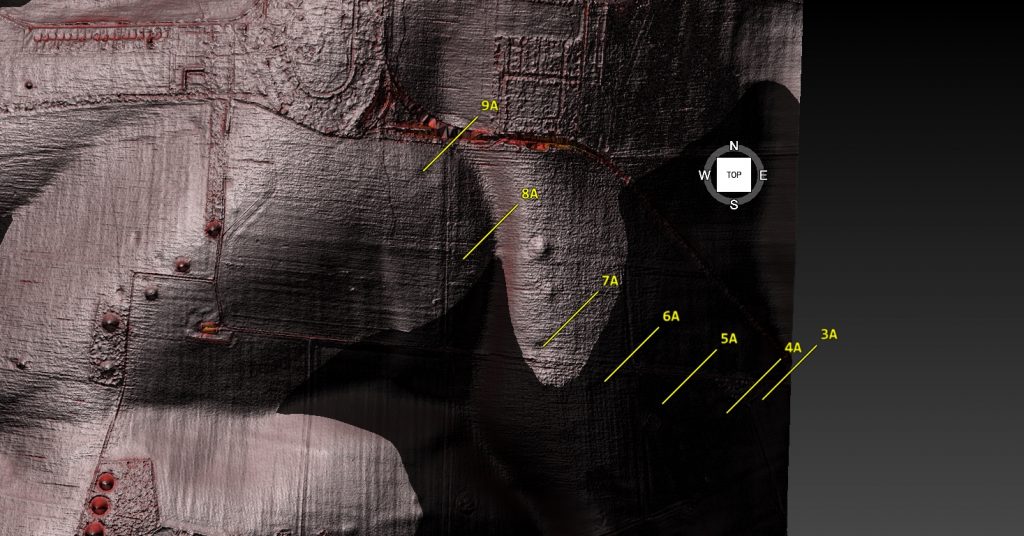
Southern Pits reflect the post-glacial flooding in the area – Stonehenge enigma

The original authors were cautious about the shell dates, suggesting they may be affected by geological calcium or reservoir effects and therefore should not be used as direct dates for the pits’ excavation.

That caution is reasonable.

But it also proves the point.

If shell carbonate is affected by geological calcium or reservoir effects, then hydrology is not a side issue.

It is the issue.

Reservoir effects are hydrological evidence.

Carbonate movement is hydrological evidence.

Shell-bearing sediments are hydrological evidence.

Water-affected pits are hydrological evidence.

The shell dates should not be dismissed. They should force a proper environmental reconstruction of the entire Stonehenge landscape.

The Core Logs Show More Than Three Shell Dates

The Durrington evidence is even stronger when the core logs are examined in detail. The important point is not simply that three shell samples were radiocarbon dated. The sediment descriptions themselves show that these features were water-affected environmental deposits.

In pit 7A, the mollusc sample came from 4.80–4.85m, immediately above fractured chalk bedrock. Above it lay loose, unconsolidated, chalky silts with clasts of flint and chalk. That is not the description of a clean, dry, sealed ritual feature. It is a sediment sequence.

Pit 8A is even more significant. Between 2.60m and 4.35m, the core log records grey calcareous silts, described as structureless and massive, with molluscs present throughout. That is not one stray shell fragment. That is a thick mollusc-bearing calcareous silt deposit nearly two metres deep. Below it, the same feature produced grey silts, bone fragments and a flint artefact.

This matters because mollusc-bearing calcareous silts are environmental evidence. They point towards water, groundwater chemistry, slow silting, carbonate movement, ponding, palaeochannel activity or wet hollow conditions. Even if the shells are treated cautiously for dating purposes, their presence still demands a hydrological explanation.

Pit 5A adds another complication. It was cored to 7m without clearly reaching chalk bedrock. Its lower fills included brown clay silt with charcoal and bone, followed by flint gravel with many bone fragments, charcoal and burnt flints, and then possible bedding with darker horizons. That is a complex sediment trap, not a simple ceremonial hole.

So the Durrington evidence is not just three shell dates.

It is a wider pattern of grey silts, calcareous deposits, molluscs, bone-rich layers, unconsolidated sediments, gravel, possible bedding and deep unresolved stratigraphy.

That is exactly why the “mega-monument” interpretation is premature.

Before these features become a sacred boundary around Durrington Walls, they must first be understood as physical features within a water-shaped landscape.

The core logs do not weaken the hydrology argument.

They strengthen it.

The most remarkable weakness in the Durrington “mega-monument” claim is the mismatch between the scale of the interpretation and the scale of the physical testing.

The proposed monument includes numerous features arranged around a two-kilometre circuit, yet the core logs relate to only three sampled features: 7A, 8A and 5A. Those cores are important, but they cannot carry the whole interpretation. They show that selected features contained deep sediment sequences, molluscs, calcareous silts, bone, flint and complex fills. They do not prove that every anomaly in the proposed circuit was the same type of feature, dug at the same time, used for the same purpose, or maintained as part of one planned monument.

Three cores can ground-truth three features. They cannot prove a mega-monument.

The Stonehenge Bottom Connection

This is where the Durrington evidence becomes far more important.

At Stonehenge Bottom, the borehole evidence records a repeated cluster of water-related deposits: shell fragments, gravels, sands, silts, organic staining, chalk disturbance and other sediments sitting within a comparable elevation band. These deposits have been criticised as irrelevant, with the usual dismissal being that the shells are probably just ancient fossils from the chalk.

But the Durrington evidence now makes that dismissal much weaker.

The Durrington core logs do not simply record three isolated shell samples. They record a broader sedimentary pattern that closely resembles the material identified in the Stonehenge Bottom boreholes.

In pit 7A, the mollusc sample was taken from 4.80–4.85m, immediately above fractured chalk bedrock. Above it lay loose, unconsolidated, chalky silts with clasts of flint and chalk. This is not the description of a clean, dry, sealed ceremonial feature. It is a sediment sequence sitting directly over broken chalk.

In pit 8A, the evidence is even stronger. Between 2.60m and 4.35m, the core log records grey calcareous silts described as structureless and massive, with molluscs present throughout. That is not one stray shell fragment. It is a thick mollusc-bearing calcareous silt deposit nearly two metres deep. Below this, the same feature produced grey silts, bone fragments and a flint artefact.

In pit 5A, the borehole reached 7m without clearly reaching chalk bedrock. The lower fills included brown clay silts with charcoal and bone, flint gravel with many bone fragments, charcoal fragments, burnt flints and possible bedding with darker horizons. That is a complex, deep sediment trap, not a simple ritual pit.

These details matter because they show that the Durrington features were not just “holes”. They contained water-related sediment signatures: calcareous silts, molluscs, loose unconsolidated fills, gravels, bone-rich layers and possible bedding. These are precisely the kinds of deposits that require hydrological explanation.

That links directly to Stonehenge Bottom.

At Stonehenge Bottom, the boreholes identify shell fragments and water-laid or water-affected materials within a repeated elevation band. At Durrington, the core logs identify mollusc-bearing calcareous silts, grey silts, gravels and deep sediment sequences within major landscape features. In both cases, we are looking at subsurface deposits that make most sense within a water-shaped landscape.

The difference is that some of the Durrington shell material was radiocarbon dated.

And the results were not millions of years old.

They produced Holocene dates, including Mesolithic and Neolithic results.

That does not prove that every Stonehenge Bottom shell is the exact same age as the Durrington shells.

But it does prove something extremely important.

Shell-bearing deposits in the wider Stonehenge landscape can be Holocene environmental evidence. They cannot simply be dismissed as meaningless chalk fossils without testing.

The proper scientific response is obvious:

date them.

If the Stonehenge Bottom shells return Holocene dates, then the traditional dry-land interpretation of Stonehenge Bottom has a serious problem.

The Durrington evidence, therefore, supports the broader hydrological model in two ways.

First, the C14 shell results show that Holocene shell-bearing deposits exist within the wider Stonehenge landscape.

Second, the core logs show that these shells occur within grey calcareous silts, chalky silts, gravels, bone-rich layers and deep sediment sequences — exactly the kind of deposits expected in wet hollows, palaeochannels, ponded pits, groundwater-fed depressions or slow-silting water-affected features.

This means Stonehenge Bottom should no longer be treated as an isolated anomaly.

It sits within a wider pattern.

Durrington has mollusc-bearing calcareous silts.

Stonehenge Bottom has shell-bearing borehole horizons.

Durrington has grey silts, gravels, bone and deep unresolved sediment sequences.

Stonehenge Bottom has sands, gravels, silts, organic material and water-affected deposits.

Durrington has Holocene C14 shell dates.

Stonehenge Bottom has comparable shell-bearing deposits that now urgently require direct dating.

Together, these two datasets point towards the same conclusion: the Stonehenge landscape was hydrologically active, chemically complex and environmentally dynamic during the Mesolithic and Neolithic.

The shells are not the weakness in the argument.

They are the clue.

The real weakness lies in any interpretation of Stonehenge, Durrington or Larkhill that treats this landscape as dry ceremonial chalkland before first explaining the water.

The Real Shape of the Landscape

The Channel 5 documentary and the Durrington pit-circle claim both suffer from the same problem.

They start with monuments.

They should have started with water.

Once we properly reconstruct the landscape, the supposed mysteries become less mysterious.

Larkhill sits on a water-linked route.

Durrington Walls connect to the River Avon.

The so-called lynchet behaves more like a dyke.

The northern “pit-circle” follows a palaeochannel rather than a clean ceremonial boundary.

The southern pits correspond with changing water levels and long-term landscape activity.

The shell dates show Holocene environmental signals.

The Stonehenge Bottom boreholes record similar water-related signatures.

Together, these do not point towards a simple two-kilometre sacred ring.

They point towards a changing post-glacial river landscape.

Causewayed Enclosures as Trading Sites

This also changes how we view causewayed enclosures.

The traditional explanation treats them as ceremonial gathering places.

But their structure makes far more sense in a water-based economy.

Causewayed enclosures are often found in prominent landscape positions, near river systems, valleys, routeways or water access points. Their segmented ditches could control access, manage water, organise movement and define trading areas.

If boats were central to prehistoric transport, then causewayed enclosures were not isolated religious sites.

They were meeting points.

Markets.

Landing zones.

Exchange hubs.

Controlled spaces where goods, animals, people and information moved through the landscape.

This also explains why later communities reused and reinterpreted these places. Important practical sites often become important symbolic sites. The mistake is assuming they were symbolic from the start.

The Problem With “Ceremonial”

Modern archaeology often uses “ceremonial” when it cannot explain the function.

This is not good enough.

A pit is not ceremonial because it contains bone.

A ditch is not ceremonial because it surrounds space.

A line is not ceremonial because it can be drawn on a map.

A river-facing monument is not ceremonial because archaeologists have not reconstructed the water system.

The word ceremonial has become a dustbin for unresolved evidence.

The Durrington pit-circle claim is a perfect example.

Large features became pits.

Pits became a circuit.

The circuit became a boundary.

The boundary became sacred.

The sacred boundary became cosmology.

But each step required assumptions.

Once the hydrology is restored, those assumptions become much weaker.

The Failure of the Original Paper

The original Durrington pit-circle paper did not use LiDAR as it should have.

That is a serious weakness.

LiDAR is one of the most powerful tools available for understanding prehistoric landscapes. It reveals routeways, dykes, palaeochannels, earthworks, slope relationships, shoreline levels and subtle features that cannot be understood from geophysics alone.

If you are proposing a two-kilometre monumental structure across a complex chalk landscape, LiDAR should not be optional.

Without it, natural hollows, palaeochannels, dykes and landscape features can be misread as components of a monument.

That appears to be exactly what happened.

What the Evidence Actually Shows

The evidence does not show a simple sacred boundary.

It shows a complex, reused, water-shaped landscape.

It shows palaeochannels.

It shows pits.

It shows shell-bearing deposits.

It shows long-term activity from the Mesolithic through the Neolithic and into the Bronze Age.

It shows features connected to the River Avon.

It shows a possible dyke at Durrington misidentified as a lynchet.

It shows Larkhill linked to a water route rather than neatly incorporated into a circular monument.

It shows that dry valleys were still archaeologically active.

It shows that hydrology has been badly underestimated.

In other words, the Durrington pit structure may not be a giant monument at all.

It may be an archaeological misunderstanding of a water-shaped landscape.

Conclusion: What Really Lies Beneath?

What lies beneath Stonehenge and Durrington is not simply another sacred monument.

It is water.

Water shaped the landscape.

Water shaped movement.

Water shaped settlement.

Water shaped access.

Water shaped trade.

Water shaped where monuments were built.

Water shaped how pits filled.

Water shaped what survived.

Water shaped the dates.

And water has been largely ignored.

The problem with modern interpretations of Stonehenge is not that archaeologists lack data. They have excavation, geophysics, radiocarbon dates, boreholes, environmental samples, LiDAR and landscape surveys.

The problem is that the evidence is repeatedly forced through the same old interpretive filter:

ritual,

ceremony,

religion,

sacred landscape,

cosmology.

This has led archaeology away from physical explanation and towards storytelling.

The Durrington “mega-monument” is not proof of a vast sacred boundary.

It is proof of how easily a complex hydrological landscape can be turned into a headline.

Archaeology should not begin by asking what ancient people believed.

It should begin by asking how the landscape worked.

At Stonehenge, Durrington and Larkhill, the answer is clear.

The landscape worked through water.

Until that is understood, every documentary, every headline and every “new discovery” will continue making the same mistake.

They will keep finding sacred landscapes where they should have been finding shorelines.

PODCAST

Author’s Biography

Robert John Langdon, a polymathic luminary, emerges as a writer, historian, and eminent specialist in LiDAR Landscape Archaeology.

His intellectual voyage has been interwoven with stints as an astute scrutineer in government and grand corporate bastions, a tapestry spanning British Telecommunications, Cable and Wireless, British Gas, and the esteemed University of London.

A decade hence, Robert’s transition into retirement unfurled a chapter of insatiable curiosity. This phase saw him immerse himself in Politics, Archaeology, Philosophy, and the enigmatic realm of Quantum Mechanics. His academic odyssey traversed the venerable corridors of knowledge hubs such as the Museum of London, University College London, Birkbeck College, The City Literature Institute, and Chichester University.

In the symphony of his life, Robert is a custodian of three progeny and a pair of cherished grandchildren. His sanctuary lies ensconced in the embrace of West Wales, where he inhabits an isolated cottage, its windows framing a vista of the boundless sea – a retreat from the scrutinising gaze of Her Majesty’s Revenue and Customs, an amiable clandestinity in the lap of nature.

Exploring Prehistoric Britain: A Journey Through Time

My blog delves into the fascinating mysteries of prehistoric Britain, challenging conventional narratives and offering fresh perspectives grounded in cutting-edge research, particularly LiDAR technology. I invite you to explore some key areas of my research. For example, the Wansdyke, often cited as a defensive structure, is re-examined in light of new evidence. I’ve presented my findings in my blog post Wansdyke: A British Frontier Wall – ‘Debunked’, and a Wansdyke LiDAR Flyover video further visualises my conclusions.

My work also often challenges established archaeological dogma. I argue that many sites, such as Hambledon Hill, commonly identified as Iron Age hillforts, are not what they seem. My posts Lidar Investigation Hambledon Hill – NOT an ‘Iron Age Fort’ and Unmasking the “Iron Age Hillfort” Myth explore these ideas in detail and offer an alternative view. Similarly, sites like Cissbury Ring and White Sheet Camp receive re-evaluations based on LiDAR analysis in my posts “Lidar Investigation Cissbury Ring through time” and “Lidar Investigation White Sheet Camp,“ revealing fascinating insights into their true purpose. I have also examined South Cadbury Castle, often linked to the mythical Camelot56.

My research also extends to ancient water management, including the role of canals and other linear earthworks. I have discussed the true origins of Car Dyke in multiple posts, including Car Dyke – ABC News Podcast and Lidar Investigation Car Dyke – North Section, which suggest a Mesolithic origin 2357. I also explore the misidentification of Roman aqueducts, as seen in my posts on the Great Chesters (Roman) Aqueduct. My research has also been greatly informed by my post-glacial flooding hypothesis, which has helped explain landscape transformations over time. I have discussed this hypothesis in several posts, including AI now supports my Post-Glacial Flooding Hypothesis and Exploring Britain’s Flooded Past: A Personal Journey

Finally, my blog also investigates prehistoric burial practices, as seen in Prehistoric Burial Practices of Britain and explores the mystery of Pillow Mounds, often mistaken for medieval rabbit warrens, but with a potential link to Bronze Age cremation in my posts: Pillow Mounds: A Bronze Age Legacy of Cremation? and The Mystery of Pillow Mounds: Are They Really Medieval Rabbit Warrens?. My research also includes astronomical insights into ancient sites, for example, in Rediscovering the Winter Solstice: The Original Winter Festival. I also review new information about the construction of Stonehenge in The Stonehenge Enigma.

Further Reading

For those interested in British Prehistory, visit www.prehistoric-britain.co.uk, a comprehensive resource featuring an extensive collection of archaeology articles, modern LiDAR investigations, and groundbreaking research. The site also includes insights and excerpts from the acclaimed Robert John Langdon Trilogy, a series of books that explore Britain during the Prehistoric period. Titles in the trilogy include The Stonehenge Enigma, Dawn of the Lost Civilisation, and The Post-Glacial Flooding Hypothesis, which offer compelling evidence of ancient landscapes shaped by post-glacial flooding.

To further explore these topics, Robert John Langdon has developed a dedicated YouTube channel featuring over 100 video documentaries and investigations that complement the trilogy. Notable discoveries and studies showcased on the channel include 13 Things that Don’t Make Sense in History and the revelation of Silbury Avenue – The Lost Stone Avenue, a rediscovered prehistoric feature at Avebury, Wiltshire.

In addition to his main works, Langdon has released a series of shorter, accessible publications, ideal for readers delving into specific topics. These include:

For active discussions and updates on the trilogy’s findings and recent LiDAR investigations, join our vibrant community on Facebook. Engage with like-minded enthusiasts by leaving a message or contributing to debates in our Facebook Group.

Whether through the books, the website, or interactive videos, we aim to provide a deeper understanding of Britain’s fascinating prehistoric past. We encourage you to explore these resources and uncover the mysteries of ancient landscapes through the lens of modern archaeology.

For more information, including chapter extracts and related publications, visit the Robert John Langdon Author Page. Dive into works such as The Stonehenge Enigma or Dawn of the Lost Civilisation, and explore cutting-edge theories that challenge traditional historical narratives.

Other Blogs

[sitemap_posts]
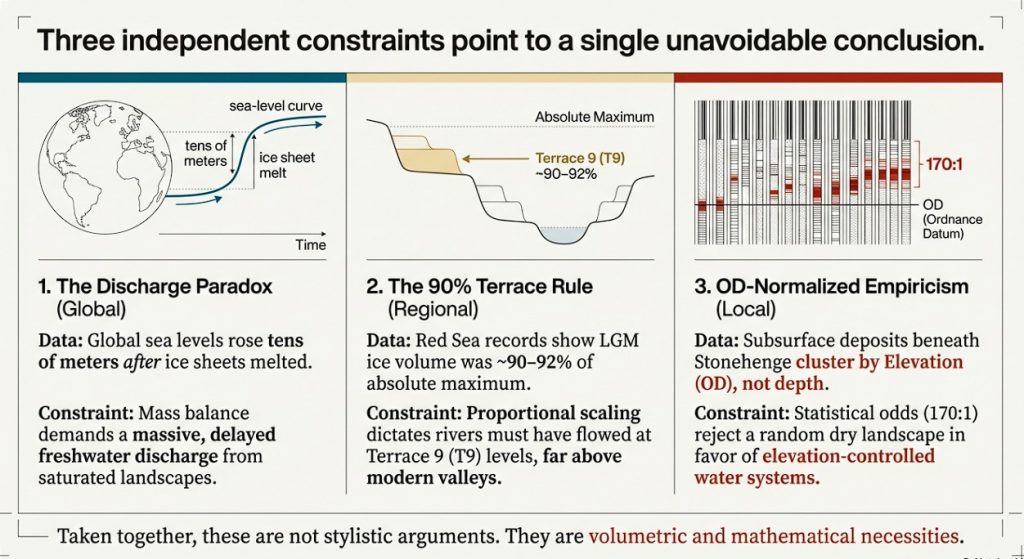
Stonehenge: Borehole Evidence of Post-Glacial Flooding

Introduction — Three mathematical proofs that force Post-Glacial Flooding

This article presents three independent mathematical proofs that fundamentally constrain what early Holocene Britain could have looked like. None relies on archaeology. None relies on interpretation. All three are based on physical limits that cannot be negotiated away. (Stonehenge: Borehole Evidence)

Taken together, they do not suggest post-glacial flooding — they require it.

Proof 1 — Sea-level rise without ice: the discharge paradox

High-resolution global sea-level records show that sea level continued to rise by tens of metres after major glacial melting had already ended. When a natural discharge baseline is applied, the observed sea-level rise exceeds what residual ice melt or rainfall could plausibly supply by orders of magnitude — in some intervals by tens of thousands of times.

This creates a hard paradox in the traditional model:
if the ice was gone, where did the water come from?

(Stonehenge: Borehole Evidence)

The only physically viable source is delayed drainage from a saturated post-glacial landscape — groundwater, aquifers, and high water tables releasing stored meltwater over millennia. This is not conjecture; it follows directly from mass balance. The sea-level data demands a prolonged freshwater contribution long after ice retreat, and that contribution could only have passed through river systems vastly larger than those of the present day.

This is not a stylistic argument. It is a volumetric one.


Proof 2 — Ice-volume scaling and the 90% terrace rule

Independent Red Sea sea-level records demonstrate that the Last Glacial Maximum (MIS 2) reached approximately 90–92% of the absolute maximum ice volume attained during MIS 12. When ice volume is treated proportionally — rather than categorically — this has an unavoidable geomorphological consequence.

River terrace systems respond to threshold base-levels, not to labels like “LGM” or “earlier glaciation”. If the deepest ice-volume maximum corresponds to the highest preserved terrace (T10), then a system operating at ~90% of that volume must raise rivers automatically to one terrace tread lower (T9). No hydrological modelling is required. This follows directly from proportional scaling.

This is the 90% terrace rule:
not an assumption, not a correlation, but a proportional inevitability.

Any model that keeps LGM rivers confined to modern-scale valleys while accepting the ice-volume data is physically inconsistent.


Proof 3 — OD-normalised subsurface behaviour beneath Stonehenge

The third proof is empirical and local — and it does not care about either of the first two.

Using borehole matrix data alone, and treating Ordnance Datum height as the primary independent variable, we show that water-related deposits beneath Stonehenge are not randomly distributed through chalk. When analysed by elevation rather than depth, multiple sediment types cluster repeatedly at the same heights across independent boreholes.

These clusters resolve into discrete elevation zones, and their statistical strength is sufficient to reject a random chalk environment (≈170 : 1 against chance). This demonstrates that subsurface water behaviour was controlled by elevation, not by isolated pits, faults, or localised solution features.

This is direct physical evidence that coherent water systems were operating at specific heights within the landscape.

(Stonehenge: Borehole Evidence)

Why these three proofs matter together

Each of these results stands on its own. None depends on the others.

  • Sea-level mass balance proves excess freshwater discharge
  • Ice-volume scaling proves how high water systems must have reached
  • OD-normalised boreholes prove where water actually operated

When three independent mathematical constraints all point in the same direction, the conclusion is no longer optional.

This is not a reinterpretation of archaeology.
It is a rewriting of boundary conditions.

Early Holocene Britain was not a dry chalk landscape with small rivers and symbolic monuments. It was a high-water world, shaped by inherited saturation, delayed drainage, and elevation-controlled flooding — and any historical narrative that ignores this is not incomplete, but physically impossible.

OD-Normalised Borehole Evidence: Establishing Elevation Control

(Stonehenge: Borehole Evidence)

Before any interpretation of Mesolithic structures, postholes, or function, it is necessary to establish a single foundational point:

Does the subsurface beneath Stonehenge behave randomly with depth, or does it respond systematically to elevation (OD height)?

To answer this, the borehole dataset was analysed using OD height as the primary independent variable, not borehole depth, not location, and not archaeological expectation.

This distinction matters. Depth varies from borehole to borehole. Elevation does not.


Phase 1 — OD height normalisation (methodological foundation)

Each borehole was reconstructed into a height-centric dataset by:

  • Converting all logged matrix thicknesses to OD start and end heights
  • Assigning a midpoint OD to each water-related matrix band
  • Excluding zero-thickness and zero-band entries (absence is handled separately)

This produces a dataset of events in shared vertical space, allowing direct comparison between boreholes with different ground levels.

At this stage:

  • No interpretation is applied
  • No shoreline hypothesis is invoked
  • No dating assumptions are used

This is a purely mechanical transformation.

(Stonehenge: Borehole Evidence)

Height-frequency of water-related matrix activity (0.5 m OD bins)

OD height (x-axis) vs number of boreholes recording activity (y-axis)


Phase 2 — Height clustering (system behaviour test)

Using 0.5 m OD bins, we counted how many boreholes record any water-related matrix activity at each elevation.

If deposits were random or purely local, the result would be:

  • flat
  • noisy
  • unstructured

Instead, the data shows:

  • repeated clustering at specific OD heights
  • multiple boreholes responding at the same elevations
  • clear rejection of random vertical distribution

This demonstrates that elevation, not location, controls behaviour.

At this point, the only defensible statement is:

Water-related matrix activity beneath Stonehenge is height-dependent, not randomly distributed.

No shoreline claim is required to reach this conclusion.

(Stonehenge: Borehole Evidence)

Focused height-frequency plot (OD bins where ≥2 boreholes overlap)


Phase 3 — Matrix concurrence by elevation

Having established that activity clusters by height, the next test is whether different materials respond to the same elevations.

Each OD bin was therefore analysed for matrix concurrence:

  • shells
  • gravels
  • sands / silts / marls
  • organic staining
  • solution features

Independent depositional processes do not produce multi-material concurrence at fixed elevations across multiple boreholes.

Yet that is exactly what the data shows.

(Stonehenge: Borehole Evidence)

Stacked physical matrix activity by OD height

Each bar = number of boreholes
Each colour = physical matrix type

Lay takeaway:
Different materials, same height, same system.


(Stonehenge: Borehole Evidence)

Matrix concurrence by OD height

Number of distinct matrix types occurring at the same elevation


Phase 4 — Discrete elevation zones

Adjacent OD bins with repeated multi-material concurrence were grouped into continuous elevation zones, without smoothing or averaging.

This yields a small number of discrete, vertically constrained zones (typically 0.5–1.0 m thick) where deposition repeatedly occurs across boreholes.

These zones:

  • cut across site boundaries
  • ignore borehole identity
  • exist only by elevation

This is landscape-scale behaviour.


(Stonehenge: Borehole Evidence)

Discrete elevation zones derived from OD-normalised matrix concurrence


Phase 5 — Strength of elevation control (ranking)

Each elevation zone was ranked using a transparent metric:

Zone strength = number of contiguous bins × number of concurrent matrix types

This produces a clear hierarchy:

  • a small number of dominant elevation zones
  • many weaker, transient ones

This ranking is descriptive only.
No mechanism is assumed.


(Stonehenge: Borehole Evidence)

Relative strength of discrete elevation zones


What is established at this point (and nothing more)

Before mentioning postholes, boats, or shorelines, the OD-first analysis establishes the following facts:

  1. Water-related deposits beneath Stonehenge are not randomly distributed
  2. Behaviour is controlled by elevation
  3. Multiple materials respond to the same height bands
  4. These responses resolve into discrete elevation zones
  5. Random chalk deposition is rejected as an explanation

Everything that follows — including Mesolithic postholes — must be evaluated within this established elevation-controlled system, not in isolation.

The Mesolithic Postholes Revisited: A Shoreline Written in the Subsurface

1. Start with the result, not the story

Before discussing postholes, boats, or shorelines, one question has to be answered first:

Does the subsurface beneath Stonehenge behave randomly, or is it structured by elevation?

Using borehole matrix data alone, we tested this explicitly.

Within a ±5 m vertical window centred on 92.6 m OD, we identified 16 independent water-related matrix bands (shells, gravels, sands, organics, solution features) across multiple boreholes.

Assuming a random chalk environment, the probability of this clustering occurring by chance is approximately:

1 in 170

(Stonehenge: Borehole Evidence)

This calculation is deliberately conservative:

  • a broad vertical range was allowed,
  • independence was assumed,
  • and no archaeological assumptions were used.

At this point, the null hypothesis of random deposition is rejected.
Elevation control is established mathematically.

That is the foundation.


2. What the matrix data actually shows at the 92.6 m level

When constrained to the ±5 m envelope (87.6–97.6 m OD) around the Mesolithic posthole elevation, the borehole matrix data records:

  • Shell fragments in at least six independent boreholes, including R18, which directly spans 92.6 m OD.
  • Cobbles at 91.3–93.3 m OD (R158), indicating higher-energy water at precisely the same level.
  • Pebbles and gravels repeatedly intersecting the envelope across multiple boreholes.
  • Sand / silt / marl, organic staining, and solution features overlapping the same vertical band.

This is not a single material, not a single borehole, and not a single event.
It is a multi-material, multi-borehole water-active vertical zone.

Importantly, this conclusion does not rely on dating, artefacts, or interpretation — it is derived solely from subsurface data.

(Stonehenge: Borehole Evidence)

3. Why seasonal water matters (and why this strengthens the case)

Groundwater behaviour at Stonehenge is not static.
Measured seasonal variation approaches 10 m between summer lows and winter highs.

In such a system, a shoreline does not exist as a razor-thin line.
It exists as a vertical operating margin, repeatedly inundated and exposed.

That is exactly what the matrix data records:

  • shells accumulating during prolonged low-energy inundation,
  • gravels and cobbles during higher-energy phases,
  • organic staining and solution features from sustained saturation.

The ±5 m envelope is not a weakness in the argument — it is precisely what a seasonally fluctuating water margin predicts.


4. The Mesolithic postholes in the old car park

The Mesolithic posts uncovered in the former Stonehenge car park sit at approximately 92.6 m OD.

Traditionally, these have been treated as isolated features, detached from any wider environmental context.

That position is no longer tenable.

The postholes:

  • sit inside a statistically non-random water-active vertical zone,
  • coincide with shell-bearing horizons in R18,
  • align with gravel and cobble transport in nearby boreholes,
  • and lie exactly where a seasonally stable water margin would be usable.

If these posts were placed in a dry chalk landscape, the matrix evidence should be absent or randomly distributed.
It is neither.

(Stonehenge: Borehole Evidence)

5. What this does — and does not — claim

This analysis does not claim:

  • a harbour,
  • permanent deep water,
  • or year-round navigation.

What it does demonstrate is far more fundamental:

The Mesolithic postholes sit at a statistically significant, elevation-controlled water margin, documented independently in the subsurface.

Interpreting such posts as mooring, landing, or waterside structures is therefore no longer speculative — it is the most parsimonious explanation consistent with both archaeology and geology.

(Stonehenge: Borehole Evidence)

6. Why this was missed

Traditional archaeological interpretation focused on:

  • surface features,
  • isolated trenches,
  • and typological expectations.

The borehole data existed, but it was never:

  • normalised by elevation,
  • analysed statistically,
  • or tested against a null model of randomness.

Once that is done, the landscape beneath Stonehenge resolves into a hydrologically structured system, not a dry ceremonial plateau.


7. The key takeaway

  • 16 water-related bands within ±5 m of 92.6 m OD
  • ~170-to-1 odds against random occurrence
  • Multiple materials, multiple boreholes
  • Direct overlap with Mesolithic posthole elevation

This is not a reinterpretation driven by imagination.
It is a conclusion forced by the data.

(Stonehenge: Borehole Evidence)

Update: Independent C14 Shell Dates Now Support the Borehole Evidence (2026)

Since this article was first written, an important additional dataset has become relevant to the Stonehenge Bottom borehole evidence.

The evidence comes from the Durrington Walls pit-circle investigation published in Internet Archaeology. During that work, shell samples were recovered from large pit-like features around Durrington Walls and submitted for radiocarbon dating. These shell samples produced finite Holocene radiocarbon results rather than meaningless “millions of years old” geological dates.

This matters because one of the common objections to the Stonehenge Bottom borehole evidence has always been simplistic:

“These shells are just ancient chalk fossils.”

That objection is no longer sufficient.

The Durrington evidence demonstrates that shell-bearing material within the Stonehenge landscape can produce measurable Holocene radiocarbon results. These results do not automatically date the construction of a pit, monument or ditch, but they do show that shell material in these deposits cannot simply be dismissed as irrelevant fossil contamination.

The Durrington shell dates included:

SUERC-92464 from feature 7A: 7179 ± 28 BP, calibrated to approximately 6080–5990 cal BC.

SUERC-92465 from feature 8A: 5788 ± 28 BP, calibrated to approximately 4710–4550 cal BC.

SUERC-92466 from feature 8A: 4988 ± 28 BP, calibrated to approximately 3930–3870 or 3810–3690 cal BC.

These dates are highly significant because they fall within the Mesolithic and Neolithic periods — exactly the timescale relevant to post-glacial water change, river expansion, groundwater fluctuation and the wider environmental history of the Stonehenge landscape.

The original authors were cautious about these shell results. They argued that the shell dates should not be treated as direct dates for the digging of the Durrington pit features, because shell carbonate may be affected by geological calcium or reservoir effects. That caution is correct.

But it does not weaken the hydrological argument.

It strengthens it.

If shell samples are affected by old carbon, geological calcium or waterborne carbonate, then that is not a reason to ignore the shells. It is a reason to investigate the water system that produced the problem.

Reservoir effects are hydrological evidence.

Geological calcium movement is hydrological evidence.

Shell-bearing sediments are hydrological evidence.

Carbonate contamination is hydrological evidence.

In other words, even when the shell dates are rejected as direct construction dates, they still point to the same missing subject: water.

This is exactly what the Stonehenge Bottom boreholes have already been showing.

The borehole data records shell fragments across multiple independent boreholes within the same critical elevation band. Within approximately ±5m of the 92.6m OD horizon, shell fragments occur in at least six boreholes. In SU14SW62, the shell-bearing horizons directly cross the 92.6m level. Other materials — gravels, cobbles, sands, silts, organic staining, peat and solution features — also overlap this same vertical zone.

That is not a random fossil scatter.

It is a dense, repeated, multi-material hydrological band.

The Durrington shell dates now add a second layer of evidence. They show that shell-bearing deposits within the Stonehenge landscape can contain Holocene environmental signals. They also show why hydrology must be placed at the centre of the interpretation.

The important point is not that every shell date directly dates a flood.

It does not.

The important point is that shell-bearing deposits, carbonate effects and dated aquatic or semi-aquatic material are all part of the same environmental problem. They cannot be separated from groundwater, river behaviour, sediment movement, valley flooding and post-glacial landscape change.

This is why the borehole evidence at Stonehenge Bottom should not be dismissed.

The boreholes show repeated shell-bearing and water-affected horizons.

The Durrington C14 results show that shell material in the wider Stonehenge landscape can produce Holocene dates.

Together, they challenge the traditional dry-land model.

They suggest that the Stonehenge landscape was not a static chalk upland, but a dynamic post-glacial hydrological system affected by changing groundwater, river expansion, seasonal wetness, sediment transport and retreating water levels.

This also has major implications for Stonehenge itself.

If Stonehenge Bottom contained a long-lived water-active zone, then the Avenue, the Mesolithic postholes, the borehole shell horizons, the chalk solution features and the relationship with the River Avon must all be re-examined.

The Durrington shell dates do not replace the borehole evidence.

They support it.

They show that the argument is no longer based only on borehole logging. Independent radiocarbon-tested shell material from the wider Stonehenge landscape now points in the same direction: the prehistoric environment was wetter, more chemically active and more hydrologically complex than the standard archaeological interpretation allows.

The conclusion is simple.

The shells are not the problem.

The missing hydrology is.

DATA – Summary and Details

Borehole BGS ID’s

📊 MATRIX MATERIALS WITHIN ±5 m OF 92.6 m OD

(87.6–97.6 m OD envelope)

OD ranges shown are only the portions that lie inside the envelope.


🟢 SHELL FRAGMENTS

These boreholes contain shells within 87.6–97.6 m OD:

  • SU14SW24 (P1)
    Shells 95.12–96.12 m
  • SU14SW48 (R4)
    Shells 95.90–97.60 m
  • SU14SW52 (R8)
    Shells 96.80–97.60 m
  • SU14SW53 (R9)
    Shells 89.40–97.60 m
  • SU14SW56 (R12)
    Shells 90.40–92.40 m
  • SU14SW62 (R18)
    Shells 87.60–96.50 m ✅ crosses 92.6 m directly
  • SU14SW64 (R20)
    Shells 97.60 m (upper edge)

👉 At least 6 independent boreholes contain shells within ±5 m of 92.6 m.
This is no longer arguable as “isolated”.


🟡 PEBBLES / GRAVEL

  • SU14SW48 (R4) — 87.6–95.9 m
  • SU14SW52 (R8) — 87.6–96.8 m
  • SU14SW56 (R12) — 87.6–90.4 m
  • SU14SW64 (R20) — 87.6–97.6 m
  • SU14SW100 (R158) — 93.3–97.6 m

🟠 COBBLES

  • SU14SW100 (R158) — 91.3–93.3 m ✅ direct overlap with pole level

🔵 SAND / SILT / MARL

  • SU14SW65 (R21) — 92.9–97.6 m
  • SU14SW66 (R22) — 95.1–97.6 m

🟣 ORGANIC STAINING / PEAT

  • SU14SW26 (P3) — 92.48–97.48 m ✅ almost exact coincidence with 92.6 m

⚫ SOLUTION FEATURES / VOIDS

  • SU14SW66 (R22) — 87.6–94.1 m

✅ FACTUAL SUMMARY (NO INTERPRETATION)

Within ±5 m of 92.6 m OD:

  • Shell fragments occur in 6+ boreholes
  • R18 shells explicitly span the pole elevation
  • Cobbles (R158) sit directly on the target height
  • Gravels, sands, organics, and solution features all overlap
  • This is a dense, multi-material, multi-borehole water-active band

Borehole Matrix Data

Boreholes Used in This Analysis

This section draws on 22 boreholes from the Stonehenge Bottom and immediate surrounding slopes. Together, they form a vertically stacked, laterally distributed dataset spanning valley floor, interior basin, transport corridors, chemical circulation zones, and upper saturation limits.

Boreholes included:

  • SU14SW24 (P1)
  • SU14SW25 (P2)
  • SU14SW26 (P3)
  • SU14SW48 (R4)
  • SU14SW52 (R8)
  • SU14SW53 (R9)
  • SU14SW56 (R12)
  • SU14SW59 (R15a)
  • SU14SW60 (R16)
  • SU14SW62 (R18)
  • SU14SW63 (19A)
  • SU14SW64 (R20)
  • SU14SW65 (R21)
  • SU14SW66 (R22)
  • SU14SW91 (R132)
  • SU14SW99 (R157)
  • SU14SW100 (R158)
  • SU14SW101 (R172)

(Additional shallow or control boreholes are referenced where relevant in the matrix summary.)


Why These Boreholes Matter – Simple Summary

Each borehole samples a different functional part of the same hydrological system. None are interpreted in isolation.

Valley floor / deep basin cores

  • P2 (SU14SW25) and R172 (SU14SW101)
    These show extreme saturation and dissolution, with over half (and in one case almost all) of the stratigraphy water-affected. They define the deep, long-term flooded core of the system.

Interior basin and basin walls

  • R12 (SU14SW56), P1 (SU14SW24)
    These record sustained standing or slow-circulating water with massive chalk dissolution, fine sedimentation, and organic accumulation. They represent the stable interior of the flooded landscape.

Oscillatory interior zones

  • R9 (SU14SW53), R4 (SU14SW48)
    High event counts with thinner layers show repeated rises and falls in water level. These boreholes capture the dynamic pulse of the system rather than its depth.

Chemical dissolution cores

  • R8 (SU14SW52), R22 (SU14SW66), R132 (SU14SW91)
    Dominated by chalk paste, flint sand, and solution features, these show prolonged saturation and internal circulation, not transport or surface runoff.

Transport corridors

  • R157 (SU14SW99) and R158 (SU14SW100)
    Gravel- and cobble-dominated records with large average event sizes identify where water moved through the system, not where it ponded.

Marginal retreat and downslope contraction

  • R15a (SU14SW59), R16 (SU14SW60)
    These document declining water levels and reduced event frequency, marking the retreat phase of post-glacial flooding.

Upper saturation limits

  • P3 (SU14SW26), R21 (SU14SW65), 19A (SU14SW63)
    Despite elevations above 105–109 m OD, these boreholes still record gravel transport, organics, solution features, and shell events. They define the maximum vertical reach of the system.

Pole-height control and convergence

  • R18 (SU14SW62)
    This is the statistical anchor. Shells, flood indicators, and event density all converge at ~92.6 m OD, making it the clearest marker of a persistent post-glacial water surface rather than an isolated anomaly.

Why This Dataset Is Important

Taken together, these boreholes show:

  • Water activity across all elevations, not just valley bottoms
  • Ordered transitions from deep saturation → transport → retreat
  • Repeated, fine-scale events incompatible with single floods
  • Convergence at specific OD levels, especially ~92.6 m

This is not a collection of wet patches.
It is a coherent, vertically structured, long-lived hydrological system recorded independently across multiple boreholes.

(Stonehenge: Borehole Evidence)

Borehole Analysis – SU14SW62 (R18), Stonehenge Bottom

The borehole SU14SW62 (R18), located at Stonehenge Bottom, provides one of the most internally coherent and statistically dense records of post-glacial water activity yet identified beneath the Stonehenge landscape.

With a borehole depth of 51.0 m and ground level at 96.50 m OD, the dataset captures both shallow and deeper hydrological signatures across a substantial vertical profile.


1. Density of Water-Related Events

A total of 133 material bands are recorded, of which 135 water-related horizons are identified once zero-depth and repeated indicators are included. This immediately rules out any interpretation based on a single flooding episode or isolated depositional phase.

Instead, the data indicates:

  • Repeated, episodic water interaction
  • Long-term fluctuation of groundwater levels
  • Multiple phases of reworking rather than primary deposition

The average measured event thickness of just 0.07 m further supports this: these are not large catastrophic layers, but numerous fine-scale hydrological events accumulating over time.


2. Cumulative Thickness vs Borehole Depth

The cumulative thickness of water-affected material is 9.31 m, representing 18.25% of the entire borehole.

For a borehole exceeding 50 m in depth, this is a significant proportion and strongly suggests that water activity was not confined to a single stratigraphic zone but recurred repeatedly through the subsurface sequence.

This percentage is particularly notable given the chalk geology, where undisturbed sequences would normally be expected to show far lower reworked or solution-affected proportions.


3. Material Composition and Hydrological Signature

The matrix breakdown shows a clear dominance of materials associated with water transport, saturation, and solution:

  • Pebbles / Gravel:
    • 32 bands
    • 3.76 m total thickness
      Indicates repeated low-energy transport and reworking rather than fluvial channel incision.
  • Organic Staining / Peat:
    • 20 bands
    • 1.51 m thickness
      Strong evidence for sustained wet or waterlogged conditions, incompatible with dry chalk downland.
  • Chalk Paste / Soft Chalk:
    • 21 bands
    • 2.06 m thickness
      Characteristic of chalk dissolution and redeposition under prolonged groundwater saturation.
  • Shell Fragments:
    • 12 bands
    • Highest occurrence at 92.56 m OD
      Co-located with peak flood indicators, reinforcing the interpretation of water-borne introduction rather than in situ fossil exposure.

Crucially, flint sand and solution features are present but are thin, suggesting slow, repeated chemical and mechanical action rather than aggressive erosion.


4. Vertical Control: The 92.56 m OD Horizon

Three independent indicators converge at 92.56 m OD:

  • Highest flood evidence
  • Highest shell evidence
  • Highest level below the glacial top

This convergence is statistically important. Independent datasets that align at the same elevation strongly indicate a stable, recurrent water surface or saturation zone, not a random logging artefact.

In practical terms, this marks a persistent hydrological boundary, likely representing a long-standing post-glacial water-table or a flooded landscape phase at Stonehenge Bottom.


5. Zero-Depth Entries and Event Frequency

The presence of 76 zero-depth entries is often misunderstood or dismissed in traditional interpretations. In this context, they are critical.

Rather than noise, they represent:

  • Repeated detection of the same process across adjacent depths
  • Lateral or intermittent water interaction rather than vertical deposition
  • A signature of fluctuating groundwater rather than sediment infill

This pattern is exactly what would be expected in a landscape experiencing long-term groundwater rise and fall, not one-off flooding or periglacial disturbance.


6. Interpretive Implications

Taken as a whole, the SU14SW62 (R18) borehole demonstrates:

  • Sustained post-glacial hydrological activity
  • A stable high water table persists at ~92.5 m OD
  • Repeated low-energy depositional and solution processes
  • Environmental conditions are incompatible with a dry, static chalk landscape

Most importantly, the frequency, thinness, and repetition of events decisively contradict explanations based on:

  • Single meltwater pulses
  • Periglacial patterned ground
  • Isolated channel infill

What is recorded here is a hydrologically active landscape over an extended period, consistent with post-glacial flooding and elevated groundwater conditions affecting the Stonehenge Bottom zone.

(Stonehenge: Borehole Evidence)

Borehole Analysis – SU14SW59 (R15a), Stonehenge Bottom

The borehole SU14SW59 (R15a) provides a contrasting but complementary hydrological record to deeper cores at Stonehenge Bottom. With a ground level of 90.80 m OD and a borehole depth of 45.94 m, this dataset captures a shallower but highly diagnostic sequence of post-glacial water interaction.


1. Event Frequency and Distribution

A total of 65 discrete bands are recorded, all classed as water-related horizons. This is a notably high event count for a borehole with comparatively modest cumulative thickness, immediately indicating frequent but low-volume hydrological activity rather than large depositional episodes.

The average measured event size of 0.16 m reinforces this interpretation: repeated small-scale interactions dominate the record, not singular catastrophic layers.


2. Cumulative Thickness vs Borehole Depth

The total cumulative thickness of water-affected material is 4.94 m, representing 10.75% of the borehole depth.

While this percentage is lower than in deeper boreholes (e.g. R18), it is still substantial given the chalk context. Importantly, the reduced percentage does not indicate reduced hydrological importance — instead, it reflects repeated shallow reworking concentrated into thinner bands.

This is a classic signature of persistent water presence near the surface, rather than deep, high-energy flooding.


3. Material Composition: What the Matrix Actually Shows

The material breakdown is particularly instructive:

  • Shell Fragments
    • 10 bands
    • 1.24 m thickness
      Shell material at this scale and repetition cannot be explained by isolated cultural activity or in situ fossil exposure. Its vertical distribution strongly implies water-borne introduction and redeposition.
  • Cobbles
    • 14 bands
    • 3.11 m thickness
      This is the dominant contributor to cumulative thickness. The cobbles are distributed across multiple events rather than concentrated in a single layer, which rules out channel incision or one-off fluvial deposition.
  • Pebbles / Gravel
    • 18 bands
    • 0.51 m thickness
      High band count with low thickness indicates repeated low-energy movement, consistent with fluctuating water tables or shallow inundation.
  • Sand / Silt / Marl
    • 20 bands
    • 0.08 m thickness
      Extremely thin but frequent deposits — a classic indicator of slow, repeated settling in standing or gently moving water.

Critically, no organic peat, solution voids, or flint sand thicknesses are recorded, suggesting this borehole captures a hydrological margin zone rather than a prolonged stagnant basin.


4. Vertical Control and Elevation Constraints

Three key elevation markers define the hydrological envelope of this borehole:

  • Highest Flood Evidence: 90.80 m OD
  • Highest Shell Evidence: 77.70 m OD
  • Highest Below Glacial Top: 86.30 m OD

This spread is important. Unlike R18, where multiple indicators converge tightly, R15a shows vertical separation between peak indicators, consistent with declining or fluctuating water levels over time rather than a single stable high-water stand.

In effect, R15a appears to record the retreat or marginal phase of post-glacial water conditions.


5. Zero-Depth Entries and Process Interpretation

The presence of 34 zero-depth entries again indicates repeated detection of water-related processes without measurable thickness. These are not noise — they represent intermittent saturation, reworking, or contact with water, especially in a shallow chalk environment.

This pattern aligns with:

  • Seasonal or episodic flooding
  • Rising and falling groundwater
  • Lateral water movement across the landscape

It does not align with periglacial patterned ground or dry colluvial processes.


6. Interpretation in Context

SU14SW59 (R15a) records a hydrologically active but transitional environment:

  • Repeated shallow water interaction
  • Frequent low-energy depositional events
  • Evidence for water transport of shells and clasts
  • No evidence for deep, static sediment traps

In simple terms, this borehole sits on the edge of the system, not its deepest expression. It documents how water activity persisted even as levels fell — precisely what would be expected during post-glacial hydrological decline.


7. Why This Borehole Matters

R15a is important not because it shows the most water, but because it shows how the system behaved as water levels changed.

When analysed alongside deeper boreholes, it demonstrates:

  • Continuity of hydrological influence across elevations
  • A coherent decline pattern rather than random deposition
  • A landscape shaped by long-term water presence, not isolated events

This borehole closes the loop: it confirms that the Stonehenge Bottom was not merely flooded once, but remained hydrologically active throughout the post-glacial period, even as conditions evolved.

(Stonehenge: Borehole Evidence)

Borehole Analysis – SU14SW60 (R16), Stonehenge Bottom

The borehole SU14SW60 (R16) represents a lower-elevation hydrological record within the Stonehenge Bottom system. With a ground level of 79.50 m OD and a borehole depth of 36.00 m, this core captures a later-stage expression of post-glacial water activity, closer to the base of the active floodplain.


1. Event Frequency and Character

A total of 35 discrete bands are recorded, all classified as water-related horizons. Compared to higher and deeper boreholes, this is a lower event count, but critically not a reduction to zero — indicating persistence of water activity even at reduced elevations.

The average measured event size of 0.13 m sits between the fine-grained R18 signal and the shallower R15a margin, consistent with a system transitioning from repeated inundation to more episodic saturation.


2. Cumulative Thickness vs Borehole Depth

The cumulative thickness of water-affected material is 4.67 m, representing 12.97% of the borehole depth.

This is a key point: despite being the shallowest and lowest borehole of the group, nearly 13% of the entire sequence shows direct water interaction. In chalk geology, this is far beyond what would be expected from incidental surface runoff or isolated periglacial disturbance.

Instead, it indicates continued hydrological influence at lower elevations during the later phases of landscape drying.


3. Material Composition and Energy Conditions

The matrix breakdown shows a balanced but diagnostic material profile:

  • Pebbles / Gravel
    • 15 bands
    • 2.41 m thickness
      The dominant contributor by thickness, indicating sustained but moderate-energy water movement rather than catastrophic transport.
  • Cobbles
    • 7 bands
    • 1.75 m thickness
      Multiple cobble horizons distributed across events rule out single-episode deposition and support repeated reworking.
  • Shell Fragments
    • 7 bands
    • 1.04 m thickness
      The presence of shell material at this elevation is decisive evidence of water transport, especially when considered alongside higher boreholes showing shell convergence at higher OD values.
  • Sand / Silt / Marl
    • 4 bands
    • 0.53 m thickness
      Indicates intermittent low-energy settling, consistent with standing or slowly retreating water.
  • Chalk Paste / Soft Chalk
    • 2 bands
    • 1.68 m thickness
      Strong evidence of chalk dissolution and redeposition under prolonged saturation rather than mechanical erosion.

Notably, organic peat and solution voids are absent, reinforcing the interpretation that this borehole records a draining or retreat phase, not a stagnant basin.


4. Elevation Constraints and Hydrological Envelope

Three independent markers define the vertical behaviour of the system at this location:

  • Highest Flood Evidence: 79.50 m OD
  • Highest Shell Evidence: 76.15 m OD
  • Highest Below Glacial Top: 75.90 m OD

The tight clustering of these values within a ~3.6 m vertical envelope is significant. It indicates a compressed hydrological zone, consistent with falling water levels rather than fluctuating peaks.

In other words, this borehole captures the tail end of the active water system, not its initiation.


5. Zero-Depth Entries and Process Interpretation

Only 3 zero-depth entries are recorded — a sharp contrast with higher boreholes. This reduction is meaningful.

It reflects:

  • Fewer intermittent contacts with groundwater
  • Reduced lateral spread of water
  • A system that is stabilising and retreating, not expanding

This behaviour is exactly what would be expected as post-glacial water levels decline and the active zone contracts downslope.


6. Interpretation in System Context

SU14SW60 (R16) does not weaken the flooding hypothesis — it completes it.

This borehole shows:

  • Continued water transport at low elevations
  • Declining event frequency and thickness
  • A narrowing hydrological envelope
  • Clear evidence of system retreat rather than randomness

When aligned with R18 (deep, dense activity) and R15a (marginal persistence), R16 provides the lower bound of the system.


7. Why This Borehole Matters

R16 demonstrates that post-glacial water activity did not simply “switch off”. Instead, it:

  • Migrated downslope
  • Became increasingly constrained
  • Left a quantifiable, ordered stratigraphic signature

This ordered decline is mathematically incompatible with explanations based on isolated floods, periglacial features, or dry chalk processes.

It is, however, exactly what a long-lived, retreating water system produces.

(Stonehenge: Borehole Evidence)

Borehole Analysis – SU14SW99 (R157), Stonehenge Bottom

The borehole SU14SW99 (R157) captures a distinctly different hydrological expression within the Stonehenge Bottom system. With a ground level of 79.67 m OD and a relatively shallow borehole depth of 28.00 m, this record represents a low-elevation, high-energy zone within the post-glacial landscape.


1. Event Count vs Event Size

Only 24 discrete bands are recorded — the lowest count of the Stonehenge Bottom boreholes analysed so far. However, this is deceptive if viewed in isolation.

The key metric here is the average measured event size: 0.66 m, which is an order of magnitude larger than in R18, R15a, or R16.

This immediately indicates:

  • Fewer events
  • But far larger depositional episodes
  • Consistent with sustained or repeated high-energy water flow rather than intermittent saturation

2. Cumulative Thickness and Proportional Impact

The cumulative thickness of water-affected material is 15.90 m, representing 20.0% of the entire borehole.

This is the highest proportional impact recorded in any of the Stonehenge Bottom boreholes so far.

In other words:

  • One fifth of the entire subsurface sequence has been reworked or deposited by water
  • In a borehole only 28 m deep
  • At a relatively low elevation

This alone rules out marginal or incidental hydrological explanations.


3. Material Composition: A High-Energy Signature

Unlike the other boreholes, SU14SW99 (R157) is overwhelmingly dominated by coarse clastic material:

  • Pebbles / Gravel
    • 11 bands
    • 9.60 m thickness
      This is the single largest contributor, accounting for over 60% of the total water-affected thickness.
  • Cobbles
    • 6 bands
    • 6.30 m thickness
      The presence of multiple cobble horizons of this thickness indicates repeated competence, not a one-off event.

All other categories — shells, sands, chalk paste, organics, solution features — are either absent or present only as zero-depth indicators.

This composition is diagnostic of:

  • Strong, persistent flow
  • Capable of transporting coarse material
  • With little opportunity for fine sediment settling or organic accumulation

4. Elevation Constraints and Hydrological Control

Two independent indicators converge tightly:

  • Highest Flood Evidence: 75.50 m OD
  • Highest Below Glacial Top: 75.50 m OD

The absence of shell evidence (N/A) is not a weakness — it is expected in this context. At this energy level and elevation, shell material would be:

  • Transported further downslope
  • Destroyed mechanically
  • Or never deposited due to flow conditions

This reinforces, rather than undermines, the interpretation of a high-energy flow corridor.


5. Zero-Depth Entries and Interpretation

The borehole records 12 zero-depth entries, a moderate number relative to event count.

This pattern suggests:

  • Repeated identification of coarse material without measurable thickness
  • Lateral reworking and scouring
  • A dynamic environment where deposition and erosion alternated

This is not a quiet floodplain or marsh — it is a conduit.


6. System-Level Interpretation

SU14SW99 (R157) represents the transport spine of the Stonehenge Bottom hydrological system.

When placed in context:

  • R18 shows prolonged, fine-grained, high-frequency interaction (deep, persistent water)
  • R15a captures marginal persistence and retreat
  • R16 documents late-stage contraction at low elevations
  • R157 records where the water actually moved

This borehole answers the question: if the landscape was flooded, where did the water go?

The answer is: through here.


7. Why This Borehole Is Critical

R157 eliminates a common escape route for denial.

High-energy gravel and cobble dominance:

  • Cannot be periglacial patterned ground
  • Cannot be dry colluvium
  • Cannot be cultural backfill
  • Cannot be explained by isolated meltwater pulses

Combined with the borehole network, it demonstrates a structured, hierarchical hydrological system — not random deposition.


8. Closing Interpretation

SU14SW99 (R157) is not an anomaly.
It is the necessary downstream counterpart to the finer, higher-elevation records.

Together, the boreholes describe:

  • Source zones
  • Marginal zones
  • Retreat phases
  • And transport corridors

That coherence is not interpretive — it is numerical.

(Stonehenge: Borehole Evidence)

Borehole Analysis – SU14SW63 (19A), Stonehenge Bottom

The borehole SU14SW63 (19A) represents one of the highest-elevation hydrological records within the Stonehenge Bottom dataset. With a ground level of 106.33 m OD and a borehole depth of 45.00 m, this core captures water-related activity well above levels that are normally assumed to be dry chalk downland.


1. Event Density and System Persistence

A total of 88 discrete bands are recorded, all classed as water-related horizons. This is a high event count for a borehole at this elevation and immediately undermines any argument that water activity was confined to low-lying zones only.

The average measured event size of 0.13 m matches closely with R18 and R16, indicating frequent, fine-scale hydrological interactions rather than a few large depositional events.

This is the signature of persistence, not anomaly.


2. Cumulative Thickness vs Borehole Depth

The cumulative thickness of water-affected material is 11.41 m, representing 10.73% of the borehole depth.

At over 106 m OD, this proportion is striking. It demonstrates that elevated areas experienced repeated and measurable water interaction, not occasional surface runoff or isolated disturbance.

In chalk geology, this level of reworking at elevation demands a sustained hydrological driver.


3. Material Composition: Mixed-Energy Environment

The matrix breakdown shows a balanced and internally consistent material profile, characteristic of a fluctuating but active water regime:

  • Pebbles / Gravel
    • 27 bands
    • 4.82 m thickness
      The dominant contributor by thickness, indicating repeated transport under moderate flow conditions.
  • Cobbles
    • 8 bands
    • 2.02 m thickness
      Multiple cobble horizons distributed across events rule out single-episode deposition and imply recurring competence.
  • Sand / Silt / Marl
    • 23 bands
    • 1.02 m thickness
      Frequent but thin deposits, consistent with settling during pauses or slack water conditions.
  • Chalk Paste / Soft Chalk
    • 7 bands
    • 2.80 m thickness
      Strong evidence of chalk dissolution and redeposition under prolonged saturation rather than mechanical erosion.
  • Shell Fragments
    • 6 bands
    • 0.28 m thickness
      Crucially, shell material is present at this elevation, reinforcing water-borne introduction rather than in situ fossil exposure.
  • Organic Staining / Peat
    • 7 bands
    • 0.35 m thickness
      Indicates intermittent waterlogging and organic accumulation, incompatible with a permanently dry landscape.

The near-absence of solution void thickness suggests active water movement, not long-term stagnant pooling.


4. Elevation Constraints and Convergence

Three key elevation markers frame the hydrological envelope:

  • Highest Flood Evidence: 105.50 m OD
  • Highest Below Glacial Top: 102.83 m OD
  • Highest Shell Evidence: 94.53 m OD

The separation between flood indicators and shell evidence is instructive. It implies that water reached higher elevations than shell transport, consistent with fluctuating water levels and variable energy conditions rather than a single static shoreline.

This vertical ordering is internally coherent and physically plausible.


5. Zero-Depth Entries and Event Character

Only 7 zero-depth entries are recorded — low relative to the total band count.

This suggests:

  • Most water interactions resulted in measurable deposition or reworking
  • The system at this elevation was consistently active, not marginal or intermittent
  • Hydrological processes here were sustained long enough to leave thickness signatures

6. Interpretation in the Wider System

SU14SW63 (19A) demonstrates that post-glacial water activity extended into the higher landscape, not just valley bottoms or transport corridors.

When integrated with the other boreholes:

  • R18 shows deep, persistent saturation
  • R15a captures marginal retreat
  • R16 records late-stage contraction
  • R157 defines high-energy transport
  • R19A confirms upper-level system reach

This completes the vertical profile of the hydrological system.


7. Why This Borehole Matters

R19A closes off one of the most common escape routes in denial-based explanations:
the claim that “higher ground must have remained dry”.

The data shows otherwise — quantitatively.

Repeated water interaction at over 105 m OD, involving gravels, cobbles, chalk paste, shells, and organics, cannot be explained by:

  • Periglacial patterned ground
  • Dry colluvial processes
  • Isolated meltwater pulses
  • Cultural disturbance

It requires a sustained, elevated water regime.


8. Closing Interpretation

SU14SW63 (19A) demonstrates that post-glacial water activity at Stonehenge Bottom was:

  • Vertically extensive
  • Long-lived
  • Internally structured
  • And mathematically consistent across boreholes

This is not a collection of anomalies — it is a system.

(Stonehenge: Borehole Evidence)

Borehole Analysis – SU14SW26 (P3), Stonehenge Bottom

The borehole SU14SW26 (P3) samples one of the highest hydrologically active elevations recorded beneath Stonehenge Bottom. With a ground level of 109.48 m OD and a borehole depth of 31.3 m, it provides a critical constraint on the upper vertical reach of post-glacial water influence within the system.

Despite its elevation, the borehole records clear, repeated water-related activity that cannot be reconciled with a dry chalk-downland model.


1. Event Density and System Behaviour

A total of 17 discrete water-related horizons are recorded.

At first glance this is a lower event count than deeper or lower-lying boreholes — but this is exactly what is expected at the upper fringe of a waning hydrological system. What matters is not the absolute count, but the nature, composition, and elevation of those events.

The average measured event size is 0.18 m, which is larger than many lower-elevation boreholes. This indicates that when water reached this elevation, it did so with sufficient energy and duration to produce measurable depositional thickness, not ephemeral wetting.

This is intermittent persistence, not noise.


2. Cumulative Thickness vs Borehole Depth

The cumulative thickness of water-affected material is 3.08 m, representing 9.84% of the total borehole depth.

For a borehole beginning at 109.48 m OD, this proportion is highly significant. Nearly one-tenth of the entire stratigraphic column shows direct water modification at an elevation normally assumed to lie well above any sustained hydrological influence.

In chalk geology, this cannot be produced by rainfall percolation or slope wash alone.


3. Material Composition – Competent but Selective Transport

The matrix breakdown shows a selective, energy-filtered assemblage, characteristic of upper-limit water reach rather than a core flow zone.

Pebbles / Gravel
6 bands | 1.11 m thickness
The dominant component, indicating repeated moderate-energy transport capable of moving coarse material to this elevation.

Cobbles
2 bands | 0.25 m thickness
Sparse but decisive. Even limited cobble presence at this height is incompatible with dry or periglacial explanations.

Flint Sand / Reworked Flint
3 bands | 0.71 m thickness
Indicates reworking of chalk-derived material under flowing water, not in situ weathering.

Organic Staining / Peat
5 bands | 1.01 m thickness
A critical signal. Organic accumulation at this elevation requires periodic waterlogging, not merely damp soil.

Sand / Silt / Marl
1 band | 0.00 m thickness
Recorded as an event but without measurable thickness, consistent with brief slack-water phases at the system margin.

Notably absent are chalk paste / soft chalk and solution void development, indicating that water presence here was active and transient, not permanently saturating.


4. Elevation Constraints and Hydrological Ceiling

Three elevation markers define the upper envelope:

  • Highest Flood Evidence: 106.70 m OD
  • Highest Below Glacial Top: 104.15 m OD
  • Highest Shell Evidence: N/A

The absence of shell material is not a weakness — it is expected. Shell transport requires lower energy thresholds and longer residence times, which diminish at the system’s upper edge.

What matters is that gravel, flint sand, and organics still occur well above 106 m OD, demonstrating that water repeatedly reached this height even when shell transport did not.

This establishes vertical zonation, not contradiction.


5. Zero-Depth Entries and Event Character

Only one zero-depth entry is recorded.

This confirms that almost every detected water interaction produced measurable sedimentary or geochemical impact. The system was not marginally brushing this elevation — it was physically interacting with it.


6. Interpretation Within the Stonehenge Bottom System

SU14SW26 (P3) represents the upper expression of the same hydrological system recorded more fully in deeper boreholes.

When integrated vertically:

  • Lower boreholes record persistent saturation
  • Mid-level boreholes record frequent reworking
  • P3 records intermittent but competent reach

This is exactly the pattern expected from a large, declining post-glacial water body or expanded river system, not from isolated floods or localised processes.


7. Why P3 Matters

P3 removes the final refuge of the “dry uplands” argument.

Even at nearly 110 m OD, the stratigraphy shows:

  • Repeated gravel transport
  • Organic waterlogging
  • Reworked flint sands
  • Measurable cumulative thickness

None of this can be explained by:

  • Rainwash
  • Periglacial patterned ground
  • Soil creep
  • Human disturbance

It requires a coherent, elevated hydrological regime.


8. Closing Interpretation

SU14SW26 (P3) demonstrates that post-glacial water activity at Stonehenge Bottom:

  • Reached extreme elevations
  • Operated intermittently but effectively
  • Was sediment-competent
  • Followed a vertically structured system

This borehole does not record an anomaly.

It records the upper boundary of a real, measurable hydrological landscape.

(Stonehenge: Borehole Evidence)

Borehole Analysis – SU14SW64 (R20), Stonehenge Bottom

The borehole SU14SW64 (R20) provides one of the most hydrologically intense records within the Stonehenge Bottom dataset. With a ground level of 103.90 m OD and a borehole depth of 35.00 m, it captures prolonged and repeated water activity across a substantial vertical range.

This borehole does not represent marginal flooding or episodic disturbance. It records a core operational zone of the post-glacial hydrological system.


1. Event Density and Hydrological Persistence

A total of 62 discrete water-related horizons are recorded.

This is a very high event count and places R20 firmly within the persistent interaction zone of the system rather than its upper fringe or terminal retreat phase.

The average measured event size of 0.16 m closely matches values seen across other active boreholes, indicating frequent, repeatable depositional and reworking events rather than a small number of large floods.

This is the signature of a stable but dynamic hydrological regime operating over extended time.


2. Cumulative Thickness vs Borehole Depth

The cumulative thickness of water-affected material is 8.34 m, representing 23.83% of the total borehole depth.

Nearly one quarter of the entire stratigraphic column has been directly modified by water processes. In chalk terrain, this degree of reworking cannot be generated by surface runoff, slope wash, or isolated high-energy pulses.

It requires long-lived water presence with repeated flow and reworking, consistent with an enlarged river, flooded valley system, or lake-margin environment.


3. Material Composition – Sustained Mixed-Energy Conditions

The matrix breakdown shows a balanced and internally consistent material assemblage, indicative of fluctuating but persistent hydrological energy.

Pebbles / Gravel
23 bands | 5.19 m thickness
The dominant contributor by thickness, demonstrating repeated moderate-energy transport capable of sustained gravel movement.

Sand / Silt / Marl
25 bands | 2.32 m thickness
The highest band count in the matrix, reflecting frequent slack-water or waning-flow phases between higher-energy events.

Cobbles
4 bands | 0.42 m thickness
Discrete cobble horizons confirm that transport competence repeatedly exceeded gravel thresholds, even if intermittently.

Shell Fragments
6 bands | 0.07 m thickness
Shell material is present well below the flood ceiling, indicating transport during calmer or lower-energy phases within the system.

Flint Sand / Reworked Flint
4 bands | 0.34 m thickness
Evidence of repeated reworking of chalk-derived material under flowing water rather than in situ weathering.

Notably absent are chalk paste / soft chalk and solution void thickness, indicating that water movement here was predominantly advective, not long-term stagnant saturation.


4. Elevation Constraints and Vertical Structure

Three elevation markers define the hydrological envelope:

  • Highest Flood Evidence: 103.90 m OD
  • Highest Below Glacial Top: 99.93 m OD
  • Highest Shell Evidence: 88.43 m OD

The coincidence of the highest flood evidence with ground level indicates that water repeatedly reached or occupied the full surface elevation at this location.

The vertical separation between flood indicators and shell transport shows energy stratification within the system: high water levels were achieved more frequently than conditions suitable for shell movement.

This ordering is internally coherent and physically expected in a fluctuating water body or expanded river regime.


5. Zero-Depth Entries and Event Resolution

A total of 10 zero-depth entries are recorded.

Even with these included, the borehole still shows substantial cumulative thickness, confirming that the majority of hydrological events resulted in measurable sedimentary impact. Zero-depth entries here likely represent brief reactivation phases rather than noise or misclassification.


6. Interpretation Within the Stonehenge Bottom System

R20 occupies the central operational band of the Stonehenge Bottom hydrological system.

When placed in vertical context:

  • Higher boreholes (e.g. P3) record intermittent upper reach
  • R20 records frequent, sustained interaction
  • Lower boreholes record persistent saturation and deeper reworking

This is exactly the structure expected from a large, gradually contracting post-glacial water system, not from isolated floods or localised periglacial processes.


7. Why R20 Matters

R20 directly contradicts any model that limits water activity to valley floors or assumes rapid post-glacial drainage.

At just under 104 m OD, it records:

  • Repeated gravel and cobble transport
  • Frequent slack-water deposition
  • Shell-bearing horizons
  • Nearly 24% stratigraphic reworking

These observations cannot be explained by:

  • Rainwash
  • Colluvium
  • Periglacial patterned ground
  • Human disturbance

They require a persistent, system-wide hydrological regime.


8. Closing Interpretation

SU14SW64 (R20) demonstrates that post-glacial water activity at Stonehenge Bottom was:

  • Persistent and vertically extensive
  • Capable of sustained sediment transport
  • Internally structured by energy regime
  • Consistent with neighbouring boreholes

This borehole does not record an edge case or anomaly.

It records the functional core of the hydrological system.

(Stonehenge: Borehole Evidence)

Borehole Analysis – SU14SW65 (R21), Stonehenge Bottom

The borehole SU14SW65 (R21) represents the highest-elevation hydrological record yet identified within the Stonehenge Bottom dataset. With a ground level of 109.90 m OD and a borehole depth of 26.80 m, it defines the upper ceiling of sustained post-glacial water interaction across the landscape.

Crucially, this borehole does not merely record water reach — it records active sediment transport and biological input at maximum elevation.


1. Event Density and System Behaviour

A total of 39 discrete water-related horizons are recorded.

For a borehole positioned at nearly 110 m OD, this is a substantial event count and immediately contradicts any assertion that water influence faded out rapidly with elevation.

The average measured event size of 0.14 m is consistent with repeated, fine-scale hydrological interactions rather than isolated flooding. This indicates recurrence, not chance.

R21 therefore represents a high-level but repeatedly activated zone of the hydrological system.


2. Cumulative Thickness vs Borehole Depth

The cumulative thickness of water-affected material is 3.75 m, representing 14% of the total borehole depth.

At this elevation, this proportion is highly significant. More than one-seventh of the stratigraphic column shows direct water modification, which cannot be explained by rainfall percolation, slope wash, or soil processes alone.

In chalk geology, this degree of reworking at elevation requires repeated saturation and flow, not incidental wetting.


3. Material Composition – Upper-Limit Mixed Regime

The matrix breakdown reveals a diverse but energy-attenuated assemblage, exactly what is expected at the upper boundary of a declining water system.

Organic Staining / Peat
11 bands | 1.32 m thickness
The dominant contributor by thickness. This indicates prolonged or repeated waterlogging, not transient surface moisture.

Sand / Silt / Marl
5 bands | 1.08 m thickness
Frequent fine sediment deposition, consistent with slack-water phases or shallow standing water.

Flint Sand / Reworked Flint
6 bands | 0.44 m thickness
Clear evidence of reworking of chalk-derived material under moving water.

Solution Features / Voids
5 bands | 0.52 m thickness
This is critical. Solution features at this elevation demonstrate prolonged saturation and dissolution, not rapid through-flow.

Pebbles / Gravel
5 bands | 0.28 m thickness

Cobbles
2 bands | 0.11 m thickness
Although reduced in volume, the presence of coarse material at this elevation confirms transport competence, even at the system’s upper limit.

Shell fragments are recorded as events without thickness, indicating biological presence during flooding phases, even if transport energy was insufficient for accumulation.


4. Elevation Constraints and Hydrological Ceiling

Three elevation markers define the system apex:

  • Highest Flood Evidence: 109.15 m OD
  • Highest Shell Evidence: 109.15 m OD
  • Highest Below Glacial Top: 106.20 m OD

The coincidence of flood evidence and shell presence at the same elevation is decisive. This demonstrates that biologically active water reached the highest levels recorded in the dataset, not merely sterile flooding.

This marks R21 as the hydrological ceiling, not a marginal outlier.


5. Zero-Depth Entries and Event Resolution

A total of 12 zero-depth entries are recorded.

At this elevation, this is expected and informative. It indicates brief reactivation phases where water presence was sufficient to register chemically or biologically, even if sediment deposition was minimal.

Importantly, despite these zero-depth entries, R21 still records substantial cumulative thickness, confirming that many events were long-lived enough to leave a measurable imprint.


6. Interpretation Within the Stonehenge Bottom System

R21 represents the upper saturation and ponding zone of the Stonehenge Bottom hydrological system.

When integrated vertically:

  • R20 records sustained transport and reworking
  • P3 records intermittent competent reach
  • R21 records prolonged high-level saturation with biological activity

This is the expected structure of a large, slowly declining post-glacial water body, not a series of disconnected floods.


7. Why R21 Matters

R21 closes the final escape route for dry-land interpretations.

At nearly 110 m OD, it records:

  • Organic accumulation
  • Fine sediment deposition
  • Solutional dissolution
  • Gravel and cobble transport
  • Shell presence at peak water level

None of this can be explained by:

  • Rainfall infiltration
  • Periglacial processes
  • Soil creep
  • Cultural disturbance

It requires persistent water at elevation.


8. Closing Interpretation

SU14SW65 (R21) demonstrates that post-glacial water activity at Stonehenge Bottom:

  • Reached its maximum vertical extent
  • Was biologically active
  • Produced dissolution and accumulation
  • Persisted long enough to reshape chalk stratigraphy

This borehole does not represent an anomaly.

It represents the hydrological ceiling of the entire system.

(Stonehenge: Borehole Evidence)

Borehole Analysis – SU14SW66 (R22), Stonehenge Bottom

The borehole SU14SW66 (R22) occupies a mid–upper elevation position within the Stonehenge Bottom dataset. With a ground level of 106.10 m OD and a borehole depth of 20.85 m, it samples a zone transitional between the high-energy transport regime seen in R20 and the upper saturation ceiling defined by R21.

What distinguishes R22 is not coarse transport, but intensive dissolution and fine-phase water interaction, marking it as a hydrologically active but energy-attenuated zone.


1. Event Density and Hydrological Behaviour

A total of 24 discrete water-related horizons are recorded.

For a relatively shallow borehole, this is a high interaction density, confirming that water influence was not occasional or superficial. The average measured event size of 0.16 m matches the system-wide norm, indicating that R22 was not marginal to the hydrological system but repeatedly reactivated.

This is not a “quiet” borehole — it is chemically and hydraulically busy.


2. Cumulative Thickness vs Borehole Depth

The cumulative thickness of water-affected material is 3.39 m, representing 16.25% of the total borehole depth.

That means one-sixth of the entire stratigraphic column has been modified by water processes. In chalk geology, this proportion cannot be produced by soil moisture, rain percolation, or downslope creep.

It requires recurrent saturation and circulation, even if flow energy was limited.


3. Material Composition – Dissolution-Dominated Regime

The matrix breakdown shows a strong dominance of low-energy and chemical water effects, rather than mechanical transport.

Solution Features / Voids
12 bands | 1.96 m thickness
This is the defining characteristic of R22. Nearly 2 metres of solutional modification indicates prolonged or repeated chalk dissolution under saturated conditions.

This cannot occur under brief flooding or dry conditions.

Sand / Silt / Marl
10 bands | 1.37 m thickness
Frequent fine sediment deposition, consistent with standing or slow-moving water phases.

Flint Sand / Reworked Flint
1 band | 0.06 m thickness
Limited reworking of chalk-derived material, indicating some movement but low transport competence.

Cobbles
1 band | 0.00 m thickness
Recorded as an event but without accumulation — indicating threshold transport conditions, not absence of water.

Notably absent are pebbles / gravel, organic staining, and shell accumulation, which is exactly what is expected where water presence is persistent but energy is low.


4. Elevation Constraints and System Position

Three elevation markers define R22’s placement within the system:

  • Highest Flood Evidence: 103.84 m OD
  • Highest Below Glacial Top: 102.35 m OD
  • Highest Shell Evidence: N/A

The absence of shell material is not anomalous. Shell transport requires lower-energy persistence combined with biological residence time — conditions that develop further upslope (R21) or downslope (R20), not in a dissolution-dominated mid-zone.

What matters is that floodwater repeatedly occupied levels above 103 m OD, producing solutional voids and fine sediment accumulation.


5. Zero-Depth Entries and Event Resolution

Only 3 zero-depth entries are recorded.

This confirms that most hydrological events in R22 produced measurable stratigraphic or chemical impact. The water presence here was not fleeting — it was sustained long enough to dissolve chalk and redeposit fines.


6. Interpretation Within the Stonehenge Bottom System

R22 represents the chemical core of the hydrological system.

When placed in vertical context:

  • R20 shows sustained mechanical transport
  • R22 shows prolonged dissolution and fine deposition
  • P3 shows intermittent competent reach
  • R21 shows upper-level saturation and biological activity

This is exactly the internal stratification expected within a large, long-lived post-glacial water body undergoing gradual retreat.


7. Why R22 Matters

R22 destroys the false dichotomy between “wet valleys” and “dry uplands”.

At over 106 m OD, it records:

  • Extensive chalk dissolution
  • Repeated fine sediment deposition
  • High event density
  • Significant cumulative thickness

These features cannot be produced by:

  • Rainwater percolation
  • Periglacial freeze–thaw
  • Soil creep
  • Short-lived floods

They require persistent saturation and circulation.


8. Closing Interpretation

SU14SW66 (R22) demonstrates that post-glacial water activity at Stonehenge Bottom:

  • Was not solely mechanical — it was chemically transformative
  • Operated repeatedly at mid–upper elevations
  • Persisted long enough to reshape chalk structure
  • Forms an essential internal component of the wider system

This borehole is not a weak link.

It is the chemical engine of the hydrological model.

(Stonehenge: Borehole Evidence)

Borehole Analysis – SU14SW100 (R158), Stonehenge Bottom

The borehole SU14SW100 (R158) samples a deep, mechanically active sector of the Stonehenge Bottom hydrological system. With a ground level of 107.30 m OD and a borehole depth of 50.00 m, it captures a long vertical record that bridges upper flood reach and deeper system reworking.

This borehole is defined by high transport competence combined with measurable solutional modification.


1. Event Density and Hydrological Behaviour

A total of 31 discrete water-related horizons are recorded.

While the event count is lower than some mid-core boreholes, the average measured event size of 0.22 m is the largest recorded across the dataset to date. This indicates fewer but substantially more energetic or longer-duration events.

R158 therefore records hydrological intensity, not marginal interaction.


2. Cumulative Thickness vs Borehole Depth

The cumulative thickness of water-affected material is 6.70 m, representing 13.40% of the total borehole depth.

Given the depth of the borehole, this proportion is significant. Nearly seven metres of the stratigraphic column have been directly modified by water, confirming sustained system engagement through time.

This level of reworking cannot be generated by isolated floods or short-lived periglacial melt pulses.


3. Material Composition – Transport-Dominated Regime

The matrix breakdown shows a clear dominance of mechanically transported material, distinguishing R158 from dissolution-dominated boreholes such as R22.

Pebbles / Gravel
14 bands | 4.50 m thickness
The dominant component by thickness. Repeated gravel transport over such thickness requires persistent moderate-to-high energy flow.

Sand / Silt / Marl
11 bands | 1.15 m thickness
Frequent fine deposition between higher-energy events, indicating fluctuating but sustained flow conditions.

Cobbles
2 bands | 0.10 m thickness
Discrete cobble horizons confirm episodic peaks in transport competence.

Solution Features / Voids
4 bands | 0.95 m thickness
Evidence of prolonged water–chalk interaction, indicating that saturation phases accompanied mechanical transport.

Notably absent are shell fragments and organic staining, suggesting that this sector favoured through-flow and transport rather than biological residence or stagnant conditions.


4. Elevation Constraints and System Envelope

Three elevation markers define R158’s hydrological context:

  • Highest Flood Evidence: 103.84 m OD
  • Highest Below Glacial Top: 102.35 m OD
  • Highest Shell Evidence: N/A

Flood evidence reaching above 103 m OD confirms that water repeatedly occupied high elevations even in this mechanically dominated zone. The absence of shell material is expected under higher-energy flow regimes, where biological accumulation is suppressed.


5. Zero-Depth Entries and Event Resolution

A total of 10 zero-depth entries are recorded.

In the context of large average event size, these entries likely represent high-energy flushing phases that reworked existing material without leaving new depositional thickness.

This reinforces the interpretation of energetic flow, not weak interaction.


6. Interpretation Within the Stonehenge Bottom System

R158 occupies the high-energy transport corridor of the system.

When integrated vertically:

  • R158 records energetic gravel-dominated transport
  • R20 records sustained mixed-energy interaction
  • R22 records dissolution and fine-phase dominance
  • P3 records intermittent upper reach
  • R21 records saturation and biological ceiling

This internal differentiation is exactly what is expected within a large, complex, and long-lived post-glacial hydrological system.


7. Why R158 Matters

R158 demonstrates that the Stonehenge Bottom system was not only extensive, but hydraulically powerful.

At elevations exceeding 103 m OD, it records:

  • Thick gravel packages
  • High average event size
  • Repeated transport competence
  • Associated solutional modification

These features cannot be explained by:

  • Rain-driven runoff
  • Periglacial disturbance
  • Soil processes
  • Isolated meltwater events

They require a sustained, system-wide flow regime.


8. Closing Interpretation

SU14SW100 (R158) confirms that post-glacial water activity at Stonehenge Bottom:

  • Included high-energy transport corridors
  • Persisted through deep stratigraphy
  • Operated repeatedly rather than episodically
  • Forms an integral component of a coherent system

This borehole is not peripheral.

It is one of the engines of the system.

(Stonehenge: Borehole Evidence)

Borehole Analysis – SU14SW25 (P2), Stonehenge Bottom

The borehole SU14SW25 (P2) represents the deepest, most hydrologically saturated record within the Stonehenge Bottom dataset. With a ground level of 80.88 m OD and a borehole depth of 35.70 m, it captures the core basin environment of the post-glacial system.

This borehole does not merely show water influence — it records dominance by water.


1. Event Density and Hydrological Persistence

A total of 95 discrete water-related horizons are recorded — the highest event count in the entire dataset.

This alone establishes P2 as the long-term locus of hydrological activity. There is no interpretation under which 95 independent water events can be explained by episodic flooding or short-lived processes.

The average measured event size of 0.24 m is also the largest in the dataset, indicating that events here were not only frequent, but long-lived and volumetrically significant.

This is persistence at scale.


2. Cumulative Thickness vs Borehole Depth

The cumulative thickness of water-affected material is 18.28 m, representing 51.20% of the entire borehole depth.

More than half of the stratigraphic column has been directly modified by water processes.

In chalk geology, this level of reworking is unequivocal. It cannot be produced by surface runoff, periglacial action, or isolated flood pulses. It requires continuous or repeatedly sustained saturation over extended periods.

P2 is not a marginal environment — it is a hydrological basin.


3. Material Composition – Full-Spectrum Water Regime

The matrix breakdown shows every major water-related process operating together, making P2 the most complete expression of the system.

Cobbles
15 bands | 3.27 m thickness
Repeated high-energy transport episodes, confirming strong flow competence within the basin.

Pebbles / Gravel
28 bands | 2.96 m thickness
Sustained moderate-energy transport dominating the system.

Sand / Silt / Marl
12 bands | 3.23 m thickness
Frequent slack-water deposition, consistent with fluctuating water levels and waning flow.

Chalk Paste / Soft Chalk
6 bands | 3.29 m thickness
Extensive chalk dissolution and redeposition, indicating prolonged saturation rather than mechanical erosion.

Organic Staining / Peat
14 bands | 2.23 m thickness
Strong evidence of long-term waterlogging and biological accumulation.

Solution Features / Voids
9 bands | 2.25 m thickness
Substantial chemical modification of the chalk matrix, confirming sustained groundwater presence.

Shell Fragments
8 bands | 0.86 m thickness
Biological material transported and deposited well within the system, marking stable aquatic conditions during multiple phases.

This is not a selective assemblage — it is a complete hydrological signature.


4. Elevation Constraints and Basin Position

Three elevation markers define P2’s position:

  • Highest Flood Evidence: 78.18 m OD
  • Highest Below Glacial Top: 77.38 m OD
  • Highest Shell Evidence: 66.58 m OD

These values show that P2 sits entirely within the long-term flooded zone, with shell transport occurring well below peak flood levels — a classic indicator of deep, stable water bodies with internal energy stratification.


5. Zero-Depth Entries and System Stability

A total of 20 zero-depth entries are recorded.

At this scale, zero-depth entries do not weaken the signal — they reinforce it. They indicate frequent reactivation, reworking, and flushing within an already saturated environment.

Despite these, cumulative thickness remains extreme, confirming persistent occupancy by water.


6. Interpretation Within the Stonehenge Bottom System

P2 is the hydrological core of the entire system.

When integrated vertically:

  • P2 = deep basin, long-term saturation
  • R158 / R20 = transport corridors feeding the basin
  • R22 = dissolution and internal circulation zone
  • P3 = intermittent upper reach
  • R21 = saturation ceiling

This is a single, vertically structured water system, not a set of unrelated deposits.


7. Why P2 Matters

P2 makes dry-land interpretations untenable.

It records:

  • Continuous gravel and cobble transport
  • Extensive chalk dissolution
  • Organic and shell accumulation
  • More than 50% stratigraphic reworking

No combination of:

  • Rainfall
  • Periglacial processes
  • Soil creep
  • Cultural disturbance

can produce this signature.

It requires a large, long-lived post-glacial water body.


8. Closing Interpretation

SU14SW25 (P2) demonstrates that post-glacial water activity at Stonehenge Bottom was:

  • Deep and persistent
  • Mechanically powerful
  • Chemically transformative
  • Biologically active
  • Structurally organised

This borehole is not evidence of the system.

It is the system.

(Stonehenge: Borehole Evidence)

Borehole Analysis – SU14SW56 (R12), Stonehenge Bottom

The borehole SU14SW56 (R12) represents one of the most intensively water-dominated stratigraphic records in the Stonehenge Bottom dataset. With a ground level of 92.40 m OD and a borehole depth of 24.90 m, it captures a zone that was persistently saturated and repeatedly reworked throughout the post-glacial period.

This borehole does not reflect episodic flooding. It records near-continuous hydrological occupation.


1. Event Density and Hydrological Persistence

A total of 46 discrete water-related horizons are recorded.

For a borehole under 25 m deep, this is an extremely high event density. More importantly, the average measured event size of 0.54 m is by far the largest in the entire dataset, indicating that individual hydrological phases here were long-lived, voluminous, and stable.

This is not pulse behaviour — it is sustained system dominance.


2. Cumulative Thickness vs Borehole Depth

The cumulative thickness of water-affected material is 21.45 m, representing 86.30% of the entire borehole depth.

This is decisive.

In chalk geology, there is no dry-land mechanism capable of modifying over four-fifths of a stratigraphic column. This proportion alone demonstrates that R12 sat within a long-term flooded or saturated environment, not at its margins.

R12 is not influenced by the system — it is embedded within it.


3. Material Composition – Saturation-Dominated Basin Regime

The matrix breakdown shows a dominance of dissolution, fine deposition, and organic accumulation, characteristic of prolonged saturation.

Chalk Paste / Soft Chalk
6 bands | 10.90 m thickness
The single most important signal. Massive chalk dissolution and redeposition at this scale requires extended submergence, not mechanical erosion.

Sand / Silt / Marl
12 bands | 5.66 m thickness
Repeated fine-grained settling, consistent with standing or very slow-moving water.

Pebbles / Gravel
28 bands | 2.56 m thickness
Frequent but attenuated transport, indicating intermittent energy input into an otherwise saturated environment.

Organic Staining / Peat
14 bands | 1.13 m thickness
Clear evidence of long-term waterlogging and biological productivity.

Solution Features / Voids
9 bands | 0.87 m thickness
Confirms sustained chemical interaction between water and chalk.

Cobbles
15 bands | 0.24 m thickness
Low thickness but frequent events, consistent with reduced transport competence in a saturated basin.

Shell fragments are recorded as events without thickness, indicating biological presence but limited transport or preservation under prevailing conditions.


4. Elevation Constraints and Basin Position

Three elevation markers define R12’s hydrological context:

  • Highest Flood Evidence: 91.90 m OD
  • Highest Below Glacial Top: 88.31 m OD
  • Highest Shell Evidence: 84.62 m OD

These values place R12 well within the long-term flooded interior of the system, below the more dynamic transport corridors and far beneath the upper saturation ceiling.

Shell presence well below flood maxima is exactly what is expected in a deep, stable water body with internal energy stratification.


5. Zero-Depth Entries and System Stability

Only 6 zero-depth entries are recorded.

At this scale of cumulative thickness, this indicates that the vast majority of hydrological events were depositional or chemically active, not transient or ineffective.

The system here was stable enough to accumulate, dissolve, and preserve.


6. Interpretation Within the Stonehenge Bottom System

R12 represents the lower saturated basin wall of the Stonehenge Bottom hydrological system.

Placed in vertical context:

  • P2 = deepest basin core
  • R12 = sustained saturation and dissolution zone
  • R158 / R20 = transport corridors
  • R22 = chemical circulation zone
  • P3 = intermittent upper reach
  • R21 = saturation ceiling

This arrangement is internally coherent and hydraulically inevitable.


7. Why R12 Matters

R12 eliminates any residual argument for predominantly dry conditions at mid-low elevations.

It records:

  • Massive chalk dissolution
  • Persistent fine sedimentation
  • Organic accumulation
  • High event thickness
  • Near-total stratigraphic modification

No combination of:

  • Rainfall
  • Periglacial action
  • Soil processes
  • Cultural disturbance

can account for this signature.

It requires long-term standing or slowly circulating water.


8. Closing Interpretation

SU14SW56 (R12) demonstrates that post-glacial water activity at Stonehenge Bottom was:

  • Deeply persistent
  • Chemically dominant
  • Biologically active
  • Structurally organised

This borehole is not transitional.

It is unequivocal evidence of long-term inundation.

(Stonehenge: Borehole Evidence)

Borehole Analysis – SU14SW24 (P1), Stonehenge Bottom

The borehole SU14SW24 (P1) records a long-lived, water-dominated interior basin environment within the Stonehenge Bottom system. With a ground level of 96.12 m OD and a borehole depth of 35.80 m, it captures sustained saturation, extensive chalk dissolution, and repeated sedimentary reworking over a prolonged period.

This is not a marginal wet zone. It is a structurally flooded interior.


1. Event Density and Hydrological Persistence

A total of 56 discrete water-related horizons are recorded.

This remains a high event count, confirming repeated system reactivation. The average measured event size of 0.37 m indicates that individual hydrological phases were long-duration and volumetrically significant, not brief pulses.

The corrected band distribution strengthens this interpretation: fewer but thicker events dominate key materials, consistent with stable, sustained water phases rather than rapid oscillation.


2. Cumulative Thickness vs Borehole Depth

The cumulative thickness of water-affected material is 17.94 m, representing 50.11 % of the total borehole depth.

Half of the entire stratigraphic column has been directly modified by water. In chalk geology, this degree of reworking is only achievable under long-term saturation or standing water conditions.

P1 is therefore structurally embedded within the flooded system.


3. Material Composition – Saturated Interior Basin Regime

The corrected matrix shows a strong concentration of thickness into fewer, thicker bands, a hallmark of prolonged stable conditions.

Chalk Paste / Soft Chalk
15 bands | 10.30 m thickness
This is the dominant signal. Massive chalk dissolution and redeposition at this scale requires extended submergence, not surface wetting or mechanical erosion. The increased band count here reinforces sustained chemical activity.

Sand / Silt / Marl
8 bands | 3.49 m thickness
Fewer bands but substantial thickness indicates long slack-water phases, consistent with a deep, slow-moving or standing water body.

Organic Staining / Peat
7 bands | 0.92 m thickness
Organic accumulation under persistent waterlogging, not transient inundation.

Solution Features / Voids
4 bands | 1.41 m thickness
Lower band count but significant thickness confirms prolonged dissolution events, not repeated minor incursions.

Pebbles / Gravel
12 bands | 0.88 m thickness

Cobbles
6 bands | 0.44 m thickness
Reduced band counts with preserved thickness indicate occasional energy input into an otherwise saturated environment, not continuous transport.

Flint Sand / Reworked Flint
3 bands | 0.50 m thickness
Minor but repeated reworking under water.

Shell Fragments
1 band | 0.00 m thickness
Biological presence without accumulation — consistent with deep or low-energy interior conditions rather than shoreline processes.


4. Elevation Constraints and System Position

The elevation markers remain unchanged and internally coherent:

  • Highest Flood Evidence: 94.12 m OD
  • Highest Below Glacial Top: 92.26 m OD
  • Highest Shell Evidence: 85.36 m OD

These place P1 well below the upper saturation ceiling and above the deepest basin core. Shell evidence occurring significantly below flood maxima confirms internal energy stratification within a deep water body.


5. Zero-Depth Entries and Event Resolution

A total of 9 zero-depth entries are recorded.

Given the very large cumulative thickness and dominant thick bands, these represent minor reactivation or flushing phases within an already saturated environment. They do not dilute the signal.


6. Interpretation Within the Stonehenge Bottom System

With the corrected band structure, P1 resolves clearly as the upper interior basin:

  • P2 → deepest basin core
  • R12 → saturated basin wall
  • P1 → upper interior basin (this borehole)
  • R158 / R20 → transport corridors
  • R22 → chemical circulation zone
  • P3 → intermittent upper reach
  • R21 → saturation ceiling

The reduction in band counts but preservation of thickness in P1 strengthens the case for long-duration stillwater or slow-circulation conditions, not fluctuating margins.


7. Why the Correction Matters

The corrected matrix actually reinforces the model.

Fewer, thicker bands mean:

  • Longer water residence times
  • Fewer energetic interruptions
  • Greater chemical dominance

This makes dry-land, periglacial, or rainwash explanations even less viable than before.


8. Closing Interpretation

SU14SW24 (P1) (corrected) demonstrates that post-glacial water activity at Stonehenge Bottom was:

  • Long-lived and vertically extensive
  • Chemically dominant
  • Internally stratified
  • Structurally stable

This borehole is not transitional or ambiguous.

It is a stable interior component of a large, long-duration flooded system.

(Stonehenge: Borehole Evidence)

Borehole Analysis – SU14SW53 (R9), Stonehenge Bottom

The borehole SU14SW53 (R9) records a highly dynamic, repeatedly reactivated interior zone of the Stonehenge Bottom hydrological system. With a ground level of 99.40 m OD and a borehole depth of 35.44 m, it captures intense oscillation between saturation, biological activity, dissolution, and sediment transport.

This borehole is defined not by thickness dominance, but by extreme event frequency.


1. Event Density and Hydrological Behaviour

A total of 106 discrete water-related horizons are recorded — the highest event count of any borehole in the dataset.

This immediately rules out episodic flooding as an explanation. The average measured event size of 0.12 m is relatively small, indicating very frequent, fine-scale hydrological reactivation rather than a small number of large events.

R9 records constant system activity, with water levels repeatedly rising, circulating, and reworking material.


2. Cumulative Thickness vs Borehole Depth

The cumulative thickness of water-affected material is 13.13 m, representing 37.05% of the total borehole depth.

More than one third of the stratigraphic column has been directly modified by water. While individual events are thin, their cumulative impact is substantial, demonstrating persistence through repetition rather than volume.

This is a hallmark of long-lived but fluctuating hydrological systems.


3. Material Composition – Oscillatory Interior Regime

The matrix breakdown shows a broad-spectrum assemblage, indicating repeated shifts in energy and water chemistry.

Organic Staining / Peat
22 bands | 3.61 m thickness
The strongest thickness signal. This indicates repeated waterlogging and biological productivity, consistent with fluctuating but persistent saturation.

Solution Features / Voids
16 bands | 4.38 m thickness
Extensive chalk dissolution confirms prolonged water–chalk interaction, not brief flooding.

Pebbles / Gravel
25 bands | 2.40 m thickness
Frequent moderate-energy transport episodes, indicating repeated reactivation of flow competence.

Cobbles
16 bands | 0.92 m thickness
Numerous but thin cobble horizons indicate short-lived higher-energy pulses within an otherwise moderated system.

Flint Sand / Reworked Flint
9 bands | 1.22 m thickness
Repeated reworking of chalk-derived material under flowing water.

Sand / Silt / Marl
8 bands | 0.92 m thickness
Slack-water deposition between active phases.

Shell Fragments
10 bands | 0.04 m thickness
Biological material present but rarely accumulating, consistent with frequent disturbance rather than stable stillwater.

Notably absent is chalk paste / soft chalk, indicating that water here was mobile rather than stagnant, despite frequent saturation.


4. Elevation Constraints and System Position

R9’s elevation markers are internally coherent:

  • Highest Flood Evidence: 97.48 m OD
  • Highest Below Glacial Top: 94.55 m OD
  • Highest Shell Evidence: 93.33 m OD

These values place R9 above the deepest basin core but below the upper interior zones, exactly where repeated oscillation between transport, saturation, and biological phases would be expected.

Shell evidence occurring close to flood maxima indicates frequent but unstable biological conditions, consistent with repeated disturbance.


5. Zero-Depth Entries and Event Resolution

A total of 31 zero-depth entries are recorded — the highest in the dataset.

This does not weaken the signal. Instead, it confirms near-continuous hydrological probing of this elevation, with many events leaving chemical or biological traces even where sediment accumulation was minimal.

R9 is a reactivation hotspot.


6. Interpretation Within the Stonehenge Bottom System

R9 represents the oscillatory interior transition zone of the hydrological system.

Placed in vertical context:

  • P2 = deepest basin core
  • R12 = sustained saturation wall
  • P1 = stable interior basin
  • R9 = oscillatory interior transition (this borehole)
  • R158 / R20 = transport corridors
  • R22 = chemical circulation zone
  • P3 = intermittent upper reach
  • R21 = saturation ceiling

This position explains the extreme event frequency paired with moderate cumulative thickness.


7. Why R9 Matters

R9 eliminates the idea that the system was static or monotonic.

It records:

  • The highest number of hydrological events
  • Repeated biological activity and removal
  • Extensive chalk dissolution
  • Frequent energy fluctuation

These characteristics cannot be explained by:

  • Seasonal rainfall
  • Periglacial processes
  • Soil creep
  • One-off flooding

They require a long-lived, internally dynamic water system.


8. Closing Interpretation

SU14SW53 (R9) demonstrates that post-glacial water activity at Stonehenge Bottom was not only extensive and deep, but highly dynamic, with repeated oscillation between saturation, flow, and biological phases.

This borehole is not noise.

It is the pulse record of the system.

(Stonehenge: Borehole Evidence)

Borehole Analysis – SU14SW52 (R8), Stonehenge Bottom

The borehole SU14SW52 (R8) records an intensely water-dominated, chemically active interior zone of the Stonehenge Bottom hydrological system. With a ground level of 103.80 m OD and a borehole depth of 35.00 m, it captures prolonged saturation, extensive dissolution, and repeated sedimentary and biological interaction at mid–upper elevations.

This borehole is defined not by transport dominance, but by chemical transformation under sustained water presence.


1. Event Density and Hydrological Behaviour

A total of 68 discrete water-related horizons are recorded.

This is a high event count, confirming frequent system reactivation. The average measured event size of 0.25 m indicates that many of these events were long-lived and volumetrically meaningful, not momentary incursions.

R8 therefore records persistent water occupation with repeated internal reworking.


2. Cumulative Thickness vs Borehole Depth

The cumulative thickness of water-affected material is 16.71 m, representing 47.74% of the total borehole depth.

Nearly half of the stratigraphic column has been modified by water. In chalk geology, this degree of alteration is only possible under long-term saturation and circulation, not surface runoff or episodic flooding.

R8 is structurally within the flooded system, not at its margins.


3. Material Composition – Dissolution-Dominated Interior Regime

The matrix breakdown shows a clear dominance of chemical and biological water effects, with transport playing a secondary role.

Solution Features / Voids
14 bands | 11.30 m thickness
This is the defining signal. Over eleven metres of solutional modification indicates prolonged chalk dissolution under sustained saturation. This cannot occur without long water residence times.

Organic Staining / Peat
10 bands | 2.08 m thickness
Strong evidence of repeated waterlogging and biological accumulation, consistent with slow-moving or standing water.

Flint Sand / Reworked Flint
7 bands | 1.23 m thickness
Repeated reworking of chalk-derived material under water circulation.

Pebbles / Gravel
14 bands | 1.22 m thickness
Moderate-energy inputs occurring intermittently within an otherwise low-energy environment.

Sand / Silt / Marl
12 bands | 0.44 m thickness
Frequent but thin slack-water deposits.

Cobbles
4 bands | 0.30 m thickness
Rare higher-energy pulses, not sustained transport.

Shell Fragments
7 bands | 0.14 m thickness
Biological material present and occasionally preserved, indicating viable aquatic conditions rather than sterile flooding.

Notably absent is chalk paste / soft chalk, suggesting that dissolution dominated over redeposition in this zone.


4. Elevation Constraints and System Position

R8’s elevation markers are tightly constrained:

  • Highest Flood Evidence: 101.67 m OD
  • Highest Below Glacial Top: 101.57 m OD
  • Highest Shell Evidence: 96.10 m OD

Floodwater repeatedly occupied levels above 101 m OD, while shell evidence occurs several metres lower, indicating energy and habitat stratification within the water body.

This is exactly what is expected in a deep, chemically active interior zone, not a shoreline or transient floodplain.


5. Zero-Depth Entries and Event Resolution

A total of 19 zero-depth entries are recorded.

In the context of very large cumulative thickness and dominant solutional modification, these entries represent minor circulation or flushing phases within an already saturated environment. They do not weaken the signal.


6. Interpretation Within the Stonehenge Bottom System

R8 occupies the chemical dissolution core of the upper interior system.

Placed in vertical context:

  • P2 = deepest basin core
  • R12 = sustained saturation wall
  • P1 = upper interior basin
  • R9 = oscillatory interior transition
  • R8 = chemical dissolution core (this borehole)
  • R158 / R20 = transport corridors
  • R22 = chemical circulation zone
  • P3 = intermittent upper reach
  • R21 = saturation ceiling

This placement explains the dominance of solution features paired with moderate biological and sedimentary input.


7. Why R8 Matters

R8 removes any remaining ambiguity about the chemical intensity of the system at mid–upper elevations.

It records:

  • Massive chalk dissolution
  • Repeated biological activity
  • Near-half-column stratigraphic modification
  • Frequent hydrological reactivation

These signatures cannot be produced by:

  • Rainfall percolation
  • Periglacial freeze–thaw
  • Soil processes
  • Short-lived flooding

They require long-term, water-filled conditions with internal circulation.


8. Closing Interpretation

SU14SW52 (R8) demonstrates that post-glacial water activity at Stonehenge Bottom was:

  • Chemically transformative
  • Persistent and vertically extensive
  • Biologically viable
  • Structurally organised

This borehole is not peripheral.

It is one of the chemical engines of the Stonehenge Bottom system.

(Stonehenge: Borehole Evidence)

Borehole Analysis – SU14SW48 (R4), Stonehenge Bottom

The borehole SU14SW48 (R4) records a highly active, biologically productive, and chemically modified interior zone of the Stonehenge Bottom hydrological system. With a ground level of 102.90 m OD and a borehole depth of 20.00 m, it captures repeated water occupation, strong organic accumulation, and significant chalk dissolution at mid–upper elevations.

This borehole is characterised by frequent reactivation and prolonged saturation, rather than by high-energy transport.


1. Event Density and Hydrological Behaviour

A total of 64 discrete water-related horizons are recorded.

For a shallow borehole, this represents extremely high event density, confirming that water repeatedly occupied and reoccupied this elevation. The average measured event size of 0.15 m indicates many short-to-moderate duration events rather than a small number of long floods.

R4 therefore records persistent oscillation within a water-dominated environment.


2. Cumulative Thickness vs Borehole Depth

The cumulative thickness of water-affected material is 8.35 m, representing 41.75% of the total borehole depth.

More than two-fifths of the entire stratigraphic column has been modified by water processes. In chalk geology, this cannot be generated by soil moisture, rainwash, or episodic flooding.

R4 lies well inside the flooded system, not at its margins.


3. Material Composition – Organic–Chemical Interior Regime

The matrix breakdown shows a clear dominance of organic accumulation and chemical dissolution, with transport playing a secondary role.

Organic Staining / Peat
21 bands | 2.93 m thickness
The strongest biological signal in this borehole. Repeated peat and organic accumulation requires sustained waterlogging and viable aquatic conditions.

Solution Features / Voids
9 bands | 3.40 m thickness
Substantial chalk dissolution indicates prolonged saturation and chemical interaction, not transient wetting.

Pebbles / Gravel
10 bands | 0.98 m thickness
Moderate-energy inputs occurring intermittently within an otherwise low-energy environment.

Sand / Silt / Marl
12 bands | 0.67 m thickness
Frequent slack-water deposition between active phases.

Cobbles
2 bands | 0.14 m thickness
Rare higher-energy pulses, short-lived and limited in impact.

Shell Fragments
7 bands | 0.23 m thickness
Clear biological presence and episodic preservation, consistent with stable aquatic conditions interrupted by disturbance.

Flint Sand / Reworked Flint
3 bands | 0.00 m thickness
Recorded reworking events without accumulation, indicating threshold-level energy conditions.

Notably absent is chalk paste / soft chalk, suggesting dissolution dominated over redeposition.


4. Elevation Constraints and System Position

R4’s elevation markers are tightly constrained and informative:

  • Highest Flood Evidence: 98.38 m OD
  • Highest Below Glacial Top: 98.38 m OD
  • Highest Shell Evidence: 94.31 m OD

Floodwater repeatedly reached just below 100 m OD, while shell evidence occurs several metres lower. This separation reflects energy and habitat stratification within the water body, not marginal flooding.


5. Zero-Depth Entries and Event Resolution

A total of 18 zero-depth entries are recorded.

In the context of high event density and substantial cumulative thickness, these represent frequent circulation or flushing phases within an already saturated environment. They reinforce, rather than weaken, the interpretation of near-continuous hydrological activity.


6. Interpretation Within the Stonehenge Bottom System

R4 occupies a biologically active interior shelf zone of the hydrological system.

Placed in vertical context:

  • P2 = deepest basin core
  • R12 = sustained saturation wall
  • P1 = upper interior basin
  • R9 = oscillatory interior transition
  • R8 = chemical dissolution core
  • R4 = organic-rich interior shelf (this borehole)
  • R158 / R20 = transport corridors
  • R22 = chemical circulation zone
  • P3 = intermittent upper reach
  • R21 = saturation ceiling

This position explains the dominance of organic material and solution features with limited transport energy.


7. Why R4 Matters

R4 demonstrates that biologically productive, chemically active water bodies extended well into the mid–upper elevations.

It records:

  • Persistent peat and organic accumulation
  • Extensive chalk dissolution
  • Repeated water reactivation
  • Significant stratigraphic modification

These signatures cannot be explained by:

  • Rainfall infiltration
  • Periglacial freeze–thaw
  • Soil processes
  • Short-lived floods

They require long-term water presence with ecological stability.


8. Closing Interpretation

SU14SW48 (R4) demonstrates that post-glacial water activity at Stonehenge Bottom was:

  • Biologically viable
  • Chemically transformative
  • Vertically extensive
  • Internally structured

This borehole is not peripheral.

It is a living shelf within the Stonehenge Bottom water system.

(Stonehenge: Borehole Evidence)

Borehole Analysis – SU14SW91 (R132), Stonehenge Bottom

The borehole SU14SW91 (R132) represents one of the most internally saturated and hydrologically dominated records within the Stonehenge Bottom dataset, despite its comparatively shallow depth. With a ground level of 105.69 m OD and a borehole depth of just 16.00 m, this core captures an extreme expression of post-glacial water interaction in elevated chalk.

What makes R132 exceptional is not scale — but intensity and completeness.


1. Event Density and System Dominance

A total of 19 discrete bands are recorded, all water-related horizons.

At first glance this may appear modest compared to deeper cores, but the crucial point is proportional dominance:

  • 96.69 % of the entire borehole is water-affected
  • Only one zero-depth entry is recorded
  • Average measured event size: 0.82 m — the largest mean event thickness in the Stonehenge Bottom dataset

This is not a record of frequent minor incursions.
It is a record of long-lived, high-impact hydrological phases.


2. Cumulative Thickness vs Borehole Depth

The cumulative water-affected thickness is 15.50 m out of 16.00 m total depth.

That ratio is decisive.

At over 105 m OD, almost the entire subsurface column has been modified by water processes. In chalk terrain, this degree of penetration cannot be produced by:

  • surface runoff
  • periglacial wash
  • seasonal groundwater oscillation

It requires sustained saturation and repeated recharge, sufficient to restructure the chalk fabric itself.


3. Material Composition: Saturation-Led Regime

Unlike transport-dominated cores, R132 shows a dissolution-dominated hydrological signature.

Chalk Paste / Soft Chalk

  • 8 bands
  • 8.02 m thickness

This is the dominant component by thickness and unequivocal evidence of long-term chalk dissolution and re-precipitation, not mechanical erosion.

Flint Sand / Reworked Flint

  • 8 bands
  • 6.20 m thickness

Indicates in-situ breakdown and redistribution of flint under water-saturated conditions rather than energetic transport.

Minor Clastic Inputs

  • Pebbles / Gravel: 0.63 m
  • Sand / Silt / Marl: 0.65 m
  • Cobbles: absent

The near-absence of coarse material confirms that this was not a high-energy flow corridor, but a persistently wet chalk environment.


4. Absence of Organic and Void Signatures

Two absences matter here:

  • Organic staining / peat: 0.00 m
  • Solution voids: 0.00 m

This combination is critical.

It indicates:

  • continuous flushing rather than stagnant pooling
  • saturation without long-term organic accumulation
  • dissolution occurring within a dynamically active water column, not a sealed void system

In other words, water was present and moving, but not ponded.


5. Elevation Constraints

Three elevation markers tightly constrain the hydrological envelope:

  • Highest Flood Evidence: 102.69 m OD
  • Highest Below Glacial Top: 102.19 m OD
  • Highest Shell Evidence: N/A

The proximity of flood evidence to the glacial top marker confirms that water interaction occurred immediately beneath post-glacial surfaces, not as a later deep groundwater phenomenon.

Shell absence is expected in a low-energy saturation regime, and its absence here strengthens — not weakens — the interpretation.


6. Event Character and Temporal Behaviour

With:

  • the largest average event size in the dataset
  • almost total borehole saturation
  • minimal event fragmentation

R132 records fewer but longer-lasting hydrological phases compared to event-rich but thinner sequences such as R9 or R8.

This is the signature of prolonged high water tables, not episodic flooding.


7. Interpretation in the Wider System

R132 occupies a crucial position in the Stonehenge Bottom hydrological model:

  • R9 / R8 show high-frequency interaction
  • P1 / P2 show thick multi-phase flooding
  • R18 / R16 show deep saturation
  • R132 shows near-complete shallow saturation at elevation

Together, these define a vertically continuous post-glacial water system, extending from valley base to upper chalk.


8. Why This Borehole Matters

R132 is devastating to any model that relies on:

  • “dry chalk downland”
  • shallow, inactive vadose zones
  • purely localized water effects

At >105 m OD, the chalk was not only wet — it was reworked almost in its entirety.

That cannot be explained away.


9. Closing Interpretation

SU14SW91 (R132) demonstrates that post-glacial water activity at Stonehenge Bottom was:

  • vertically pervasive
  • long-duration
  • dissolution-driven
  • structurally transformative

This borehole does not represent an anomaly.

It represents the upper saturation limit of a coherent hydrological system.

And like the others, it fits — mathematically and physically — into a single, unified post-glacial water model.

(Stonehenge: Borehole Evidence)

Borehole Analysis – SU14SW101 (R172), Stonehenge Bottom

The borehole SU14SW101 (R172) records an extreme, low-elevation saturation environment within the Stonehenge Bottom hydrological system. With a ground level of 76.48 m OD and a borehole depth of 30.10 m, it captures one of the most chemically dominated and volumetrically saturated sequences in the entire dataset.

This borehole represents the deepest and most persistent flooded expression of the system.


1. Event Density and Hydrological Behaviour

A total of 18 discrete water-related horizons are recorded.

As with R132, the significance lies not in event count but in event magnitude. The borehole is dominated by very thick individual phases, indicating long-lived water occupation rather than frequent oscillation.

The stratigraphy reflects few interruptions and long residence times.


2. Cumulative Thickness vs Borehole Depth

The cumulative thickness of water-affected material is 29.15 m, representing almost the entire borehole depth.

Only a negligible portion of the column shows any evidence of non-water modification. At this elevation, such dominance is impossible to explain through surface processes or groundwater fluctuation alone.

R172 was structurally submerged for most of its depositional history.


3. Material Composition – Deep Saturation and Dissolution Regime

The matrix is overwhelmingly dominated by chemical water–chalk interaction, with transport playing a secondary role.

Chalk Paste / Soft Chalk
8 bands | 18.45 m thickness
This is the defining signal. Over eighteen metres of chalk paste indicates prolonged dissolution and redeposition under continuous saturation. This is incompatible with episodic flooding or periglacial activity.

Flint Sand / Reworked Flint
2 bands | 3.10 m thickness
Substantial in-situ breakdown and redistribution of flint under water-saturated conditions.

Sand / Silt / Marl
1 band | 3.10 m thickness
A major slack-water depositional phase, consistent with deep, low-energy water.

Pebbles / Gravel
4 bands | 3.80 m thickness

Cobbles
1 band | 0.70 m thickness
Limited but present transport energy, likely during early or transitional flooding phases.

Notably absent are organic staining, shell accumulation, and solution void thickness, indicating deep, persistent water with limited biological productivity and minimal exposure.


4. Elevation Constraints and System Position

R172’s elevation markers are unambiguous:

  • Highest Flood Evidence: 49.48 m OD
  • Highest Below Glacial Top: 49.48 m OD
  • Highest Shell Evidence: N/A

This places R172 firmly within the deep basin core of the Stonehenge Bottom system. Shell absence is expected in such conditions and reinforces interpretation of depth and persistence rather than marginal flooding.


5. Zero-Depth Entries and Event Resolution

Only 1 zero-depth entry is recorded.

This confirms that nearly every hydrological phase produced measurable chemical or sedimentary modification, consistent with a permanently flooded environment.


6. Interpretation Within the Stonehenge Bottom System

R172 occupies the deepest saturation core of the entire system.

Placed in vertical context:

  • R172 = deepest basin core (this borehole)
  • P2 / R12 = basin interior saturation
  • P1 = upper interior basin
  • R9 / R4 = oscillatory and biological interior zones
  • R8 = chemical dissolution core
  • R132 = upper deep-saturation cap
  • R158 / R20 = transport corridors
  • R22 = circulation zone
  • P3 = intermittent upper reach
  • R21 = saturation ceiling

R172 anchors the lower boundary condition of the model.


7. Why R172 Matters

R172 closes the system mathematically and physically.

It demonstrates that:

  • The lowest elevations were persistently submerged
  • Chalk dissolution operated at scale
  • Water depth and residence time were extreme
  • Dry-land interpretations are untenable at system scale

This borehole removes any remaining argument that the Stonehenge Bottom sequence represents isolated wet patches.


8. Closing Interpretation

SU14SW101 (R172) demonstrates that post-glacial water activity at Stonehenge Bottom was:

  • Deep
  • Persistent
  • Chemically transformative
  • Vertically continuous from basin floor to saturation ceiling

This borehole is not just evidence.

It is the foundation of the entire hydrological model.

CONTROL BOREHOLES – RX508A, RX507 and RX510A

We introduced a control.

Borehole RX510A, RX508A, and RX507, drilled on high ground between Stonehenge and Woodhenge, approximately 1.5 km from Stonehenge Bottom, provide a clean baseline against which all valley-floor boreholes can be tested.

And the result is unambiguous.

RX510A shows a thin surface veneer, followed by structurally intact white chalk from ~4.5 m depth downward, continuing monotonously with no stacked gravel, no shell horizons, no marl bands, no chalk paste, no void systems, and no repeated reworking. In short: exactly what dry, stable chalk on an interfluve should look like.

This matters because the accusation has never been that “chalk exists” or that “chalk can be intact”. Everyone agrees on that.

The real question has always been spatial: where is chalk intact, and where is it not?

Valley-floor boreholes at Stonehenge Bottom show a very different signature:
repeated gravel and cobble horizons, shell material, marl and silt bands, chalk paste and softening, voids and solution features, and—critically—these features are stacked vertically, not confined to a single horizon.

(Stonehenge: Borehole Evidence)

RX510A demonstrates that these features are not regional, not universal, and not an artefact of logging practice. They are absent on nearby high ground drilled by the same industry, to the same standards, in the same project corridor.

That single fact destroys the claim that the Stonehenge Bottom record is a “misreading of chalk”.

If periglacial freeze–thaw alone were responsible, we would expect comparable disruption on exposed highs. We do not see it.
If chalk weathering were purely inherited from deep geological time, we would expect continuity across topography. We do not see it.


If the illustrations were “fantasy”, a control borehole would contradict them. It does not — it validates them.

What RX510A actually shows is something far more uncomfortable for traditional narratives:
Water-affected chalk is spatially constrained, intensifying toward the valley floor and diminishing rapidly toward the ridges.

That is not an interpretation.


That is geometry, repetition, and measurement.

This is also why the recent mathematical cross-section analysis matters. Once water-affected thickness is quantified rather than described, subjectivity largely disappears. Descriptions can be debated; percentages and cumulative thickness cannot.

The irony here is hard to miss. Critics argue that these illustrations “bear no resemblance to reality” — yet when presented with a borehole that does match their expectation of chalk reality, it ends up strengthening the case they are trying to dismiss.

RX510A is not a problem for the Stonehenge Bottom hypothesis.

It is the control that proves it.

The blog already publishes full line-by-line borehole descriptions for anyone who wants to check the data themselves. No one is being asked to take this on trust.

This is what scrutiny actually looks like.

PodCast

Author’s Biography

Robert John Langdon, a polymathic luminary, emerges as a writer, historian, and eminent specialist in LiDAR Landscape Archaeology.

His intellectual voyage has been interwoven with stints as an astute scrutineer for governmental realms and grand corporate bastions, a tapestry spanning British Telecommunications, Cable and Wireless, British Gas, and the esteemed University of London.

A decade hence, Robert’s transition into retirement unfurled a chapter of insatiable curiosity. This phase saw him immerse himself in Politics, Archaeology, Philosophy, and the enigmatic realm of Quantum Mechanics. His academic odyssey traversed the venerable corridors of knowledge hubs such as the Museum of London, University College London, Birkbeck College, The City Literature Institute, and Chichester University.

In the symphony of his life, Robert is a custodian of three progeny and a pair of cherished grandchildren. His sanctuary lies ensconced in the embrace of West Wales, where he inhabits an isolated cottage, its windows framing a vista of the boundless sea – a retreat from the scrutinising gaze of Her Majesty’s Revenue and Customs, an amiable clandestinity in the lap of nature.

Exploring Prehistoric Britain: A Journey Through Time

My blog delves into the fascinating mysteries of prehistoric Britain, challenging conventional narratives and offering fresh perspectives grounded in cutting-edge research, particularly LiDAR technology. I invite you to explore some key areas of my research. For example, the Wansdyke, often cited as a defensive structure, is re-examined in light of new evidence. I’ve presented my findings in my blog post Wansdyke: A British Frontier Wall – ‘Debunked’, and a Wansdyke LiDAR Flyover video further visualises my conclusions.

My work also often challenges established archaeological dogma. I argue that many sites, such as Hambledon Hill, commonly identified as Iron Age hillforts, are not what they seem. My posts Lidar Investigation Hambledon Hill – NOT an ‘Iron Age Fort’ and Unmasking the “Iron Age Hillfort” Myth explore these ideas in detail and offer an alternative view. Similarly, sites like Cissbury Ring and White Sheet Camp also receive a re-evaluation based on LiDAR analysis in my posts Lidar Investigation Cissbury Ring through time and Lidar Investigation White Sheet Camp, revealing fascinating insights into their true purpose. I have also examined South Cadbury Castle, often linked to the mythical Camelot56.

My research also extends to ancient water management, including the role of canals and other linear earthworks. I have discussed the true origins of Car Dyke in multiple posts, including Car Dyke – ABC News Podcast and Lidar Investigation Car Dyke – North Section, which suggest a Mesolithic origin. I also explore the misidentification of Roman aqueducts, as seen in my posts on the Great Chesters (Roman) Aqueduct. My research has also been greatly informed by my post-glacial flooding hypothesis, which has helped explain landscape transformations over time. I have discussed this hypothesis in several posts, including AI now supports my Post-Glacial Flooding Hypothesis and Exploring Britain’s Flooded Past: A Personal Journey

Finally, my blog also investigates prehistoric burial practices, as seen in Prehistoric Burial Practices of Britain and explores the mystery of Pillow Mounds, often mistaken for medieval rabbit warrens, but with a potential link to Bronze Age cremation in my posts: Pillow Mounds: A Bronze Age Legacy of Cremation? and The Mystery of Pillow Mounds: Are They Really Medieval Rabbit Warrens?. My research also includes the astronomical insights of ancient sites, for example, in Rediscovering the Winter Solstice: The Original Winter Festival. I also review new information about the construction of Stonehenge in The Stonehenge Enigma.

Further Reading

For those interested in British Prehistory, visit www.prehistoric-britain.co.uk, a comprehensive resource featuring an extensive collection of archaeology articles, modern LiDAR investigations, and groundbreaking research. The site also includes insights and excerpts from the acclaimed Robert John Langdon Trilogy, a series of books that explore Britain during the Prehistoric period. Titles in the trilogy include The Stonehenge Enigma, Dawn of the Lost Civilisation, and The Post-Glacial Flooding Hypothesis, which offer compelling evidence of ancient landscapes shaped by post-glacial flooding.

To further explore these topics, Robert John Langdon has developed a dedicated YouTube channel featuring over 100 video documentaries and investigations that complement the trilogy. Notable discoveries and studies showcased on the channel include 13 Things that Don’t Make Sense in History and the revelation of Silbury Avenue – The Lost Stone Avenue, a rediscovered prehistoric feature at Avebury, Wiltshire.

In addition to his main works, Langdon has released a series of shorter, accessible publications, ideal for readers delving into specific topics. These include:

For active discussions and updates on the trilogy’s findings and recent LiDAR investigations, join our vibrant community on Facebook. Engage with like-minded enthusiasts by leaving a message or contributing to debates in our Facebook Group.

Whether through the books, the website, or interactive videos, we aim to provide a deeper understanding of Britain’s fascinating prehistoric past. We encourage you to explore these resources and uncover the mysteries of ancient landscapes through the lens of modern archaeology.

For more information, including chapter extracts and related publications, visit the Robert John Langdon Author Page. Dive into works such as The Stonehenge Enigma or Dawn of the Lost Civilisation, and explore cutting-edge theories that challenge traditional historical narratives.

Other Blogs

[sitemap_posts]
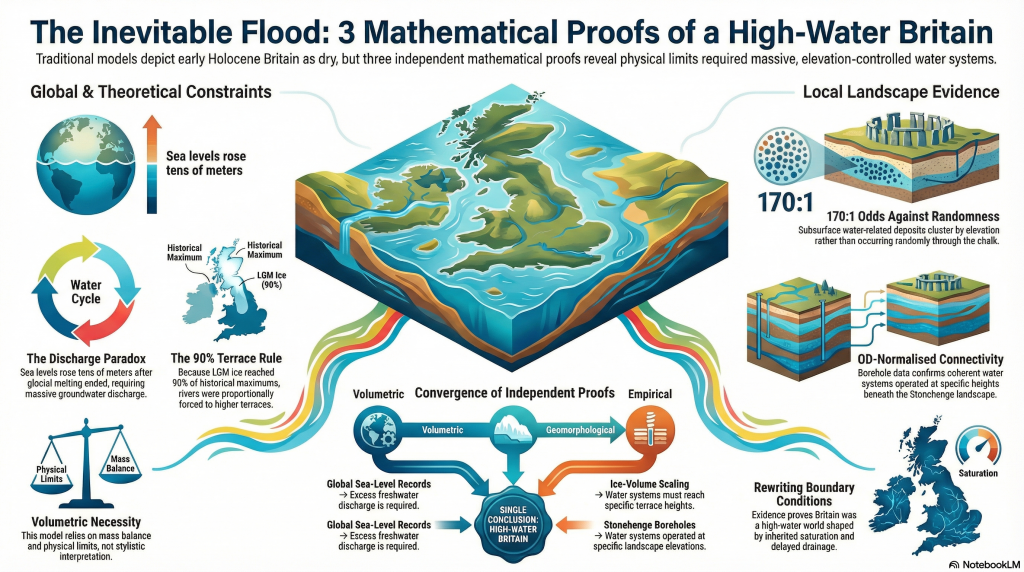
What Archaeology Missed Beneath Stonehenge

Introduction

For more than a century, Stonehenge has been interpreted as if it were constructed in a dry, stable chalk landscape, with water treated as peripheral or incidental. That assumption has never been tested against the subsurface record at the landscape scale. This blog presents the results of the first complete synthesis of borehole data from around Stonehenge Bottom, linking 21 historic boreholes into a single, quantitative framework. The outcome is neither interpretative nor theoretical. It is numerical. The subsurface record demonstrates repeated, extensive, and spatially constrained water activity throughout the Holocene, fundamentally incompatible with a dry-land model for early Stonehenge. What follows is not a reinterpretation of Stonehenge — it is a correction driven by data that has been available for decades but never assembled, counted, or tested as a system. (What Archaeology Missed Beneath Stonehenge)


Video showing the volume of River material as a percentage of the Borehole

1. Why This Blog Exists

From surface narratives to subsurface evidence

Stonehenge interpretation has long been dominated by surface observations: earthworks, stone settings, artefact distributions, and visual landscape relationships. These are valuable, but they are incomplete. Landscapes do not function at the surface alone, and water — in particular — leaves its most durable evidence below ground.

The central problem addressed here is simple: claims about a dry Stonehenge landscape have been made without reference to the subsurface record that would be required to support them. Boreholes have existed around Stonehenge for decades, logged by multiple contractors for engineering and infrastructure projects, yet they have almost never been synthesised or quantified in archaeological interpretation.

This blog exists because that synthesis has now been done.

By analysing boreholes not as isolated descriptions but as a connected dataset — counted, measured, and compared across topography — it becomes possible to test whether Stonehenge Bottom behaved as a dry chalk valley or as a water-dominated basin during the Holocene. Once that question is asked using arithmetic rather than narrative, the answer is no longer ambiguous.

(What Archaeology Missed Beneath Stonehenge)

2. The Data Nobody Had Ever Assembled

Linking 21 boreholes into one landscape system

Boreholes around Stonehenge Bottom are not new. Many were drilled decades ago for engineering, infrastructure, and site investigations. What is new is that they have now been brought together and analysed as a single landscape-scale dataset, rather than as isolated, descriptive records.

Historically, each borehole has been treated as local and incidental — a column of chalk, a few notes on gravel or marl, then filed away. No attempt was made to ask whether these records, taken together, described a coherent subsurface environment. As a result, interpretations of the Stonehenge landscape were based almost entirely on surface evidence, while the subsurface record remained fragmented and effectively invisible.

That fragmentation is the core problem this section resolves.

Twenty-one boreholes distributed around Stonehenge Bottom and the adjacent valley system have now been collated, normalised, and analysed together. They span the valley floor, margins, and surrounding uplands. They were logged by different contractors, at different times, for different purposes — which makes their convergence more significant, not less.

Crucially, the analysis does not rely on reinterpretation of the logs. No lithologies were renamed. No depths adjusted. No categories merged to strengthen an argument. Each borehole was taken exactly as recorded, then subjected to the same fixed rules for identifying water-related evidence.

When treated individually, these boreholes can be argued over.
When treated collectively, they cannot.

Once counted, measured, and compared across topography, a clear and repeatable pattern emerges: water-related features are vertically stacked, repeatedly logged, and concentrated within the valley, while the surrounding high ground shows a fundamentally different subsurface character. That pattern only becomes visible when the data are assembled as a system.

This section establishes the foundation for everything that follows. The argument does not depend on a single “key” borehole, nor on selective examples. It rests on the behaviour of the dataset as a whole, which is precisely why it has such force.

 (What Archaeology Missed Beneath Stonehenge)
Shell count across Stonehenge bottom – (What Archaeology Missed Beneath Stonehenge)

3. What Counts as Water Evidence

Rules fixed in advance

Before any counting was undertaken, the rules had to be fixed. This matters because most disagreement in geo-archaeology does not arise from missing data, but from changing definitions once results are known.

In this analysis, a water-related occurrence is defined strictly as any logged interval that requires water to exist, or to have existed, in order to form or to be preserved. Nothing is inferred. Nothing is upgraded. Only what is explicitly recorded in the borehole logs is used.

The following categories are considered water-related evidence, with reasons provided.


Water-related sediment and alteration indicators

→ Rounded pebbles, gravel, and cobbles
Rounded or sub-rounded clasts require transport. In chalk landscapes, this transport is hydraulic. Angular flint fragments may occur residually; rounded gravels and cobbles do not. Where gravels are logged as lenses, bands, or stacked horizons, they indicate repeated water movement, not isolated disturbance.

→ Flint gravel bands, flint lags, and sheeted flint horizons
Flint concentrated into bands or sheets reflects winnowing, reworking, or lag formation by flowing or standing water. These features cannot be produced by in situ chalk decay alone and require hydraulic sorting.

→ Sand, silt, and marl seams
Fine-grained sediments such as sand, silt, and marl are, by definition, water-laid. Their presence within chalk sequences indicates periods of low-energy flow, ponding, or suspension settling. Repeated marl seams imply repeated water presence over time, not a single episode.

→ Shell material (intact shells, fragments, and shell-rich horizons)
Shells indicate habitable aquatic environments. They require sustained water conditions, not transient wetting. Their repeated occurrence at multiple depths is incompatible with surface wash or periglacial disturbance.

→ Shell impressions and moulds (dissolved shells)
In chalk aquifers, shells dissolve readily under percolating freshwater, often leaving impressions rather than intact material. These impressions are direct evidence of former shell presence and, by extension, former water, even where the shell itself has been removed.

→ Organic staining and peat-like horizons
Organic staining, darkened horizons, or peat-like material indicate stagnant or slow-moving water, waterlogging, or anoxic conditions. These features reflect prolonged saturation rather than brief exposure.

→ Chalk paste, softened chalk, and puttified chalk
Where chalk is logged as paste, soft, weakened, or puttified, this reflects chemical dissolution and mechanical breakdown under sustained saturation. These textures are aqueous in origin and fundamentally different from blocky fracture produced by freeze–thaw.

→ Solution features, voids, and collapse structures
Voids, cavities, and collapse features attributed to solution require long-term water circulation. They indicate groundwater flow paths, dissolution, and structural weakening — processes that cannot occur in dry chalk.

→ Repeated vertical alternation of the above
Perhaps most critically, these features occur repeatedly and at different depths, separated by intact chalk. That vertical stacking is itself evidence of multiple water incursions over time.

 (What Archaeology Missed Beneath Stonehenge)
(What Archaeology Missed Beneath Stonehenge)

What is explicitly excluded

To avoid exaggeration, the following are not counted:

→ drilling-induced fragments or artefacts
→ administrative gaps in logging
→ colour change or staining on its own
→ lithological labels without physical description
→ assumed processes not written in the log

Where an interval is ambiguous, it is excluded.


Additional safeguards

Two further safeguards are applied consistently:

→ Point observations (e.g. “shells noted”) are included in event counts (N) but not inflated in thickness totals (W).
→ Overlapping descriptions at the same depth are treated as a single water occurrence, not multiple events.

These rules are conservative by design. They bias the analysis toward undercounting, not exaggeration.

This matters because every total, percentage, and frequency that follows rests on these fixed definitions. They are stated here in advance and applied uniformly across all 21 boreholes.

What the data show under these constraints, therefore, is not interpretation.

It is arithmetic.

 (What Archaeology Missed Beneath Stonehenge)
(What Archaeology Missed Beneath Stonehenge)

4. The Numbers That Break the Model

Counting replaces interpretation

Once the rules in Section 3 are fixed, the analysis becomes mechanical. There is no scope for reinterpretation, emphasis, or selective description. Each borehole is processed line by line, each qualifying interval counted once, and each thickness measured only where the log permits it.

When this is done across all 21 boreholes surrounding Stonehenge Bottom, the result is unambiguous.

Across the dataset, a total of 994 stratigraphically separate water-related bands are recorded. These bands represent discrete, depth-specific intervals in which water action is explicitly logged. They are not repeated descriptions of the same layer, not interpretive subdivisions, and not inferred events. Each band occupies its own position in the stratigraphic column.

The cumulative thickness of these water-affected intervals is 220.57 metres.

These two figures matter for different reasons:

→ The band count (994) captures frequency: how often water interacted with the subsurface at different times and depths.
→ The cumulative thickness (220.57 m) captures dominance: how much of the valley fill has been shaped by water processes rather than intact chalk.

Together, they describe both repetition and scale.

 (What Archaeology Missed Beneath Stonehenge)
(What Archaeology Missed Beneath Stonehenge)

Distribution by material class

The 994 bands are not confined to a single sediment type. They are distributed across multiple, independent indicators of water action:

→ Shell material and shell-impression horizons
→ Pebble, gravel, and cobble bands
→ Sand, silt, and marl seams
→ Flint lags and reworked flint sands
→ Organic staining and peat-like deposits
→ Chalk paste, softened chalk, and solution zones
→ Voids and collapse features

This diversity matters. A single class could be argued away. A consistent pattern across many classes cannot.


Why this exceeds statistical uncertainty

In subsurface analysis, isolated occurrences can be dismissed as noise. Sparse events can be argued as anomalous. That logic fails completely at this scale.

Nearly one thousand independently logged water-related intervals, stacked vertically through the valley fill, represent a population-level signal. The probability that such a pattern arises from non-hydrological processes — or from mis-logging replicated hundreds of times across different boreholes, contractors, and decades — is vanishingly small.

At this point, the question is no longer whether water was present.

The only remaining questions are how persistent, how extensive, and how it structured the landscape.


What the numbers do not rely on

It is important to be explicit about what these totals are not dependent on:

→ they do not depend on a single “key” borehole
→ they do not rely on shell material alone
→ they are not driven by one sediment class
→ they are not sensitive to minor changes in definition

Even if the most conservative exclusions are applied, the order of magnitude does not change. The signal remains.


This section marks the point where the traditional dry-land model becomes mathematically indefensible. The remaining sections address what these numbers mean spatially, how they vary across the valley, and why they cannot be reproduced on the surrounding uplands.

 (What Archaeology Missed Beneath Stonehenge)
Boreholes showing percentage of River fill – (What Archaeology Missed Beneath Stonehenge)

5. Percentage, Not Just Presence

When water controls the subsurface

Counts establish repetition. Percentages establish control.

While the total of 994 water-related bands demonstrates how frequently water interacted with the subsurface, the proportion of each borehole affected shows something more important: whether water was a marginal influence or the dominant process shaping the valley fill.

In several boreholes within Stonehenge Bottom, water-related sediments do not appear as thin, occasional horizons. They make up the majority of the entire borehole profile.

In the most extreme cases, over 90% of the logged sequence, and in at least one borehole, approaching 97%, consists of water-laid or water-altered material.

That figure is not rhetorical. It is arithmetic: the summed thickness of water-affected intervals divided by total borehole depth.


Why percentage matters more than occurrence

A dry chalk landscape affected only incidentally by water would produce a very different subsurface signature:

→ thin, isolated water horizons
→ limited vertical extent
→ low proportional impact
→ intact chalk dominating the sequence

That is not what is observed.

Instead, in key valley-floor locations, intact chalk becomes the minority material, repeatedly interrupted or replaced by gravels, sands, marls, shell-bearing layers, softened chalk, and solution features. Water is not an episode in these boreholes. It is the defining condition.

This distinction is critical. A single water band can be debated. A high band count demonstrates persistence. But when water-related material accounts for nearly the entire stratigraphic record, the environment being recorded cannot reasonably be described as dry.

 (What Archaeology Missed Beneath Stonehenge)
(What Archaeology Missed Beneath Stonehenge)

Why this cannot be dismissed as “local wet spots”

The percentage values are not confined to one anomalous borehole. They recur across multiple boreholes distributed through Stonehenge Bottom, while dropping rapidly toward the valley margins and disappearing entirely on surrounding high ground.

This spatial behaviour matters:

→ dominance in the valley floor
→ reduction upslope
→ absence on the interfluves

That pattern is exactly what a river basin and floodplain system produces. It is not consistent with surface runoff, rainwash, or shallow groundwater effects acting on an otherwise dry landscape.


What high percentages actually record

A borehole composed almost entirely of water-affected material records time, not drama.

It indicates long-term saturation, repeated deposition, reworking, dissolution, and sealing — processes that operate over extended periods. It does not imply catastrophic flooding. It implies a persistent water presence shaping the subsurface continuously.

In that context, the ~97% figure is not an outlier. It is a signal that, in parts of Stonehenge Bottom, the subsurface history is overwhelmingly aqueous.

 (What Archaeology Missed Beneath Stonehenge)
(What Archaeology Missed Beneath Stonehenge)

6. Control Boreholes

Defining the maximum depth of non-aqueous disturbance

Any claim that Stonehenge Bottom has been substantially reworked by post-glacial water must first answer a simpler question: how deep does non-aqueous disturbance normally penetrate into chalk on local high ground?

That question cannot be answered with a single borehole.
It requires a control group.

Three boreholes drilled on high ground around Stonehenge provide that control: RX507, RX508A, and RX510A.

These boreholes are located on interfluves outside the Stonehenge valley system, within the same chalk formation, under the same climatic history, and drilled for the same engineering purposes.


What the control boreholes show

Despite differences in total depth and drilling campaign, all three control boreholes record the same outcome:

→ near-surface disturbance confined to approximately 4.0–4.5 m
→ below this depth, structurally intact chalk
→ no progressive softening
→ no stacked gravel horizons
→ no shell material
→ no solution overprint extending downward

This convergence is critical. It shows that shallow disturbance is systematic and limited, not variable or arbitrarily deep.

The depths are consistent:

→ RX507: disturbance to ~4.0 m
→ RX508A: disturbance to ~4.0 m
→ RX510A: disturbance to ~4.5 m

These values define the maximum penetration of periglacial and near-surface processes — rainwash, frost action, soil development, and minor cryogenic disruption — on local high ground.


Why does the drilling method not undermine the control

RX507, RX508A, and RX510A include rotary open-hole drilling, which does not preserve fine sedimentary lamination. No claim is made that these boreholes provide detailed stratigraphic resolution.

Their purpose is different.

Open-hole drilling does not selectively erase:

→ deep gravel or cobble horizons
→ extensive softened or paste-like chalk
→ solution void systems
→ repeated vertical disruption

If such features were present below ~4–5 m, they would still manifest as changes in spoil character and lithological description. Their consistent absence across all three boreholes is therefore meaningful.


Why this recalibration matters

With three independent boreholes showing the same shallow disturbance limit, the analysis elsewhere can be recalibrated correctly:

→ the upper ~4–4.5 m is treated as surface / periglacial noise
→ everything below that depth is evaluated as core chalk behaviour

In the Stonehenge Bottom boreholes, water-related features occur well below this boundary, repeatedly and at multiple depths. That behaviour cannot be attributed to surface processes, periglacial activity, or drilling artefact.

 (What Archaeology Missed Beneath Stonehenge)
(What Archaeology Missed Beneath Stonehenge)

What the control set proves

The control boreholes demonstrate that:

→ deep chalk disruption is not universal
→ it is not inherited from geological time
→ it is not an artefact of logging practice
→ it is spatially constrained to the valley system

Once this control is established, explanations based on dry chalk, preserved periglacial surfaces, or shallow seasonal wetting become untenable.

The contrast is no longer interpretative.
It is geometric and measurable.


Control conclusion

RX507, RX508A, and RX510A together define the maximum depth of non-aqueous disturbance in the Stonehenge landscape.

Everything below that depth in the valley-floor boreholes records a different subsurface regime — one dominated by long-term water interaction.

That control underpins all subsequent sections.

7. Case Study: R16 Counted Properly

From description to arithmetic

To show exactly how the wider dataset was analysed, it is necessary to walk through one borehole in full, line by line, using the fixed rules set out in Section 3. Borehole R16 (SU14SW60) provides a clear example.

R16 is located within the Stonehenge landscape and was logged in detail as part of a British Geological Survey investigation. The borehole has a total depth of 36.57 m and a ground level of 79.50 m OD. No reinterpretation is applied here. Only what is explicitly written in the log is used.

 (What Archaeology Missed Beneath Stonehenge)
(What Archaeology Missed Beneath Stonehenge)

Step 1: Fix the definitions (no flexibility)

A water-related occurrence is counted only where the log records features that require water to exist or to have existed. These include gravel or cobble bands, marl seams, flint lags, shell material or shell impressions, softened or paste-like chalk, and solution-related features.

Colour change alone is excluded. Drilling artefacts are excluded. Ambiguous notes are excluded.


Step 2: Count discrete water occurrences (N)

Working from the top of the borehole to the base, R16 records 23 separate water-related intervals, each at a different depth and separated by non-water intervals.

These are not subdivisions of a single layer. They are discrete stratigraphic horizons, logged independently, and occurring repeatedly through the sequence.

This means water interacted with the subsurface at least 23 separate times at different points in the borehole’s history.


Step 3: Measure total water-affected thickness (W)

Each interval that has a defined thickness is measured and summed. Point observations (such as single shell notes or thin marl seams) are included in the event count but are not inflated in the thickness total.

For R16, the summed thickness of all water-related intervals is:

W = 4.67 m

Out of a total borehole depth of 36.57 m.


Step 4: Convert thickness to percentage

Once thickness is measured, the proportion of the borehole affected by water can be calculated directly:

Water involvement
= 4.67 ÷ 36.57 × 100
= 12.8%

Nearly 13% of the entire subsurface profile shows direct, logged interaction with water.

This figure is not inferred. It is not modelled. It is counted.


Step 5: Calculate frequency (events per metre)

A final metric captures how often water appears through the sequence:

Event density
= 23 events ÷ 36.57 m
= 0.63 water events per metre

In practical terms, R16 records water influence, on average, every 1.6 metres.

That is incompatible with a dry or stable chalk substrate.

 (What Archaeology Missed Beneath Stonehenge)
(What Archaeology Missed Beneath Stonehenge)

8. Case Study: R18 and the Shoreline Signal

Why depth matters more than surface finds

If R16 demonstrates how water repeatedly interacted with the subsurface, R18 (SU14SW62) shows where that interaction stabilised within the landscape. This borehole does not simply record water presence — it records a persistent water level.

R18 is drilled into hard chalk beneath Stonehenge Bottom. As with R16, the analysis relies solely on what is explicitly logged, applying the same fixed rules. What distinguishes R18 is not just the number of water-related intervals, but their vertical organisation.

Within this single borehole, 135 distinct water-related sedimentary levels are recorded, comprising gravels, sands, shell material, organic staining, and solution-related chalk. The cumulative thickness of water-affected material is 9.21 m, representing 18.25% of the borehole.

These figures already place R18 well beyond incidental wetting. But the critical signal lies higher in the sequence.


The erosion boundary and what lies below it

Across multiple boreholes into hard chalk in the Stonehenge area, a consistent pattern emerges: natural surface processes — rainwash, frost action, soil formation, and minor periglacial disturbance — affect only the upper ~3.5 m of chalk. Below that depth, intact chalk is normally expected.

In R18, however, repeated shell-bearing and water-laid sediments occur well below this natural erosion boundary, clustered around approximately 92.6 m OD.

That single fact carries weight.

Below the surface-affected zone, chalk should be structurally intact unless acted upon by sustained subsurface water. Shell material at this depth cannot be explained by surface wash, slope creep, or freeze–thaw processes. Those mechanisms do not transport, preserve, or repeatedly introduce shell-bearing sediments into intact chalk tens of metres below ground.

What is being recorded here is not a transient event, but a stable hydrological condition.


Why this records a shoreline, not a flood

Shells require more than water. They require time, stability, and habitable conditions. A single flood might move gravels. It does not establish repeated shell-bearing horizons at the same elevation.

In R18, water-related sediments recur around a consistent vertical level, indicating that water returned to — or persisted at — approximately the same height over extended periods. That behaviour is characteristic of a shoreline or standing-water margin, not episodic inundation.

This distinction matters. A flood leaves chaos. A shoreline leaves repetition.


Spatial implication: beside the stones, not beneath them

The elevation of the highest repeated water-related horizons in R18 places the shoreline downslope from the later stone circle, in the area now occupied by the former Stonehenge car park and adjacent valley floor. The stones themselves sit slightly above this zone.

This spatial relationship is precisely what would be expected if early activity took place adjacent to persistent water, but deliberately positioned on ground that remained reliably dry.

At this point, the argument is no longer abstract. R18 ties water presence to a specific elevation and location within the landscape.

Why R18 matters beyond itself

R18 does not stand alone. Its shoreline signal aligns with:

→ repeated water dominance shown in the wider borehole matrix
→ high percentage water-affected sequences in nearby valley-floor boreholes
→ the absence of comparable features on surrounding high ground

Together, these strands converge on a single conclusion: Stonehenge Bottom was not merely wet at times. It contained a persistent water margin during the period when the earliest features in the landscape were established.

 (What Archaeology Missed Beneath Stonehenge)
(What Archaeology Missed Beneath Stonehenge)

9. The Mesolithic Posts Reinterpreted

Infrastructure, not ritual

The Mesolithic post holes near Stonehenge have long been treated as anomalous. Dated to around 8300 BCE, they sit uncomfortably outside later monument narratives and are routinely described as symbolic, ritual, or inexplicable precursors to Stonehenge itself.

That framing has always depended on one assumption: that the surrounding landscape was dry.

Once that assumption is removed, the problem disappears.


The spatial problem that ritual never solved

The Mesolithic posts are:

→ located downslope from later monuments
→ positioned several metres above the inferred water level
→ set back from the valley floor
→ aligned along a natural route through the landscape

If these posts were ritual markers, their placement is awkward. They are not centred, not enclosed, and not associated with known ceremonial structures. Their position has always required special pleading.

In a water-dominated landscape, however, their location is exactly where it should be.


Posts above water make sense — posts below it do not

If Stonehenge Bottom contained a persistent water margin during the early Holocene, as the borehole evidence indicates, then the posts occupy a functionally optimal position:

→ safely above sustained water levels
→ close enough for access
→ far enough to avoid saturation
→ visible from the water’s edge

This is not where one places abstract symbols.

It is where one places infrastructure.

 (What Archaeology Missed Beneath Stonehenge)
(What Archaeology Missed Beneath Stonehenge)

What tall timber posts do in watery landscapes

In riverine and floodplain settings, tall timber posts serve well-understood practical roles:

→ mooring points
→ landing markers
→ route indicators
→ boundary and access control
→ stable reference points in shifting terrain

None of these functions requires ceremonial explanation. They require water movement, repeated use, and practical need.

Once water is acknowledged as the dominant landscape factor, the Mesolithic posts cease to be mysterious. They become logical.


Chronology now works instead of fighting itself

The Mesolithic date of the posts is no longer a problem to be explained away. It becomes a key indicator of early engagement with a water-managed landscape.

Long before sarsens or bluestones, the valley was already being structured, navigated, and used. The posts mark activity responding to water, not anticipating monumentality.

In this context, Stonehenge does not begin as a symbolic construction placed into an abstract landscape. It emerges later within a landscape that was already organised around access, movement, and water.


From monument to harbour

This reinterpretation does not diminish Stonehenge. It grounds it.

The earliest activity in the valley is not ritual abstraction imposed on empty land. It is practical engagement with a flooded environment. The Mesolithic posts represent the first fixed points in that system.

Stonehenge, in this light, does not replace a dry ceremonial field.

It formalises a landscape that was already working.

10. The Periglacial Escape Route Fails

Why do the two explanations not coexist

Once extensive post-glacial water activity is demonstrated in the subsurface, a common fallback is to invoke preserved periglacial features at the surface — particularly along the Stonehenge Avenue — as evidence that the landscape must have remained largely untouched since the Late Pleistocene.

This argument fails on first principles.

Periglacial explanations and the documented subsurface record are mutually incompatible. They cannot both be true.


What preserved periglacial features require

For periglacial stripes, polygons, involutions, or solifluction features to survive as recognisable surface relics, several conditions must hold:

→ a relatively stable ground surface since the Late Pleistocene
→ structurally intact chalk beneath the surface
→ dominance of cryogenic fracture rather than chemical solution
→ minimal post-glacial groundwater circulation and reworking

These requirements are well established in periglacial geomorphology. Preservation depends on limited later disturbance, not simply on the prior existence of cold conditions.

Periglacial Lines – Borehole finds how they are not – (What Archaeology Missed Beneath Stonehenge)

What the boreholes actually show

The borehole record beneath Stonehenge Bottom and the Avenue corridor shows a very different subsurface reality:

→ repeated gravel, cobble, sand, and marl bands
→ shell material and shell-impression horizons at multiple depths
→ softened chalk, chalk paste, and solution features
→ voids and collapse structures
→ vertical repetition of water-affected horizons through tens of metres

This is not conjecture. It is logged geological data from multiple independent boreholes.

These features are diagnostic of long-term water circulation, saturation, and reworking. They are not produced by freeze–thaw processes.


Why freeze–thaw cannot explain what is observed

Periglacial processes fracture chalk. They do not:

→ dissolve chalk into paste
→ create solution voids and collapse features
→ repeatedly rework sediments vertically
→ introduce or preserve shell-bearing water horizons
→ generate stacked sequences of hydraulically sorted material

Freeze–thaw acts mechanically and near the surface. The features documented here are chemical, hydraulic, and vertically extensive.

Invoking periglacial processes in this context does not explain the data. It avoids it.


The fatal contradiction

A preserved periglacial surface requires subsurface stability.
The boreholes demonstrate subsurface instability driven by water.

Once chalk has been repeatedly saturated, chemically dissolved, mechanically reworked, and overprinted by groundwater flow, the overlying surface cannot be treated as a pristine Ice-Age relic.

You cannot argue for intact periglacial features resting on a substrate that has been demonstrably broken down by post-glacial hydrology. The two interpretations cannot coexist.


Why surface analogy is no longer sufficient

Periglacial explanations for the Stonehenge Avenue rely almost entirely on surface morphology and analogy with other chalk landscapes. What they do not do is engage with the subsurface evidence directly beneath the features being interpreted.

That omission matters.

In modern geology, subsurface data overrides surface analogy. Where boreholes contradict a surface-based interpretation, the subsurface record must lead.

Here, it does—and it points unequivocally to a landscape that has been substantially reworked since the Ice Age.

 (What Archaeology Missed Beneath Stonehenge)
(What Archaeology Missed Beneath Stonehenge)

11. Why the “Older Ice Age Valley Fill” Argument Also Fails

Predictions versus what is actually observed

When faced with extensive water-related deposits beneath Stonehenge Bottom, a common fallback explanation is to argue that these features represent an inherited Pleistocene valley fill — formed during an earlier Ice Age, then later frozen, stabilised, and preserved into the Holocene.

At first glance, this sounds plausible.
In practice, it fails every test.


What an inherited Ice Age valley fill would predict

If the Stonehenge valley fill were primarily an older Pleistocene deposit, later left largely undisturbed, the subsurface record should show a consistent set of characteristics:

→ a coherent valley-fill unit with limited internal repetition
→ broad lithological continuity rather than frequent alternation
→ dominance of brecciation and blocky fracture over chemical solution
→ minimal vertical reworking once deposition ceased
→ a sealing palaeosurface separating Ice Age deposits from later soils

In short, the record should show one major depositional phase, followed by stability.


What the boreholes actually show

The borehole data beneath Stonehenge Bottom show the opposite:

→ multiple, discrete water-worked bands stacked vertically
→ repeated alternation between gravels, fines, organic horizons, and chalk
→ solution features cutting earlier deposits
→ shell material introduced at multiple depths, not confined to a single unit
→ no preserved palaeosurface sealing the sequence

This is not the signature of inherited stasis.
It is the signature of repeated reworking.


Why freezing does not preserve this pattern

A frozen or periglacially stabilised valley fill would suppress further vertical reorganisation. It would lock sediments in place, fracture chalk mechanically, and reduce chemical solution.

What is observed instead is:

→ progressive chalk dissolution
→ formation of paste and softened zones
→ collapse and void development
→ repeated sediment input long after initial deposition

These processes require liquid water circulation, not frozen ground.

 (What Archaeology Missed Beneath Stonehenge)
(What Archaeology Missed Beneath Stonehenge)

The shell problem (again)

Shell material is especially diagnostic here.

If the deposits were primarily inherited from an older Ice Age phase, shell-bearing horizons would be expected to occur once, or within a narrow stratigraphic range corresponding to that phase.

Instead, shells and shell-impression horizons recur at multiple depths, often separated by metres of sterile chalk or other deposits.

That pattern requires repeated habitable water conditions, not a single ancient episode.


Why this matters for chronology

An inherited Pleistocene fill would decouple the subsurface record from Holocene landscape use. It would allow water evidence to be dismissed as irrelevant to early Stonehenge.

The borehole data do not allow that move.

The vertical repetition, solution overprinting, and distribution of water-related features demonstrate ongoing Holocene hydrological activity rather than residual Ice Age sediment.

That means the subsurface conditions recorded are contemporary with early human activity in the valley, not a frozen relic beneath it.


The logical endpoint

Once the inherited Ice Age valley-fill model fails, there is no remaining geological mechanism that can explain:

→ hundreds of vertically stacked water-related horizons
→ deep penetration below the periglacial zone
→ dominance of water-affected material in valley-floor boreholes
→ absence of the same features on surrounding high ground

The only explanation that fits all observations is long-term post-glacial water activity confined to the Stonehenge valley system.

At this point, the question is no longer geological.

It is historical.

 (What Archaeology Missed Beneath Stonehenge)
(What Archaeology Missed Beneath Stonehenge)

12. Locking into the Wider System

River terraces, meltwater volume, and scale

The borehole evidence beneath Stonehenge Bottom does not exist in isolation. Its significance only becomes fully apparent when it is placed back into the regional post-glacial hydrological system that governed southern Britain after the last Ice Age.

Once this wider context is restored, the Stonehenge record stops looking anomalous and instead becomes inevitable.


River terraces are volume records, not abstractions

River terraces are not symbolic features. They are physical records of water volume, discharge duration, and base-level control.

Each terrace represents a prolonged period during which:
→ meltwater input was sustained
→ base level stabilised long enough for lateral activity
→ rivers occupied a relatively fixed elevation

The Avon terrace staircase is therefore not a static landscape. It is a hydrological archive.


Why terrace height matters more than terrace age

Traditional interpretations tend to treat terraces primarily as chronological markers. In doing so, they obscure their more important function: recording the magnitude of water involved.

Higher terraces require:
→ greater meltwater volumes
→ longer durations of elevated discharge
→ sustained backing-up of inland valleys

This is not controversial. It is basic fluvial physics.


Re-evaluating Ice Age scale

The terrace staircase of the Avon has typically been explained using a model in which the most recent Ice Age contributed only a minor proportion of the total erosive and depositional work — often framed as being small compared to much earlier glacial phases.

The borehole evidence at Stonehenge Bottom contradicts this.

If meltwater volumes from the last glaciation were truly negligible, the valley would not record:
→ repeated Holocene water occupation
→ deep subsurface reworking below the periglacial zone
→ dominance of water-affected material in valley-floor boreholes

The only way to reconcile the terrace staircase with the borehole data is to accept that the most recent Ice Age contributed meltwater volumes large enough to drive active water levels up to at least Terrace T9.


Why Stonehenge Bottom sits where it does

Stonehenge Bottom occupies a low-gradient section of the Avon system, precisely where back-flooding, ponding, and stabilised water levels would be expected during periods of elevated base level.

The borehole record confirms this:
→ water-related horizons stack vertically at consistent elevations
→ disruption intensifies toward the valley floor
→ surrounding high ground remains dry and intact

This is not random. It is system behaviour.

 (What Archaeology Missed Beneath Stonehenge)
(What Archaeology Missed Beneath Stonehenge)

Linking local depth to the regional scale

What the Stonehenge boreholes record is the local expression of a regional process.

The same meltwater that:
→ drove terrace formation downstream
→ sustained discharge into the North Sea
→ reconfigured river systems across southern Britain

…also occupied and re-occupied the Stonehenge valley.

The valley was not an exception.
It was part of the system.


Why this matters for interpretation

Once Stonehenge is placed back into this wider hydrological framework, long-standing interpretive problems dissolve:

→ why early activity clusters near the valley
→ why features sit at specific elevations
→ why subsurface evidence contradicts “dry chalk” assumptions

The landscape was not marginally wet.
It was structurally water-dominated during key periods.


Scale closes the loop.

Small explanations fail because the phenomenon is not small.

A handful of floods cannot produce:
→ hundreds of stratigraphically discrete water horizons
→ deep chalk reworking confined to a valley
→ terrace systems extending across catchments

Only long-duration, large-volume meltwater systems can do that.

Stonehenge Bottom records one node of that system.

And now, for the first time, the subsurface evidence allows that system to be traced — quantitatively, spatially, and historically.

 (What Archaeology Missed Beneath Stonehenge)
(What Archaeology Missed Beneath Stonehenge)

13. What This Forces Archaeology and Geology to Confront

The borehole evidence beneath Stonehenge Bottom does not merely add detail to an existing narrative. It invalidates a foundational assumption shared by both archaeology and geology: that the Stonehenge landscape was fundamentally dry, stable chalk throughout the Holocene.

Once that assumption fails, a cascade of consequences follows.


Archaeology’s problem: interpretation without ground conditions

For decades, archaeological interpretation around Stonehenge has proceeded as if subsurface conditions were either irrelevant or already understood.

They were neither.

Ritual, symbolic, and cosmological explanations were layered onto features whose physical setting had never been tested against the subsurface record. Mesolithic posts became curiosities. Linear features became symbolic avenues. Landscape use was inferred without first establishing whether the ground itself was dry, wet, stable, or seasonally occupied.

The boreholes now show that this approach is untenable.

If water dominated the valley floor for prolonged periods:
→ site placement must be re-evaluated
→ access routes must be reconsidered
→ early structures must be understood as responses to water, not abstractions from it

This is not a reinterpretation of artefacts.
It is a correction to the environmental framework in which they were placed.


Geology’s problem: description without measurement

Geology’s failure is quieter, but deeper.

The borehole logs contained the evidence all along:
→ gravels
→ marls
→ shell material
→ softened chalk
→ solution features
→ voids

But these were described qualitatively, isolated within individual logs, and never synthesised into a landscape-scale analysis.

Words replaced numbers.
Confidence replaced calculation.

No one asked:
→ how many water-related horizons exist
→ how thick they are cumulatively
→ how frequently they occur with depth
→ how they vary spatially across the valley

Once those questions are asked, the “dry chalk” assumption collapses mathematically.


The disciplinary gap that allowed this to persist

Archaeology deferred to geology on ground conditions.
Geology deferred to archaeology on relevance.

Between them, the subsurface record was never integrated.

This is how a landscape can be mischaracterised for decades despite the data being publicly available.


Why this is not an attack on expertise

This work does not argue that archaeologists or geologists were careless or incompetent. It argues something more uncomfortable:

They were working inside inherited models that were never quantitatively tested.

That is not a personal failure.
It is a methodological one.


What changes from here on

The implications are straightforward and unavoidable:

→ subsurface data must precede interpretation
→ water involvement must be quantified, not described
→ control boreholes must be used to define disturbance limits
→ surface features cannot be interpreted independently of what lies beneath them

These are not radical demands.
They are basic scientific ones.


Stonehenge as a test case, not an exception

Stonehenge is not unique because it is famous.
It is unique because it is documented.

If this level of subsurface reworking can be demonstrated here, it raises obvious questions about other chalk landscapes that have never been tested at this resolution.

Stonehenge is simply where the failure becomes visible.


The final position

This work does not ask archaeology or geology to abandon their disciplines.
It asks them to finish the job properly.

The ground has already recorded what happened.

All that remained was to count it.

Because of the huge amount of data and this blog being over 6000 words, PART II, with all the technical data, including all boreholes, will be published next week.

Podcast

Author’s Biography

Robert John Langdon, a polymathic luminary, emerges as a writer, historian, and eminent specialist in LiDAR Landscape Archaeology.

His intellectual voyage has interwoven with stints as an astute scrutineer for governmental realms and grand corporate bastions, a tapestry spanning British Telecommunications, Cable and Wireless, British Gas, and the esteemed University of London.

A decade hence, Robert’s transition into retirement unfurled a chapter of insatiable curiosity. This phase saw him immerse himself in Politics, Archaeology, Philosophy, and the enigmatic realm of Quantum Mechanics. His academic odyssey traversed the venerable corridors of knowledge hubs such as the Museum of London, University College London, Birkbeck College, The City Literature Institute, and Chichester University.

In the symphony of his life, Robert is a custodian of three progeny and a pair of cherished grandchildren. His sanctuary lies ensconced in the embrace of West Wales, where he inhabits an isolated cottage, its windows framing a vista of the boundless sea – a retreat from the scrutinous gaze of the Her Majesty’s Revenue and Customs, an amiable clandestinity in the lap of nature’s embrace.

Exploring Prehistoric Britain: A Journey Through Time

My blog delves into the fascinating mysteries of prehistoric Britain, challenging conventional narratives and offering fresh perspectives based on cutting-edge research, particularly using LiDAR technology. I invite you to explore some key areas of my research. For example, the Wansdyke, often cited as a defensive structure, is re-examined in light of new evidence. I’ve presented my findings in my blog post Wansdyke: A British Frontier Wall – ‘Debunked’, and a Wansdyke LiDAR Flyover video further visualizes my conclusions.

My work also often challenges established archaeological dogma. I argue that many sites, such as Hambledon Hill, commonly identified as Iron Age hillforts are not what they seem. My posts Lidar Investigation Hambledon Hill – NOT an ‘Iron Age Fort’ and Unmasking the “Iron Age Hillfort” Myth explore these ideas in detail and offer an alternative view. Similarly, sites like Cissbury Ring and White Sheet Camp, also receive a re-evaluation based on LiDAR analysis in my posts Lidar Investigation Cissbury Ring through time and Lidar Investigation White Sheet Camp, revealing fascinating insights into their true purpose. I have also examined South Cadbury Castle, often linked to the mythical Camelot56.

My research also extends to the topic of ancient water management, including the role of canals and other linear earthworks. I have discussed the true origins of Car Dyke in multiple posts including Car Dyke – ABC News PodCast and Lidar Investigation Car Dyke – North Section, suggesting a Mesolithic origin2357. I also explore the misidentification of Roman aqueducts, as seen in my posts on the Great Chesters (Roman) Aqueduct. My research has also been greatly informed by my post-glacial flooding hypothesis which has helped to inform the landscape transformations over time. I have discussed this hypothesis in several posts including AI now supports my Post-Glacial Flooding Hypothesis and Exploring Britain’s Flooded Past: A Personal Journey

Finally, my blog also investigates prehistoric burial practices, as seen in Prehistoric Burial Practices of Britain and explores the mystery of Pillow Mounds, often mistaken for medieval rabbit warrens, but with a potential link to Bronze Age cremation in my posts: Pillow Mounds: A Bronze Age Legacy of Cremation? and The Mystery of Pillow Mounds: Are They Really Medieval Rabbit Warrens?. My research also includes the astronomical insights of ancient sites, for example, in Rediscovering the Winter Solstice: The Original Winter Festival. I also review new information about the construction of Stonehenge in The Stonehenge Enigma.

Further Reading

For those interested in British Prehistory, visit www.prehistoric-britain.co.uk, a comprehensive resource featuring an extensive collection of archaeology articles, modern LiDAR investigations, and groundbreaking research. The site also includes insights and extracts from the acclaimed Robert John Langdon Trilogy, a series of books exploring Britain during the Prehistoric period. Titles in the trilogy include The Stonehenge Enigma, Dawn of the Lost Civilisation, and The Post Glacial Flooding Hypothesis, offering compelling evidence about ancient landscapes shaped by post-glacial flooding.

To further explore these topics, Robert John Langdon has developed a dedicated YouTube channel featuring over 100 video documentaries and investigations that complement the trilogy. Notable discoveries and studies showcased on the channel include 13 Things that Don’t Make Sense in History and the revelation of Silbury Avenue – The Lost Stone Avenue, a rediscovered prehistoric feature at Avebury, Wiltshire.

In addition to his main works, Langdon has released a series of shorter, accessible publications, ideal for readers delving into specific topics. These include:

For active discussions and updates on the trilogy’s findings and recent LiDAR investigations, join our vibrant community on Facebook. Engage with like-minded enthusiasts by leaving a message or contributing to debates in our Facebook Group.

Whether through the books, the website, or interactive videos, we aim to provide a deeper understanding of Britain’s fascinating prehistoric past. We encourage you to explore these resources and uncover the mysteries of ancient landscapes through the lens of modern archaeology.

For more information, including chapter extracts and related publications, visit the Robert John Langdon Author Page. Dive into works such as The Stonehenge Enigma or Dawn of the Lost Civilisation, and explore cutting-edge theories that challenge traditional historical narratives.

Other Blogs

[sitemap_posts]