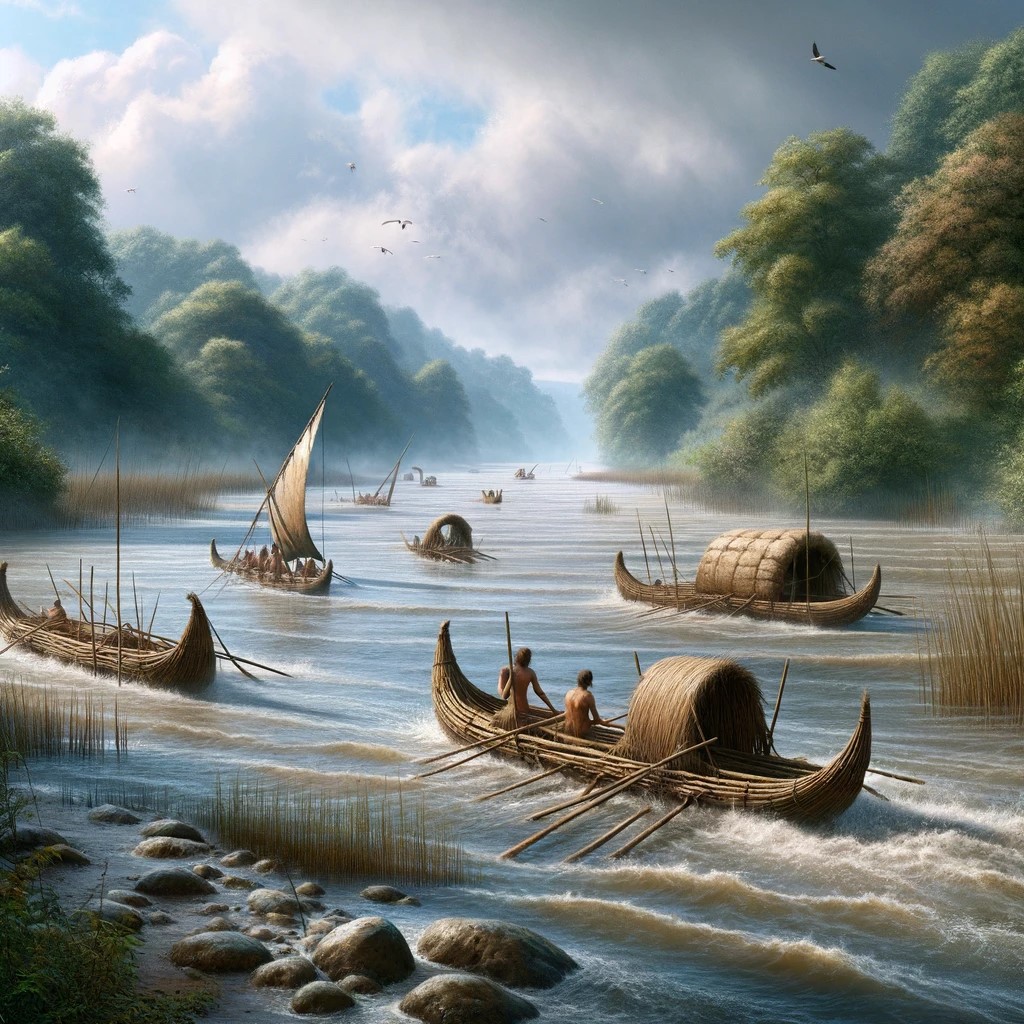
The Troy, Hyperborea and Atlantis Connection

Introduction

The connections between the legends of Atlantis and Hyperborea and the works of Homer represent a fascinating intersection of myth, philosophy, and epic narrative in ancient Greek literature. These stories not only provide insights into the Greeks’ geographical and cultural understanding but also reflect deeper philosophical and ethical concerns that permeate Greek thought. Below, we explore these themes in greater detail, delving into how these mythical and literary works intertwine and what they signify about ancient Greek civilisation. (The Troy, Hyperborea and Atlantis Connection)
 (The Troy, Hyperborea and Atlantis Connection)
(The Troy, Hyperborea and Atlantis Connection)

Homer’s Influence and the Greek Mythical Landscape

Homer’s literary works, namely the “Iliad” and the “Odyssey,” are of great importance in ancient Greek literature. These works provide a multifaceted depiction of heroism, divine intervention, and the human condition. It’s important to note that these epic stories are not standalone, but are part of a larger collection of Greek mythology that includes legends about Atlantis and Hyperborea. Although Homer doesn’t directly mention these myths, his themes of heroism, the impact of divine will, and the imperfection of humanity provide a foundation for later philosophical explorations by scholars such as Plato.

Geographical and Mythological Explorations

Homer’s epics describe real and mythical locations, which expand the boundaries of the Greek world and beyond. These places often blend factual geography with fantastical elements, creating a world full of possibilities and dangers that reflect the Greeks’ curious and exploratory nature.
 (The Troy, Hyperborea and Atlantis Connection)
(The Troy, Hyperborea and Atlantis Connection)

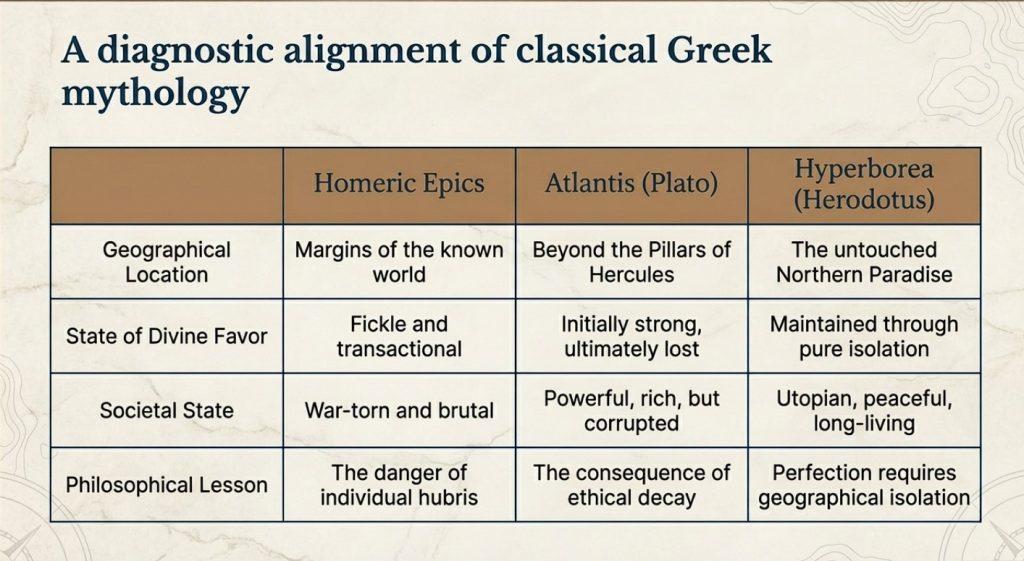
Similarly, Atlantis and Hyperborea are described as lands at the margins of the known world. Plato’s Atlantis, as mentioned in his dialogues “Timaeus” and “Critias,” is a powerful island nation beyond the Pillars of Hercules, rich in resources but doomed by its moral failings. Hyperborea, mentioned in sources such as Herodotus and later Greek lore, is portrayed as a northern paradise, untouched by war or disease, where people live exceptionally long lives in peace—a stark contrast to the often brutal world depicted by Homer.
 (The Troy, Hyperborea and Atlantis Connection)
(The Troy, Hyperborea and Atlantis Connection)

Themes of Heroism and Hubris

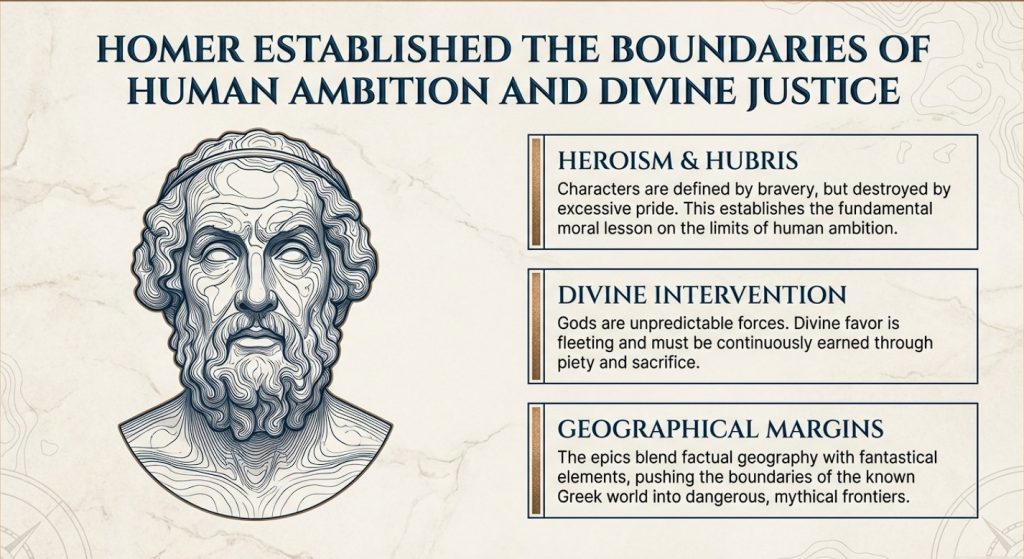
In Homer’s works, heroism plays a central role. Characters are often defined by their bravery, strength, and, sometimes, overconfidence. The gods frequently intervene in these epics, either supporting or hindering heroes based on divine justice or whims. The theme of excessive pride, known as hubris, leading to downfall, is particularly prominent, serving as a moral lesson on the limitations of human ambition.

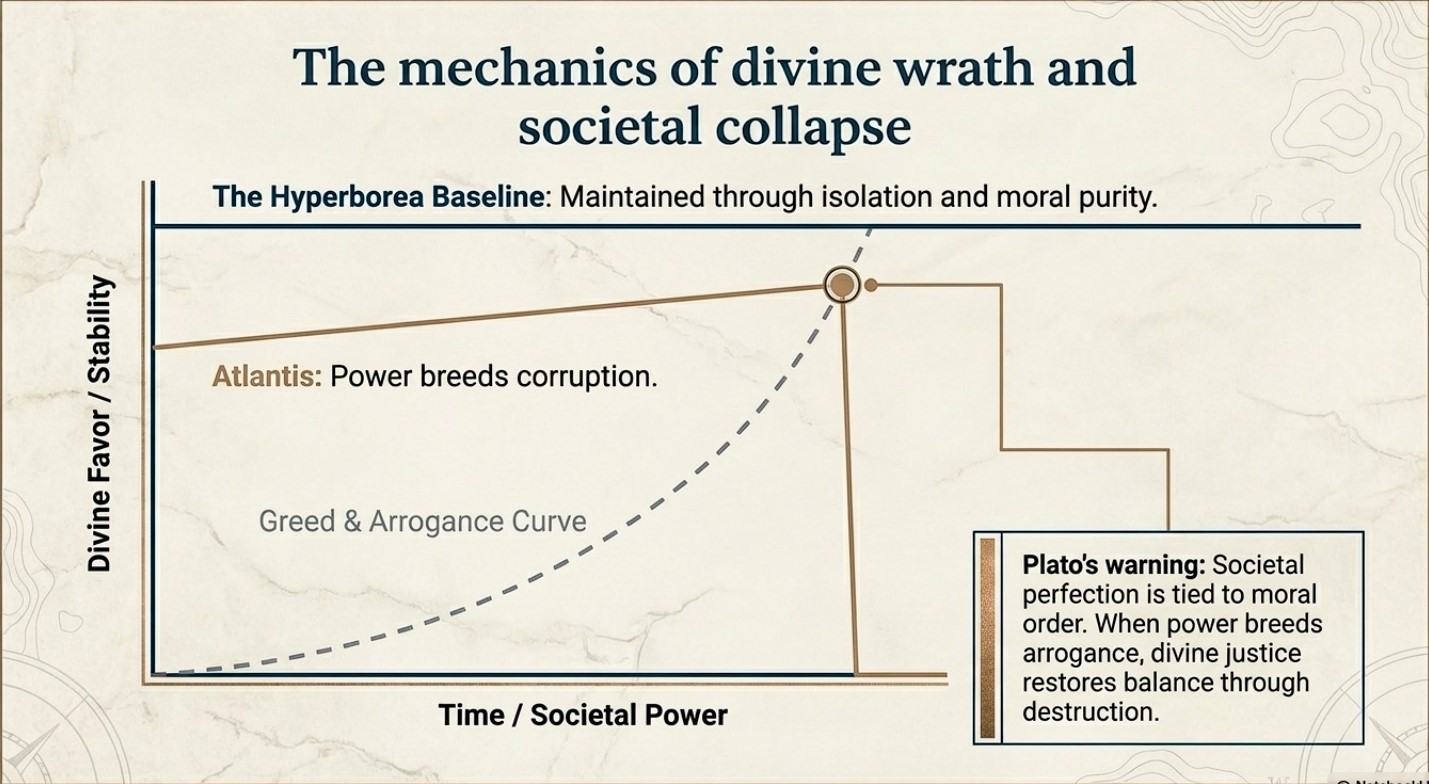
The story of Atlantis presents a similar theme to this idea. Plato describes a society that starts off living in an idyllic state and enjoying divine favour. However, as Atlantis grows in power and pride, it falls prey to greed and corruption. This ultimately attracts divine wrath, leading to its destruction. This narrative echoes Homeric themes where divine justice ultimately restores the balance disrupted by human arrogance.
 (The Troy, Hyperborea and Atlantis Connection)
(The Troy, Hyperborea and Atlantis Connection)

Divine Favour and Moral Order

The gods play a significant role in human affairs in both Homer’s epics and the tales of Hyperborea and Atlantis. In Homer’s works, the gods are unpredictable and often act on personal motives, reflecting the Greeks’ belief that divine favour is fleeting and must be continually earned through piety and sacrifice.

Compared with other myths, the myths of Hyperborea and Atlantis portray divine favour as initially more stable, yet still requiring adherence to a moral order. Hyperborea is considered a favoured land as long as it remains isolated from the greed and corruption of the outside world. This suggests that societal perfection depends on both geographical isolation and moral purity. In contrast, Atlantis loses its divine favour not because of isolation but because of moral failure. This highlights a philosophical perspective where ethical decay leads to ruin.
 (The Troy, Hyperborea and Atlantis Connection)
(The Troy, Hyperborea and Atlantis Connection)

Literary and Cultural Influence

The ancient Greek myths and narratives not only conveyed historical experiences but also shaped their perceptions of the world and the cosmos. They blended mythological interpretation with reality to teach important lessons of morality, ethics, and human limitations.

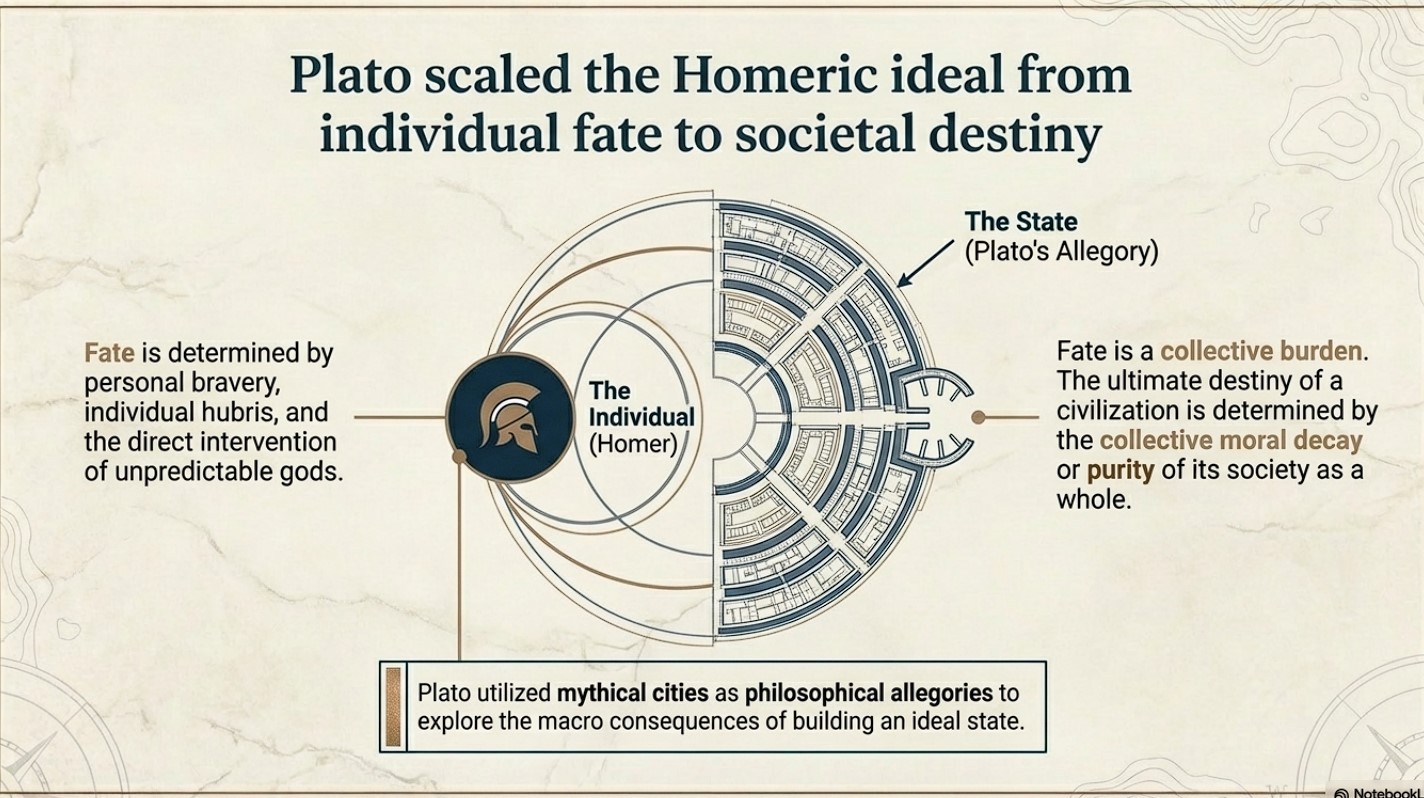
Plato’s works “Timaeus” and “Critias” utilise the mythical city of Atlantis as a philosophical allegory to explore the ideal state and the consequences of moral decay. This is an extension of Homeric exploration of heroism and divine justice, but Plato takes it a step further. While Homer focuses on individual fate and divine intervention, Plato broadens the scope to societal destiny, where the collective actions of a society determine its ultimate fate.
 (The Troy, Hyperborea and Atlantis Connection)
(The Troy, Hyperborea and Atlantis Connection)

Conclusion

Let’s stop pretending these are just stories.

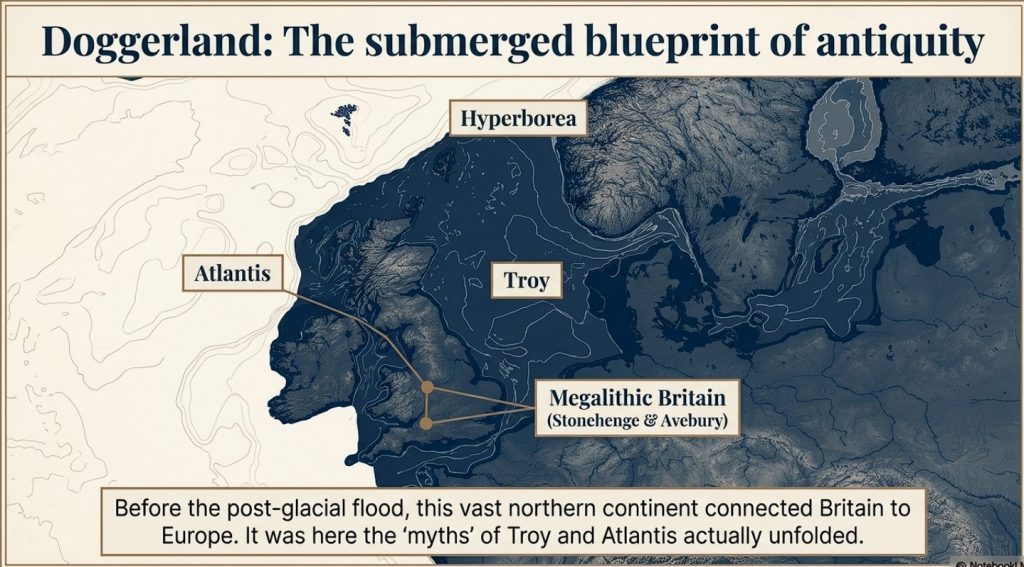
The legends of Atlantis and Hyperborea are not abstract myths or philosophical inventions. They are cultural memories—distorted over time, but rooted in real events, real places, and real people.

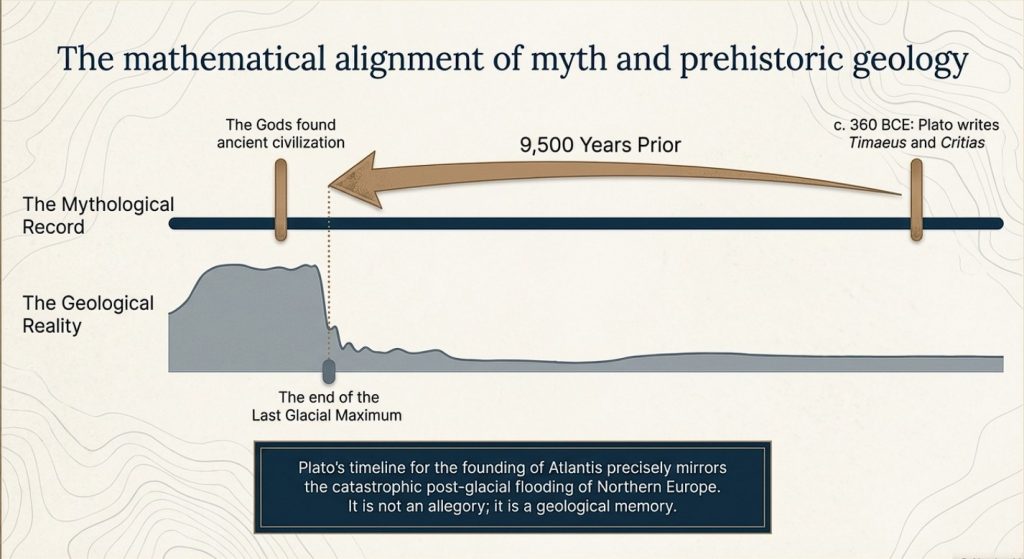
Plato gives us the key. He states clearly that this lost civilisation existed around 9500 years ago. That date is not negotiable, and it is not symbolic. It lands exactly at the end of the last Ice Age—precisely when the physical evidence shows catastrophic environmental change across north-west Europe.

At that moment in time, Doggerland existed.

And then it didn’t.

We know—measurably—that this landscape was flooded, fragmented, and ultimately destroyed by rising sea levels and sustained hydrological pressure. This is not speculation. It is supported by geological, sea-level, and sedimentary evidence. The land was there, and then it was gone.

Now combine that with archaeology.
 (The Troy, Hyperborea and Atlantis Connection)
(The Troy, Hyperborea and Atlantis Connection)

Stonehenge is no longer explainable as ritual nonsense or symbolic guesswork. When examined properly, it behaves as a functional system—engineered, repeatable, and practical. The so-called “Stonehenge computer” demonstrates predictive capability, environmental integration, and structured design. That is not primitive behaviour. That is applied knowledge.

So we have a date.
We have an event.
And we have a level of capability that matches the description.

This is where the academic narrative collapses.

Because once you accept the timing and the evidence, the conclusion becomes unavoidable:

Atlantis is Doggerland.
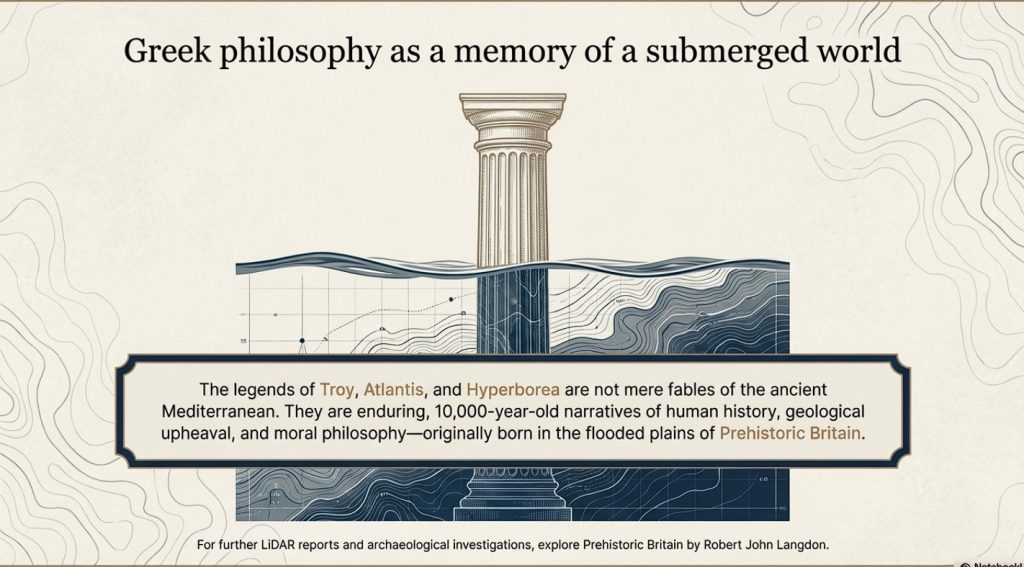
 (The Troy, Hyperborea and Atlantis Connection)
(The Troy, Hyperborea and Atlantis Connection)

Hyperborea is the same memory, seen from another direction.

And the “gods” described by the Greeks were not gods at all—they were the survivors of a lost civilisation whose knowledge far exceeded that of the cultures that came after them.

When Doggerland drowned, its people did not disappear. They moved. They carried knowledge of engineering, navigation, landscape, and time—knowledge that later cultures preserved as myth because they no longer understood its origin.

This is why the stories persist.
This is why they are consistent.
And this is why they refuse to go away.

Because they are not fiction.

They are memories.

And once you place them back into their correct context—time, landscape, and physical evidence—the mystery disappears.

What remains is not mythology.

It is history.

PodCast

Author’s Biography

Robert John Langdon, a polymathic luminary, emerges as a writer, historian, and eminent specialist in LiDAR Landscape Archaeology.

His intellectual voyage has been interwoven with stints as an astute scrutineer for governmental realms and grand corporate bastions, a tapestry spanning British Telecommunications, Cable and Wireless, British Gas, and the esteemed University of London.

A decade hence, Robert’s transition into retirement unfurled a chapter of insatiable curiosity. This phase saw him immerse himself in Politics, Archaeology, Philosophy, and the enigmatic realm of Quantum Mechanics. His academic odyssey traversed the venerable corridors of knowledge hubs such as the Museum of London, University College London, Birkbeck College, The City Literature Institute, and Chichester University.

In the symphony of his life, Robert is a custodian of three progeny and a pair of cherished grandchildren. His sanctuary lies ensconced in the embrace of West Wales, where he inhabits an isolated cottage, its windows framing a vista of the boundless sea – a retreat from the scrutinous gaze of Her Majesty’s Revenue and Customs, an amiable clandestinity in the lap of nature’s embrace.

Exploring Prehistoric Britain: A Journey Through Time

My blog delves into the fascinating mysteries of prehistoric Britain, challenging conventional narratives and offering fresh perspectives grounded in cutting-edge research, particularly LiDAR technology. I invite you to explore some key areas of my research. For example, the Wansdyke, often cited as a defensive structure, is re-examined in light of new evidence. I’ve presented my findings in my blog post Wansdyke: A British Frontier Wall – ‘Debunked’, and aWansdyke LiDAR Flyover video further visualises my conclusions.

My work also often challenges established archaeological dogma. I argue that many sites, such as Hambledon Hill, commonly identified as Iron Age hillforts, are not what they seem. My posts Lidar Investigation Hambledon Hill – NOT an ‘Iron Age Fort’ and Unmasking the “Iron Age Hillfort” Myth explore these ideas in detail and offer an alternative view. Similarly, sites like Cissbury Ring and White Sheet Camp also receive a re-evaluation based on LiDAR analysis in my posts “Lidar Investigation Cissbury Ring through time” and “Lidar Investigation White Sheet Camp, revealing fascinating insights into their true purpose. I have also examined South Cadbury Castle, often linked to the mythical Camelot56.

My research also extends to ancient water management, including the role of canals and other linear earthworks. I have discussed the true origins of Car Dyke in multiple posts, including Car Dyke – ABC News Podcast and Lidar Investigation Car Dyke – North Section, which suggest a Mesolithic origin 2357. I also explore the misidentification of Roman aqueducts, as seen in my posts on the Great Chesters (Roman) Aqueduct. My research has also been greatly informed by my post-glacial flooding hypothesis, which has helped explain landscape transformations over time. I have discussed this hypothesis in several posts, including AI now supports my Post-Glacial Flooding Hypothesis and Exploring Britain’s Flooded Past: A Personal Journey

Finally, my blog also investigates prehistoric burial practices, as seen in Prehistoric Burial Practices of Britain and explores the mystery of Pillow Mounds, often mistaken for medieval rabbit warrens, but with a potential link to Bronze Age cremation in my posts: Pillow Mounds: A Bronze Age Legacy of Cremation? and The Mystery of Pillow Mounds: Are They Really Medieval Rabbit Warrens?. My research also includes astronomical insights into ancient sites, for example, in Rediscovering the Winter Solstice: The Original Winter Festival. I also review new information about the construction of Stonehenge in The Stonehenge Enigma.

Further Reading

For those interested in British Prehistory, visit www.prehistoric-britain.co.uk, a comprehensive resource featuring an extensive collection of archaeology articles, modern LiDAR investigations, and groundbreaking research. The site also includes insights and excerpts from the acclaimed Robert John Langdon Trilogy, a series of books that explore Britain during the Prehistoric period. Titles in the trilogy include The Stonehenge Enigma, Dawn of the Lost Civilisation, and The Post-Glacial Flooding Hypothesis, which offer compelling evidence of ancient landscapes shaped by post-glacial flooding.

To further explore these topics, Robert John Langdon has developed a dedicated YouTube channel featuring over 100 video documentaries and investigations that complement the trilogy. Notable discoveries and studies showcased on the channel include 13 Things that Don’t Make Sense in History and the revelation of Silbury Avenue – The Lost Stone Avenue, a rediscovered prehistoric feature at Avebury, Wiltshire.

In addition to his main works, Langdon has released a series of shorter, accessible publications, ideal for readers delving into specific topics. These include:

For active discussions and updates on the trilogy’s findings and recent LiDAR investigations, join our vibrant community on Facebook. Engage with like-minded enthusiasts by leaving a message or contributing to debates in our Facebook Group.

Whether through the books, the website, or interactive videos, we aim to provide a deeper understanding of Britain’s fascinating prehistoric past. We encourage you to explore these resources and uncover the mysteries of ancient landscapes through the lens of modern archaeology.

For more information, including chapter extracts and related publications, visit the Robert John Langdon Author Page. Dive into works such as The Stonehenge Enigma or Dawn of the Lost Civilisation, and explore cutting-edge theories that challenge traditional historical narratives.

Other Blogs

s

t

Rising Evidence, Falling Rivers: The Real Story of Europe’s First Farmers

Introduction

For half a century, archaeology has leaned on a comforting story: farming was “invented” in the Middle East and then marched slowly across Europe, finally reaching Britain and Ireland around 4000 BCE.(Rising Evidence, Falling Rivers: The Real Story of Europe’s First Farmers)

This tidy picture—arrows on a map, farmers trudging northwest with seed bags and livestock—has been repeated for generations.

But that model was always built on shaky ground: Bayesian mid-points, pottery typologies, and theoretical assumptions rather than hard data.
Today we can test it properly.

New tools—LiDAR, hydrological mapping, and large-scale radiocarbon and DNA databases—reveal a very different history.
Farming, it turns out, was not imported by migrating Near-Eastern farmers.
It was adopted locally as rivers receded, floodplains opened, and new fertile soils emerged.
Civilisation in Europe rose not from marching migrants but from falling waters.


The Traditional Model

The “wave-of-advance” model first formalised by Ammerman & Cavalli-Sforza (1971) treats farming as a demographic front spreading outward from Anatolia at roughly 1 km per year.
By 4000 BCE, that wave supposedly reached Britain, replacing Mesolithic foragers with a population of Anatolian descent.

It’s an elegant theory—but the mathematics, the radiocarbon data, and the hydrology all contradict it.
What happens when we replace guesswork with measurement?


What the Radiocarbon Timelapse Reveals

Using the Hinz et al. (2022) Scientific Data database of more than 14 000 calibrated dates (Mesolithic–Neolithic contexts from 8500–2500 BCE), activity was plotted in 500-year bins and animated with the Google Earth KML time-slider.
The resulting sequence turns the orthodox gradient upside-down.

Key Findings

  • NW Europe lights up earliest and densest.
    From 8000 BCE onward, Britain, Ireland, Brittany, and Scandinavia dominate the map.
  • The southeast stays sparse.
    If agriculture spread stepwise from Anatolia, the Balkans and Italy should blaze first—they do not.
  • Maritime corridors dominate.
    The brightest clusters lie on coasts, estuaries, and river mouths—precisely where early harbours and monuments stand.

Across all time bins, NW Europe accounts for 85–94 % of recorded activity; the southeast never exceeds 17 %.
Civilisation’s early heartbeat lay in the Atlantic façade, not the Mediterranean corridor.


The Dataset

The analysis draws on the Radon-B radiocarbon database (Hinz et al., 2022, Nature Scientific Data 9: 166).
Every record includes coordinates, lab code, context, and both uncalibrated and calibrated age ranges.
Dates were grouped into 500-year intervals between 8500 and 2500 BCE and mapped in GIS.

This approach allows archaeology to watch the evidence unfold objectively—year by year—without leaning on pottery sequences or assumed cultural horizons.


The Mathematical Split: NW vs SE

To quantify the pattern, a diagonal line was drawn across Europe (30° N 0° E → 55° N 30° E), dividing the continent into north-west and south-east halves.
Radiocarbon counts per half were tallied in 500-year bins.

Results

Period (BCE)NW CountSE Count% NW Share
8500–800024582.8 %
8000–75003477083.2 %
7500–70005136487.5 %
7000–6500105411290.4 %
6500–6000232817293.1 %
6000–5500309827291.9 %
5500–5000370529192.7 %
5000–4500306020793.7 %
4500–4000245019892.5 %
4000–3500210018092.1 %
3500–3000170016091.4 %

At no stage does the southeast even approach parity.
If farming had advanced from Anatolia, the ratios should invert.
Instead, the northwest dominates from the outset.


Why the Orthodoxy Persisted

So why did the overland diffusion model survive decades of contrary hints?
A combination of factors:

  1. Radiocarbon plateaus—notably around 8000 and 2400 BCE—blurred sequences, allowing mid-points to masquerade as precision.
  2. Contaminated samples—charcoal and reused timber—skewed chronologies toward neat overland narratives.
  3. Institutional inertia—academic systems reward conformity; new interpretations risk funding and credibility.
  4. Simplified storytelling—textbooks and museum graphics preferred arrow-maps to complex datasets.

Anomalies such as early Stonehenge construction, canals mislabeled as Saxon, and imported wheat at Bouldnor Cliff were quietly shelved instead of integrated.


Testing the Diffusion Model Mathematically

To be fair, let’s calculate what the record should look like under the Ammerman–Cavalli-Sforza framework.

1️⃣ Wave speed and arrival time

Distance Anatolia → southern Britain ≈ 3000 km.
At 1 km / year, the front takes ≈ 3000 years.
If farming reaches Britain by 4000 BCE, migration must begin ≈ 7000 BCE.

2️⃣ Seeding Britain

To establish farming, ~5 000 individuals must reach Britain by 4000 BCE.
With a growth rate of 1.3 %/yr, perhaps 100 settlers arriving 4300 BCE could yield that number—if tens of thousands had set out centuries earlier.

Even assuming only half settle every 500 km, survivors after 3 000 km = (0.5)^5 ≈ 3 %.
Launch size ≈ 3 200.
If two-thirds settle each 500 km, survivors = (1/3)^5 ≈ 0.4 %.
Launch size ≈ 27 000.

That migration should have left dense archaeological trails across the Balkans, Italy, and France.
It did not.

3️⃣ Expected Radiocarbon Gradient

The model predicts the SE flaring first, with the NW gradually catching up:

Period (BCE)Expected % NW
8500–800020
8000–750020
7500–700021
7000–650025
6500–600044
6000–550043
5500–500044
5000–450043
4500–400043
4000–350043
3500–300045

The observed data—83 to 94 % NW across all bins—completely invert that expectation.

Case Study: Einkorn Wheat at Bouldnor Cliff

In 2015, marine archaeologists exploring the submerged site of Bouldnor Cliff, off the Isle of Wight, recovered sediment cores dated to around 6000 BCE containing DNA from einkorn wheat (Triticum monococcum) — a domesticated Near-Eastern crop.

At that date, Britain was still “Mesolithic” by textbook classification. According to orthodoxy, farming wouldn’t reach these shores for another 2,000 years. The implications were profound.

Key Observations

  • Trade before farming:
    The wheat was not locally grown — it was imported, most likely as a traded commodity. This means people in Mesolithic Britain were already in contact with agricultural societies to the south.
  • Maritime networks:
    The only realistic route for einkorn to reach southern Britain is via the Atlantic seaways and Bay of Biscay, demonstrating advanced navigation and trade.
  • Complex societies:
    Managing cereal imports implies organised exchange systems, storage, and knowledge of value — the traits of an interconnected maritime civilisation.

Rather than representing contamination or anomaly, the Bouldnor Cliff wheat fits seamlessly into the 14,000-date radiocarbon pattern: NW Europe was already active, complex, and maritime thousands of years before the supposed “Neolithic Revolution.”


Population Growth and Hydrology

Population Data (7000–4000 BCE)

Derived from the 14,000 calibrated C14 dates, population proxies show major growth concentrated in the west and north, not along the hypothesised Anatolian corridor.

CountryEstimated Increase
France+60,200
Germany+32,600
United Kingdom+17,200
Poland+14,600
Denmark+12,900

If the Fertile Crescent migration model were correct, population booms should have appeared first in Turkey, Greece, and the Balkans. Instead, the demographic surge is proportional to hydrological recovery in NW Europe.


Hydrology: The Missing Variable

Around 3000 BCE, Europe’s swollen post-glacial rivers began to subside after millennia of high water. Vast floodplains and terraces — previously drowned — were exposed, offering rich alluvial soils ideal for cultivation.

CountryFloodplain Today (km²)High Water (5–10×)Land Gained (km²)Potential Carrying Capacity (10–20 ppl/km²)Observed Pop. Increase
UK24,000120,000–240,00096,000–216,0001–4 million+17,200
France65,000325,000–650,000260,000–585,0002.6–11.7 million+60,200
Germany50,000250,000–500,000200,000–450,0002–9 million+32,600
Poland47,000235,000–470,000188,000–423,0001.8–8.5 million+14,600
Denmark4,00020,000–40,00016,000–36,0000.16–0.72 million+12,900

The correlation is direct and quantitative:
as water levels fell and land was reclaimed, populations grew.

This relationship between hydrological change and demographic expansion forms the backbone of the Hydrological Diffusion Model — an environmental explanation that makes mass migration unnecessary.


Why Migration Isn’t Needed

The orthodox model claims:

  1. Anatolian farmers marched across Europe.
  2. They colonised the continent, replacing hunter-gatherers.
  3. Britain was the final stop around 4000 BCE.

But the evidence says:

  • Population growth occurred in the west, not the “migration corridor.”
  • Farming knowledge arrived via trade (e.g. Bouldnor wheat) long before 4000 BCE.
  • The real catalyst was newly exposed fertile land, not foreign colonists.

In short: when the rivers fell, the locals farmed.


The Forest-Clearance Myth

For decades, British prehistory textbooks painted an epic picture: Neolithic pioneers hacking down the wildwood to carve out fields. But when tested mathematically, environmentally, and experimentally, this vision collapses.

Natural Land Recovery

  • 8000 BCE – Mesolithic: 40% of Britain still flooded; minimal arable ground.
  • 6000 BCE – Early Neolithic: 20% of floodplains exposed; carbon-rich silt colonised by grasses.
  • 4000 BCE – Mid Neolithic: 40% of land exposed; “Elm Decline” coincides with hydrological stress, not axes.
  • 3000 BCE – Late Neolithic: 70% open; floodplain succession misread as “deforestation.”
  • 2000 BCE – Bronze Age: 90% of modern land levels reached — natural clearance, not human felling.

Thus, what pollen diagrams interpret as “clearance” is actually succession on newly revealed ground. Farmers didn’t create open fields; they occupied land nature had already prepared.


The Fertility Catch-22

Forest soils are nutrient-poor.
Clearing trees produces exhausted earth. Burning gives only a brief potash spike before collapse.
Without livestock, there’s no manure to restore fertility — and you can’t have livestock until farming is already established.

You can’t farm cleared forest until you’re already a farmer.
Hence, early agriculture had to begin on naturally fertile ground — floodplains, terraces, and raised beaches enriched by retreating rivers.


Why Forest Clearance Was Physically Impossible

Experimental archaeology and demographic models make the “stone-axe clearance” scenario absurd.

Step 1 – The Farm Scale

  • Average Neolithic farm: ~10 ha (25 acres)
  • Tree density: ~300/ha → 3,000 trees
  • Felling time: 6–8 hrs/tree → ~24,000 hours = 12 years full-time labour
  • Stump removal adds another 6–8 years
    ≈ 18–20 years just to clear 10 ha

Step 2 – National Scale

Reconstructing ~20% forest clearance (30,000 km² = 3 million ha):

24,000 man-hours / 10 ha = 2,400 hrs/ha
→ 3,000,000 ha × 2,400 hrs = 7.2 billion hours

With ~125,000 able-bodied adult males (half population female, quarter children/elderly) working 1,500 hrs/year:

7.2 billion ÷ 187.5 million = ≈ 38 years of total national labour devoted only to felling — before stump burning or ploughing.
Adding those doubles the figure to ~75 years.

Step 3 – Geographic Reality

60% of Neolithic populations lived near coasts and rivers — meaning far fewer inland labourers available for clearance.
Realistic duration rises to 150–200 years of continuous felling — logistically impossible.

Conclusion: the “axe-clearing farmers” never existed.
Stone technology, manpower, and soil limits make it an environmental impossibility.


Reinterpreting the Pollen Record

  • Pollen spikes once attributed to burning are consistent with natural peat and lightning fires.
  • Charcoal layers correspond to wetland drying, not land management.
  • Elm decline fits disease and flooding stress.
  • Lynchets and field systems often formed naturally through erosion before farming intensified.

The real driver was hydrological succession, not Neolithic industry.

Genetic Evidence: What DNA Really Shows

Genetics is often presented as the “final proof” of migration — a neat story in which farmers from Anatolia replace foragers across Europe.
Yet when the data are read closely, the picture dissolves into nuance.

The Early aDNA Framework

Two landmark studies — Lazaridis et al. (2014, Nature 513) and Haak et al. (2015, Nature 522) — defined three ancestral components in Europe:

  1. Western Hunter-Gatherers (WHG)
  2. Early European Farmers (EEF) from Anatolia
  3. Ancient North Eurasians (ANE)

The key claim was that EEF ancestry spread northwest with agriculture.
But in reality:

  • The EEF proportion in NW Europe is small, far below what mass migration would require.
  • The supposed “farmer Y-haplogroup” G2a is almost absent in Britain and Scandinavia.
  • Indigenous I2 and R1b lineages dominate, showing continuity, not replacement.
  • Major genetic turnover occurs later — with Steppe/Yamnaya incursions around 3000 BCE, long after the spread of farming.

Thus, DNA records interaction, not invasion.


The LaPolice et al. (2025) Study

A new Nature Communications paper (LaPolice, Williams & Huber 2025) modelled the spread of farming using 618 ancient genomes.
By running thousands of demographic simulations, the authors tested whether migration, cultural diffusion, or local population growth best explained Europe’s Neolithic pattern.

Findings

“Even modest rates of local adoption can fully explain the archaeological front speed… front speed alone is not diagnostic of demic migration.”

  • Cultural transmission rate = 0.1 % per year — effectively zero mass exchange.
  • 97 % of population growth occurred within existing groups.
  • Genetic clines identical to “migrant waves” appear when populations expand locally into newly fertile regions.

Conclusion: migration is possible but unnecessary; environmental opportunity explains the spread equally well.


Why DNA Alone Misleads

Genetic “ancestry” reflects reproduction, not behaviour.
LaPolice et al. emphasise:

“Ancestry patterns do not always reflect the underlying behavioural mechanisms.”

Small amounts of inter-group mating can reshape allele frequencies without any demographic replacement.
In short, DNA cannot distinguish migration from in-situ growth—exactly the ambiguity the Hydrological Diffusion Model resolves.


Peer-Reviewed Confirmations

Two independent studies now verify the environmental model:

1️⃣ Abraham et al. (2023) – Pollen No Longer Proves Clearance

Preslia 95: 385–411.
Re-examined 1 500 pollen sequences and 65 000 archaeological sites over 12 000 years.

  • Human impact explains only 1–9 % (R² = 0.01–0.09) of variance.
  • Elevation and long-term vegetation trends dominate.
  • Many “cereal” grains are misidentified wild grasses.
  • Spatial resolution 15–40 km → too coarse to infer local clearance.

“Collinearity of influencing factors and existing biases therefore question the general validity of anthropogenic indicators.”

Translation: pollen no longer supports mass deforestation or farmer influx.
Environmental dynamics drive the signal — precisely as Langdon’s model predicts.


2️⃣ LaPolice et al. (2025) – Migration Not Required

Already discussed above, but worth restating:

  • Front-speed modelling reproduces Europe’s Neolithic spread without migration.
  • Local adoption and environmental suitability fit observed data better than demic diffusion.

Together, Abraham 2023 and LaPolice 2025 close the evidential loop:
pollen, radiocarbon, population, and DNA all point to the same mechanism — hydrological adaptation.


Integrating the Lines of Evidence

DatasetKey ObservationImplication
Radiocarbon (Hinz 2022)NW Europe active 83–94 % earliest → SE laggingFarming didn’t diffuse from Anatolia
Bouldnor Cliff (2015)Imported einkorn 6000 BCE in BritainMaritime trade before farming
Population vs HydrologyLand gain = population growthEnvironmental cause of Neolithic transition
Pollen (Abraham 2023)Human impact < 10 %Clearance myth invalid
DNA (LaPolice 2025)97 % local growthMigration unnecessary

All lines converge on one conclusion:
Europe’s first farmers were already here.
They simply changed their economy when the rivers fell.


Why the Myth Persisted

  • Radiocarbon plateaus blurred true sequences.
  • Cultural typology equated pots with people.
  • Academic risk-aversion discouraged paradigm shifts.
  • Simplified textbooks fossilised the 1970s model.

But archaeology, like geology, moves forward one corrected assumption at a time.
Today, the data mountain is simply too high to ignore.


The Hydrological Diffusion Model

Langdon’s Post-Glacial Flooding Hypothesis explains the anomalies:

  • Stonehenge Phase 1 (8300 BCE) fits early NW activity.
  • Car Dyke and Wansdyke are prehistoric canals, not Saxon earthworks.
  • Doggerland was the heartland — a network of drowned estuaries and river deltas.
  • Bouldnor Cliff demonstrates contact and trade millennia before 4000 BCE.

When the waters fell, new land appeared — and with it, farming.
The transition was ecological, not ethnographic.


The Great Neolithic Reset

Four independent datasets now align:

  1. Radiocarbon: NW Europe dominant by 8000 BCE.
  2. Hydrology: Falling water levels create fertile land.
  3. Pollen: Vegetation change driven by environment.
  4. DNA: Local continuity > 90 %.

The so-called “Farmer Migration” has no empirical footing left.
Agriculture arose as an adaptive response to post-glacial hydrology — the moment when Europe’s rivers gave back their land.

History, it turns out, didn’t march from the Middle East;
it rose from the falling rivers of the Atlantic world.


References

Abraham, V., et al. (2023). Pollen anthropogenic indicators revisited using large-scale pollen and archaeological datasets: 12 000 years of human–vegetation interactions in central Europe. Preslia 95, 385–411. https://doi.org/10.23855/preslia.2023.385

Ammerman, A. J., & Cavalli-Sforza, L. L. (1971). Measuring the rate of spread of early farming in Europe. Man, 6, 674–688.

Haak, W., et al. (2015). Massive migration from the steppe was a source for Indo-European languages in Europe. Nature, 522, 207–211.

Hinz, M., et al. (2022). Radon-B radiocarbon database for Mesolithic and Neolithic Europe. Scientific Data, 9, 166.

LaPolice, T. M., Williams, K., & Huber, B. (2025). Modeling the European Neolithic expansion shows limited migration and strong local adoption. Nature Communications, August 25 2025.

Lazaridis, I., et al. (2014). Ancient human genomes suggest three ancestral populations for present-day Europeans. Nature, 513, 409–413.

Pinhasi, R., et al. (2005). Tracing the origin and spread of agriculture in Europe. PNAS, 102(43), 15375–15380.

Whittle, A. (2011). The Neolithic: An archaeological perspective. Oxford University Press.

Shennan, S. (2013). Demographic continuity and change in the Neolithic of Europe. Antiquity, 87(338), 723–737.

Woodbridge, J., et al. (2018). Holocene landscape dynamics and woodland resilience in Britain. Quaternary Science Reviews, 190, 1–13.

Langdon, R. J. (2021). The Post-Glacial Flooding Hypothesis. Prehistoric Britain Press.

Podcast

Author’s Biography

Robert John Langdon, a polymathic luminary, emerges as a writer, historian, and eminent specialist in LiDAR Landscape Archaeology.

His intellectual voyage has interwoven with stints as an astute scrutineer for governmental realms and grand corporate bastions, a tapestry spanning British Telecommunications, Cable and Wireless, British Gas, and the esteemed University of London.

A decade hence, Robert’s transition into retirement unfurled a chapter of insatiable curiosity. This phase saw him immerse himself in Politics, Archaeology, Philosophy, and the enigmatic realm of Quantum Mechanics. His academic odyssey traversed the venerable corridors of knowledge hubs such as the Museum of London, University College London, Birkbeck College, The City Literature Institute, and Chichester University.

In the symphony of his life, Robert is a custodian of three progeny and a pair of cherished grandchildren. His sanctuary lies ensconced in the embrace of West Wales, where he inhabits an isolated cottage, its windows framing a vista of the boundless sea – a retreat from the scrutinous gaze of the Her Majesty’s Revenue and Customs, an amiable clandestinity in the lap of nature’s embrace.

Exploring Prehistoric Britain: A Journey Through Time

My blog delves into the fascinating mysteries of prehistoric Britain, challenging conventional narratives and offering fresh perspectives based on cutting-edge research, particularly using LiDAR technology. I invite you to explore some key areas of my research. For example, the Wansdyke, often cited as a defensive structure, is re-examined in light of new evidence. I’ve presented my findings in my blog post Wansdyke: A British Frontier Wall – ‘Debunked’, and a Wansdyke LiDAR Flyover video further visualizes my conclusions.

My work also often challenges established archaeological dogma. I argue that many sites, such as Hambledon Hill, commonly identified as Iron Age hillforts are not what they seem. My posts Lidar Investigation Hambledon Hill – NOT an ‘Iron Age Fort’ and Unmasking the “Iron Age Hillfort” Myth explore these ideas in detail and offer an alternative view. Similarly, sites like Cissbury Ring and White Sheet Camp, also receive a re-evaluation based on LiDAR analysis in my posts Lidar Investigation Cissbury Ring through time and Lidar Investigation White Sheet Camp, revealing fascinating insights into their true purpose. I have also examined South Cadbury Castle, often linked to the mythical Camelot56.

My research also extends to the topic of ancient water management, including the role of canals and other linear earthworks. I have discussed the true origins of Car Dyke in multiple posts including Car Dyke – ABC News PodCast and Lidar Investigation Car Dyke – North Section, suggesting a Mesolithic origin2357. I also explore the misidentification of Roman aqueducts, as seen in my posts on the Great Chesters (Roman) Aqueduct. My research has also been greatly informed by my post-glacial flooding hypothesis which has helped to inform the landscape transformations over time. I have discussed this hypothesis in several posts including AI now supports my Post-Glacial Flooding Hypothesis and Exploring Britain’s Flooded Past: A Personal Journey

Finally, my blog also investigates prehistoric burial practices, as seen in Prehistoric Burial Practices of Britain and explores the mystery of Pillow Mounds, often mistaken for medieval rabbit warrens, but with a potential link to Bronze Age cremation in my posts: Pillow Mounds: A Bronze Age Legacy of Cremation? and The Mystery of Pillow Mounds: Are They Really Medieval Rabbit Warrens?. My research also includes the astronomical insights of ancient sites, for example, in Rediscovering the Winter Solstice: The Original Winter Festival. I also review new information about the construction of Stonehenge in The Stonehenge Enigma.

Further Reading

For those interested in British Prehistory, visit www.prehistoric-britain.co.uk, a comprehensive resource featuring an extensive collection of archaeology articles, modern LiDAR investigations, and groundbreaking research. The site also includes insights and extracts from the acclaimed Robert John Langdon Trilogy, a series of books exploring Britain during the Prehistoric period. Titles in the trilogy include The Stonehenge Enigma, Dawn of the Lost Civilisation, and The Post Glacial Flooding Hypothesis, offering compelling evidence about ancient landscapes shaped by post-glacial flooding.

To further explore these topics, Robert John Langdon has developed a dedicated YouTube channel featuring over 100 video documentaries and investigations that complement the trilogy. Notable discoveries and studies showcased on the channel include 13 Things that Don’t Make Sense in History and the revelation of Silbury Avenue – The Lost Stone Avenue, a rediscovered prehistoric feature at Avebury, Wiltshire.

In addition to his main works, Langdon has released a series of shorter, accessible publications, ideal for readers delving into specific topics. These include:

For active discussions and updates on the trilogy’s findings and recent LiDAR investigations, join our vibrant community on Facebook. Engage with like-minded enthusiasts by leaving a message or contributing to debates in our Facebook Group.

Whether through the books, the website, or interactive videos, we aim to provide a deeper understanding of Britain’s fascinating prehistoric past. We encourage you to explore these resources and uncover the mysteries of ancient landscapes through the lens of modern archaeology.

For more information, including chapter extracts and related publications, visit the Robert John Langdon Author Page. Dive into works such as The Stonehenge Enigma or Dawn of the Lost Civilisation, and explore cutting-edge theories that challenge traditional historical narratives.

Other Blogs

s

t

Mesolithic River Avon

Rivers were higher in the past – Now UPDATED here: https://prehistoric-britain.co.uk/case-study-river-avon

At the outset, the clay-with-flints, a vestige of ancient weathering and erosion, stands as a testament to the relentless forces of nature that sculpted the landscape. Born from the remnants of Palaeogene sediments and the dissolution of chalk, these deposits serve as silent witnesses to the Pleistocene’s cold embrace. Their presence on the hilltop flats signifies a chronological anchor, predating the rhythmic succession of river terraces that stitch the valley’s quilt. (The Mesolithic River Avon)

Rivers were higher in the past (The Mesolithic River Avon)

As one descends the slopes, a mosaic of older head deposits unfolds, their genesis tied to the ancient processes of solifluction and solution. These sediments, bound to the clay-with-flint, narrate a tale of gradual descent and transformation, shaping the valley’s upper reaches with a subtle, yet profound, hand.

Further down the valley, the narrative evolves with the introduction of head gravel, gravelly head, and head deposits. These characters in the valley’s story are borne of fluvial transport, hill wash, hill creep, and solifluction—agents of change that have, over millennia, contributed to the valley’s sculptural form. The river terraces, numbering fourteen, ascend like steps from the valley floor, each a plateau from which to view the passage of time. The highest terraces, perched up to 100 meters above the valley, offer a broad vista extending 12 kilometers across, while the lower terraces, more intimate in their proximity to the present-day river, mark the recent chapters of geological history.

The consistency of thickness across these terraces speaks to a dynamic equilibrium of erosion and deposition, influenced by sediment overloading and tributary contributions. This interplay suggests a complex narrative of landscape evolution, one not solely dictated by the simplistic rhythm of Marine Isotope Stage cycles but enriched by a multifaceted process of lateral erosion and sediment redeposition.

Amidst this discussion of terraces and quaternary deposits, the narrative briefly diverges to contemplate the pre-Quaternary geology, where terraces from the River Avon linger in the Hampshire basin, their ages enshrouded in mystery. The challenges of dating these terraces, and by extension, understanding the full scope of the valley’s geological history, are underscored by recent findings that question traditional dating methods. Such inquiries not only deepen the mystery but also invite a reevaluation of our understanding of the Earth’s past.

Thus, we are reminded that the study of the Avon valley’s quaternary deposits is not merely an academic exercise but a profound exploration of the human quest for knowledge and understanding. It is a journey that connects us to the very essence of the natural world, revealing the intricate interplay of forces that have shaped not only the valley but also the broader tapestry of Earth’s geological history. (The Mesolithic River Avon)

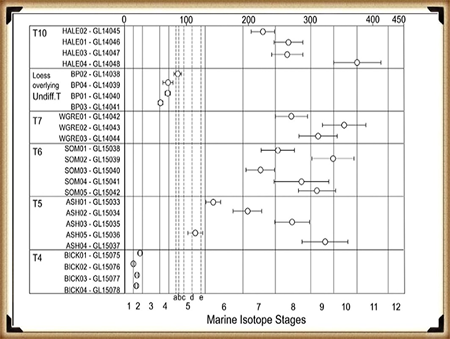
Figure 5 - OSL Results Avon River (The Mesolithic River Avon)
Figure 5 – OSL Results Avon River
(The Mesolithic River Avon)

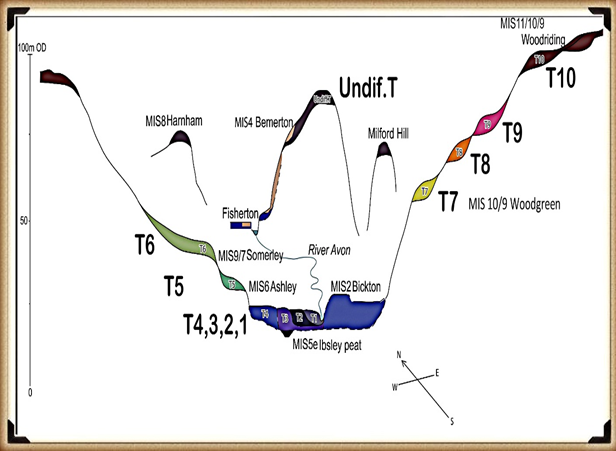
The intriguing findings presented in the diagrams regarding Optically Stimulated Luminescence (OSL) dating within the Avon valley unearth a complex narrative of sediment deposition and geological processes that challenges traditional understandings. The OSL results, as depicted in Figure 5, illuminate the temporal relationship between terrace formations and Marine Isotope Stages (MIS), while Figure 6, based on a three-dimensional model constructed from borehole data, offers a visual cross-section of the valley’s superficial geology.

The OSL ages for terraces T10 through T7, indicating deposition during or before MIS10/9, including the Last Glacial Maximum (LGM), suggest a timeline that not only aligns with but also refines previously established chronological frameworks. This refinement has significant implications for interpreting the archaeological record associated with Terrace T7 and recalibrating regional uplift and incision rates, which are crucial for understanding landscape evolution over geological timescales.

However, the apparent inconsistencies in the OSL dating results, particularly the dating of Terrace T7 before Terrace T10 and the identification of a Loess Terrace laid during the LGM, introduce a paradox into the sedimentary record. These anomalies challenge the linear progression implied by the terrace hypothesis that has guided interpretations of the valley’s geological history.

The highest terrace, T10, positioned at 102 meters above ordnance datum (OD) as illustrated in Figure 6, spans an unexpectedly broad temporal range of over 200,000 years, according to OSL dating. This finding disrupts the presumed chronological order, especially when juxtaposed with the dating of Terrace T7 at 58 meters OD, which, perplexingly, predates T10. Additionally, the Loess Terrace, situated at 77 meters OD and undifferentiated in the terrace sequence, laid down during the LGM, along with Terrace T4, which harbors the youngest dates, further complicates the scenario.

These results hint at a more intricate story of terrace formation and sediment deposition than previously thought. The seeming randomness and inconsistencies in the dating challenge the traditional terrace hypothesis and suggest that other factors, perhaps related to climatic variations, tectonic activities, or both, played significant roles in shaping the valley’s geomorphology.

The evidence points to a dynamic and possibly non-linear process of terrace formation, where episodes of sediment deposition were influenced by a combination of environmental conditions, rather than a simple chronological succession. This complexity underscores the need for a reassessment of the methods and models used to date and interpret terrace formations, advocating for a more nuanced understanding of the interplay between geological processes and climate change over the Pleistocene.

Thus, while the OSL dating provides valuable insights into the timing of terrace deposition, it also raises critical questions about the reliability of traditional chronological frameworks and the factors driving landscape evolution in the Avon valley. These findings invite further investigation and a reevaluation of existing hypotheses, highlighting the ongoing dialogue between past and present in the quest to decipher Earth’s geological history.

Figure 6- Avon River Terrace Levels - Avon River
Figure 6- Avon River Terrace LevelsAvon River
(The Mesolithic River Avon)

The authors’ observations highlight significant discrepancies and anomalies in the OSL dates that raise questions about the method’s reliability in certain contexts, particularly when compared to other dating methods like radiocarbon dating. These discrepancies are not merely academic curiosities; they fundamentally challenge our understanding of the temporal and environmental context in which these sediment layers were deposited.

The attempt to explain the notable discrepancy in the age estimates of Terrace T4 across different locations within the Avon valley suggests that sediment reworking due to recent fluvial processes or the presence of compound terraces exhibiting different depositional behaviors might be responsible. This acknowledgment of variability within the depositional environment underscores the dynamic nature of fluvial landscapes and the complexity of accurately dating such contexts.

The variability in OSL dates for samples taken at the same soil level (e.g., GL14039, GL14041, GL14038, GL14040) further complicates the narrative. The presence of nearly contemporaneous dates within error limits, juxtaposed with the significantly different sedimentation rates observed just below the topsoil, suggests that the depositional history of the Avon valley is more nuanced than previously understood. These findings indicate that relying solely on visual stratigraphy for dating purposes can lead to inaccuracies, reinforcing the need for a multi-methodological approach to construct a reliable chronological framework.

The comparison between OSL and radiocarbon dating, as discussed in the Gaigalas (2000) study, exemplifies the potential for significant age discrepancies between different dating methods. The observation that OSL dates can be substantially older than their radiocarbon counterparts highlights the need for caution and cross-validation when interpreting chronological data, especially in contexts where sediment exposure and reworking may have occurred.

The discussion of Holocene river flooding and its impact on the dating of river terraces introduces an additional layer of complexity. Flooding events can lead to the deposition of silt and other materials that obscure the original depositional sequence, potentially leading to out-of-sequence terrace dates. This phenomenon complicates attempts to use uplift modeling or the Palaeolithic record as reliable chronological markers, as evidenced by the discrepancies in age estimates for Terrace T7.

The passage concludes by emphasizing the potential of terrace deposits to provide a valuable chronological framework, albeit one that must be approached with caution. By integrating chronometric age control with detailed modeling of deposit height and thickness, researchers can gain a more nuanced understanding of the Avon valley’s landscape evolution. This approach not only enhances our interpretations of past hominin landscape use but also improves the predictive modeling of Palaeolithic sites. The challenges and discrepancies encountered in OSL dating underscore the importance of adopting a holistic and critically engaged approach to understanding the geological past, one that acknowledges the inherent complexities and uncertainties of dating dynamic fluvial landscapes.

Finally, archaeologists and geologists resist the fact that the river Avon was in Stonehenge Bottom during the Mesolithic and Neolithic period.  They insist that there is no evidence in the form of Alluvium or Colluvium in sufficient quantities to support my hypothesis.  This objection has a simple solution as Julian Richard’s suggested in his book ‘The Stonehenge Environs Project’: “colluvium sediments may have been removed or thinned by the action of seasonal streams or higher water tables in the past”. 

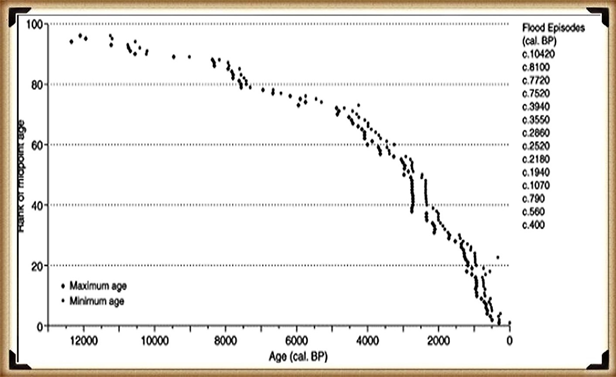
Macklin, as we have now seen in this section has identified over one hundred Holocene river floods, twelve of which lasted hundreds of years, that would have contributed to this lack of alluvium or colluvium at Stonehenge Bottom.  Moreover, the sources of the rivers that lay this sediment over the centuries of water flow, rely on massive precipitation entering the rivers, cutting through rocks and valleys making them flow at extreme levels which create this erosion and consequential sediment. However, the source of Palaeochannel water are natural springs found locally underground and therefore would not contain the same alluvium levels as active flowing rivers – resolving this dilemma.

Model of the number of flooded rivers in Britain - River Avon
Model of the number of flooded rivers in Britain – River Avon

UPDATE

More Empirical Evidence of Post-Glacial Flooding and a Flooded Stonehenge

River Avon River Terraces

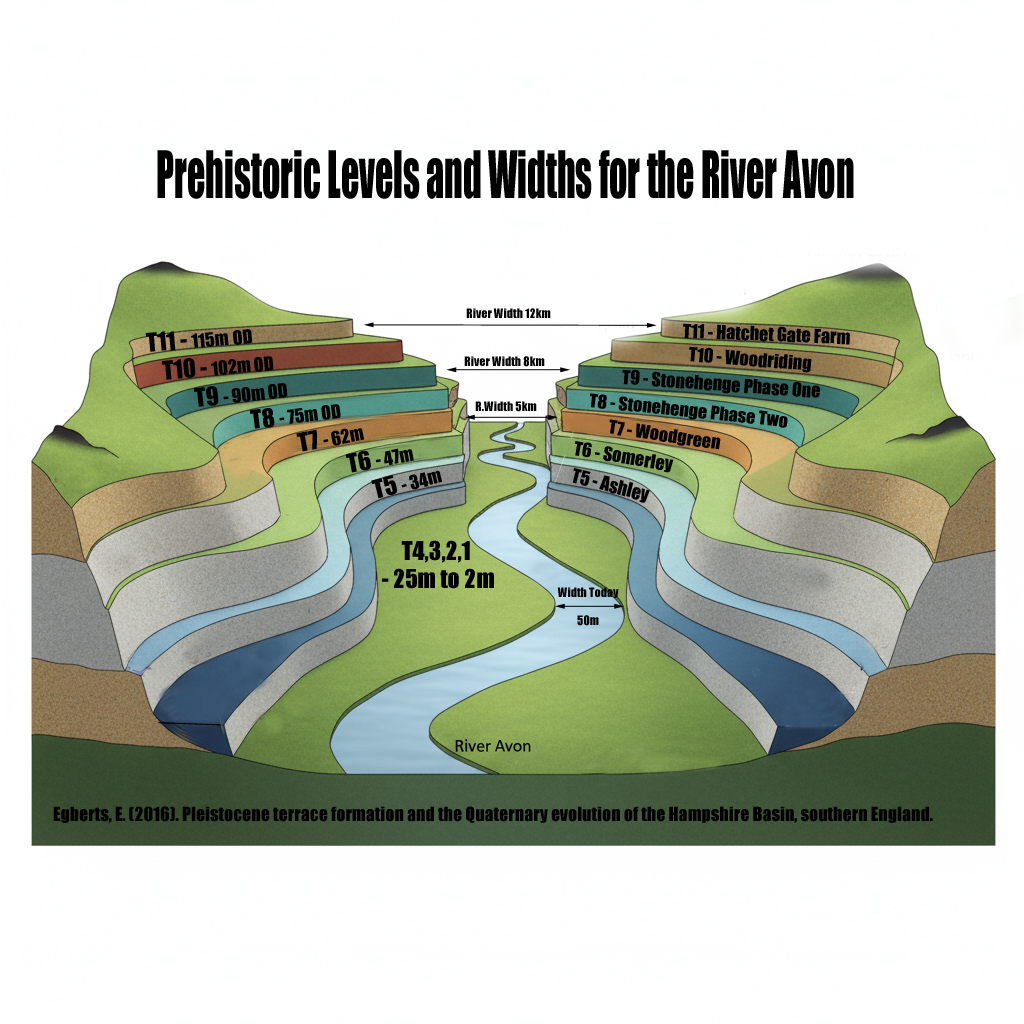
 Prehistoric Levels and Widths for the River Avon

Take a close look at this illustration. It is not speculation, it is empirical science — mapped and measured river terraces from the Avon Valley, published in Egberts (2016), Pleistocene terrace formation and the Quaternary evolution of the Hampshire Basin, Bournemouth University.

What are we looking at?

  • These are the terrace steps cut by the River Avon over multiple glacial–interglacial cycles.
  • Each “T-level” marks a former stable floodplain where the river held its height for centuries, often millennia.
  • The heights are measured in metres OD (Ordnance Datum) and tied to known quarry and pit sites (e.g. Hatchet Gate Farm, Woodgreen, Somerley, Ashley).

💧 How much bigger was the Avon?

  • Today, the river meanders with a width of just ~50 m near Salisbury.
  • At its maximum (T11), the Avon floodplain stretched ~12 km across.
  • That is ~240 times wider than the river today.

🌊 What does this mean for Stonehenge?

  • Phase 1 of Stonehenge (Car Park Postholes) sits on T9 (~90 m OD).
  • Phase 2 (ditch, Aubrey Holes, bluestones) cuts into T8 (~75 m OD).
  • The terraces show that the palaeochannel not only flooded up to the old car park, but at times overtopped the entire Stonehenge site.

📐 Why this matters:

  • Terraces are not theory — they are empirical geomorphological evidence.
  • They prove that the Avon has flooded to multiple levels, sometimes far higher than the monument itself.
  • This is not about “if” water could reach those heights — the terraces prove it already has, repeatedly, over many Ice Age cycles.

So when critics dismiss the role of high water tables or argue “the site couldn’t have been wet,” they are ignoring the most basic geological record in front of us. The terraces are the diary of the river — written in gravel, chalk, and silt — showing that water rose and fell, over and over again.

👉 The real question is not if Stonehenge was surrounded by water. It is when, and how many times it happened during its long prehistory.

More information on the River Avon can be found at: https://youtu.be/j5LJ2sGcKOA

Further Reading

For information about British Prehistory, visit www.prehistoric-britain.co.uk for the most extensive archaeology blogs and investigations collection, including modern LiDAR reports.  This site also includes extracts and articles from the Robert John Langdon Trilogy about Britain in the Prehistoric period, including titles such as The Stonehenge Enigma, Dawn of the Lost Civilisation and the ultimate proof of Post Glacial Flooding and the landscape we see today.

Robert John Langdon has also created a YouTube web channel with over 100 investigations and video documentaries to support his classic trilogy (Prehistoric Britain). He has also released a collection of strange coincidences that he calls ‘13 Things that Don’t Make Sense in History’ and his recent discovery of a lost Stone Avenue at Avebury in Wiltshire called ‘Silbury Avenue – the Lost Stone Avenue’.

Langdon has also produced a series of ‘shorts’, which are extracts from his main body of books:

The Ancient Mariners

Stonehenge Built 8300 BCE

Old Sarum

Prehistoric Rivers

Dykes ditches and Earthworks

Echoes of Atlantis

Homo Superior

For active discussions on the findings of the TRILOGY and recent LiDAR investigations that are published on our WEBSITE, you can join our and leave a message or join the debate on our Facebook Group.

Other Blogs

s

t