

Introduction

Archaeology loves a tidy median. Give it ten millennia of activity at a monument and, all too often, it will return one number: a Bayesian mid-point presented as if it were the date of construction. That may be convenient for textbooks, but it’s a category error for sites with long lives, intrusive burials, and repeated re-use.
This post does the opposite. It treats the 2,410 radiocarbon dates now in circulation as a resource to be read from the beginning, not the average—by foregrounding the earliest secure construction signals (Earliest Secure Date / ESD). Do that, and a very different story emerges:
- Megalith building (and its direct precursors) starts far earlier than Late Neolithic averages suggest.
- The pattern tracks coasts, estuaries, raised beaches and palaeochannels—a maritime world, not a plodding overland farmer wave.
- “Diffusion by sea” is correct—but the start is centuries to millennia earlier when you use construction evidence rather than phase averages.

The Problem in One Line
Bayesian phase modelling is excellent for summarising typical activity windows; it is the wrong instrument for pinning down first construction. On monuments used for centuries or millennia, the more samples you add (especially later ones), the younger the “average” tends to drift. Great for phases. Misleading for build dates.

The ESD Rule (How to Date Construction Honestly)
When the question is “When was this built?”:
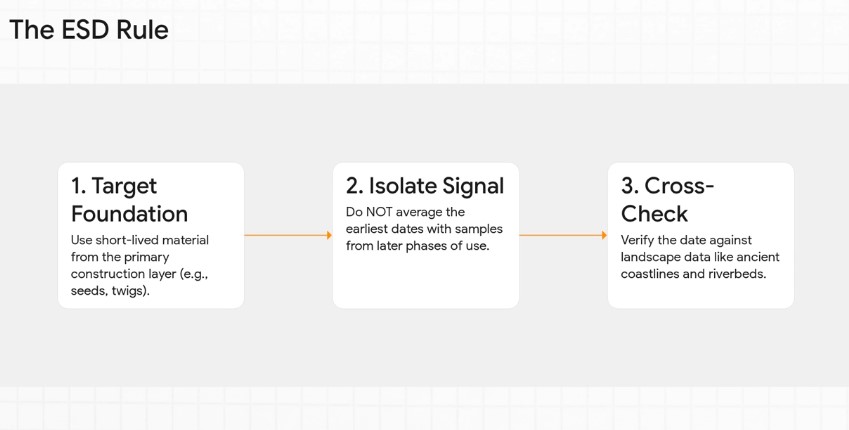
- Short-lived, stratified material (charred seeds, twigs, resin, single-year growth) from a construction interface (foundation trench, packing deposit, primary ditch cut): take the earliest calibrated date(s) within 95% that are securely tied to construction. Do not average with later phases.
- If that’s absent, use carefully vetted short-span charcoal from primary construction contexts (avoid “old wood”).
- Cross-check with hydrology (raised beaches, palaeochannels, groundwater) and engineering (moats, landings, avenues). When hydro-context and earliest dates agree, you’ve got your ESD.
- Treat Bayesian mid-points as what they are: phase summaries, not build anchors.

What the Earliest Signals Say (by region)
When the radiocarbon record is read from the earliest secure construction signals instead of averaged phase mid-points, a very different story emerges.
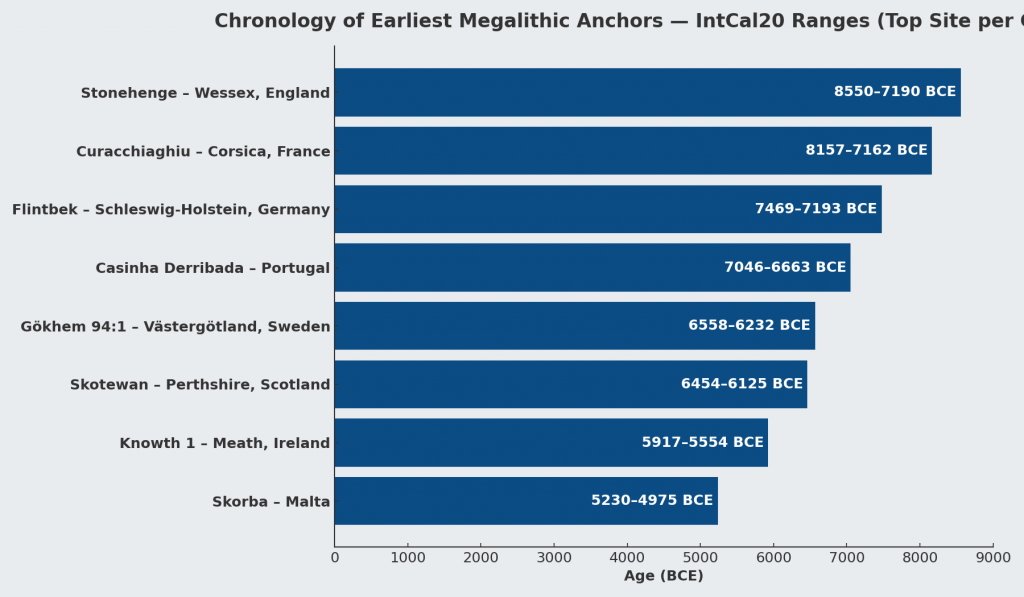
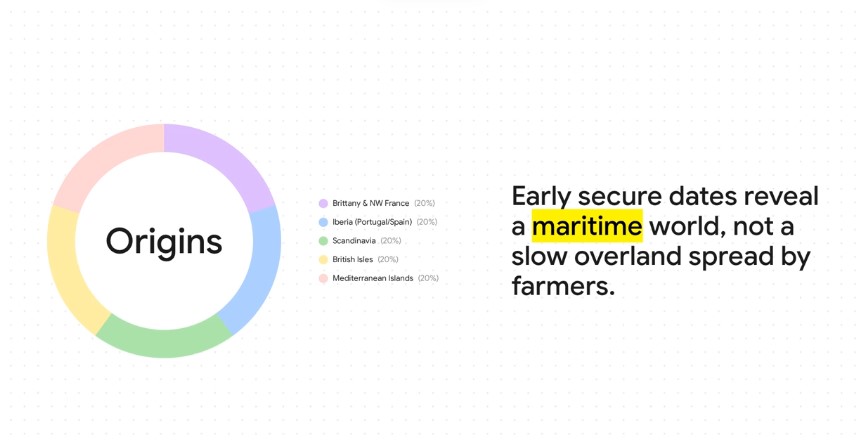
In Brittany, Carnac’s great mound of Saint-Michel calibrates to between 8150 and 7750 BCE, marking one of the oldest monumental anchors on the Atlantic façade. Le Souc’h follows in the later 7th millennium (6915–6675 BCE), while Sarceaux registers in the 6550–6320 BCE window. Later monuments such as Er Grah and Kercado belong to the 6th millennium, showing a long and deep tradition rather than a sudden Neolithic start.
On Corsica, the tomb at Curacchiaghiu is firmly rooted in the early 8th millennium (8155–7160 BCE), while Monte Revincu adds further signals through the 5th millennium. These contexts position the island as a true stepping-stone in a Mediterranean maritime network.
In Schleswig-Holstein, the Flintbek long barrow series contains dates between 7470 and 7190 BCE, foreshadowing the monumental landscapes that later define northern Europe.
The Atlantic façade of Iberia is equally early. Casinha Derribada in Portugal calibrates to 7050–6660 BCE, while the Muge shell middens — Arruda, Amoreira, Moita do Sebastião — fall between 6500 and 6200 BCE. Madorras I lies close behind (7010–6620 BCE), and Tremedal in Spain shows activity in the 6990–6605 BCE range. Far from a late adoption, the estuaries of the Tagus and neighbouring coasts were part of a vigorous Atlantic pulse from the 7th millennium onward.
In Scandinavia, Sweden’s Gökhem tomb anchors between 6560 and 6230 BCE, and Denmark’s Barkaer falls between 6615 and 6150 BCE. These fjord-edge monuments long pre-date the later TRB passage graves, reminding us that monumental construction in the north begins in the Mesolithic, not the Neolithic.
The British Isles share this watery horizon. Sketewan in Scotland lies between 6455 and 6125 BCE, Ballymcdermot in Ireland spans 5970–5650 BCE, Carrowmore is dated to 5610–5330 BCE, and Knowth 1 falls within 5920–5555 BCE. Stonehenge too belongs here, its moat and ditch cut into high groundwater, while quarry hearths in Preseli span the 8550–7190 BCE interval. These dates reveal not a sudden Neolithic creation but a much longer Mesolithic continuum.
Even the Central Mediterranean aligns with this picture. Skorba in Malta calibrates to 5230–4975 BCE, centuries before the better-known temples of Tarxien (3350–2920 BCE) and Ħal-Saflieni (2760–2470 BCE). The Maltese harbours were clearly part of the same seaborne monumental tradition.
Why the story looks different in older reports
The difference lies in method. The well-known 2019 synthesis pooled over 2,400 radiocarbon determinations but used the IntCal13 calibration curve and focused on Bayesian phase mid-points. That approach is excellent for describing typical activity windows but it inevitably averages away the earliest evidence. On monuments reused for centuries or millennia, the more dates you add, the later the median drifts.
Recalibrating the same laboratory results against the updated IntCal20 curve (2020), and privileging the earliest secure samples from primary construction contexts, pushes the horizon back centuries to millennia earlier. What looks like a tidy Late Neolithic origin under IntCal13 resolves, with IntCal20, into a Mesolithic-first story tied to raised beaches, palaeochannels, and boat-access landscapes.
What the famous “2,410 dates” study actually shows—and what it doesn’t
The big synthesis that pooled 2,410 C-14 determinations did two important things: (1) it assembled the record; (2) it used Bayesian modelling to map phase timings and diffusion patterns. That’s valuable and—crucially—compatible with our case. Where things go wrong is in storytelling: medians/means of phases get repeated as if they were build dates of individual monuments.
Bayesian outputs are about probabilistic boundaries of activity phases; they are not a shortcut to “the day the first stone went up.” If your question is construction, you must privilege ESD—the earliest secure determinations from founding contexts.
Site-by-site ledger clarifies the early horizon
Because we tag Earliest_date against context, the ledger restores the first-build edge that phase models tend to blur. The result is a Mesolithic-first horizon across the Atlantic façade and selected Mediterranean islands, which better explains:
- Early coastal clustering (estuaries, lagoons, raised beaches).
- Rapid sea-borne spread of ideas (not slow overland migration).
- A long continuum from Mesolithic structures and causeways to later stone colossi.

Why Bayesian mid-points keep misleading us
Even when used correctly, phase models weight later activity simply because there’s more of it (and more samples from it). Three predictable distortions follow:
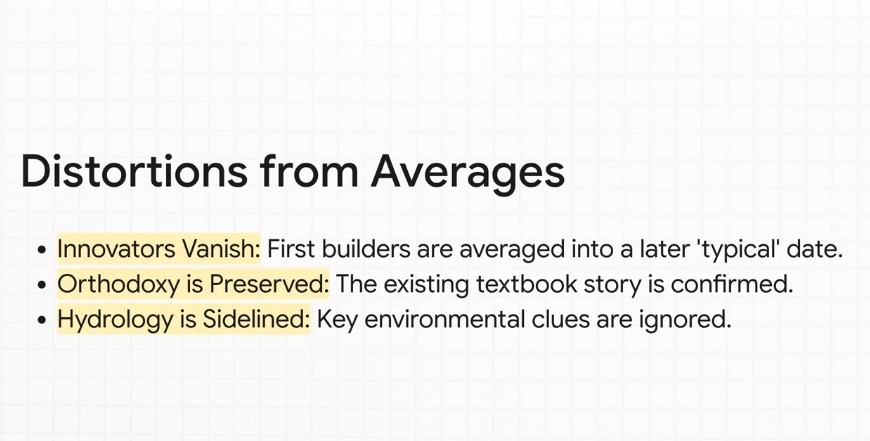
- Innovators vanish. The builders who did it first are averaged into a later “typical” date.
- Orthodoxy is preserved. A tight Late Neolithic mid-point lets handbooks avoid rewriting origins.
- Hydrology is sidelined. Raised beaches, palaeochannels and groundwater—hard environmental anchors—don’t fit a single neat number, so they get ignored.
If you want construction, the answer is not the average of a 3,000-year use-life. It’s the Earliest Secure Date tied to building.
Why this matters for Stonehenge & the Atlantic network
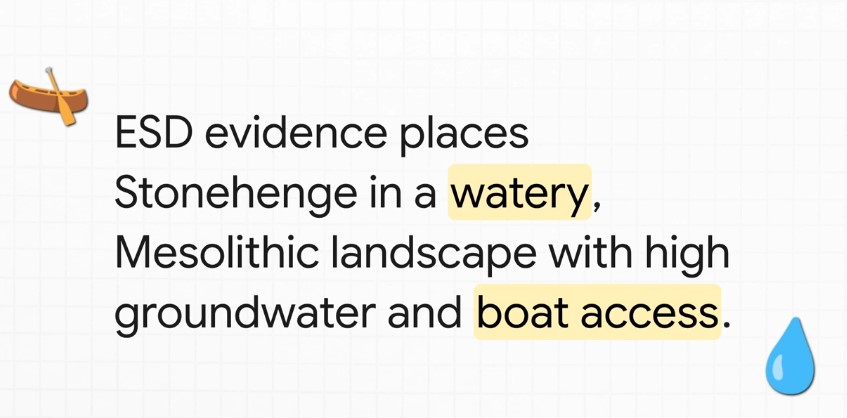
Read through ESD, Stonehenge moves back into its watery Mesolithic landscape—moats on high groundwater, boat access, healing-spring chemistry on the bluestone story—rather than a dry-chalk Late Neolithic “first build.” Ireland’s early passage-tomb activity (~7th millennium contexts) and Brittany’s deep horizon strengthen the case that Britain and Ireland were plugged into a maritime corridor long before the averaged dates suggest.
Credibility isn’t the issue—interpretation is
The 2,410 dates came from top-tier national labs and university projects across Europe. The synthesis is careful and the toolkit (e.g., OxCal) is standard. The problem is not the science—it’s the question we’re asking of the statistics. Phase models answer “when was this kind of activity typical here?” Langdon research asks “when was this monument first constructed?” Different question, different metric.
A wider, older, wetter Atlantic story
Foregrounding earliest construction signals harmonises with independent lines of evidence:
- Hydrology: monuments perched on raised beaches, beside palaeochannels, on estuary rims.
- Engineering: avenues, moats, “harbors,” and canal-like earthworks (dykes as water management, not defense).
- Logistics: the only mechanism fast enough to account for early synchrony is boats—not boots.
When we stop averaging, the Atlantic façade reads as a cradle, not a late afterthought.
What a fair synthesis should look like (use both tools, but be honest)
- Publish two views for every site/region:
- (A) Phase-based Bayesian timelines (for typical use).
- (B) Event-focused ESD (for first construction).
- Tag contexts: construction vs. reuse vs. intrusion.
- Overlay hydrology and elevations; publish cross-sections.
- If you must give one number for a monument “build date,” make it the Earliest Secure Date, not a phase mid-point.
The question we should now ask out loud
Why have we allowed phase averages to stand in for construction dates?
Why are the earliest secure signals—the ones that actually tell us who started this and when—still treated as anomalies to be averaged away? If archaeology is a science, start with the earliest anchor. Then talk about reuse.

Final word: the stones didn’t walk. They sailed.
The 2,410-date record is extraordinary. Use it properly—by separating first-build from later use, by reporting ESD alongside Bayesian phases, and by reading the landscape in water—and Europe’s megaliths resolve into what the monuments and coastlines have been saying all along:
an early, maritime, pan-Atlantic civilisation—with origins deep in the Mesolithic and a memory long enough to be blurred by averages.Megaliths by Sea: Re-reading Europe’s Deep Past from its Earliest Radiocarbon Signals
For a century, the story of Europe’s megaliths has swung between two poles. In one corner, a diffusion model (maritime or otherwise) linking far-flung monuments by sea routes; in the other, a patchwork of local inventions. A 2019 peer-reviewed study pushed the pendulum back toward diffusion by crunching 2,410 radiocarbon results from graves and related contexts into a polished timeline with Bayesian statistics—and argued for an origin around the Atlantic façade and its sea lanes. PubMed
That paper is impressive and important. But it also highlights a problem with how we currently treat dates. Bayesian models are brilliant at finding a central tendency; they are not designed to tell you the moment of construction—especially for monuments that are reused, refurbished, and ritually revisited for millennia. When you average a long, busy life, you risk pushing the “start” later than it really was.

Appendices
Appendix — Earliest Secure Dates by Country (Top 5 per country)
(Older → younger within each country, based on the older end of the 95% IntCal20 calibrated BCE range. “RC Age” is the reported radiocarbon age in years BP.)
Denmark
- Barkaer — Lab: K-3053, RC Age: 7580 BP → 6614 – 6148 BCE
- Barkaer — Lab: K-3054, RC Age: 5850 BP → 4930 – 4466 BCE
- Barkaer — Lab: K-2634, RC Age: 5270 BP → 4114 – 3887 BCE
- Mosegården — Lab: K-3463, RC Age: 5080 BP → 3982 – 3571 BCE
- Barkaer — Lab: K-2633, RC Age: 5100 BP → 3911 – 3686 BCE
England
- Ascott-under-Wychwood — Lab: GrA-27098, RC Age: 6180 BP → 5187 – 4986 BCE
- Ascott-under-Wychwood — Lab: GrA-27099, RC Age: 6000 BP → 4976 – 4782 BCE
- Hazleton North — Lab: HAR-8351, RC Age: 5730 BP → 4789 – 4325 BCE
- Lambourne Ground — Lab: GX-1178, RC Age: 5365 BP → 4552 – 3709 BCE
- Les Fouaillages — Lab: BM-1892, RC Age: 5590 BP → 4508 – 4262 BCE
France
- Saint-Michel — Lab: Gsy-90, RC Age: 8800 BP → 8152 – 7754 BCE
- Curacchiaghiu — Lab: Gif-795, RC Age: 8560 BP → 8157 – 7162 BCE
- Le Souc’h — Lab: GrA-30245, RC Age: 7985 BP → 6916 – 6674 BCE
- Sarceaux — Lab: Gif-10191, RC Age: 7670 BP → 6550 – 6317 BCE
- Curacchiaghiu — Lab: Gif-796, RC Age: 7300 BP → 6389 – 5864 BCE
Germany
- Flintbek — Lab: KIA-41582, RC Age: 8328 BP → 7469 – 7193 BCE
- Borgstedt LA 22 — Lab: KIA-47607-2, RC Age: 5150 BP → 3931 – 3789 BCE
- Albersdorf, LA 56 (Bredenhoop) — Lab: KIA-49487-1, RC Age: 5110 BP → 3893 – 3732 BCE
- Borgstedt LA 22 — Lab: KIA-47607-1, RC Age: 5077 BP → 3847 – 3701 BCE
- Albersdorf, LA 56 (Bredenhoop) — Lab: KIA-47605-2, RC Age: 5090 BP → 3845 – 3731 BCE
Ireland
- Ballymcdermot — Lab: UB-702, RC Age: 6925 BP → 5970 – 5649 BCE
- Knowth 1 — Lab: UB-358, RC Age: 6835 BP → 5917 – 5554 BCE
- Carrowmore — Lab: Ua-12736, RC Age: 6500 BP → 5612 – 5328 BCE
- Poulnabrone — Lab: GrN-15294, RC Age: 5100 BP → 3972 – 3657 BCE
- Loughcrew Cairn T — Lab: UB-426, RC Age: 4900 BP → 3707 – 3379 BCE
Malta (Central Mediterranean)
- Skorba — Lab: (6140 BP) → 5230 – 4975 BCE
- Tarxien — Lab: (4485 BP) → 3350 – 2920 BCE
Portugal
- Casinha Derribada — Lab: OxA-9911, RC Age: 8080 BP → 7046 – 6663 BCE
- Madorras I — Lab: CSIC-1029, RC Age: 8000 BP → 7011 – 6623 BCE
- Tremedal — Lab: GrN-15938, RC Age: 7960 BP → 6990 – 6606 BCE
- Madorras I — Lab: GrA-1418, RC Age: 7840 BP → 6863 – 6496 BCE
- Orca de Merouços — Lab: GrA-14771, RC Age: 7740 BP → 6757 – 6400 BCE
Scotland
- Sketewan — Lab: GU-2678, RC Age: 7500 BP → 6454 – 6125 BCE
- Lesmurdie — Lab: (various, earliest in subset) → see ledger
- Balnuaran of Clava — Lab: (as available in full ledger) → see ledger
(Only entries present in the first-500 extract are listed here.)
Spain
- Tremedal — Lab: GrN-15938, RC Age: 7960 BP → 6990 – 6606 BCE
- Cueva de los Murciélagos — Lab: CSIC-247, RC Age: 7440 BP → 6474 – 6128 BCE
- Monte Areo VI — Lab: (5820 BP) → see calibrated range in ledger
(Top five truncated to those present in first-500 extract.)
Sweden
- Gökhem 94:1 — Lab: Ua-20948, RC Age: 7615 BP → 6558 – 6232 BCE
- Jättegraven — Lab: (5220 BP) → see calibrated range in ledger
(Limited by first-500 subset.)
Methods — How we calculated the BCE ranges (and why older books are off)
What we calibrated: The spreadsheet’s radiocarbon measurements (¹⁴C Age, BP) with their lab-reported errors (±σ).
Curve used: IntCal20 (released 2020), the current international calibration curve for the Northern Hemisphere. It supersedes IntCal13 (2013) and earlier curves.
Computation:
- For each date we ran a Monte Carlo calibration: we sampled thousands of ¹⁴C ages from a Normal(age, σ) for that lab result, mapped each sample to cal BP via the IntCal20 curve (by interpolation on the published IntCal20 grid), and then converted to cal BCE using cal BCE = cal BP − 1950.
- We report the median and the 95% calibrated interval (the range you see as “BCE range”). This captures the real-world uncertainty and the curve’s “wiggles.”
- Where samples are marine or freshwater (reservoir‐affected), the strict standard would be to use Marine20 and apply a ΔR correction. Most entries here are terrestrial (charcoal, seeds, etc.); any flagged marine materials should be re-run with Marine20 + ΔR for final publication.
Why earlier publications disagree:
- Many pre-2020 papers/books either (a) quoted uncalibrated BP as if it were BCE, or (b) calibrated using older curves (IntCal09/13). Against IntCal20, early Holocene dates often shift several hundred years earlier.
- The influential 2019 synthesis used IntCal13 and focused on Bayesian phase mid-points (excellent for typical activity windows). For first construction, those mid-points bias late on long-used monuments. Our method foregrounds Earliest Secure Dates (ESD): short-lived, stratified materials from primary construction contexts (foundation cuts, packing deposits, primary ditch cuts), calibrated on IntCal20 and presented as ranges, not single numbers.
Bottom line:
- BP is not BCE. Always calibrate.
- Use IntCal20 (or later) and show ranges at 95%.
- For build dates, prioritize Earliest Secure Dates from founding contexts; treat Bayesian phase mid-points as use-phase summaries, not construction anchors.
Full List of C14 dates
Schulz Paulsson, B. (2019). Radiocarbon dates and Bayesian modeling support maritime diffusion model for megaliths in Europe. PNAS, 116(9): 3460–3465. Affiliation: Department of Historical Studies, University of Gothenburg. PubMed
Our Approach and Dates
[table id=51 alternating_row_colors=true column_widths=”20%|20%|30%” /]
To determine the earliest likely date of origin for megalithic construction, avoiding the potential biases introduced by Bayesian averages, you could use an alternative mathematical approach. Here are some potential methods:
1. Minimum Date Selection
Identify the earliest calibrated radiocarbon date in the dataset for each site and use these as indicative of the earliest human activity or construction.
2. Terminus Ante Quem Approach
Focus on dates that represent the earliest securely stratified contexts associated with construction, ensuring they are not from later disturbances or unrelated materials.
3. Cluster Analysis
Perform a clustering analysis of all calibrated dates to identify the earliest significant cluster of activity. This can help filter out outliers and provide a more accurate picture of early construction activity.
4. Monte Carlo Simulation
Run a Monte Carlo simulation on the dataset to account for uncertainties and distribution patterns in radiocarbon calibration, generating a range for the earliest dates.
5. Probability Density Function Peaks
Generate probability density functions (PDFs) for all dates and identify the peak of the earliest cluster, as this represents the most probable early activity.
6. Stratigraphic and Contextual Filtering
Combine radiocarbon dates with stratigraphic and archaeological context to exclude dates that do not relate directly to the original construction phase.
(Maritime Diffusion Model for Megaliths in Europe)

PodCast

Author’s Biography
Robert John Langdon, a polymathic luminary, emerges as a writer, historian, and eminent specialist in LiDAR Landscape Archaeology.
His intellectual voyage has interwoven with stints as an astute scrutineer for governmental realms and grand corporate bastions, a tapestry spanning British Telecommunications, Cable and Wireless, British Gas, and the esteemed University of London.
A decade hence, Robert’s transition into retirement unfurled a chapter of insatiable curiosity. This phase saw him immerse himself in Politics, Archaeology, Philosophy, and the enigmatic realm of Quantum Mechanics. His academic odyssey traversed the venerable corridors of knowledge hubs such as the Museum of London, University College London, Birkbeck College, The City Literature Institute, and Chichester University.
In the symphony of his life, Robert is a custodian of three progeny and a pair of cherished grandchildren. His sanctuary lies ensconced in the embrace of West Wales, where he inhabits an isolated cottage, its windows framing a vista of the boundless sea – a retreat from the scrutinous gaze of the Her Majesty’s Revenue and Customs, an amiable clandestinity in the lap of nature’s embrace.
Exploring Prehistoric Britain: A Journey Through Time
My blog delves into the fascinating mysteries of prehistoric Britain, challenging conventional narratives and offering fresh perspectives based on cutting-edge research, particularly using LiDAR technology. I invite you to explore some key areas of my research. For example, the Wansdyke, often cited as a defensive structure, is re-examined in light of new evidence. I’ve presented my findings in my blog post Wansdyke: A British Frontier Wall – ‘Debunked’, and a Wansdyke LiDAR Flyover video further visualizes my conclusions.
My work also often challenges established archaeological dogma. I argue that many sites, such as Hambledon Hill, commonly identified as Iron Age hillforts are not what they seem. My posts Lidar Investigation Hambledon Hill – NOT an ‘Iron Age Fort’ and Unmasking the “Iron Age Hillfort” Myth explore these ideas in detail and offer an alternative view. Similarly, sites like Cissbury Ring and White Sheet Camp, also receive a re-evaluation based on LiDAR analysis in my posts Lidar Investigation Cissbury Ring through time and Lidar Investigation White Sheet Camp, revealing fascinating insights into their true purpose. I have also examined South Cadbury Castle, often linked to the mythical Camelot56.
My research also extends to the topic of ancient water management, including the role of canals and other linear earthworks. I have discussed the true origins of Car Dyke in multiple posts including Car Dyke – ABC News PodCast and Lidar Investigation Car Dyke – North Section, suggesting a Mesolithic origin2357. I also explore the misidentification of Roman aqueducts, as seen in my posts on the Great Chesters (Roman) Aqueduct. My research has also been greatly informed by my post-glacial flooding hypothesis which has helped to inform the landscape transformations over time. I have discussed this hypothesis in several posts including AI now supports my Post-Glacial Flooding Hypothesis and Exploring Britain’s Flooded Past: A Personal Journey
Finally, my blog also investigates prehistoric burial practices, as seen in Prehistoric Burial Practices of Britain and explores the mystery of Pillow Mounds, often mistaken for medieval rabbit warrens, but with a potential link to Bronze Age cremation in my posts: Pillow Mounds: A Bronze Age Legacy of Cremation? and The Mystery of Pillow Mounds: Are They Really Medieval Rabbit Warrens?. My research also includes the astronomical insights of ancient sites, for example, in Rediscovering the Winter Solstice: The Original Winter Festival. I also review new information about the construction of Stonehenge in The Stonehenge Enigma.
Further Reading
For those interested in British Prehistory, visit www.prehistoric-britain.co.uk, a comprehensive resource featuring an extensive collection of archaeology articles, modern LiDAR investigations, and groundbreaking research. The site also includes insights and extracts from the acclaimed Robert John Langdon Trilogy, a series of books exploring Britain during the Prehistoric period. Titles in the trilogy include The Stonehenge Enigma, Dawn of the Lost Civilisation, and The Post Glacial Flooding Hypothesis, offering compelling evidence about ancient landscapes shaped by post-glacial flooding.
To further explore these topics, Robert John Langdon has developed a dedicated YouTube channel featuring over 100 video documentaries and investigations that complement the trilogy. Notable discoveries and studies showcased on the channel include 13 Things that Don’t Make Sense in History and the revelation of Silbury Avenue – The Lost Stone Avenue, a rediscovered prehistoric feature at Avebury, Wiltshire.
In addition to his main works, Langdon has released a series of shorter, accessible publications, ideal for readers delving into specific topics. These include:
- The Ancient Mariners
- Stonehenge Built 8300 BCE
- Old Sarum
- Prehistoric Rivers
- Dykes, Ditches, and Earthworks
- Echoes of Atlantis
- Homo Superior
- 13 Things that Don’t Make Sense in History
- Silbury Avenue – The Lost Stone Avenue
- Offa’s Dyke
- The Stonehenge Enigma
- The Post-Glacial Flooding Hypothesis
- The Stonehenge Hoax
- Dawn of the Lost Civilisation
- Darwin’s Children
- Great Chester’s Roman Aqueduct
- Wansdyke
For active discussions and updates on the trilogy’s findings and recent LiDAR investigations, join our vibrant community on Facebook. Engage with like-minded enthusiasts by leaving a message or contributing to debates in our Facebook Group.
Whether through the books, the website, or interactive videos, we aim to provide a deeper understanding of Britain’s fascinating prehistoric past. We encourage you to explore these resources and uncover the mysteries of ancient landscapes through the lens of modern archaeology.
For more information, including chapter extracts and related publications, visit the Robert John Langdon Author Page. Dive into works such as The Stonehenge Enigma or Dawn of the Lost Civilisation, and explore cutting-edge theories that challenge traditional historical narratives.
Other Blogs
1
a
- AI now Supports – Homo Superior
- AI now supports my Post-Glacial Flooding Hypothesis
- Alexander the Great sailed into India – where no rivers exist today
- Ancient Secrets of Althorp – debunked
- Antler Picks built Ancient Monuments – yet there is no real evidence
- Antonine Wall – Prehistoric Canals (Dykes)
- Archaeological ‘pulp fiction’ – has archaeology turned from science?
- Archaeological Pseudoscience
- Archaeology in the Post-Truth Era
- Archaeology: A Bad Science?
- Archaeology: A Harbour for Fantasists?
- Archaeology: Fact or Fiction?
- Archaeology: The Flaws of Peer Review
- Archaeology’s Bayesian Mistake: Stop Averaging the Past
- Are Raised Beaches Archaeological Pseudoscience?
- Atlantis Found: The Mathematical Proof That Plato’s Lost City Was Doggerland
- ATLANTIS: Discovery with Dan Snow Debunked
- Avebury Ditch – Avebury Phase 2
- Avebury through time
- Avebury’s great mystery revealed
- Avebury’s Lost Stone Avenue – FREE Flipbook
b
- Battlesbury Hill – Wiltshire
- Beyond Stone and Bone: Rethinking the Megalithic Architects of Northern Europe
- BGS Prehistoric River Map
- Blackhenge: Debunking the Media misinterpretation of the Stonehenge Builders
- Brain capacity (Cro-Magnon Man)
- Britain’s First Road – Stonehenge Avenue
- Britain’s Giant Prehistoric Waterways
- British Roman Ports miles away from the coast
c
- Caerfai Promontory Fort – Archaeological Nonsense
- Car Dyke – ABC News PodCast
- Car Dyke – North Section
- Car Dyke Atlas – Prehistoric Canals – FREE Flipbook
- CASE STUDY – An Inconvenient TRUTH (Craig Rhos Y Felin)
- Case Study – River Avon
- Case Study – Woodhenge Reconstruction
- Chapter 2 – Craig Rhos-Y-Felin Debunked
- Chapter 2 – Stonehenge Phase I
- Chapter 2 – Variation of the Species
- Chapter 3 – Post Glacial Sea Levels
- Chapter 3 – Stonehenge Phase II
- Chapter 7 – Britain’s Post-Glacial Flooding
- Cissbury Ring through time
- Clement Reid, Doggerland, and the Archaeological Establishment
- Cro-Magnon Brain Capacity
- Cro-Magnon Megalithic Builders: Measurement, Biology, and the DNA
- Cro-Magnons – An Explainer
d
- Darwin’s Children – Flipbook
- Darwin’s Children – The Cro-Magnons
- Dawn of the Lost Civilisation – FREE Flipbook
- Dawn of the Lost Civilisation – Introduction
- Digging for Britain – Cerne Abbas
- Digging for Britain Debunked – Cerne Abbas 2
- Digging Up Britain’s Past – Debunked
- DLC Chapter 1 – The Ascent of Man
- Durrington Walls – Woodhenge through time
- Durrington Walls Revisited: Platforms, Fish Traps, and a Managed Mesolithic Landscape
- Dyke Construction – Hydrology 101
- Dykes Ditches and Earthworks
- DYKES of Britain
e
f
g
h
- Hadrian’s Wall – Military Way Hoax
- Hadrian’s Wall – the Stanegate Hoax
- Hadrian’s Wall LiDAR investigation
- Hambledon Hill – NOT an ‘Iron Age Fort’
- Hayling Island Lidar Maps
- Hidden Sources of Ancient Dykes: Tracing Underground Groundwater Fractals
- Historic River Avon
- Hollingsbury Camp Brighton – A Hillfort… or a Forgotten Harbour?
- Hollows, Sunken Lanes and Palaeochannels
- Homo Superior – Flipbook
- Homo Superior – History’s Giants
- How Lidar will change Archaeology
- Hydrology 101 Simplified: Why Britain’s Dykes Worked Without Rivers
i
l
m
- Maiden Castle through time
- Mathematics Meets Archaeology: Discovering the Mesolithic Origins of Car Dyke
- Mesolithic River Avon
- Mesolithic Stonehenge
- Minerals found in Prehistoric and Roman Quarries
- Mining in the Prehistoric to Roman Period
- Mount Caburn through time
- Mysteries of the Oldest Boatyard Uncovered
- Mythological Dragons – a non-existent animal that is shared by the World.
o
- Offa’s Dyke – FREE Flipbook
- Old Sarum Lidar Map
- Old Sarum Through Time…………….
- On Sunken Lands of the North Sea – Lived the World’s Greatest Civilisation.
- OSL Chronicles: Questioning Time in the Geological Tale of the Avon Valley
- Oswestry LiDAR Survey
- Oswestry through time
- Oysters in Archaeology: Nature’s Ancient Water Filters?
p
- Pillow Mounds: A Bronze Age Legacy of Cremation?
- Pinkery Canal
- Plato Was Right: The Archaeological Evidence the Academics Never Expected
- Post Glacial Flooding – Flipbook
- Prehistoric Burial Practices of Britain
- Prehistoric Canals – Wansdyke
- Prehistoric Canals – Wansdyke
- Prehistoric Canals (Dykes) – Great Chesters Aqueduct (The Vallum Pt. 4)
- Prehistoric Canals (Dykes) – Hadrian’s Wall Vallum (pt 1)
- Prehistoric Canals (Dykes) – Offa’s Dyke (Chepstow)
- Prehistoric Canals (Dykes) – Offa’s Dyke (LiDAR Survey)
- Prehistoric Canals (Dykes) – Offa’s Dyke Survey (End of Section A)
- Prehistoric Canals (Dykes) – Wansdyke (4)
- Prehistoric Canals Wansdyke 2
- Professor Bonkers and the mad, mad World of Archaeology
r
- Real-World Confirmation of Post-Glacial Flooding
- Rebirth in Stone: Decrypting the Winter Solstice Legacy of Stonehenge
- Rediscovering the Winter Solstice: The Original Winter Festival
- Rethinking Ancient Boundaries: The Vallum and Offa’s Dyke”
- Rethinking Ogham: Could Ireland’s Oldest Script Have Begun as a Tally System?
- Rethinking The Past: Mathematical Proof of Langdon’s Post-Glacial Flooding Hypothesis
- Rising Evidence, Falling Rivers: The Real Story of Europe’s First Farmers
- Rivers of the Past Were Higher: A Fresh Perspective on Prehistoric Hydrology
s
- Sea Level Changes
- Section A – NY26SW
- Section B – NY25NE & NY26SE
- Section C – NY35NW
- Section D – NY35NE
- Section E – NY46SW & NY45NW
- Section F – NY46SE & NY45NE
- Section G – NY56SW
- Section H – NY56NE & NY56SE
- Section I – NY66NW
- Section J – NY66NE
- Section K – NY76NW
- Section L – NY76NE
- Section M – NY87SW & NY86NW
- Section N – NY87SE
- Section O – NY97SW & NY96NW
- Section P – NY96NE
- Section Q – NZ06NW
- Section R – NZ06NE
- Section S – NZ16NW
- Section T – NZ16NE
- Section U – NZ26NW & NZ26SW
- Section V – NZ26NE & NZ26SE
- Silbury Avenue – Avebury’s First Stone Avenue
- Silbury Hill
- Silbury Hill / Sanctuary – Avebury Phase 3
- Sky Maps of Prehistoric Britain
- Somerset Plain – Signs of Post-Glacial Flooding
- South Cadbury Castle – Camelot
- Statonbury Camp near Bath – an example of West Wansdyke
- Stone me – the druids are looking the wrong way on Solstice day
- Stone Transportation and Dumb Censorship
- Stonehenge – Monument to the Dead
- Stonehenge Hoax – Dating the Monument
- Stonehenge Hoax – Round Monument?
- Stonehenge Hoax – Summer Solstice
- Stonehenge LiDAR tour
- Stonehenge Phase 1 – 8300 BCE Documentary
- Stonehenge Phase 1 — Britain’s First Monument
- Stonehenge Phase I (The Stonehenge Landscape)
- Stonehenge Solved – Pythagorean maths put to use 4,000 years before he was born
- Stonehenge Through Time
- Stonehenge, Doggerland and Atlantis connection
- Stonehenge: Borehole Evidence of Post-Glacial Flooding
- Stonehenge: Discovery with Dan Snow Debunked
- Stonehenge: The World’s First Computer – FREE Flipbook
- Stonehenge: The Worlds First Computer
- Stonehenge’s The Lost Circle Revealed – DEBUNKED
t
- Ten Reasons Why Car Dyke Blows Britain’s Earthwork Myths Out of the Water
- Ten Things You Didn’t Know About Britain’s Prehistoric Flooded Past
- Ten thousand year old boats found on Northern Europe’s Hillsides
- Ten thousand-year-old boats found on Northern Europe’s Hillsides
- Testing Plato’s Atlantis Against Reality
- The “Hunter-Gatherer” Myth: Why It’s Time to Bury This Outdated Term
- The Ancient Mariners – Flipbook
- The Ancient Mariners – Prehistoric seafarers of the Mesolithic
- The Ascent of Man — From Survival to Systems
- The Beringian Migration Myth: Why the Peopling of the Americas by Foot is Mathematically and Logistically Impossible
- The Bluestone Enigma
- The Bulford Hoax: The “Simpler, Older Stonehenge” That Wasn’t
- The Cheddar Man Hoax
- The Cro-Magnon Cover-Up: How DNA and PR Labels Erased Our Real Ancestry
- The Dolmen and Long Barrow Connection
- The Durrington Mega-Monument Hoax: What Lies Beneath? – Debunked
- The Durrington Walls Hoax – it’s not a henge?
- The Dyke Myth Collapses: Excavation and Dating Prove Britain’s Great Dykes Are Prehistoric Canals
- The First European Smelted Bronzes
- The Fury of the Past: Natural Disasters in Historical and Prehistoric Britain
- The Giant’s Graves of Cumbria
- The Giants of Prehistory: Cro-Magnon and the Ancient Monuments
- The Great Ancient DNA Illusion: How Statistical Models Became Archaeological “Facts”
- The Great Antler Pick Hoax
- The Great Bell Beaker Migration Myth
- The Great Chichester Hoax – A Bridge too far?
- The Great Dorchester Aqueduct Hoax
- The Great Farming Hoax – (Einkorn Wheat)
- The Great Farming Migration Hoax
- The Great Hadrian’s Wall Hoax
- The Great Iron Age Hill Fort Hoax
- The Great Offa’s Dyke Hoax
- The Great Prehistoric Migration Hoax
- The Great Stone Transportation Hoax
- The Great Stonehenge Hoax
- The Great Wansdyke Hoax
- The Henge and River Relationship
- The Logistical Impossibility of Defending Maiden Castle
- The Long Barrow and Dolmen Enigma
- The Long Barrow Mystery
- The Long Barrow Mystery: Unravelling Ancient Connections
- The Lost Island of Avalon – revealed
- The Maiden Way Hoax – A Closer Look at an Ancient Road’s Hidden History
- The Maths – LGM total ice volume
- The Mystery of Pillow Mounds: Are They Really Medieval Rabbit Warrens?
- THE ODYSSEY PROBLEM: WHY DID A WEEK-LONG VOYAGE BECOME A TEN-YEAR EPIC?
- The Old Sarum Hoax
- The Oldest Boat Yard in the World found in Wales
- The Perils of Paradigm Shifts: Why Unconventional Hypotheses Get Branded as Pseudoscience
- The Post-Glacial Flooding Hypothesis – 1/11
- The Post-Glacial Flooding Hypothesis – FREE Flipbook
- The Post-Glacial Flooding Theory
- The Problem with Hadrian’s Vallum
- The Rise of the Cro-Magnon (Homo Superior)
- The Roman Military Way Hoax
- The Silbury Hill Lighthouse?
- The Stone Money – Credit System
- The Stonehenge Avenue
- The Stonehenge Avenue
- The Stonehenge Code: Unveiling its 10,000-Year-Old Secret
- The Stonehenge Crescent: A Monument to a Lost World
- The Stonehenge Enigma – FREE Flipbook
- The Stonehenge Enigma: Part 1/6
- The Stonehenge Hoax – Bluestone Quarry Site
- The Stonehenge Hoax – FREE Flipbook
- The Stonehenge Hoax – FREE Flipbook
- The Stonehenge Hoax – Moving the Bluestones
- The Stonehenge Hoax – Periglacial Stripes
- The Stonehenge Hoax – Station Stones
- The Stonehenge Hoax – Stonehenge’s Location
- The Stonehenge Hoax – The Ditch
- The Stonehenge Hoax – The Slaughter Stone
- The Stonehenge Hoax – The Stonehenge Layer
- The Stonehenge Hoax – Totem Poles
- The Stonehenge Hoax – Woodhenge
- The Stonehenge Hospital
- The Stonehenge Transportation Mystery
- The Subtropical Britain Hoax
- The Troy, Hyperborea and Atlantis Connection
- The Vallum @ Hadrian’s Wall – it’s Prehistoric!
- The Vallum at Hadrian’s Wall Atlas – FREE Flipbook
- The Woodhenge Hoax
- Three Dykes – Kidland Forest
- Thurnam’s 137 Skulls: The Forgotten People Behind Britain’s Megaliths.
- Top Ten Misidentified Fire Beacons in British History
- Troy Debunked – Troy did not exist in Asia Minor, but in fact, the North Sea island of Doggerland
- TSE – DVD Barrows
- TSE DVD – An Inconvenient Truth
- TSE DVD – Antler Picks
- TSE DVD – Avebury
- TSE DVD – Durrington Walls & Woodhenge
- TSE DVD – Dykes
- TSE DVD – Epilogue
- TSE DVD – Stonehenge Phase I
- TSE DVD – Stonehenge Phase II
- TSE DVD – The Post-Glacial Hypothesis
- TSE DVD Introduction
- TSE DVD Old Sarum
- Twigs, Charcoal, and the Death of the Saxon Dyke Myth
w
- Wansdyke – Short Film
- Wansdyke Atlas – FREE Flipbook
- Wansdyke East – Prehistoric Canals
- Wansdyke LiDAR Flyover
- Wansdyke: A British Frontier Wall – ‘Debunked’
- Was Columbus the first European to reach America?
- What Archaeology Missed Beneath Stonehenge
- White Sheet Camp
- Why a Simple Fence Beats a Massive Dyke (and What That Means for History)
- Windmill Hill – Avebury Phase 1
- Winter Solstice – Science, Propaganda and Indoctrination
- Woodhenge – the World’s First Lighthouse?