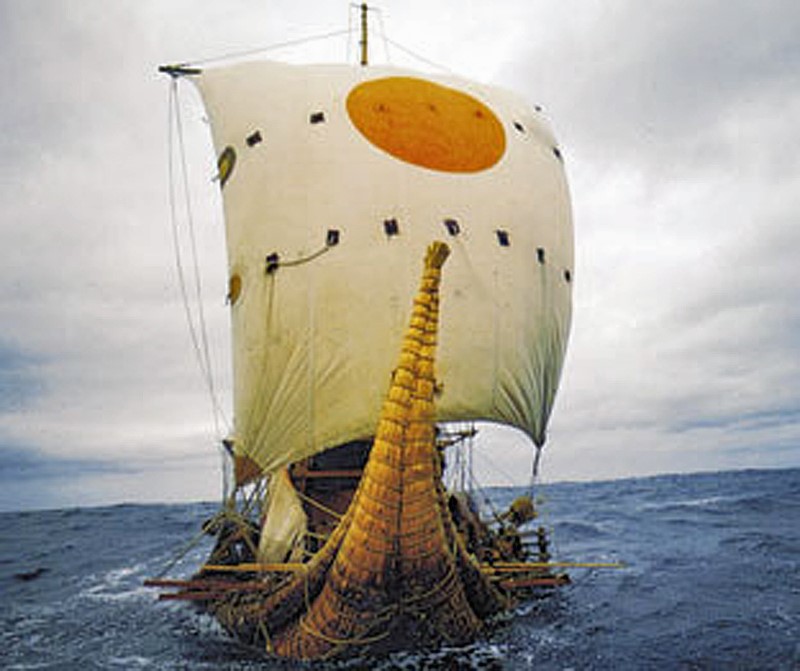
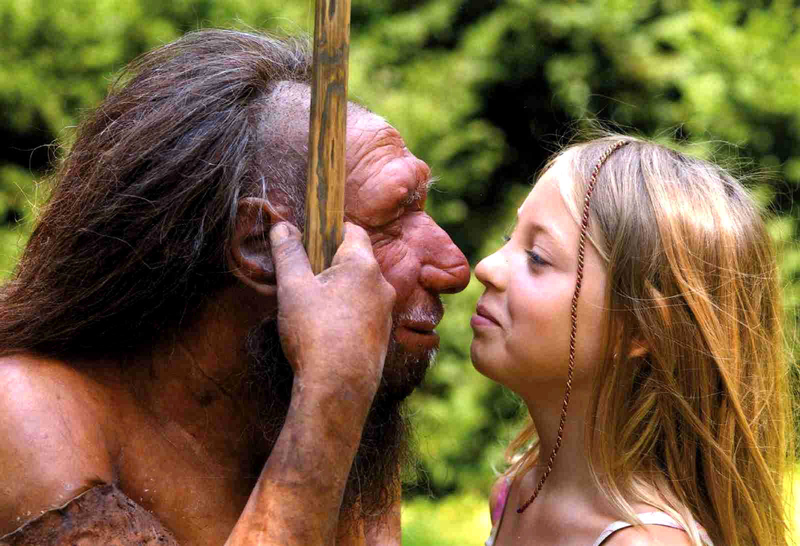
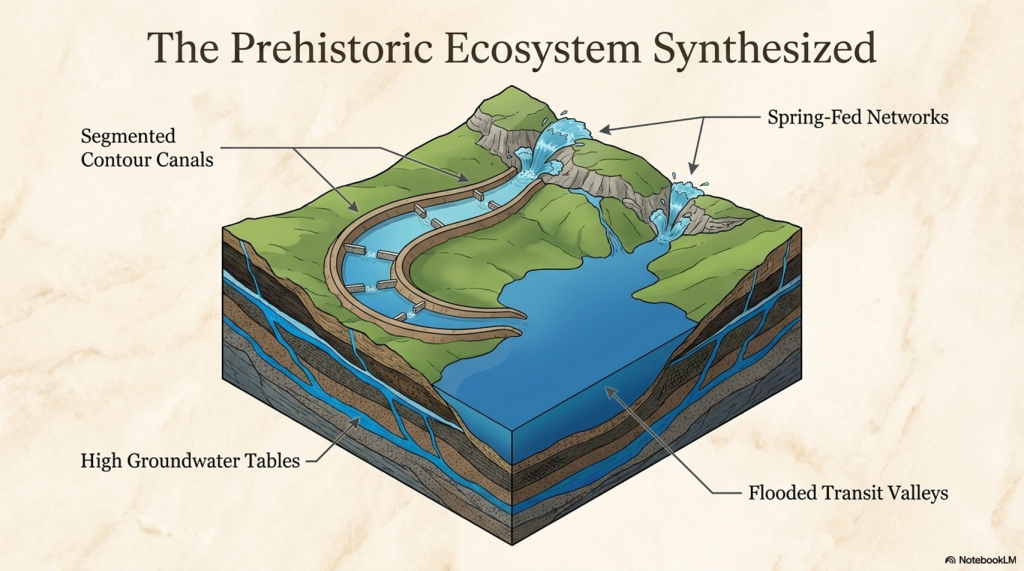
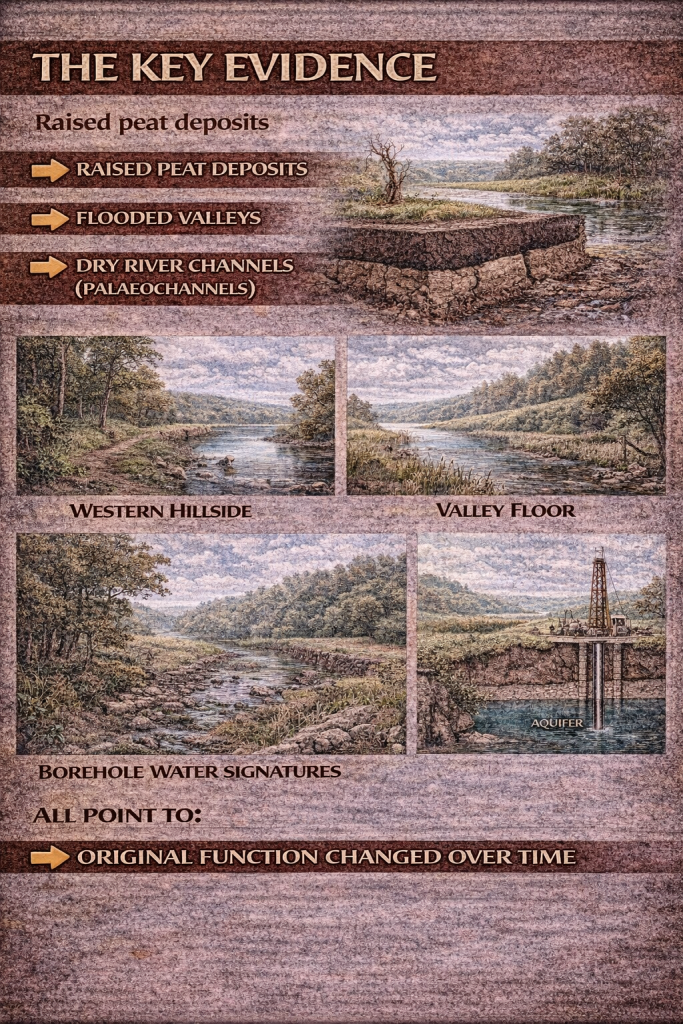
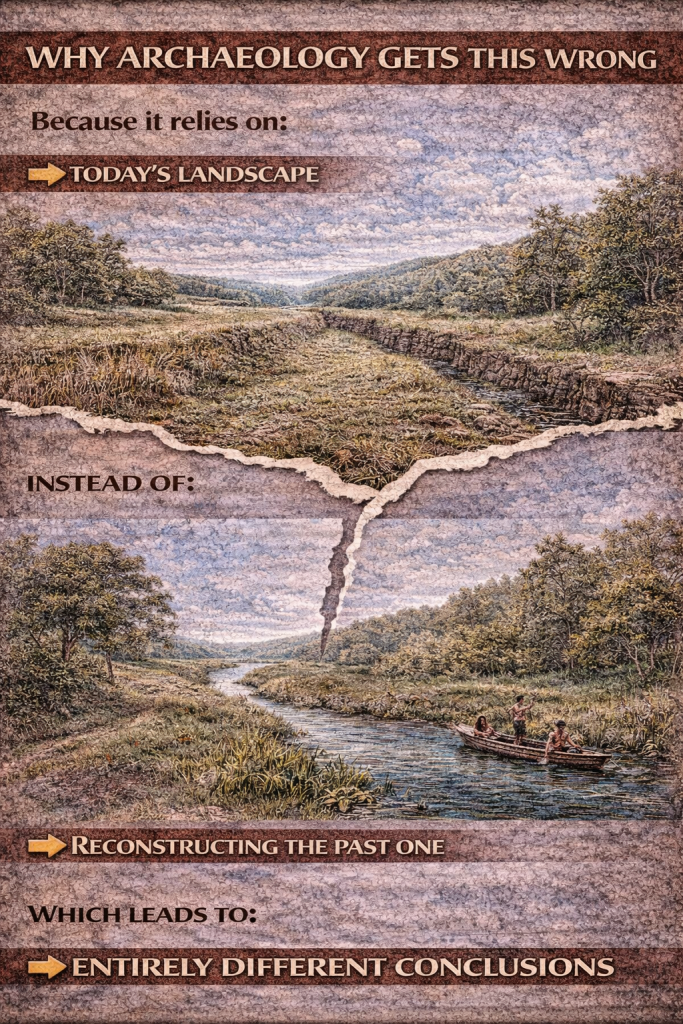
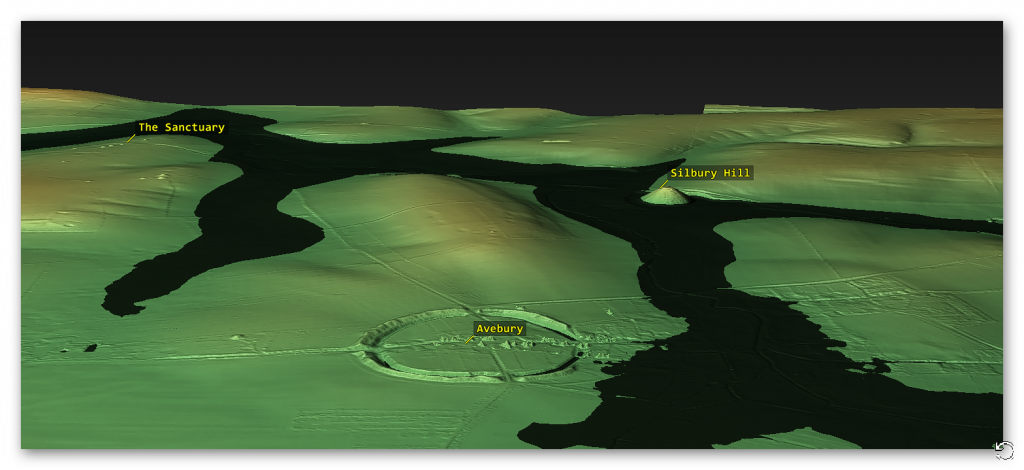
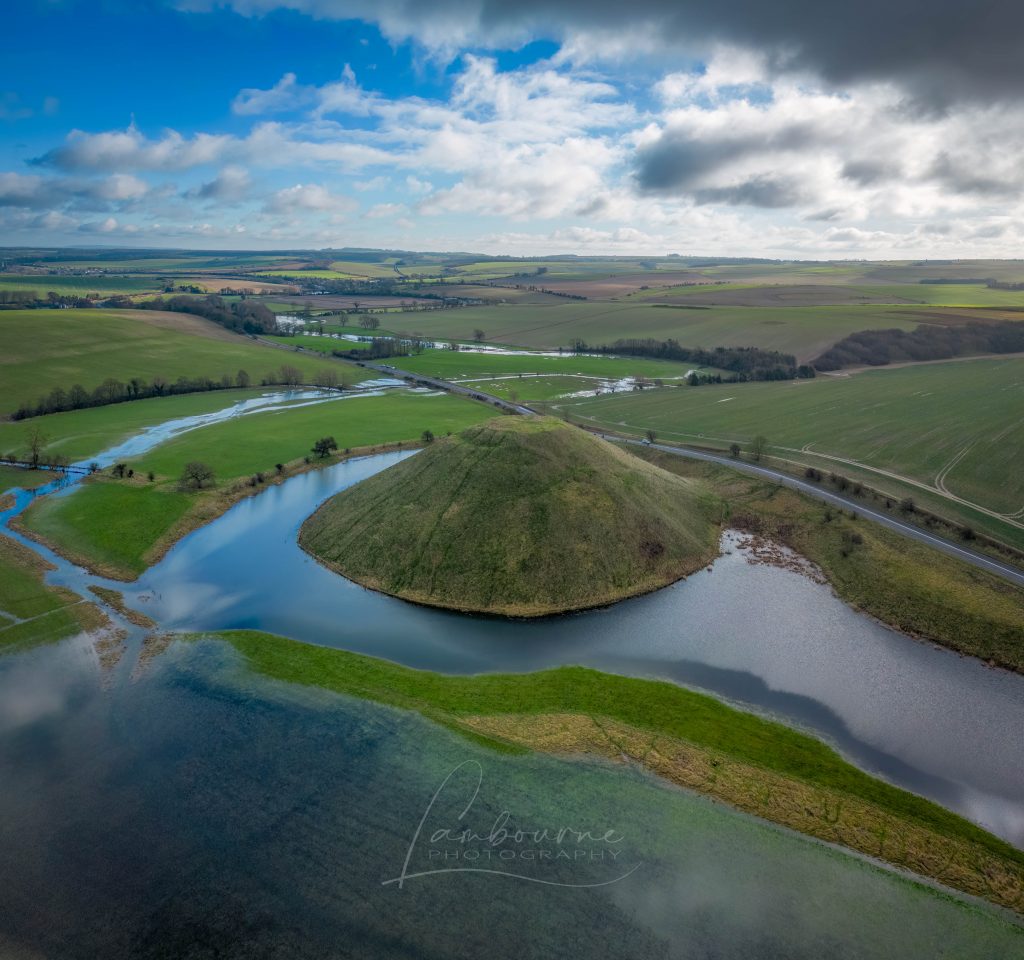
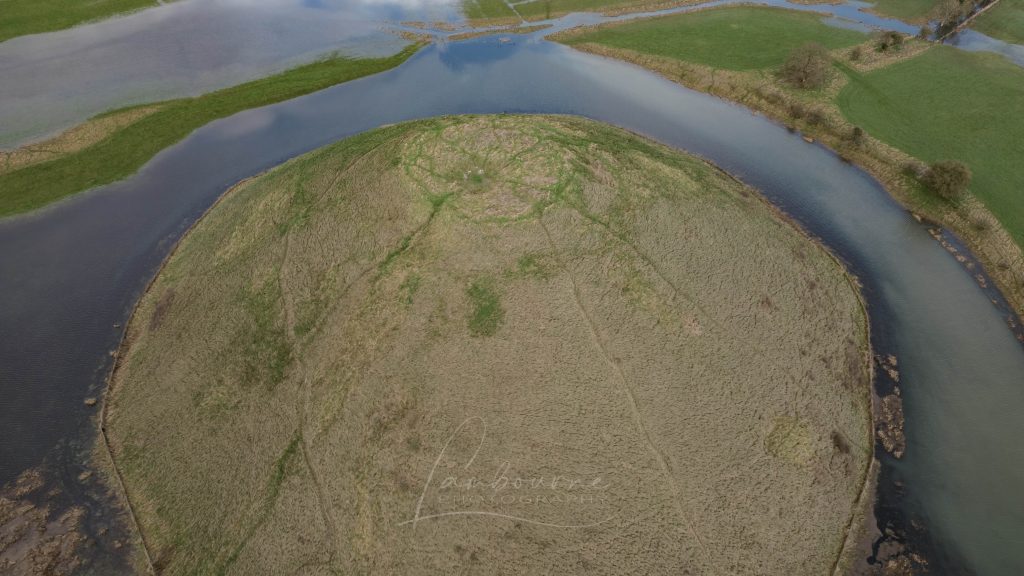
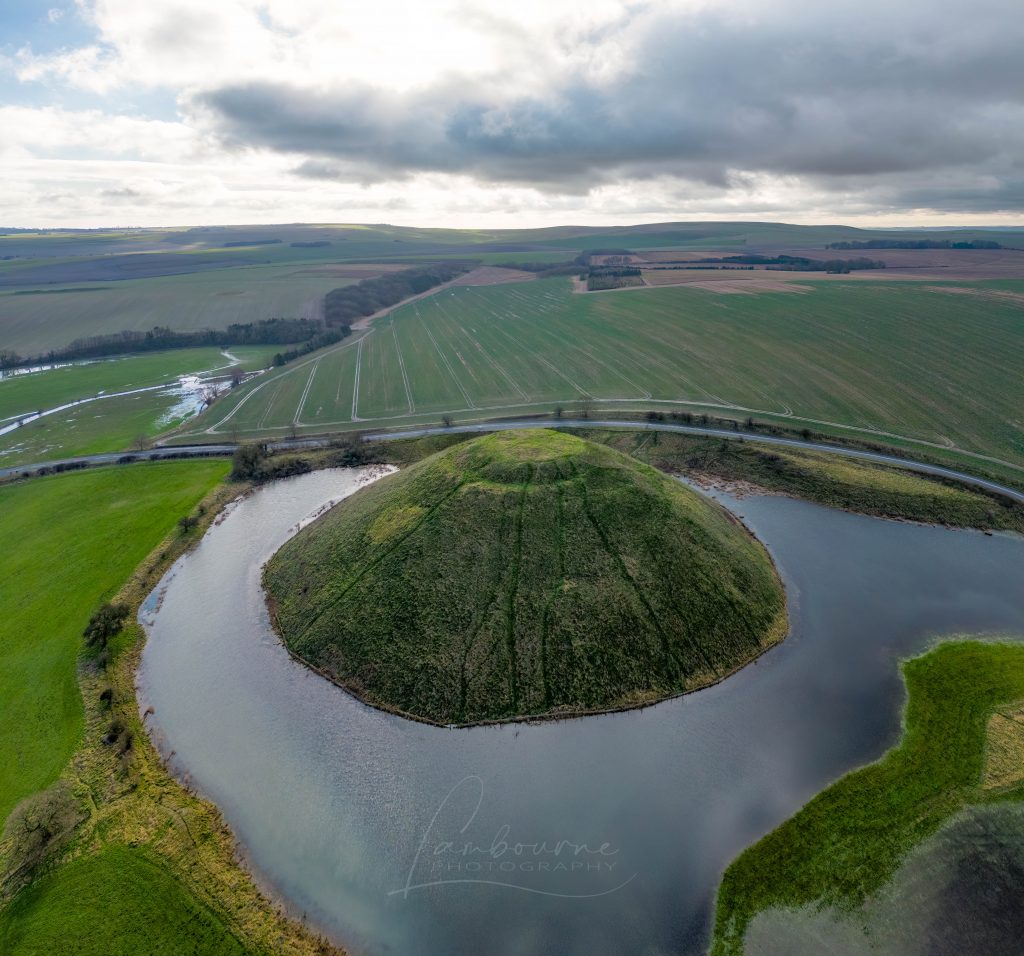
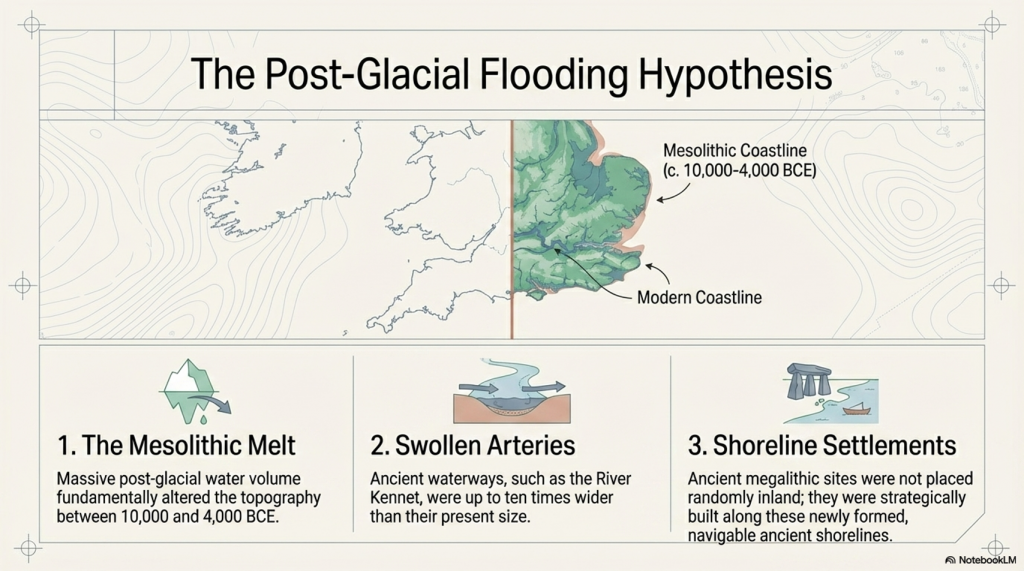
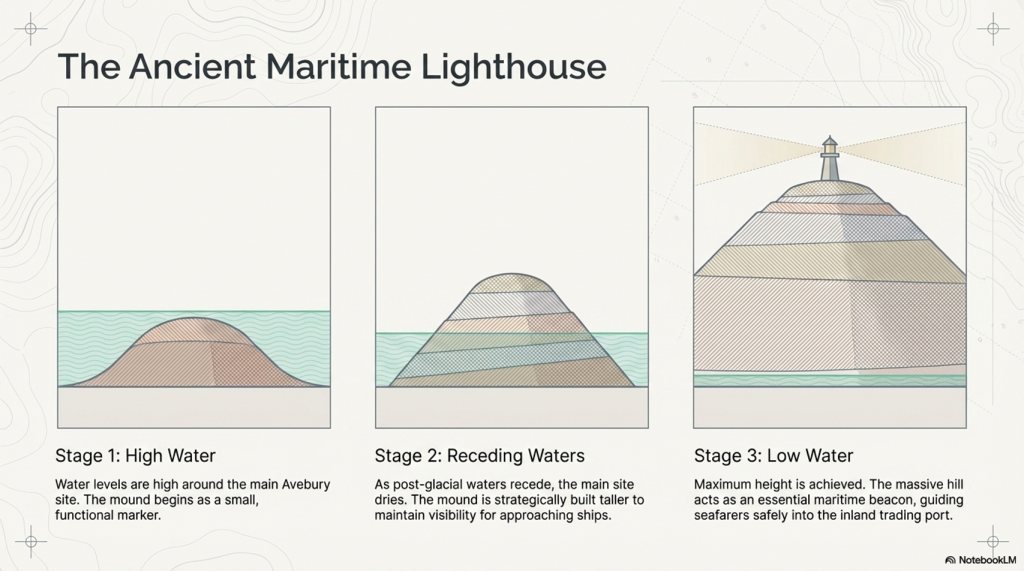
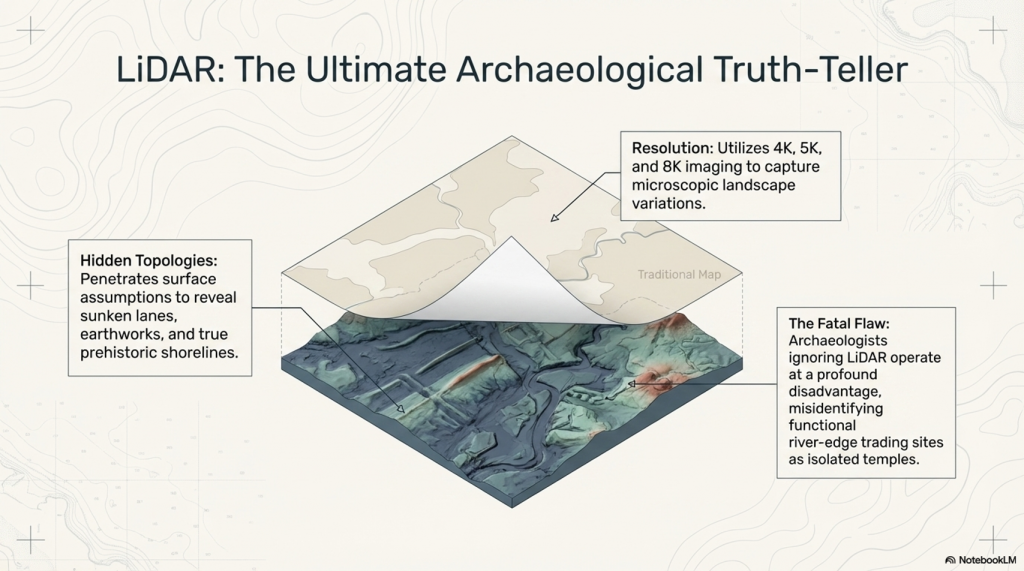
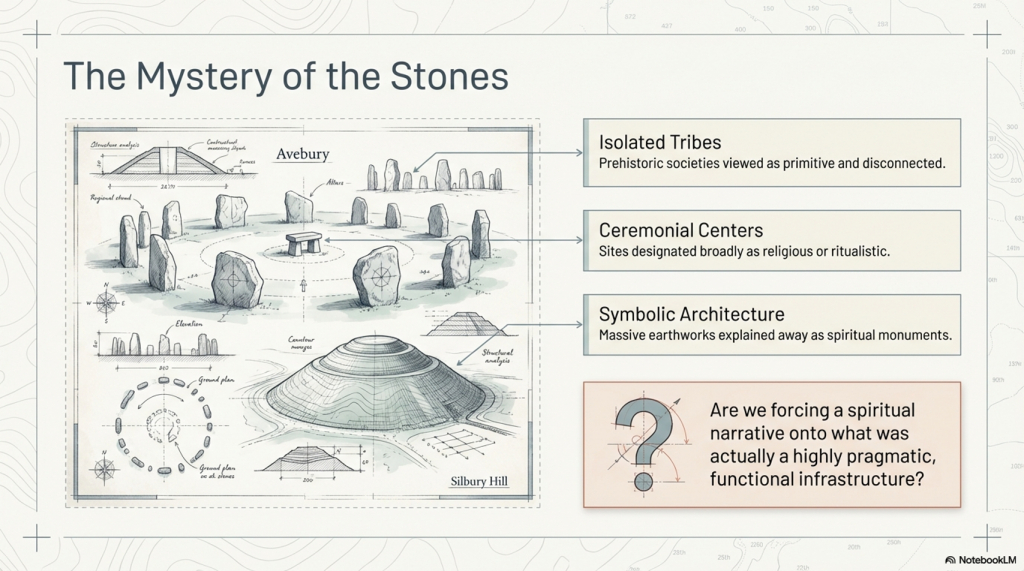
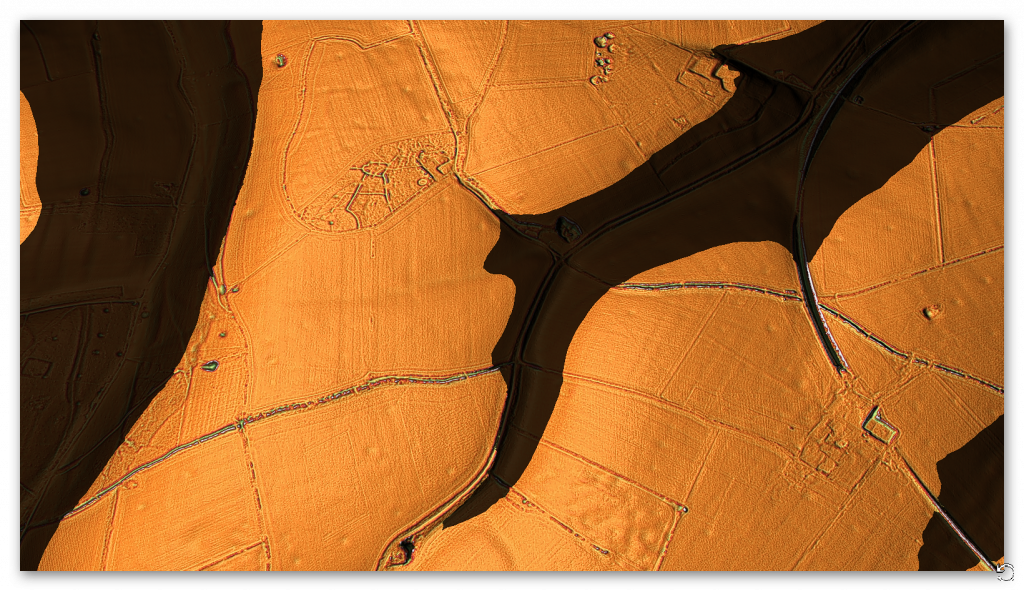
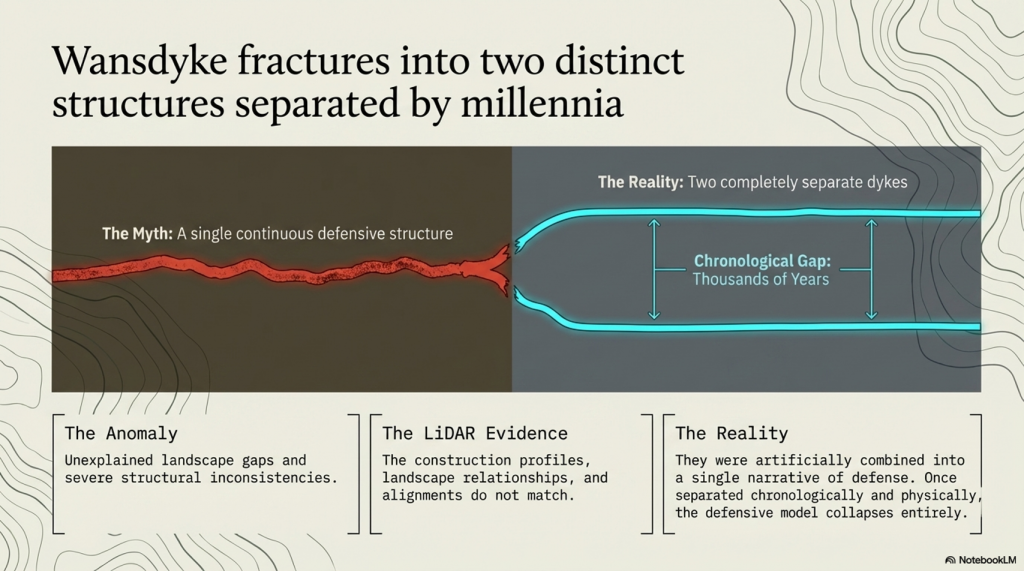
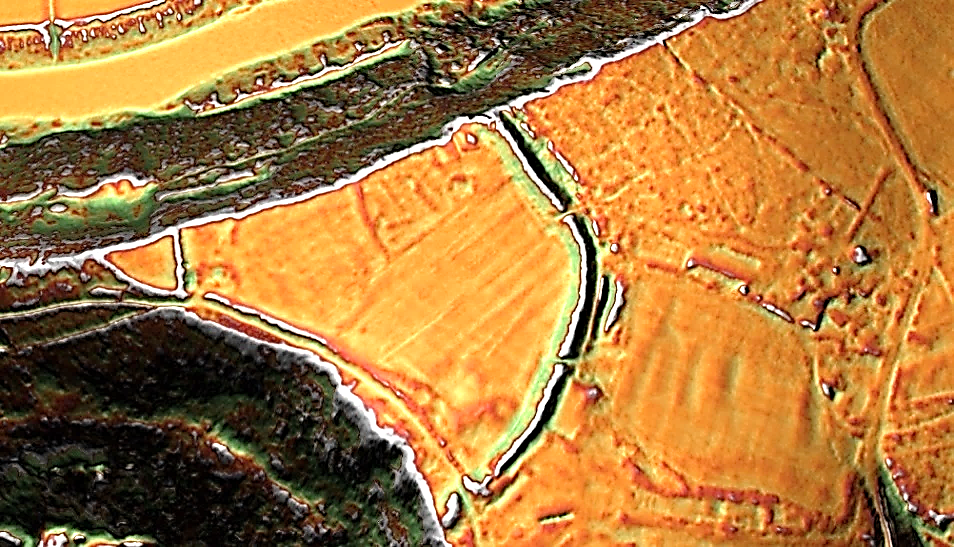
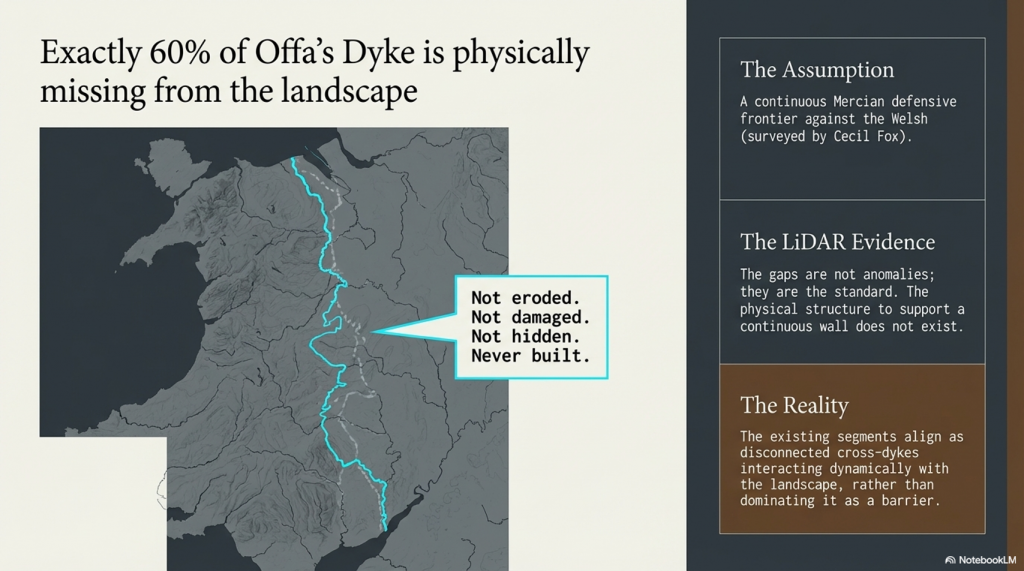
For most of human history, change was painfully slow. Early members of the genus Homo survived through hunting, gathering, and simple tool use, but across hundreds of thousands of years the archaeological record shows remarkable continuity rather than rapid advancement. Species such as Homo erectus and later populations associated with Homo heidelbergensis spread across Africa, Europe, and Asia, adapting to local conditions but leaving behind technologies that altered only gradually through time. (The Ascent of Man — From Survival to Systems)
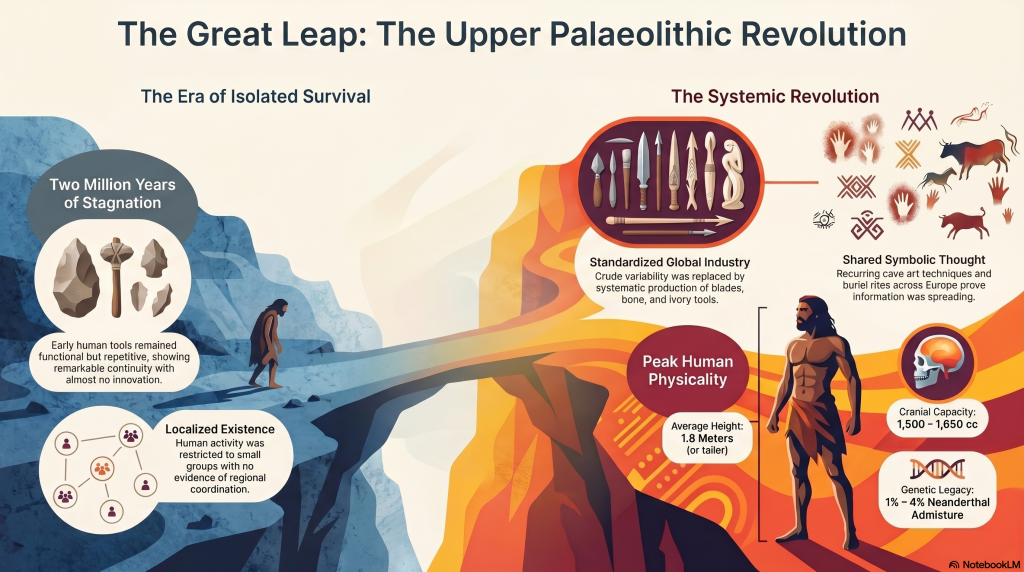
The tools they produced were functional but repetitive. Stone forms persisted for immense periods with little structural innovation, and activity appears largely localised rather than coordinated across large regions. Human groups survived successfully, but there is little evidence of widespread standardisation, long-distance organisation, or shared operational systems. Humanity endured — but it did not yet accelerate.
The Ascent of Man — From Survival to Systems
2. The Ice Age World
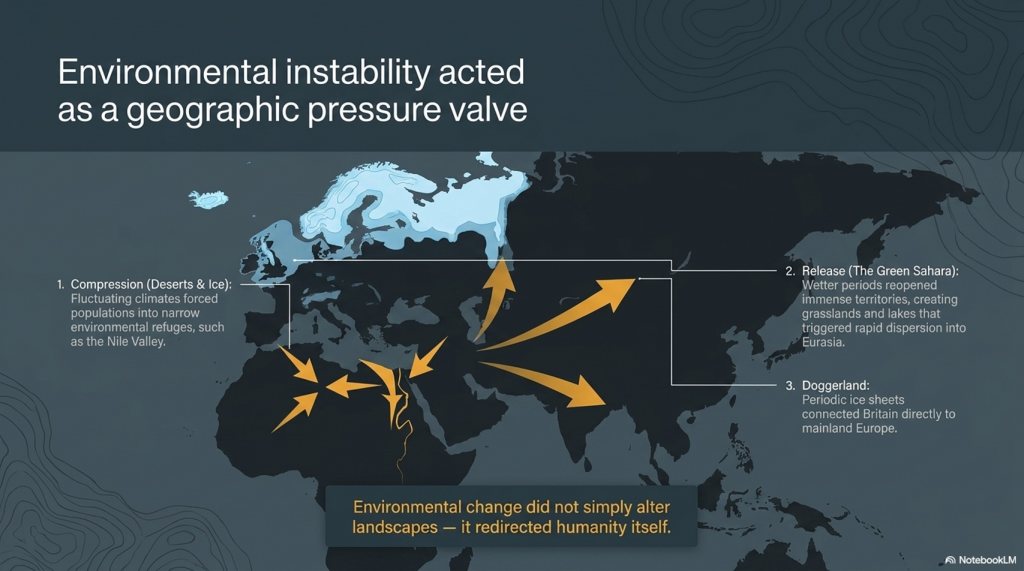
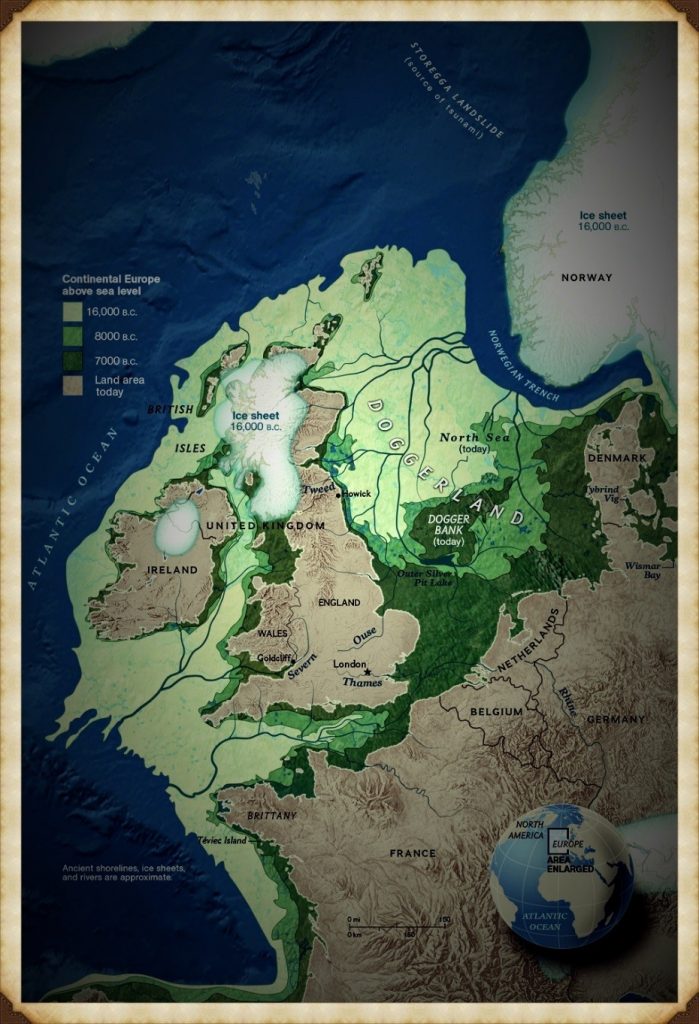
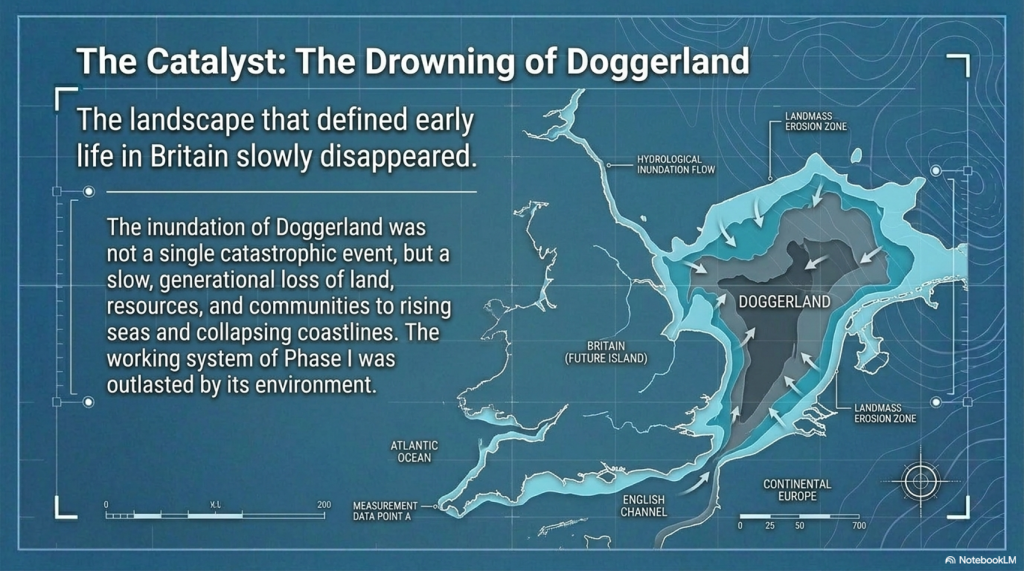
The Late Pleistocene world was shaped by instability. Vast ice sheets covered northern Europe and North America, sea levels were dramatically lower, and habitable regions shifted constantly in response to climatic oscillations. Britain itself was periodically buried beneath ice or connected directly to mainland Europe through the lowland plains of Doggerland.
As climates fluctuated, populations were repeatedly compressed into environmental refuges. In North Africa and the Near East, expanding deserts restricted movement into narrow corridors such as the Nile Valley. During wetter periods, however, enormous territories reopened. Grasslands, rivers, and lakes spread across what is now the Sahara, creating migration routes that allowed human populations to disperse rapidly into Eurasia. Environmental change did not simply alter landscapes — it redirected humanity itself.
The Ascent of Man — From Survival to Systems
3. The Arrival of Modern Humans in Europe
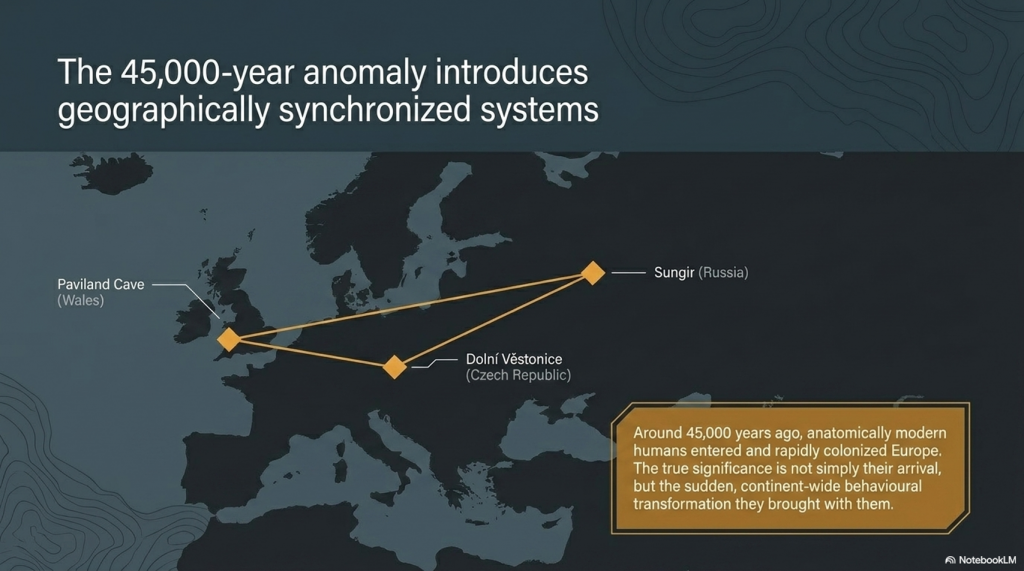
Around 45,000 years ago, anatomically modern humans entered Europe. These populations, later known as “Cro-Magnon,” spread rapidly across the continent, from France and Spain to Russia and Britain. Sites such as Paviland Cave in Wales, Sungir in Russia, and Dolní Věstonice in the Czech Republic reveal the presence of these early Europeans across an enormous geographical range.
What makes these populations important is not simply their anatomy, but the sudden transformation visible in the archaeological record associated with them. The Upper Palaeolithic does not merely continue earlier traditions — it behaves differently. Tool production becomes increasingly standardised, methods are repeated across regions, and material culture begins operating according to recognisable systems rather than isolated local practice.
The Ascent of Man — From Survival to Systems
4. The Upper Palaeolithic Revolution
For over two million years, human technology remained comparatively conservative. Then, within a relatively short archaeological window, a dramatic transition appears. Long, standardised blades replace crude variability. Bone, antler, and ivory are worked systematically into specialised tools. Production methods spread across enormous distances with remarkable consistency.
This is the real significance of the Upper Palaeolithic. Human behaviour becomes structured. Artefacts are no longer random outputs of survival, but components within organised systems of manufacture and use. The archaeological record suddenly begins displaying repetition, correction, standardisation, and coordination. Humanity was no longer simply adapting to the world — it was beginning to engineer solutions within it.
The Ascent of Man — From Survival to Systems
5. Art, Symbolism, and Shared Thought
The same pattern appears in symbolic behaviour. Cave art emerges across Europe in locations such as Lascaux, Chauvet Cave, and Altamira Cave. These sites display recurring techniques, recurring animals, and repeated visual conventions separated by vast geographical distances.
Burial practices also become increasingly structured. Ochre use, grave goods, body positioning, and ceremonial treatment repeat across multiple regions. This consistency matters. It demonstrates that information, practices, and behavioural systems were now spreading between populations rather than remaining isolated within local groups. Shared thought had become geographically mobile.
The Ascent of Man — From Survival to Systems
6. Water, Mobility, and the Rise of Networks
As the Ice Age ended, rivers, wetlands, estuaries, and coastlines dominated much of Eurasia. In this environment, waterborne movement became increasingly important. Waterways were not obstacles — they were transport corridors. The emergence of maritime adaptation transformed the scale at which human populations could operate.
One of the clearest examples comes from Gobustan Rock Art Cultural Landscape near the Caspian Sea, where prehistoric engravings depict long boats carrying organised crews. These images suggest coordinated water transport thousands of years before formal civilisation emerged. Rivers and coastlines now linked populations together, accelerating trade, migration, and cultural exchange across enormous distances.
The Ascent of Man — From Survival to Systems
7. Physical Characteristics of Cro-Magnon Populations
The skeletal evidence associated with Upper Palaeolithic Europeans reveals populations that were physically robust and highly active. Long bones display pronounced muscle attachment sites, dense structure, and adaptations consistent with sustained physical exertion. Many well-preserved individuals stood at or above 1.8 metres tall, placing them among the taller known prehistoric populations.
Cranial capacity is equally striking. Upper Palaeolithic skulls typically range from 1,500 to 1,650 cubic centimetres, with some exceeding 1,700 cc — placing them at the upper end of known human variation. While cranial volume alone does not determine intelligence, it remains a measurable anatomical distinction. Combined with the behavioural evidence, these populations represent a phase in which human capability appears to expand dramatically in both physical and organisational terms.
The Ascent of Man — From Survival to Systems
8. Genetics, Mixture, and Human Continuity
Modern genetic evidence confirms that these populations were not isolated species, but part of the wider Homo sapiens lineage. Ancient DNA studies show continuity between Upper Palaeolithic Europeans and later populations, alongside evidence of admixture with Neanderthals. Modern non-African populations still retain approximately 1–4% Neanderthal DNA.
At the same time, the genetic record reveals that human history was not a simple replacement process. Populations mixed, migrated, adapted, and survived through complex interactions across Eurasia. Studies such as Caramelli et al. (2008) even identified mitochondrial lineages from Upper Palaeolithic Europeans that are still present in modern populations. The evidence increasingly points toward continuity combined with transformation rather than disappearance and replacement.
The Ascent of Man — From Survival to Systems
9. The Disappearance of the Cro-Magnon Label
Despite its historical importance, the term “Cro-Magnon” has largely disappeared from formal anthropology. Modern classification groups these populations into the broader category of Homo sapiens, emphasising shared ancestry rather than distinct regional populations. Scientifically, this creates consistency — but it also reduces resolution.
The archaeological patterns associated with Cro-Magnon populations remain visible regardless of terminology. Standardised industries, structured behaviour, symbolic repetition, maritime adaptation, and large-scale coordination all still exist within the record. What has changed is not the evidence itself, but the framework used to describe it. The question is therefore not whether Cro-Magnon was a separate species, but whether current models fully explain the scale of behavioural change associated with these populations.
The Ascent of Man — From Survival to Systems
10. The Turning Point of Humanity
This is the real problem posed by the Upper Palaeolithic.
For millions of years, humans survived in relatively small groups using localised technologies that changed only slowly. Then, within a comparatively brief period, behaviour transformed. Systems emerged. Production became standardised. Activity spread across entire continents according to shared methods and repeatable structures.
Everything that follows in human history depends on this transition.
The principles first visible in the Upper Palaeolithic — coordination, measurement, repetition, mobility, and structured behaviour — are the same principles that later underpin agriculture, trade, engineering, navigation, mathematics, and eventually civilisation itself. Without this shift, humanity remains a species surviving within nature rather than organising it.
The great question is therefore not whether this transformation occurred, because the archaeological record clearly shows that it did.
The real question is:
How did humanity go from isolated survival… to organised systems capable of reshaping the world? And did these people build the Megalithic structures that have lasted ten thousand years and thrown archaeology into confusion by not recognising an advanced Lost Civilisation at the Dawn of Humanity?
PODCAST
Author’s Biography
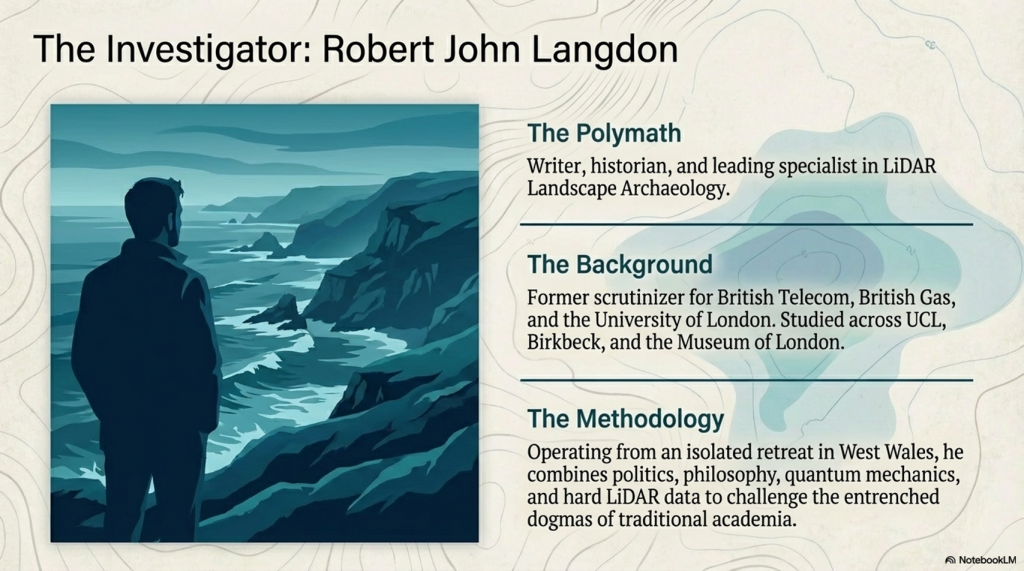
Robert John Langdon, a polymathic luminary, emerges as a writer, historian, and eminent specialist in LiDAR Landscape Archaeology.
His intellectual voyage has been interwoven with stints as an astute scrutineer in government and grand corporate bastions, a tapestry spanning British Telecommunications, Cable and Wireless, British Gas, and the esteemed University of London.
A decade hence, Robert’s transition into retirement unfurled a chapter of insatiable curiosity. This phase saw him immerse himself in Politics, Archaeology, Philosophy, and the enigmatic realm of Quantum Mechanics. His academic odyssey traversed the venerable corridors of knowledge hubs such as the Museum of London, University College London, Birkbeck College, The City Literature Institute, and Chichester University.
In the symphony of his life, Robert is a custodian of three progeny and a pair of cherished grandchildren. His sanctuary lies ensconced in the embrace of West Wales, where he inhabits an isolated cottage, its windows framing a vista of the boundless sea – a retreat from the scrutinising gaze of Her Majesty’s Revenue and Customs, an amiable clandestinity in the lap of nature.
Exploring Prehistoric Britain: A Journey Through Time
My blog delves into the fascinating mysteries of prehistoric Britain, challenging conventional narratives and offering fresh perspectives grounded in cutting-edge research, particularly LiDAR technology. I invite you to explore some key areas of my research. For example, the Wansdyke, often cited as a defensive structure, is re-examined in light of new evidence. I’ve presented my findings in my blog post Wansdyke: A British Frontier Wall – ‘Debunked’, and a Wansdyke LiDAR Flyover video further visualises my conclusions.
My work also often challenges established archaeological dogma. I argue that many sites, such as Hambledon Hill, commonly identified as Iron Age hillforts, are not what they seem. My posts Lidar Investigation Hambledon Hill – NOT an ‘Iron Age Fort’ and Unmasking the “Iron Age Hillfort” Myth explore these ideas in detail and offer an alternative view. Similarly, sites like Cissbury Ring and White Sheet Camp receive re-evaluations based on LiDAR analysis in my posts “Lidar Investigation Cissbury Ring through time”and “Lidar Investigation White Sheet Camp,“ revealing fascinating insights into their true purpose. I have also examined South Cadbury Castle, often linked to the mythical Camelot56.
My research also extends to ancient water management, including the role of canals and other linear earthworks. I have discussed the true origins of Car Dyke in multiple posts, including Car Dyke – ABC News Podcast and Lidar Investigation Car Dyke – North Section, which suggest a Mesolithic origin 2357. I also explore the misidentification of Roman aqueducts, as seen in my posts on the Great Chesters (Roman) Aqueduct. My research has also been greatly informed by my post-glacial flooding hypothesis, which has helped explain landscape transformations over time. I have discussed this hypothesis in several posts, including AI now supports my Post-Glacial Flooding Hypothesis and Exploring Britain’s Flooded Past: A Personal Journey
For those interested in British Prehistory, visit www.prehistoric-britain.co.uk, a comprehensive resource featuring an extensive collection of archaeology articles, modern LiDAR investigations, and groundbreaking research. The site also includes insights and excerpts from the acclaimed Robert John Langdon Trilogy, a series of books that explore Britain during the Prehistoric period. Titles in the trilogy include The Stonehenge Enigma, Dawn of the Lost Civilisation, and The Post-Glacial Flooding Hypothesis, which offer compelling evidence of ancient landscapes shaped by post-glacial flooding.
To further explore these topics, Robert John Langdon has developed a dedicated YouTube channel featuring over 100 video documentaries and investigations that complement the trilogy. Notable discoveries and studies showcased on the channel include 13 Things that Don’t Make Sense in History and the revelation of Silbury Avenue – The Lost Stone Avenue, a rediscovered prehistoric feature at Avebury, Wiltshire.
In addition to his main works, Langdon has released a series of shorter, accessible publications, ideal for readers delving into specific topics. These include:
For active discussions and updates on the trilogy’s findings and recent LiDAR investigations, join our vibrant community on Facebook. Engage with like-minded enthusiasts by leaving a message or contributing to debates in our Facebook Group.
Whether through the books, the website, or interactive videos, we aim to provide a deeper understanding of Britain’s fascinating prehistoric past. We encourage you to explore these resources and uncover the mysteries of ancient landscapes through the lens of modern archaeology.
For more information, including chapter extracts and related publications, visit the Robert John Langdon Author Page. Dive into works such as The Stonehenge Enigma or Dawn of the Lost Civilisation, and explore cutting-edge theories that challenge traditional historical narratives.
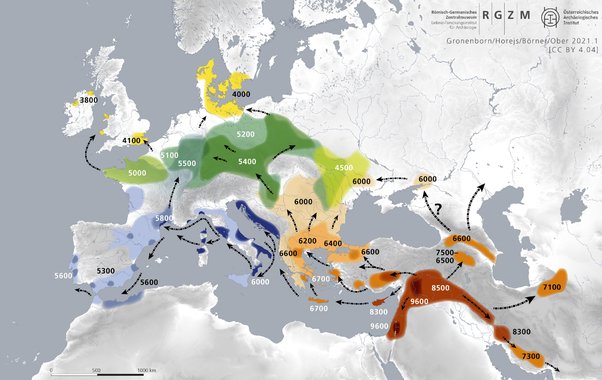
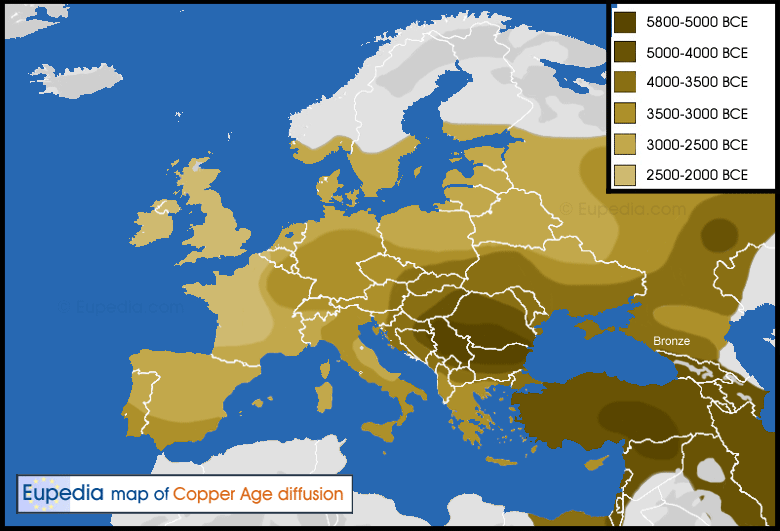
We are all familiar with the conventional story of migration from Asia Minor into Britain, a journey said to have unfolded slowly over thousands of years as people moved on foot, carrying culture and tools with them. It is often presented as a smooth and inevitable spread of humanity. However, this version of events is overly simplistic and does not withstand scrutiny. Migration is not a neat or uniform process, and reducing it to a slow drift across continents removes the complexity that defines real human behaviour.
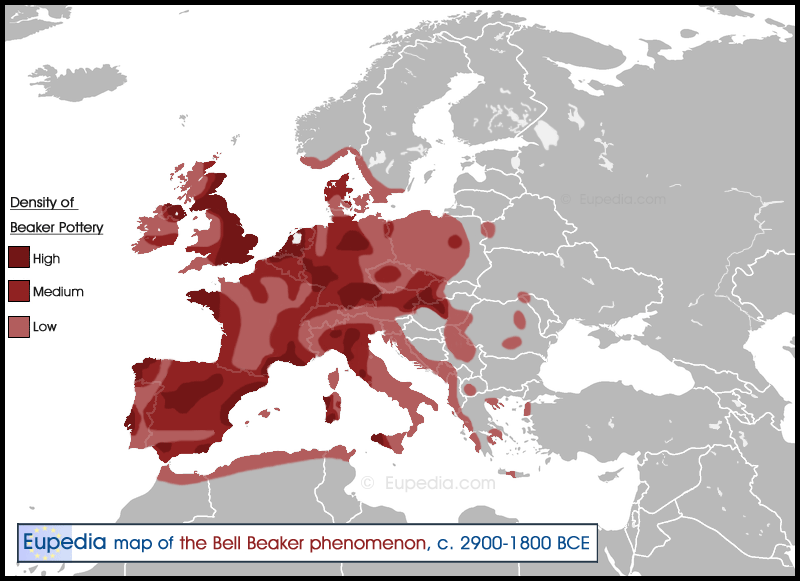
Traditional View of how Prehistoric cultures moved throughout Europe, over time (The Great Prehistoric Migration Hoax)
The idea that prehistoric populations gradually spread from Asia Minor into Britain over millennia forms the backbone of a major misunderstanding of prehistory. This assumption has shaped much of modern archaeology and historical interpretation, creating a framework that is difficult to challenge because so much depends on it. As a result, alternative interpretations struggle to gain traction, not necessarily because they are wrong, but because they disrupt an entrenched model.
Old Dated Concepts
The Great Prehistoric Migration Hoax
A significant problem arises when this simplified framework is treated as fact. It becomes embedded in education and public understanding, limiting how new evidence is interpreted. Instead of encouraging fresh thinking, it often forces discoveries to fit within an existing narrative. This restricts progress and prevents a more accurate reconstruction of the past.
Current thinking frequently suggests that key developments such as farming and metallurgy originated in Asia Minor and spread gradually through migrating populations. The assumption is that knowledge moved only as people physically relocated, passing ideas from one group to another over long periods. What this view ignores is the possibility that communication and exchange could occur without mass migration. Even basic technology would have enabled interaction at a distance, allowing ideas to travel far more quickly than people.
Many researchers remain influenced by this traditional model, and this affects how evidence is interpreted. When findings do not align with expectations, they are often dismissed as anomalies rather than investigated further. This creates a filtering effect, where only evidence that supports the established narrative is accepted, while contradictory data is sidelined.
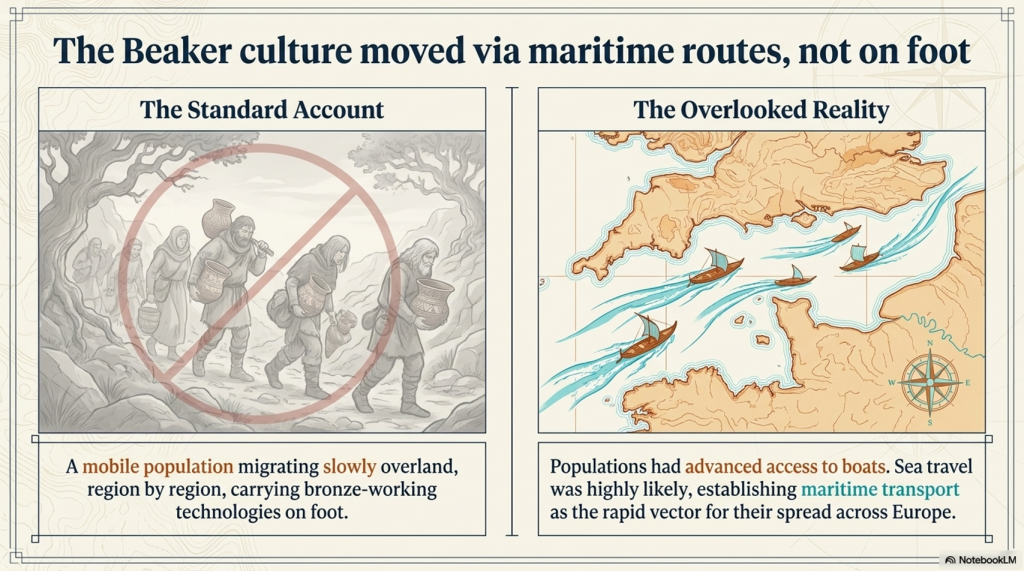
This issue becomes particularly clear when examining the so-called Beaker culture. The standard account describes a group of people spreading across Europe in search of metals, moving from region to region and carrying their distinctive pottery and technologies with them. They are often portrayed as a mobile, expansionist population responsible for the rapid spread of bronze working.
However, this explanation overlooks a key factor. These populations had access to boats. The idea that movement into Britain occurred primarily on foot ignores the obvious reality that sea travel was both possible and likely. If maritime transport existed, then trade networks could have been established long before any large-scale population movement. In this context, the movement of goods and ideas would precede the movement of people, not follow it.
A more realistic model would place trade at the centre of cultural exchange. Communities could interact, share knowledge, and acquire materials without relocating entirely. Migration, when it occurred, may have been a secondary effect of established trading relationships rather than the primary driver of cultural change.
Beaker People – The Great Prehistoric Migration Hoax
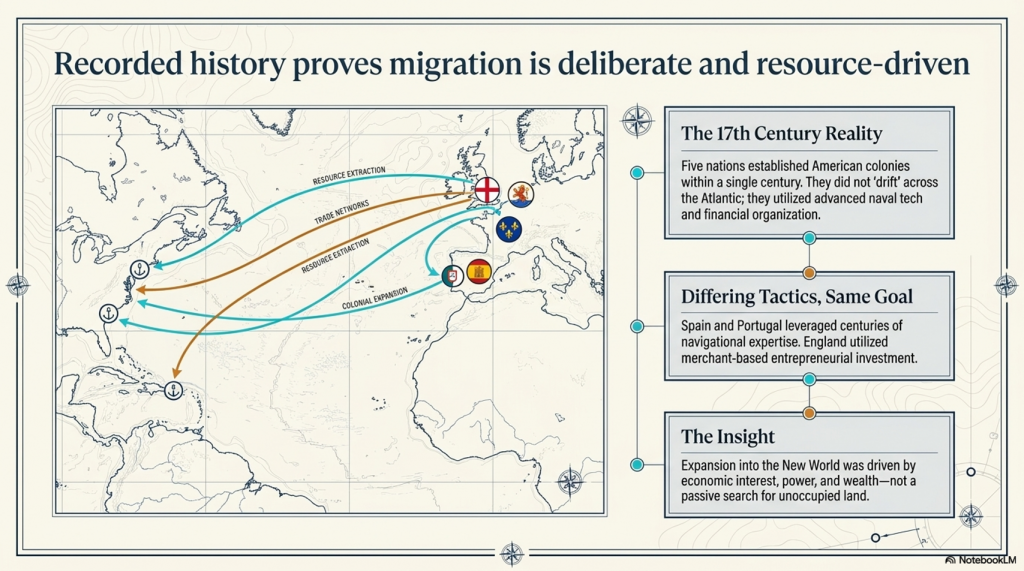
A useful comparison can be found in more recent history. The colonisation of the Americas demonstrates how movement actually occurs when supported by technology and motivation. European powers did not slowly drift across the Atlantic. They used ships, resources, and organisation to rapidly establish new settlements. Within a relatively short period, multiple nations had established colonies, driven by economic ambition rather than simple expansion.
This example highlights an important point. Migration is rarely driven by necessity alone. It is driven by opportunity. People move when there is something to gain, whether that is land, wealth, or strategic advantage. The process requires planning, resources, and intent. It is not a passive or accidental drift across landscapes.
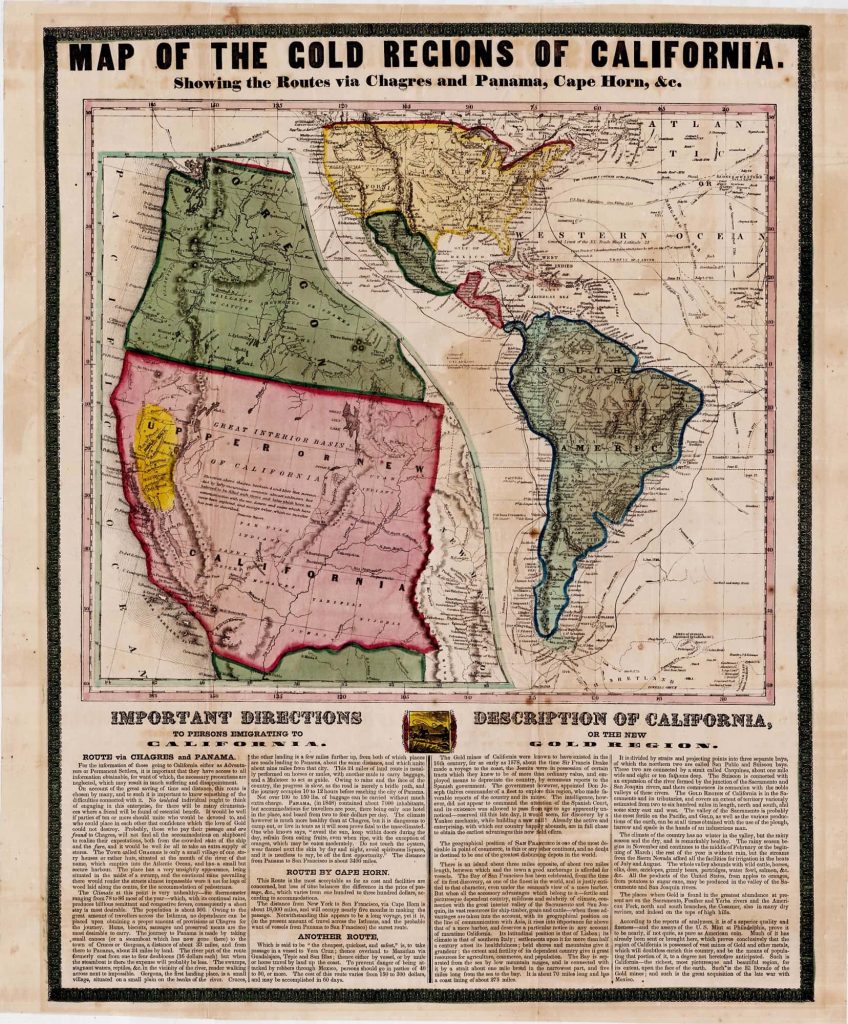
When populations expanded across North America, the movement was not gradual in the sense often imagined for prehistory. Instead, it occurred in distinct phases, often triggered by specific events. The California Gold Rush, for example, caused a rapid shift in population over vast distances in a matter of years. This demonstrates that large-scale movement can happen quickly when conditions are right.
Applying this understanding to prehistory challenges the idea of slow, continuous migration over thousands of years. If similar motivations existed in the past, then movement could have been far more dynamic and episodic than currently assumed. This raises questions about whether the traditional timeline accurately reflects reality.
Archaeological discoveries continue to add to this uncertainty. Evidence such as early boat finds and unexpected materials suggests that long-distance interaction occurred much earlier than previously believed. These findings indicate that prehistoric societies were capable of movement and communication on a scale that challenges conventional models.
Taken together, the evidence points towards a more complex picture. Human movement was not simply a gradual spread of populations across land. It was influenced by trade, technology, environment, and ambition. Ideas and materials could travel independently of people, and when people did move, they did so for specific reasons rather than as part of a slow and inevitable process.
Understanding migration in this way removes the limitations imposed by outdated assumptions. It allows for a more flexible and realistic interpretation of the past, one that recognises the capabilities of prehistoric societies rather than underestimating them.
New World Migration Patterns
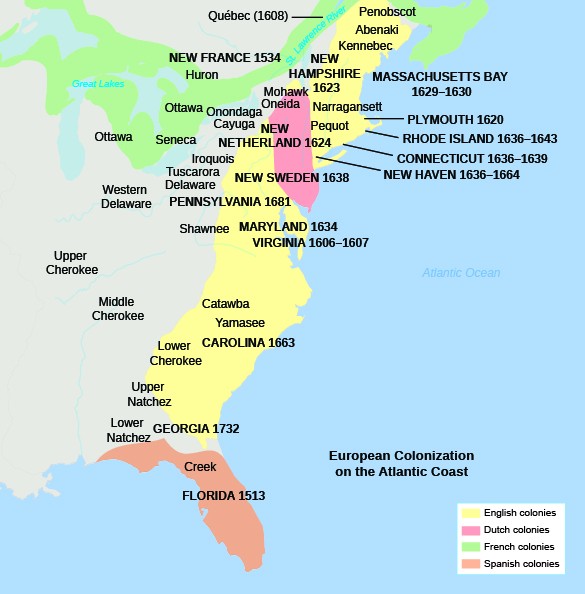
Indeed, the historical model of the European colonisation of America in the 17th century serves as a compelling and often overlooked example that challenges the dated perspectives on migration. This empirical evidence, rooted in written history, sheds light on the dynamics of movement and colonisation, showcasing the pivotal role of boats (or, in the case of America, carts) in facilitating such endeavours.
As highlighted by historical records, early colonists from European kingdoms with well-developed military, naval, governmental, and entrepreneurial capabilities embarked on colonising the New World. The Spanish and Portuguese, drawing on centuries of experience in conquest and colonisation, leveraged their expertise gained during the Reconquista and navigational skills for oceanic voyages. The English, French, and Dutch, while capable of building ocean-worthy ships, lacked the extensive histories of colonisation exhibited by Portugal and Spain. Nevertheless, English entrepreneurs established colonies with a foundation of merchant-based investment that required less government support.
A hundred years of colonisation from not one but five different countries – The Great Prehistoric Migration Hoax
This historical example underscores a critical point often overlooked in the study of migration — the motivations behind people’s movement. In this context, the colonisation of the New World was primarily driven by economic interests, power, and the pursuit of wealth. Failure to recognise these underlying motives represents an anthropological flaw in our historical narratives, which often simplify migration as a mere expansion into new territories. Understanding that migration involves significant time, effort, and resources challenges the notion that people move solely to find new lands to occupy. The fact that the population was relatively small at the time suggests that land occupation was more of a choice than a necessity, further emphasising the complex motivations behind human migration.
American Colonies
The spread of American colonies from just the East Coast to the West shows the motivation factor behind migration coast-to-coast. Here are some key reasons:
Land Availability: As European settlers arrived on the East Coast, they quickly realised that the region had limited arable land and was becoming crowded. The allure of available land in the western territories motivated people to move westward in search of better opportunities.
Economic Opportunities: The promise of fertile land for farming and the discovery of valuable resources, such as gold and silver, attracted many individuals and families to move west. The prospect of acquiring land for farming and starting anew was a powerful motivator.
Technological Advances: Improvements in transportation, such as the development of canals, roads, and later the railroad, made it easier for people to travel and settle in the western territories. These advancements reduced the challenges associated with long-distance migration.
Government Incentives: The U.S. government actively encouraged westward expansion through policies such as the Homestead Act of 1862, which provided 160 acres of public land to settlers for a small fee, provided they improved the land by building a dwelling and cultivating crops. This attracted many settlers to the frontier.
Escape from Economic Hardship: Some individuals moved west in the hope of escaping economic hardships or seeking a fresh start. This was particularly true during times of economic downturns or regional crises on the East Coast.
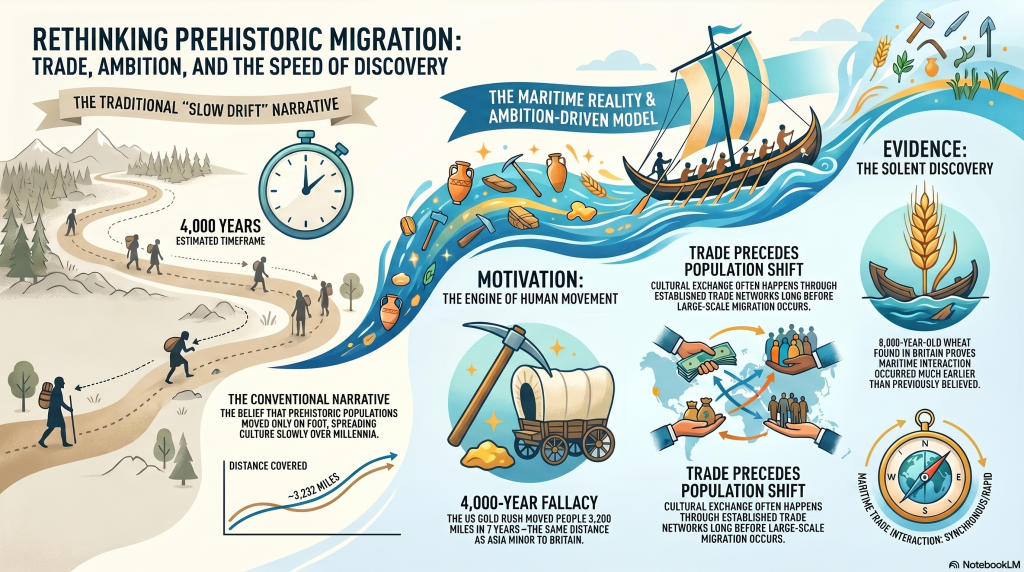
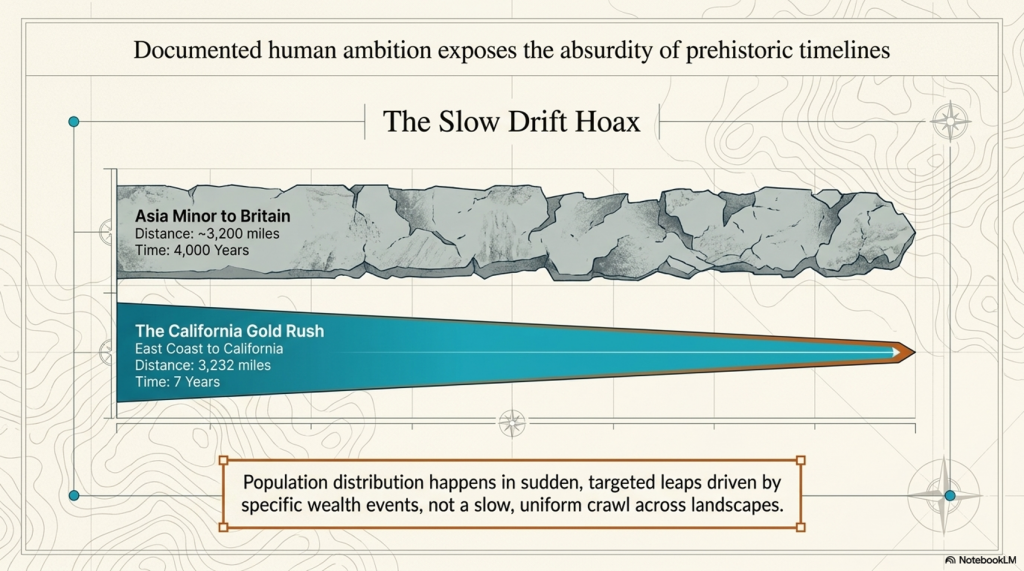
As I explore historical narratives, the distribution of populations across America emerges as a series of sudden leaps rather than a gradual process. Take, for instance, the bold leap made by the East Coast New England colonies during the California Gold Rush. Over just seven years, there was an astonishing migration of 3,232 miles—a journey equivalent to the distance from Asia Minor to Britain, a span traditionally believed to have taken four thousand years.
People migrate not through natural need but ambition – The Great Prehistoric Migration Hoax
This leap of faith was driven by reports of gold in California, sparking a massive upheaval as individuals sought to capitalise on the potential wealth. The allure of prosperity motivated people to traverse the continent’s vast expanse, reflecting how specific events and opportunities could swiftly reshape population distribution.
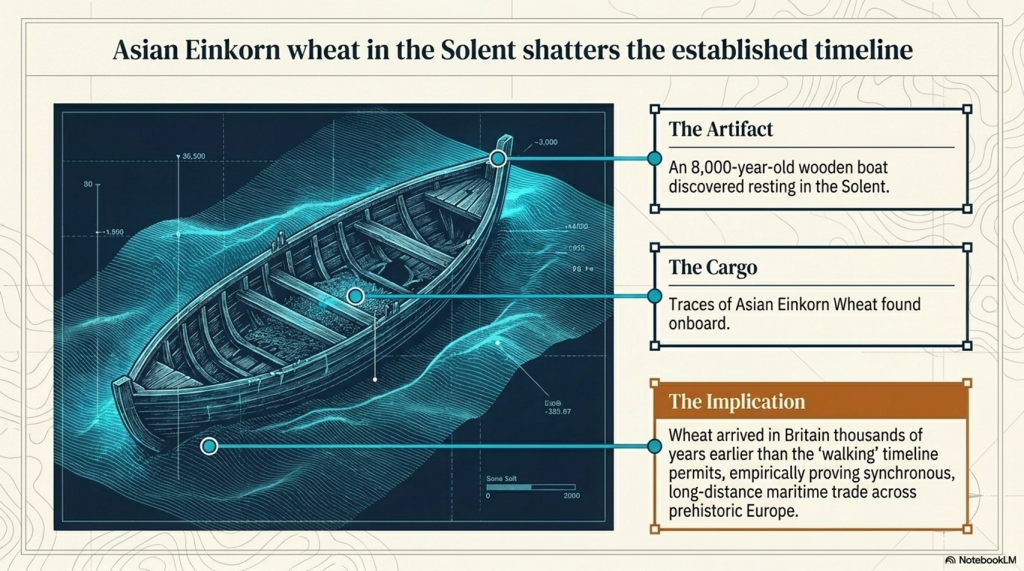
Asian Wheat in the Solent
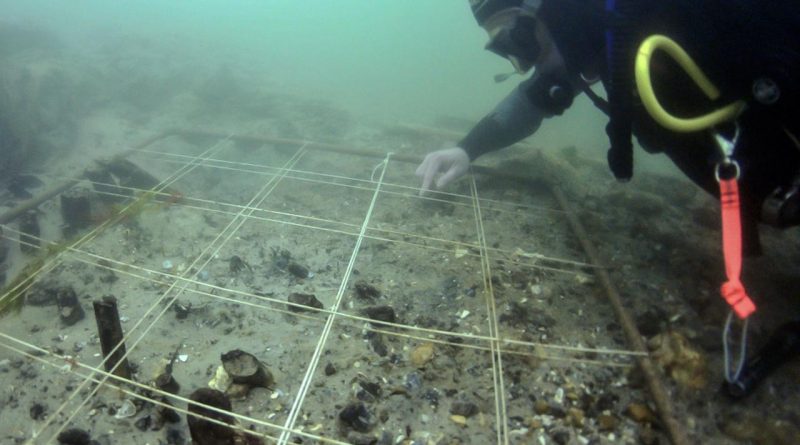
This intriguing phenomenon prompts me to reevaluate traditional timelines in light of recent archaeological discoveries. For example, the presence of an 8,000-year-old boat in the Solent carrying wheat challenges established notions. Wheat, believed to have been introduced to Britain much later, now questions the pace of historical movements and interactions. It’s a reminder that our understanding of history is dynamic, subject to revision as new evidence emerges, and that the narrative of human migration is filled with unexpected leaps and transformative moments.
As someone who has delved into the pages of history, it’s clear that the driving force behind human movement has consistently been the pursuit of prosperity. This very motivation underscores the crucial role that trading played in prehistoric times. Individuals displayed a willingness to traverse great distances in search of the abundant rewards that relocating, whether to America or prehistoric Britain, could offer. Contrary to some contemporary perceptions, the gradual dissemination of cultures and technology wasn’t as linear as we might currently believe.
In reflecting on the past, it becomes evident that the motivation to seek better economic opportunities was a shared aspect of the human experience. The narrative of the slow, methodical spread of cultures and technology was not a conscious effort but rather a consequence of our collective pursuit of better circumstances. The archaeological evidence available today strongly supports the notion that the exchange of ideas and the trade of materials occurred in tandem, almost synchronously, across the landscapes of Europe. It’s through this lens of trading ideology that we can better understand the interconnected and dynamic nature of our historical journey.
PODCAST
Author’s Biography
Robert John Langdon, a polymathic luminary, emerges as a writer, historian, and eminent specialist in LiDAR Landscape Archaeology.
His intellectual voyage has been interwoven with stints as an astute scrutineer in government and grand corporate bastions, a tapestry spanning British Telecommunications, Cable and Wireless, British Gas, and the esteemed University of London.
A decade hence, Robert’s transition into retirement unfurled a chapter of insatiable curiosity. This phase saw him immerse himself in Politics, Archaeology, Philosophy, and the enigmatic realm of Quantum Mechanics. His academic odyssey traversed the venerable corridors of knowledge hubs such as the Museum of London, University College London, Birkbeck College, The City Literature Institute, and Chichester University.
In the symphony of his life, Robert is a custodian of three progeny and a pair of cherished grandchildren. His sanctuary lies ensconced in the embrace of West Wales, where he inhabits an isolated cottage, its windows framing a vista of the boundless sea – a retreat from the scrutinising gaze of Her Majesty’s Revenue and Customs, an amiable clandestinity in the lap of nature.
Exploring Prehistoric Britain: A Journey Through Time
My blog delves into the fascinating mysteries of prehistoric Britain, challenging conventional narratives and offering fresh perspectives grounded in cutting-edge research, particularly LiDAR technology. I invite you to explore some key areas of my research. For example, the Wansdyke, often cited as a defensive structure, is re-examined in light of new evidence. I’ve presented my findings in my blog post Wansdyke: A British Frontier Wall – ‘Debunked’, and a Wansdyke LiDAR Flyover video further visualises my conclusions.
My work also often challenges established archaeological dogma. I argue that many sites, such as Hambledon Hill, commonly identified as Iron Age hillforts, are not what they seem. My posts Lidar Investigation Hambledon Hill – NOT an ‘Iron Age Fort’ and Unmasking the “Iron Age Hillfort” Myth explore these ideas in detail and offer an alternative view. Similarly, sites like Cissbury Ring and White Sheet Camp receive re-evaluations based on LiDAR analysis in my posts “Lidar Investigation Cissbury Ring through time”and “Lidar Investigation White Sheet Camp,“ revealing fascinating insights into their true purpose. I have also examined South Cadbury Castle, often linked to the mythical Camelot56.
My research also extends to ancient water management, including the role of canals and other linear earthworks. I have discussed the true origins of Car Dyke in multiple posts, including Car Dyke – ABC News Podcast and Lidar Investigation Car Dyke – North Section, which suggest a Mesolithic origin 2357. I also explore the misidentification of Roman aqueducts, as seen in my posts on the Great Chesters (Roman) Aqueduct. My research has also been greatly informed by my post-glacial flooding hypothesis, which has helped explain landscape transformations over time. I have discussed this hypothesis in several posts, including AI now supports my Post-Glacial Flooding Hypothesis and Exploring Britain’s Flooded Past: A Personal Journey
For those interested in British Prehistory, visit www.prehistoric-britain.co.uk, a comprehensive resource featuring an extensive collection of archaeology articles, modern LiDAR investigations, and groundbreaking research. The site also includes insights and excerpts from the acclaimed Robert John Langdon Trilogy, a series of books that explore Britain during the Prehistoric period. Titles in the trilogy include The Stonehenge Enigma, Dawn of the Lost Civilisation, and The Post-Glacial Flooding Hypothesis, which offer compelling evidence of ancient landscapes shaped by post-glacial flooding.
To further explore these topics, Robert John Langdon has developed a dedicated YouTube channel featuring over 100 video documentaries and investigations that complement the trilogy. Notable discoveries and studies showcased on the channel include 13 Things that Don’t Make Sense in History and the revelation of Silbury Avenue – The Lost Stone Avenue, a rediscovered prehistoric feature at Avebury, Wiltshire.
In addition to his main works, Langdon has released a series of shorter, accessible publications, ideal for readers delving into specific topics. These include:
For active discussions and updates on the trilogy’s findings and recent LiDAR investigations, join our vibrant community on Facebook. Engage with like-minded enthusiasts by leaving a message or contributing to debates in our Facebook Group.
Whether through the books, the website, or interactive videos, we aim to provide a deeper understanding of Britain’s fascinating prehistoric past. We encourage you to explore these resources and uncover the mysteries of ancient landscapes through the lens of modern archaeology.
For more information, including chapter extracts and related publications, visit the Robert John Langdon Author Page. Dive into works such as The Stonehenge Enigma or Dawn of the Lost Civilisation, and explore cutting-edge theories that challenge traditional historical narratives.
This is a journey through time, looking at the prehistoric London (The Thames) through time, Landscape based on the book ‘The Post-Glacial Flooding Hypothesis’ – that contains conclusive and extended evidence of Robert John Langdon’s hypothesis, that rivers of the past were higher than today, which changes the history of not only Britain, but the world. In this extract, we look at the Case Study within the book about the Thames. (The Thames through time ).
Case Study – The Thames
The Lower Thames sequence has been thoroughly studied not only because it is one of the largest river systems in the country but also because of its fortuitous exposure in many of the quarries and recent development programmes in and around London. The Thames was diverted into its current valley during the Anglian period, where it proceeded to lay down extensive gravel deposits before reaching the sea. Archaeological interest in the Thames alluvial deposits and the raised beaches of the south-east coast is also due to the presence of significant Lower and Middle Palaeolithic artefacts and hominin remains within these deposits.
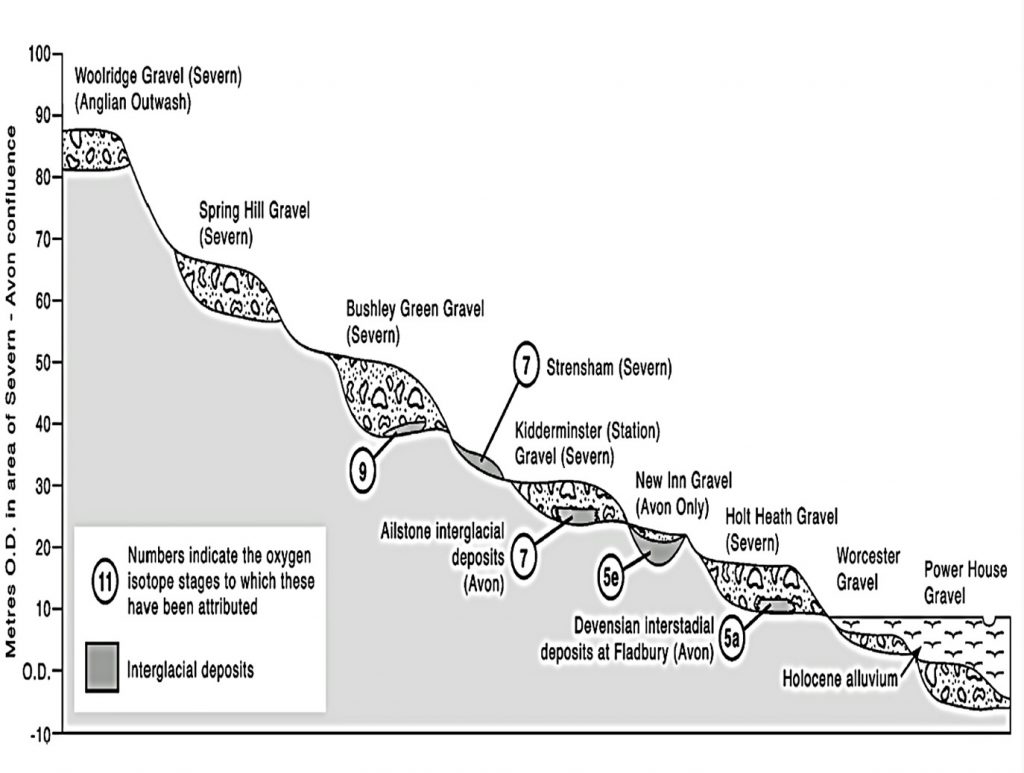
The depositional chronology of the Thames gravel terraces has not yet been universally accepted, and the two significant sequences have been proposed by Gibbard (1985) and Bridgland (1994). This is because the terraces are dated by the artefacts found within them, which are archaeologically dated and not carbon-dated. The problem with this method is that if the area flooded after the original deposits were laid down, the artefacts could have been washed down from upstream and embedded at random.
Traditional View of the Thames River terraces
(The Thames through time)
The modern floodplain of the Lower Thames, downstream of central London, is bounded either by older Pleistocene sands or gravels at the higher levels or by bedrock. The depositional chronology of the Thames gravel terraces has not yet been universally accepted, and the two significant sequences were proposed by Gibbard (1985).
The SBAB model of floodplain evolution proposes that during the early Holocene, multi-channel braided systems stabilised as some channels narrowed and deepened, and others were progressively abandoned over the course of the Holocene (Brown et al. 1994).
The Lower Thames saw a rise of about 15m in relative sea level between c. 10,000 and c. 6000 BP (Rackham and Sidell, 2000; Sidell, 2003b). This would have had a significant effect on the settlement of the outer and mid estuary floodplain. It has been suggested, for example, that settlement areas along the river margin progressively moved to higher ground as the land below was overtaken by the rising water levels (Rackham and Sidell 2000).
During the early Holocene, the Lower Thames floodplain was a complex environment of peat-forming areas, migrating channels and raised eyots (Sidell 2003a). Often, these eyots were the focus of prehistoric occupation, for example, at Runnymede (Needham 1991; 1992), Westminster, Southwark (Bowsher 1991; Dillion et al. 1991; Merriman 1992), and Bermondsey (Sidell et al. 2002). These areas tended to lie at the junction between the higher ground on the edge of an island and the adjacent peat and alluvium, which preserved evidence of human activity that occurred when river levels were lower (Merriman 1992; Sidell et al. 2002).
The investigations carried out for the Jubilee Line extension have suggested that the sand eyots of Westminster and north Southwark did not complete their formation by the early Holocene as initially believed. Still, instead, they formed in the mid-Neolithic (c. 3500 cal B.C.). This could help explain why there is a lack of Early Neolithic occupation in the floodplain (Sidell 2003b).
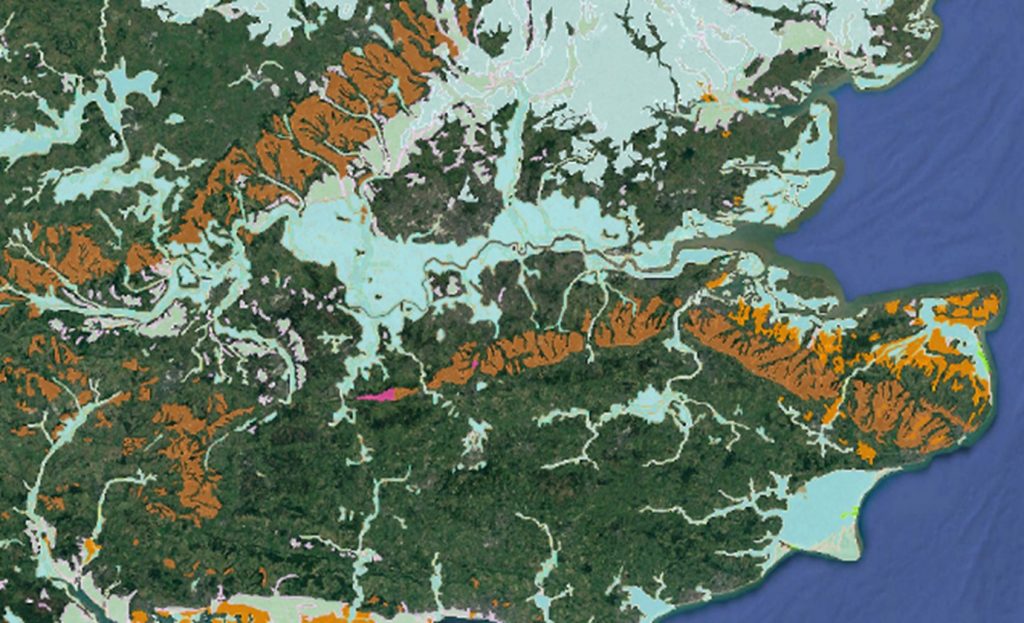
An extensive number of boreholes (> 1100) have enabled the British Geological Society to map the extent of flooding in the early Holocene, as it left extensive alluvium up to 10m deep in places, showing the long duration of the raised water levels.
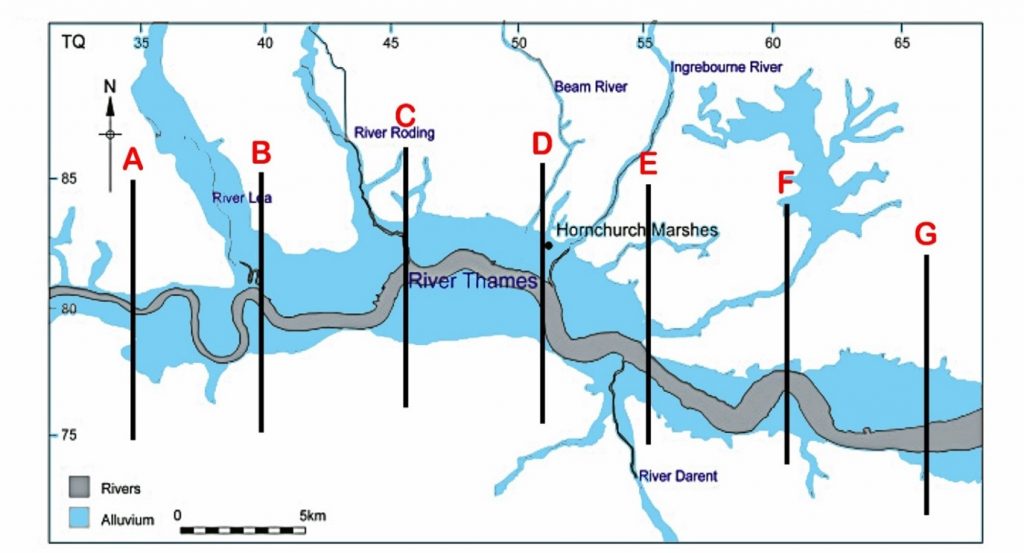
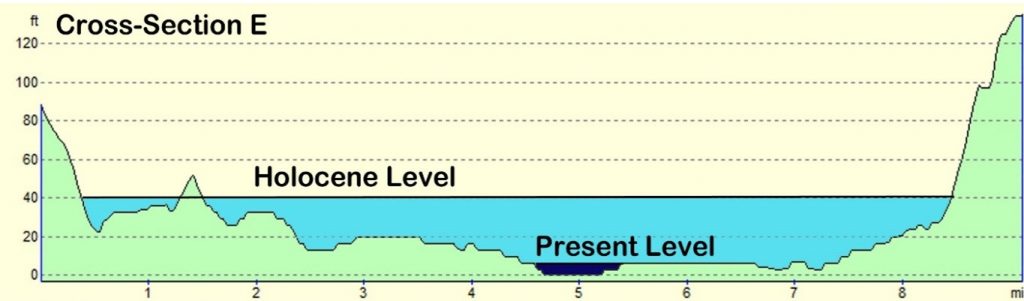
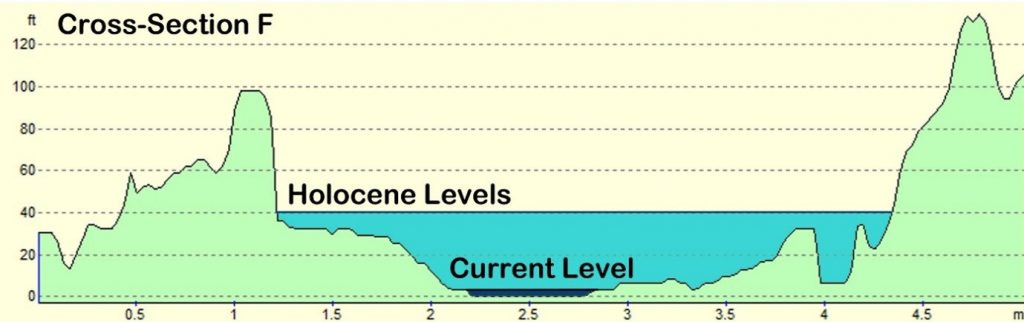
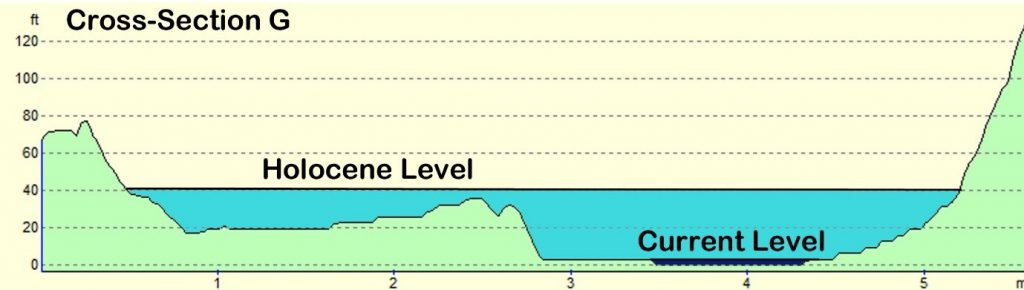
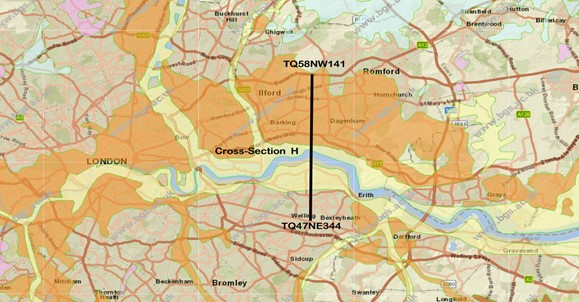
BGS Map of London showing in blue the Alluvium deposited at the end of the LGM. We have sectioned off A- G areas to look at their cross-sections.
(The Thames through time)
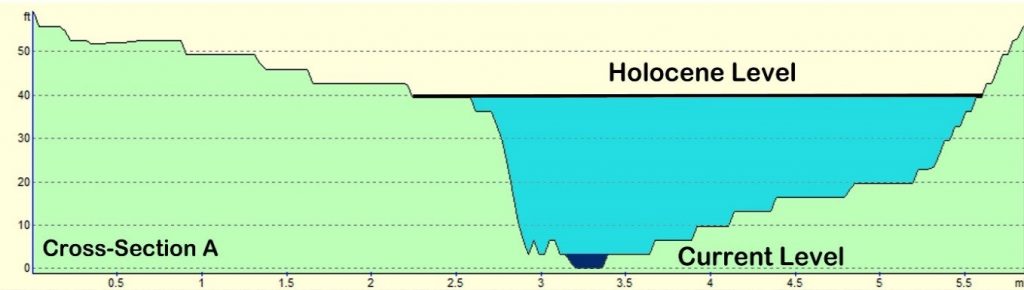
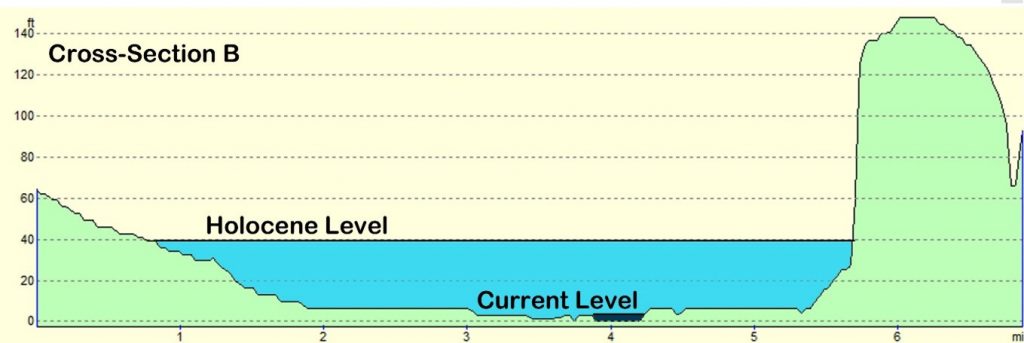
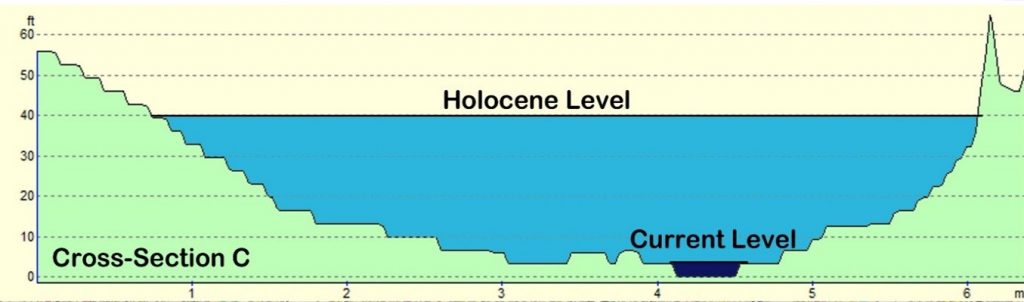
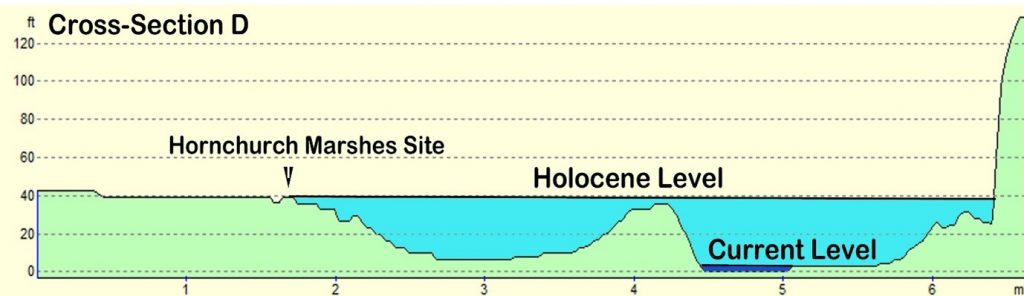
If we section off (A to G) the Thames and look at the volume and width of the Holocene Thames in comparison to today, we can get an estimation of the discharge of water at its peak during this period.
The current average discharge is 65.8 m³/s; therefore, with a 3723% increase in the watershed area, we can estimate that, at its peak, the Thames River discharged 2450 m³/s (0.0025 Gt/s or 1314 Gt per annum).
About the same rate of one of the smaller rivers ‘Susquehanna/Chesapeake River’ (Table 5) in North America – which is minor, in comparison to the eight North American river discharge ratios, which begs the question as the Thames is the largest river in the country, would it not be affected mostly by the meltwater at the end of the last ice age – so, have the scientists got the extent of the alluvium flooding correct?
To investigate further, we need to examine a detailed excavation at the edge of the BGS superficial Alluvium flood map to obtain real evidence of dates and clues about which sediments are present, compared with the ages suggested in past publications.
‘Holocene environmental changes in the Lower Thames Valley’ (Branch et al.,2012) excavated parts of Hornchurch marsh at the edge of the BSG alluvium deposit (Cross-Section D).
The paper suggests that “Palaeoenvironmental data (publicly or in the form of commercial archaeological reports) on these near-surface sediments indicate that following the end of the last glaciation, the lower reaches of the Thames Valley and its tributaries were inundated by the sea, and marine and estuarine sediments accumulated. Since that time, the evidence suggests that sea level continued to rise at a much slower rate as a response to either glacio-eustatic or sedimentary processes”. But the idea of any recent “inundation by the sea” can now be easily rebuked.
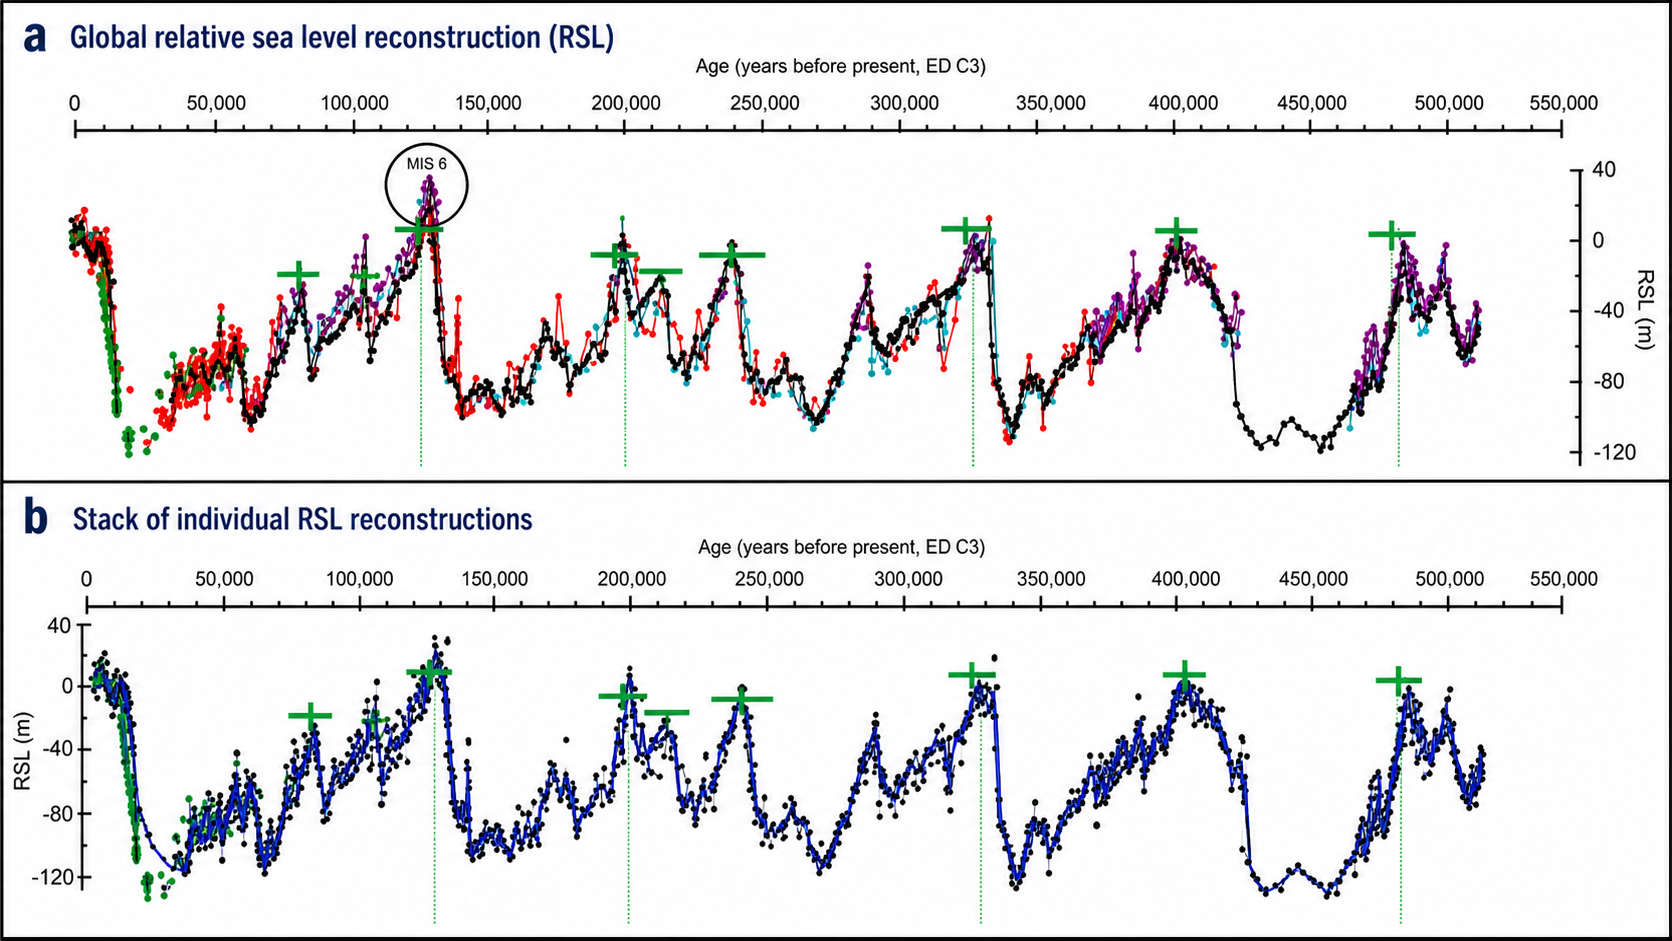
The reason for this incorrect interpretation of sediments was that past Geologists believed that the LGM was much smaller than previous ice ages – this has now been disproved by new research at sea level data from the Mediterranean (Rohling et al., 2017) as they could only measure by observation the extent of the ice sheets on the surface of the landmass and took for granted the greater the area, the larger the ice mass by estimation.
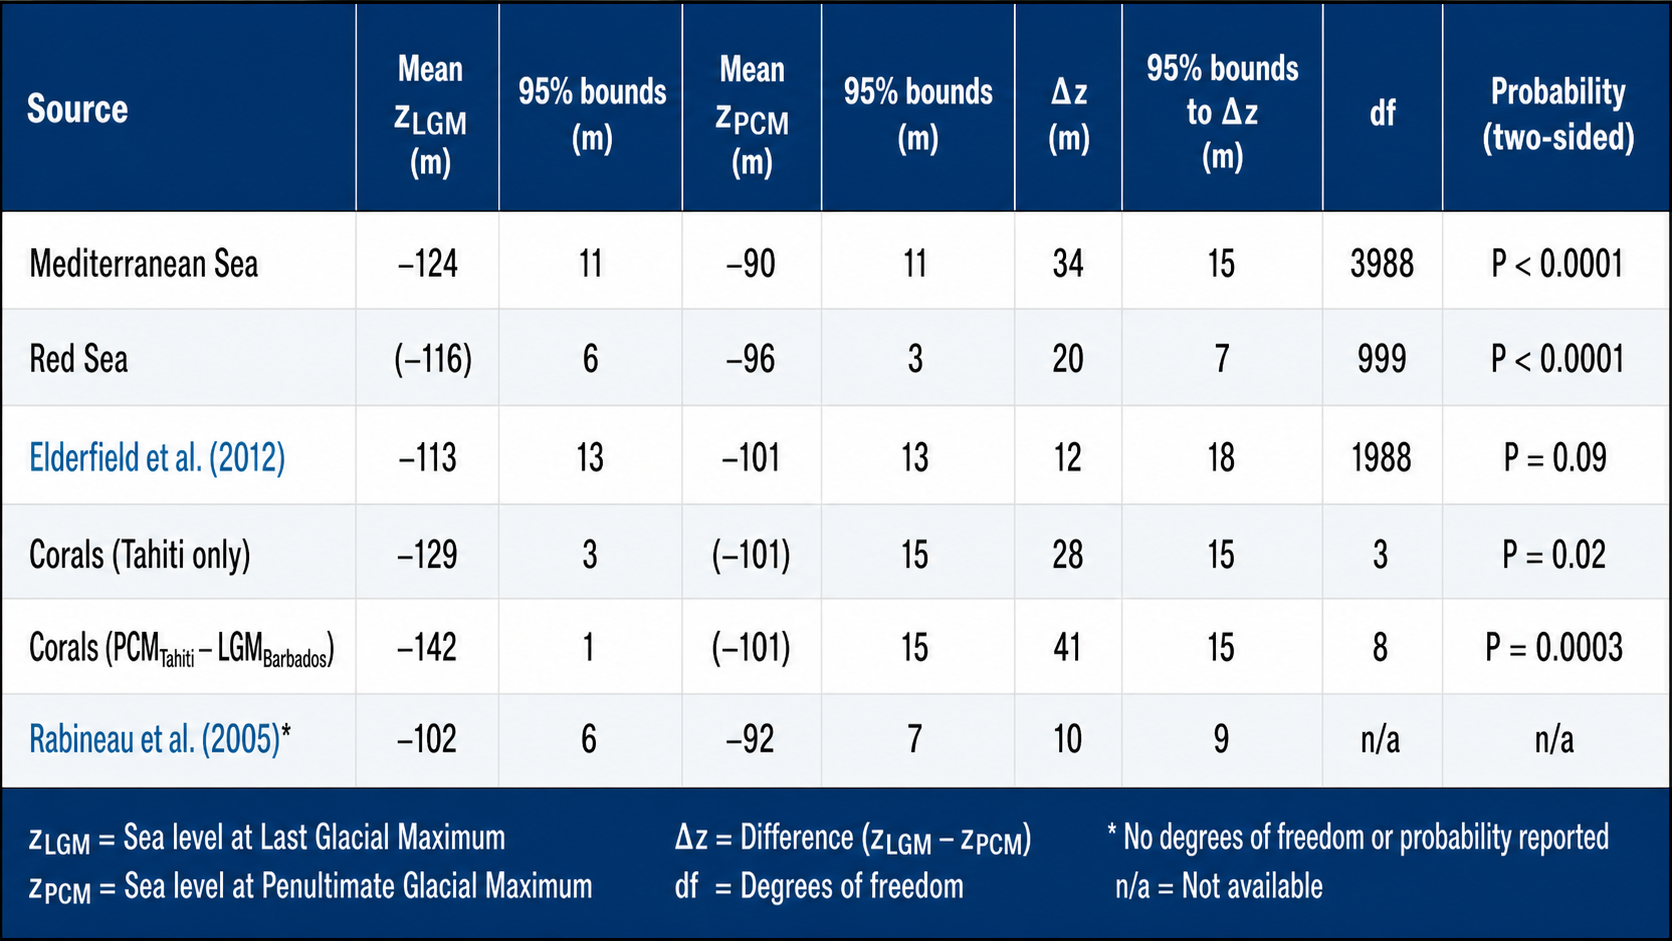
The conclusion of this study is to show that the last Ice Age was far more significant than previously thought (PCM) as illustrated below in Table 6 and Fig. 30)
Table 6 – (Rohling et al., 20170 Comparison of LGM v PGM by sea-level difference
(Rohling et al.,2009) sea levels over the last 500k years – notice that they are either equivalent or smaller than the LGM
(The Thames through time)
🔍 Validating the 40 Metre Flood Model: A Conservative Benchmark with Room for Expansion
Recent analysis of Thames River terrace data, combined with marine isotope stages (MIS) and global sea-level reconstructions, has confirmed that the highest river terrace associated with the Anglian glaciation (MIS 12) reaches elevations of up to 45–50 metres above the present-day floodplain. These terraces are preserved in locations such as Wimbledon Common, Islington, Dartford Heath, and around the Goring Gap and represent the earliest and most substantial fluvial deposits in the Thames Valley. Their considerable height corresponds with what is now understood to be the largest ice volume of the last 500,000 years, when sea levels were more than 130 metres below modern levels.
In contrast, our working model for reconstructing prehistoric Thames hydrology assumes a maximum flood level of 40 metres above modern—a figure chosen deliberately to provide a conservative and defensible baseline. This height has been used to calculate post-glacial meltwater volume, floodplain extent, and terrace formation through time. Although lower than the peak terrace cuts, 40 metres accurately reflects the likely active flood height during the most extreme meltwater episodes, accounting for factors such as sediment infill, compaction, and subsequent erosion that would have reshaped the original floodplain surface.
Sea level minimum equals Ice On land, and hence the River sizes after it melts – (Case Study – River Thames)
That said, the confirmation of higher terrace cuts opens the door for revising the volume model upwards. If we were to use the 45–50 metre elevation as our baseline for MIS 12, the resulting model would show a 12.5% to 25% increase in total flood volume compared to the current 40 metre assumption. This adjustment could significantly strengthen the case for post-glacial aquifer discharge and explain the massive sediment loads and geomorphic features observed downstream. However, such a shift would require recalibration of all terrace heights and their correlation with glacial episodes, which, while feasible, may introduce new assumptions and reduce the clarity of the proportional model.
In conclusion, the existing 40 metre model remains sound—anchored in observable data and consistent with LiDAR-documented terrace formations. Nevertheless, this model should be viewed as a minimum estimate of post-glacial river height and volume. Future work could explore enhanced modelling scenarios using 45–50-metre benchmarks to test the upper limits of Thames flooding during MIS 12. Such refinements would not undermine the current hypothesis but rather strengthen the argument that prehistoric Britain experienced hydrological conditions far more dynamic and extreme than currently acknowledged in traditional archaeological and geological narratives.
📊 Table: Sea-Level Minima and Estimated River Terrace Heights by Glacial Cycle
Glacial Period
Marine Isotope Stage (MIS)
Approx. Date (ka)
Sea-Level Minimum (m below present)
% of Maximum Ice Volume
Estimated Thames Terrace Height (if MIS 12 = 45 m)
Fifth Glacial (Anglian)
MIS 12
~480 – 430
–130 m
100%
45 m
Penultimate Glacial
MIS 6
~190 – 135
–125 m
96.2%
43.3 m
Last Glacial Maximum
MIS 2
~26 – 19
–120 m
92.3%
41.5 m
Third Glacial
MIS 8
~300 – 245
–105 m
80.8%
36.4 m
Fourth Glacial
MIS 10
~360 – 335
–120 m
92.3%
41.5 m
📚 References
Grant, K.M. et al. (2014). Sea-level variability over five glacial cycles. Nature Communications, 5, 5076. DOI: 10.1038/ncomms6076
Rohling, E.J. et al. (2009). Relative sea-level and climate change over the past 500,000 years. Quaternary Science Reviews, 28(17–18), 1537–1552. DOI: 10.1016/j.quascirev.2009.02.026
British Geological Survey. (n.d.). Quaternary deposits and river terraces of the Thames Valley. Earthwise: The BGS Open Geoscience knowledge base. earthwise.bgs.ac.uk
Dated Geology
This new information has created a problem for Geologists, as their sequences were based on the assumption of more significant ice caps, and consequently, meltwater deposits prior to the last ice age formed the foundations of our geological river terracing.
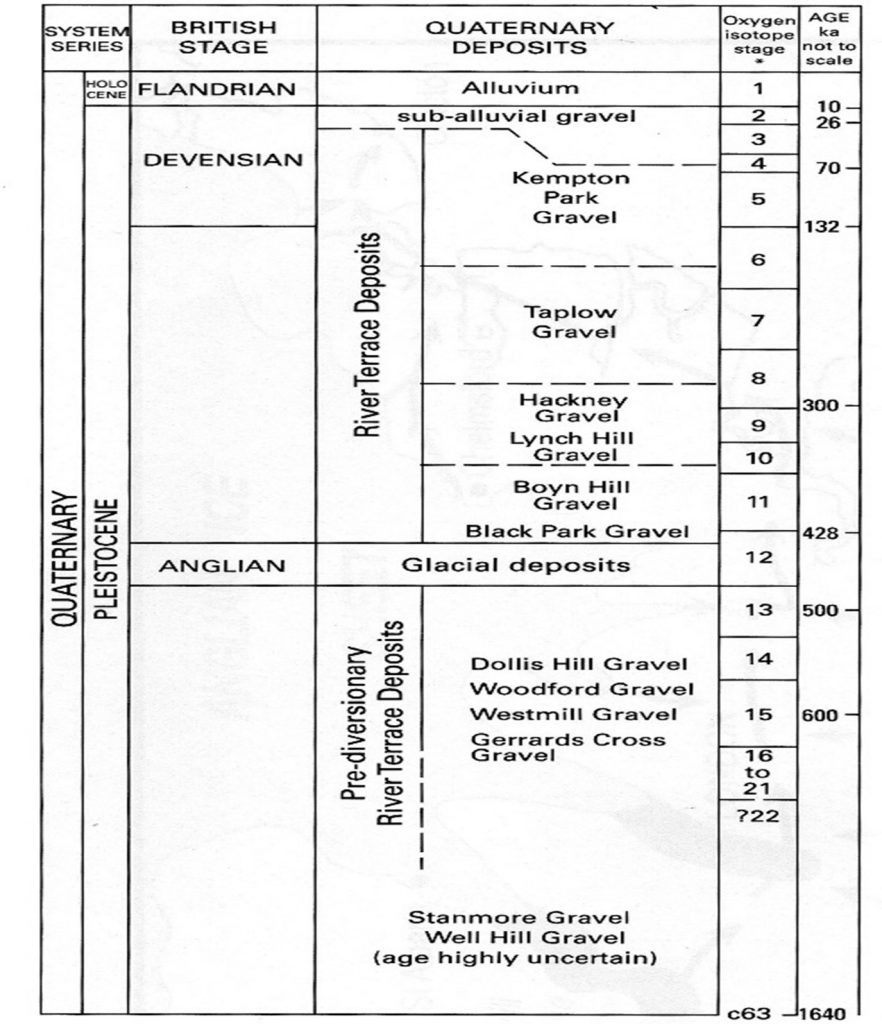
According to previous publications, only ‘Alluvium’ OIS 1 was laid down on the landscape (as at our Case Study site in the Thames Valley) directly after the last Ice Age, 10k years ago. But there is no evidence that that is true or that the larger rivers would not have washed the previous deposits further down the stream, making these sequences incorrect; consequently, the ‘River Terrace’ Deposits of:
Kempton Park – Taplow – Hackney – Lynch Hill – Boyn Hill and Black Park are Holocene in origin (or a mixture) and not solely Late Pleistocene as suggested in Geology books. In practical terms, when we examine boreholes, we should look for the ‘floodplain Terrance’ to indicate the extent of Holocene flooding and ignore the guestimations of gravel deposits.
Figure 31. Traditionally expressed river terrace deposits by ‘guesstimated’ age
(The Thames through time)
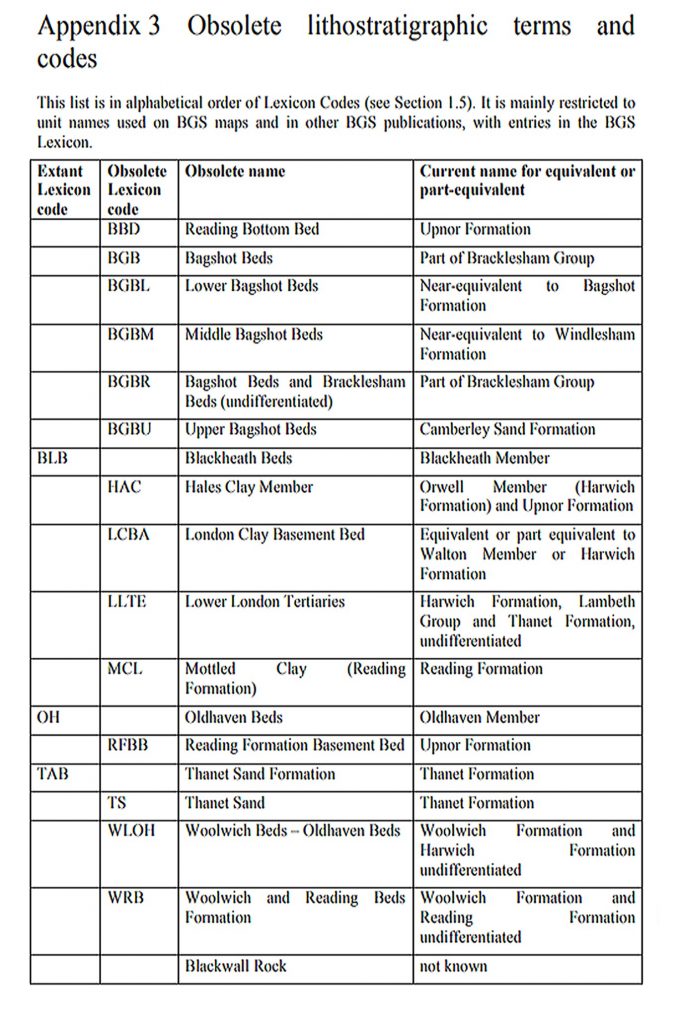
This ambiguity is, in fact, pointed out in BGS’s –‘The stratigraphical framework for the Palaeogene successions of the London Basin, the U.K. where it states that “In some areas, notably the north-eastern part of the London Basin, it has proved difficult to subdivide the strata between the Chalk and the London Clay with confidence” and this view is commonplace through the history of British Geology and hence the constant reclassification as shown in their obsolete terms table.
Figure 32. Obsolete terms are a common occurrence in Geology as modern new methods are incorporated. BGS Superficial Deposits Handbook.
(The Thames through time)
This assumption is also highlighted by Lewin et al. (2005), who state –
“Furthermore, their assumption that floodplain gravels were Pleistocene in age was not supported by dating, and work both on the Thames (Robinson, 1992, Fig. 19.2) and more widely elsewhere (Brown et al., 1994) tends to suggest that late dates for overbank sedimentation may generally be constrained by the fact that the gravels beneath are themselves often of considerably later date than was earlier assumed.”
And concluded with “Overall, the skewed distributions suggest rapid autogenic recycling of older materials, with earlier deposits only being preserved beyond the reach of river activity (e.g. in terraces or floodplains which have not been impinged on by later river migration). The exceptions to this are floodplain environments where localised long-term aggradation has permitted the greater preservation of older Holocene units. To obtain evidence from parts of the Holocene that remain less well known, such sites still require discovery and study, whilst commonplace deposits (notably floodplain gravels) would benefit from the application of dating techniques that are less dependent on the fortuity’s preservation of datable organic materials”.
When we look at Palaeolithic sites on a regional scale, such as in the Thames basin, several general problems become apparent. The first is correlation and chronology. By their very nature, terrace fragments may not be unequivocally traceable down a river system. Ideally, a combination of surveying, stratigraphic description and lithological analysis is required to correlate fragments with key sites where more than one formation is present. None of these methods alone can be relied upon; for example, the same lithological content does not necessarily imply time equivalence, especially where rivers are reworking previous gravel terraces. (Brown et al., 1997)
Until the 1950s, archaeology dated the geology, but it is now increasingly the other way around. From the nineteenth century onwards, the traditional chronology of Northern European Pleistocene terraces was based on a combination of hand-axe typology, stratigraphy and counting climatic episodes back in time or from the top of the sequence down. This methodology was based on the belief that axe typology followed a clear progression from what we perceive as crude or simple to elegant or sophisticated, and that this progression occurred at roughly the same rate across different places. This was allied to the belief that a typology represented a ‘culture’.
Chronology
This chronology and methodology have been questioned for a variety of reasons (Green and McGregor, 1980). First, the traditional chronology was at odds with revised Pleistocene chronologies from ocean cores and from new terrestrial sites in North-West Europe, which showed an extremely complex picture of glacial, interglacial, stadial and interstadial stages. The ocean cores, for example, show at least 30 warm/cold cycles, and the terrestrial record has improved through the discovery of more sites and new chronometric dating techniques (Lowe and Walker, 1984; Jones and Keen, 1993).
However, the terrestrial record in Britain still shows major discontinuities in comparison with the ocean record and the much more detailed chronologies from the Netherlands and Germany. A chronology, and it must be noted that there is considerable debate and uncertainty about not only the position of major British stratigraphic units but also the number of pre-Pastonian and post-Hoxnian-pre-Ipswichian climatic cycles present in the British record (Jones and Keen, 1993).
Moreover, given that the river gravel sequences are ‘problematical’, we can now revisit the Holocene ‘Alluvium’ map to see whether the boundaries of the Holocene Thames were even more significant than those shown in the original BGS map.
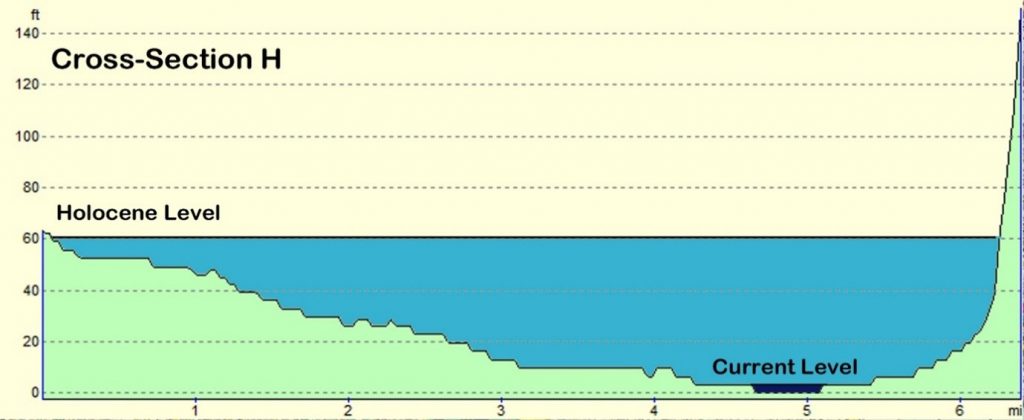
If we look at the Cross-Section H profile, we see that the area of the Holocene effect increases by at least one mile and is terminated by Boreholes TQ47NE344 and TQ58NW141.
Figure 34. Cross-Section H
(The Thames through time)
BGS map of ‘superficial’ deposits left by the last LGM with cross-section H and the two boreholes (borehole details in Appendix A)
(The Thames through time)
Borehole TQ47NE344 – shows 5.95m of “Brown Silty Sand” before hitting Chalk and TQ58NW141 4.42m of “Loamy Sand and Stones” with a base of “sand and Gravel”.
This increases the Thames Flood Model from a discharge of 2,450 m3/s to 12,250 m3/s, which more accurately reflects the North American Discharge Model.
If we take this new model into account, the Thames valley will look very different to today, with all of the ‘superficial sediments’ being covered by water at the start of the Holocene period, 10 – 6 Ka.
How London probably looked just after the LGM, about 10,000 BCE, with as much water as land and most of it swampy.
(The Thames through time)
We can review the Hornchurch Marshes Paper (Branch et al., 2012) and examine the results to identify outcomes and possible related dates for our new Thames Valley flooding model.
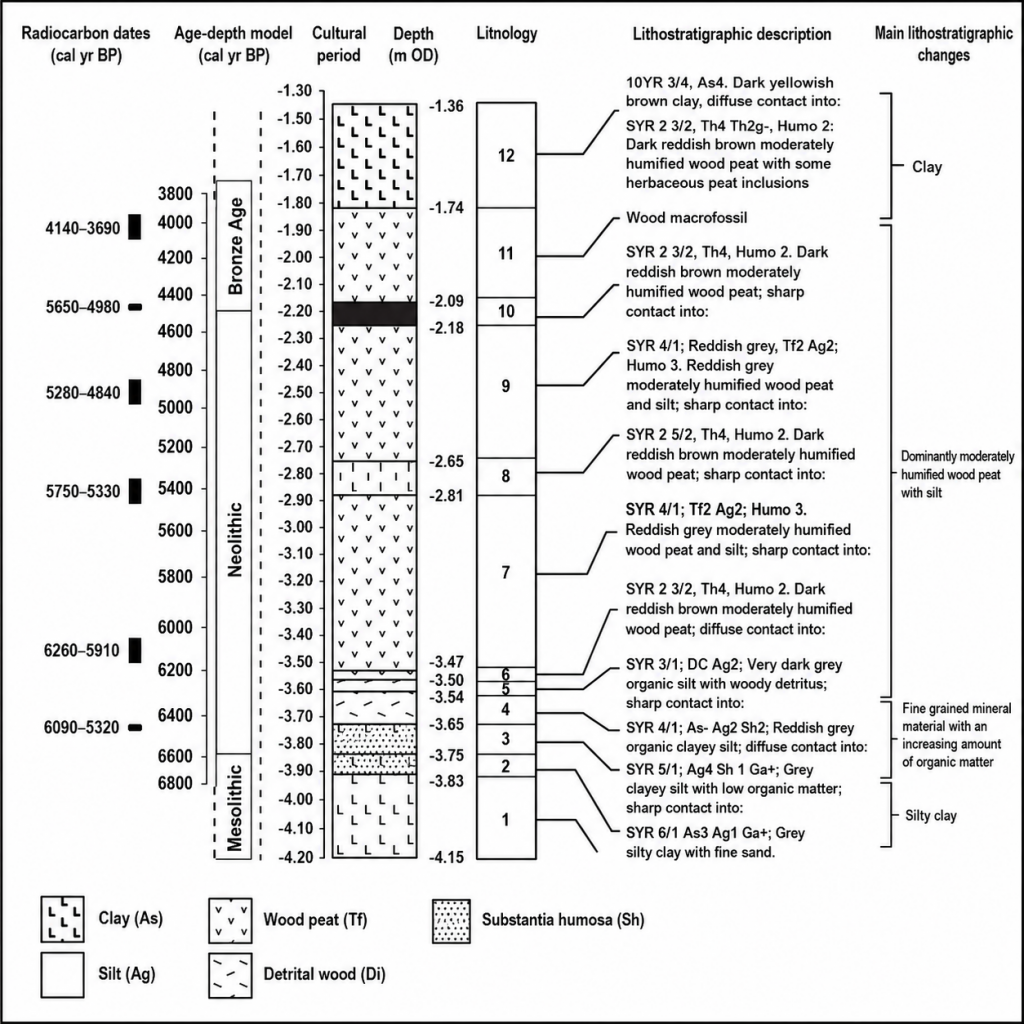
(Branch et al.,2012) Hornchurch marshes investigation
(The Thames through time)
The radiocarbon dates show that the site was inhabited during the early Holocene period “Between −4.15 and −3.83 m O.D., a clay-rich sedimentary unit was deposited probably on the margins of a river channel (floodplain)” This would give us an idea of how much sediment was deposited by the river during the early Holocene, directly after the last ice age. If we look at boreholes around this site and within a few hundred metres of it, those bored lower, we can develop a working hypothesis.
Borehole TQ58SW:1 – the closest to the site (Appendix A) shows the sand and pebbles go down another 12.8m until it reaches “Coloured Sands and Stones”, whilst Borehole TQ58SW762 shows the names of many more segments, including ‘terrace gravel’ that goes down to 12.2m below the surface – which confirms our Holocene water level set at 40′ or 12.2m.
Between −3.54 m O.D. and −1.74 m O.D., the formation of wood peat represents the creation of more terrestrial conditions at the site. The results of the radiocarbon dating indicate that peat formation commenced at c. 6300 cal. Yr B.P. and ceased at c. 3900 cal. Yr B.P. with the onset of estuarine sedimentation.
Closer inspection of the Lithostratigraphic descriptions and Lithology reveals that the site suffered possible flooding about 6800 yr B.P. as silt deposits are found in unit number 2&3 (Figure 36.) after over 3000 years of flooding since the end of the last ice age and a build-up of ‘Grey Silty Clay and fine sand’ as would be expected.
There is then a sequence of peat (an accumulation of partially decayed vegetation or organic matter. It is unique to natural areas called peatlands, bogs, mires, moors, or muskegs) growth as this become a marsh area because of the Holocene flooding as is a majority of Britain (as we have seen in Fig. 25). This marshland lasted for 1200 – 1600 years (Unit number 4 -7, figure 36.).
Then there seems to be a flood period of about 200 years during which the area was inundated with a deposit of Sand and clay, replacing the marshland peat, dated 5750 – 5330 cal yr B.P. We then see another 1500 years as a marshland, with new peat samples, before another river flood at 3800 BP. The carbon dating of this site provides the evidence we require to finally prove that rivers were not only higher in the Holocene/Mesolithic period, but also remained high to such an extent that they periodically flooded into recent history, as we will now further illustrate.
NB. Extract from the Book ‘Post-Glacial Flooding Hypothesis’
PODCAST
Author’s Biography
Robert John Langdon, a polymathic luminary, emerges as a writer, historian, and eminent specialist in LiDAR Landscape Archaeology.
His intellectual voyage has been interwoven with stints as an astute scrutineer in government and grand corporate bastions, a tapestry spanning British Telecommunications, Cable and Wireless, British Gas, and the esteemed University of London.
A decade hence, Robert’s transition into retirement unfurled a chapter of insatiable curiosity. This phase saw him immerse himself in Politics, Archaeology, Philosophy, and the enigmatic realm of Quantum Mechanics. His academic odyssey traversed the venerable corridors of knowledge hubs such as the Museum of London, University College London, Birkbeck College, The City Literature Institute, and Chichester University.
In the symphony of his life, Robert is a custodian of three progeny and a pair of cherished grandchildren. His sanctuary lies ensconced in the embrace of West Wales, where he inhabits an isolated cottage, its windows framing a vista of the boundless sea – a retreat from the scrutinising gaze of Her Majesty’s Revenue and Customs, an amiable clandestinity in the lap of nature.
Exploring Prehistoric Britain: A Journey Through Time
My blog delves into the fascinating mysteries of prehistoric Britain, challenging conventional narratives and offering fresh perspectives grounded in cutting-edge research, particularly LiDAR technology. I invite you to explore some key areas of my research. For example, the Wansdyke, often cited as a defensive structure, is re-examined in light of new evidence. I’ve presented my findings in my blog post Wansdyke: A British Frontier Wall – ‘Debunked’, and a Wansdyke LiDAR Flyover video further visualises my conclusions.
My work also often challenges established archaeological dogma. I argue that many sites, such as Hambledon Hill, commonly identified as Iron Age hillforts, are not what they seem. My posts Lidar Investigation Hambledon Hill – NOT an ‘Iron Age Fort’ and Unmasking the “Iron Age Hillfort” Myth explore these ideas in detail and offer an alternative view. Similarly, sites like Cissbury Ring and White Sheet Camp receive re-evaluations based on LiDAR analysis in my posts “Lidar Investigation Cissbury Ring through time”and “Lidar Investigation White Sheet Camp,“ revealing fascinating insights into their true purpose. I have also examined South Cadbury Castle, often linked to the mythical Camelot56.
My research also extends to ancient water management, including the role of canals and other linear earthworks. I have discussed the true origins of Car Dyke in multiple posts, including Car Dyke – ABC News Podcast and Lidar Investigation Car Dyke – North Section, which suggest a Mesolithic origin 2357. I also explore the misidentification of Roman aqueducts, as seen in my posts on the Great Chesters (Roman) Aqueduct. My research has also been greatly informed by my post-glacial flooding hypothesis, which has helped explain landscape transformations over time. I have discussed this hypothesis in several posts, including AI now supports my Post-Glacial Flooding Hypothesis and Exploring Britain’s Flooded Past: A Personal Journey
For those interested in British Prehistory, visit www.prehistoric-britain.co.uk, a comprehensive resource featuring an extensive collection of archaeology articles, modern LiDAR investigations, and groundbreaking research. The site also includes insights and excerpts from the acclaimed Robert John Langdon Trilogy, a series of books that explore Britain during the Prehistoric period. Titles in the trilogy include The Stonehenge Enigma, Dawn of the Lost Civilisation, and The Post-Glacial Flooding Hypothesis, which offer compelling evidence of ancient landscapes shaped by post-glacial flooding.
To further explore these topics, Robert John Langdon has developed a dedicated YouTube channel featuring over 100 video documentaries and investigations that complement the trilogy. Notable discoveries and studies showcased on the channel include 13 Things that Don’t Make Sense in History and the revelation of Silbury Avenue – The Lost Stone Avenue, a rediscovered prehistoric feature at Avebury, Wiltshire.
In addition to his main works, Langdon has released a series of shorter, accessible publications, ideal for readers delving into specific topics. These include:
For active discussions and updates on the trilogy’s findings and recent LiDAR investigations, join our vibrant community on Facebook. Engage with like-minded enthusiasts by leaving a message or contributing to debates in our Facebook Group.
Whether through the books, the website, or interactive videos, we aim to provide a deeper understanding of Britain’s fascinating prehistoric past. We encourage you to explore these resources and uncover the mysteries of ancient landscapes through the lens of modern archaeology.
For more information, including chapter extracts and related publications, visit the Robert John Langdon Author Page. Dive into works such as The Stonehenge Enigma or Dawn of the Lost Civilisation, and explore cutting-edge theories that challenge traditional historical narratives.
Introduction — The Economic System No One Is Looking For
What if the biggest mistake in archaeology is not what it believes… but what it refuses to consider?
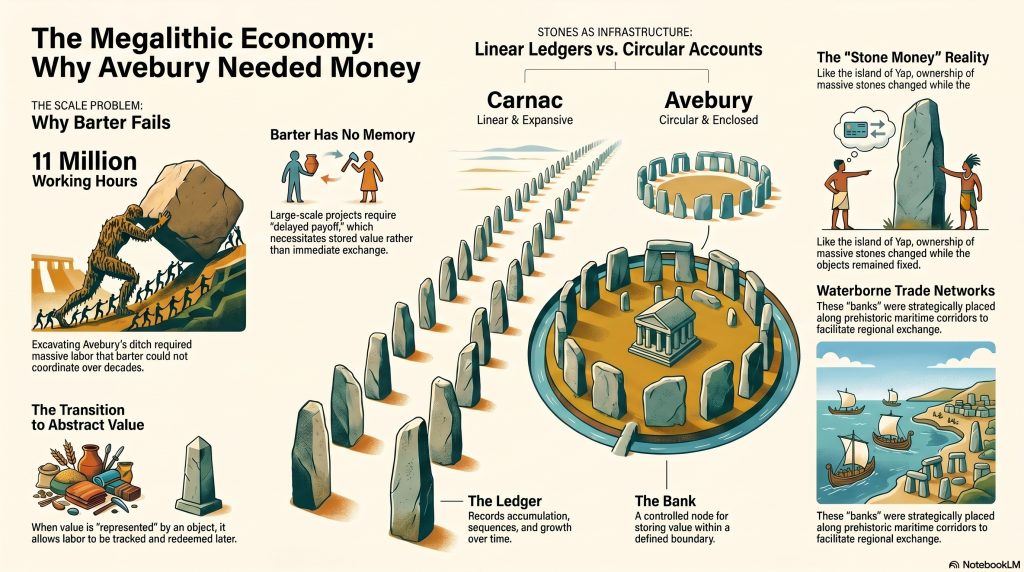
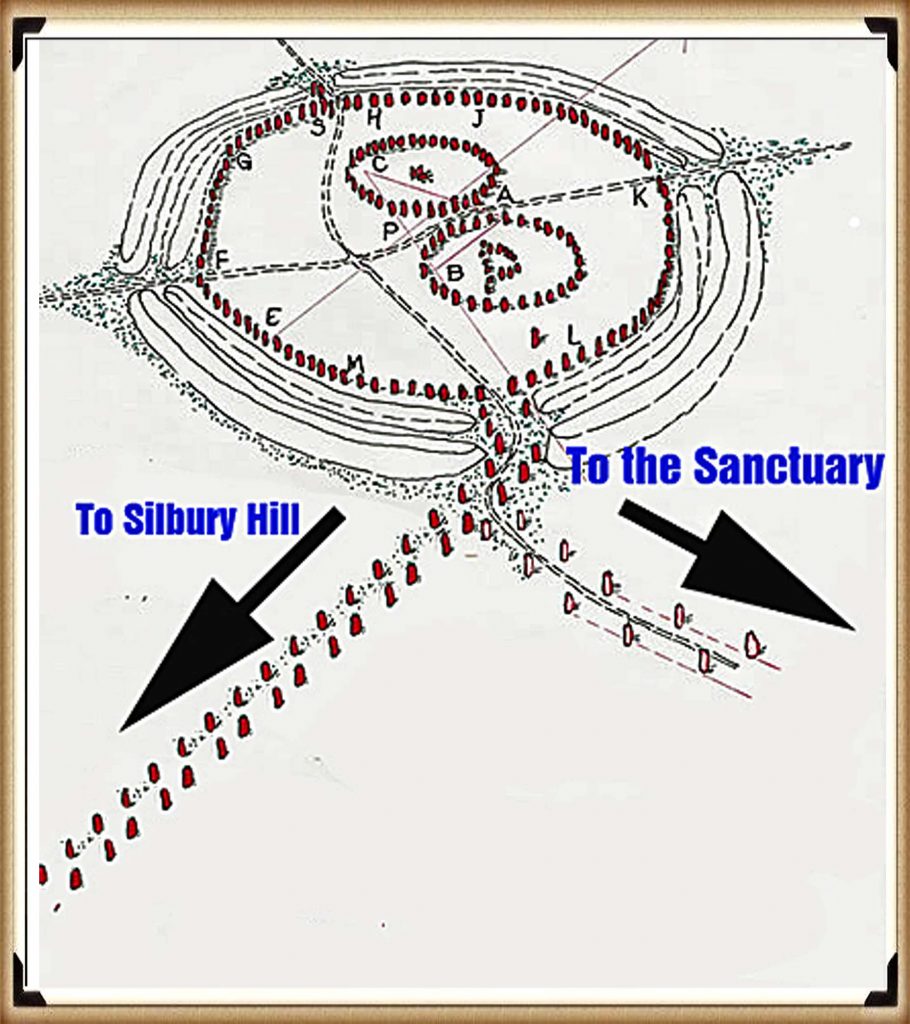
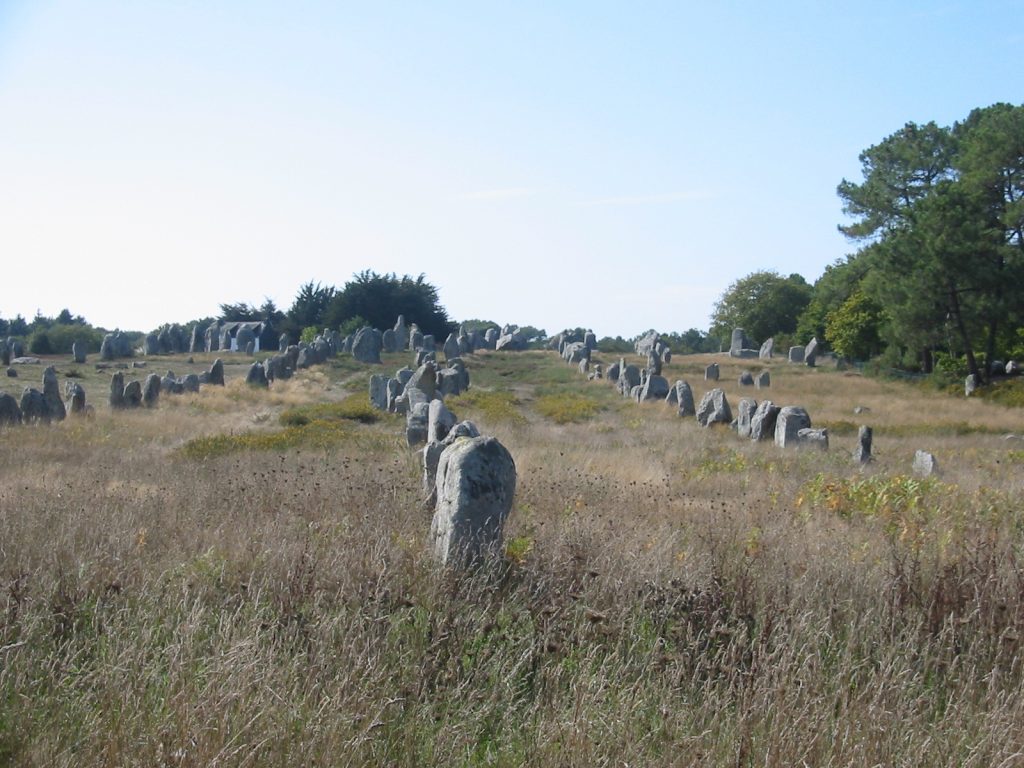
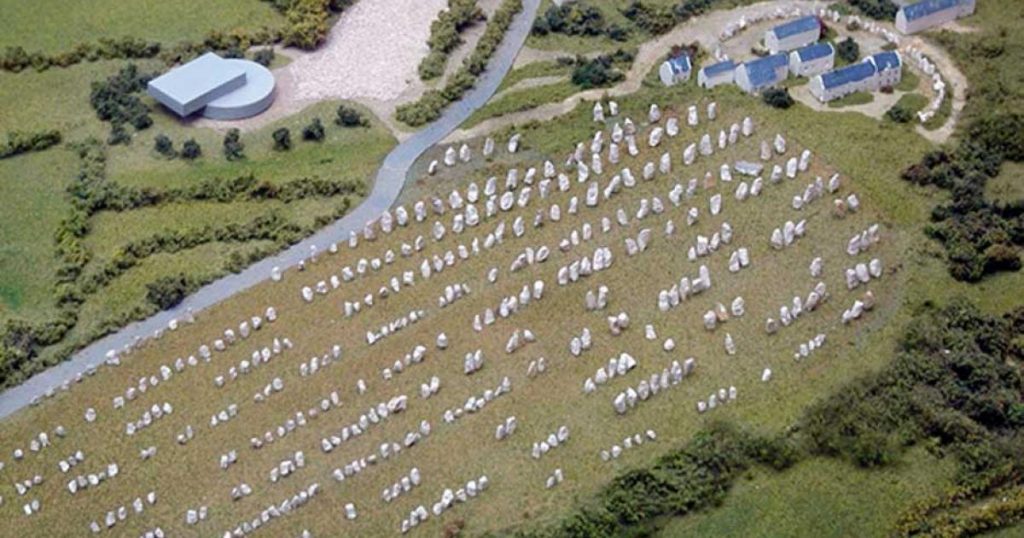
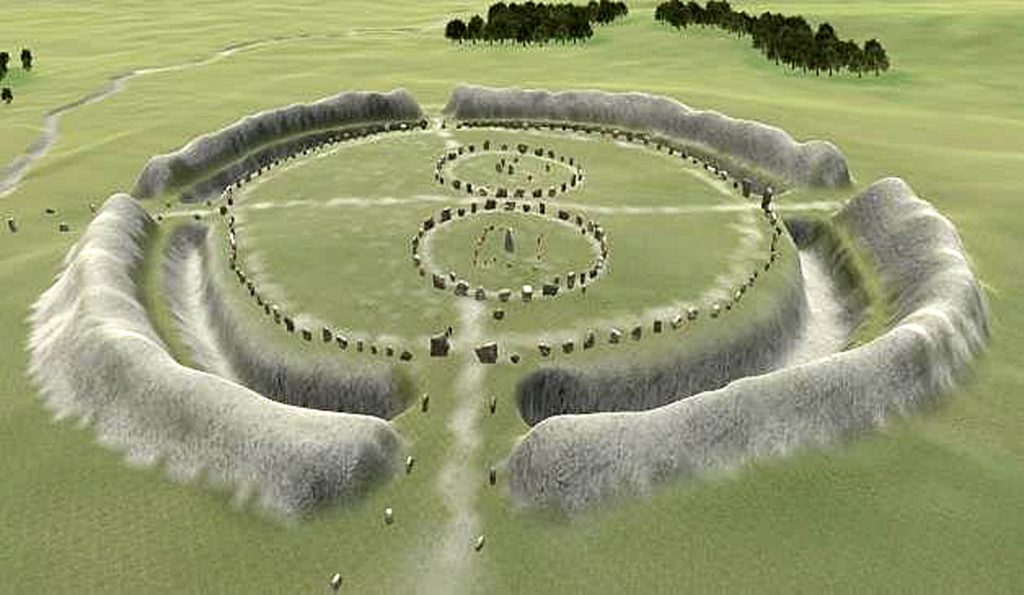
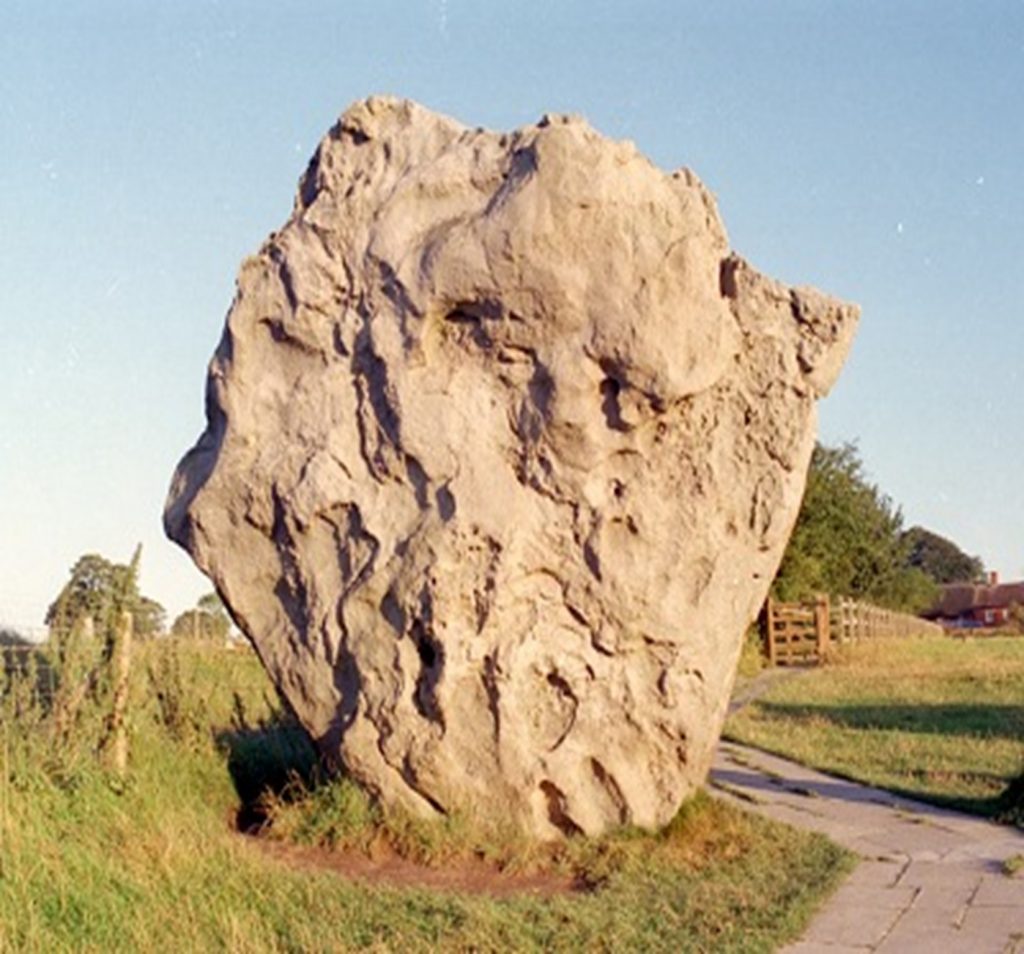
Across Britain and Western Europe, we find some of the largest construction projects ever undertaken by prehistoric societies. Sites like Avebury, with its vast ditch, towering stones, and monumental scale, required tens of millions of hours of coordinated labour. Further south, along the Atlantic façade, the immense stone fields of Carnac stones stretch for miles—thousands of stones arranged in deliberate, ordered sequences, on a scale that dwarfs anything found in Britain. (The Stone Money – Credit System)
And yet, for all this effort, one fundamental question is never asked:
What economic system made this possible?
(The Stone Money – Credit System)
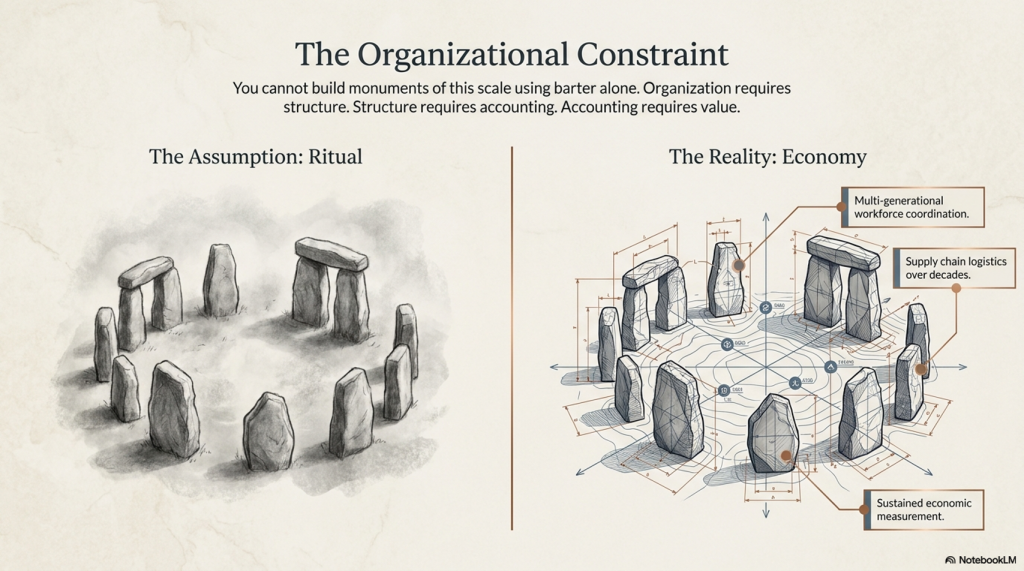
Instead, we are told these monuments are “ritual,” “ceremonial,” or “symbolic.” Words that describe—but do not explain. Because none of these interpretations addresses the single constraint that governs all large-scale human activity:
You cannot build monuments of this scale using barter alone. You cannot sustain a workforce of hundreds—let alone thousands—over decades without a system that stores, transfers, and measures value over time.
In other words:
You cannot build Avebury without money.
This blog explores a simple but deeply uncomfortable idea:
👉 The great stone monuments of prehistoric Europe were not just cultural or symbolic structures, but part of an economic system.
A system where value was not written on paper or struck in metal—but embedded in the landscape itself.
At first glance, the idea seems counterintuitive. Stone does not resemble currency—until you realise that modern money has no intrinsic value either. Its power comes from shared belief, collective recognition, and controlled scarcity. The same principles that underpin every functioning currency system today.
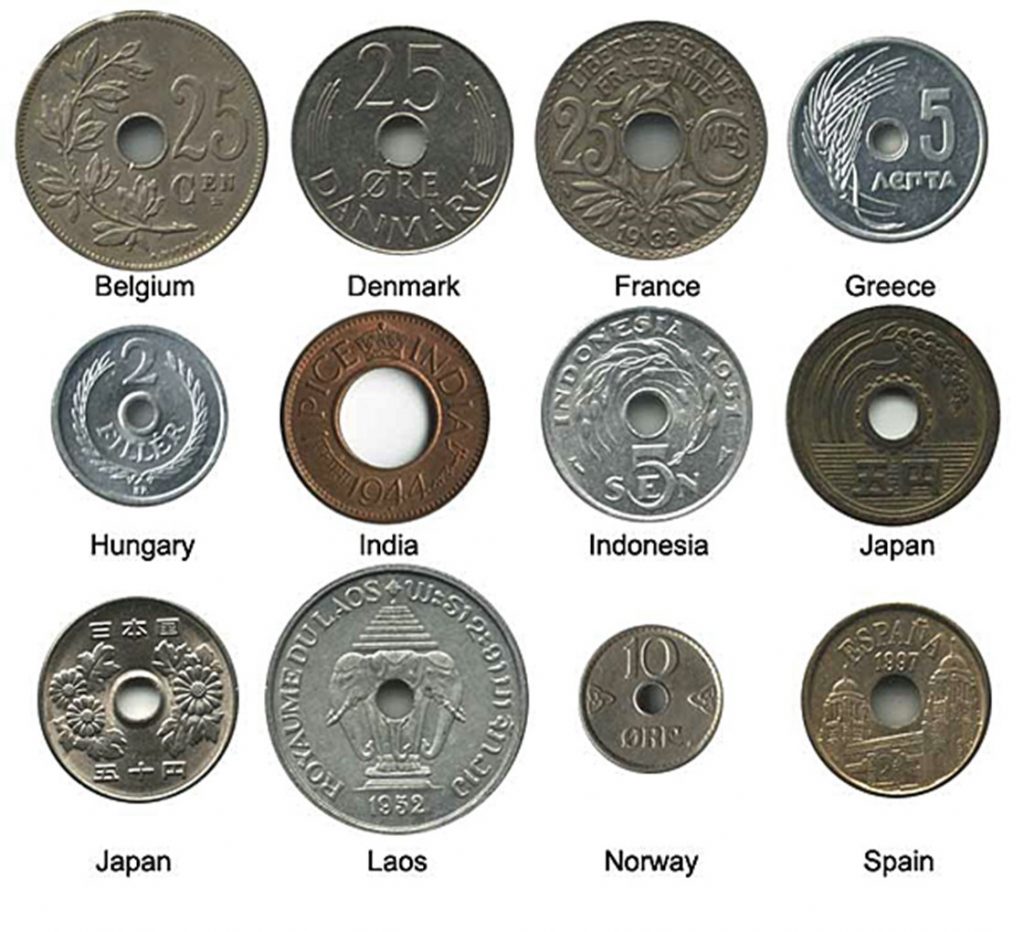
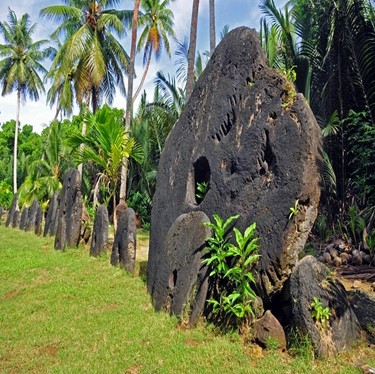
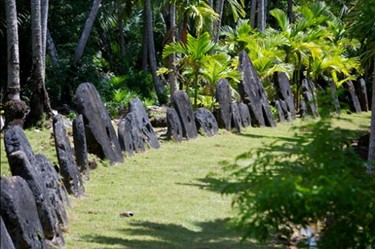
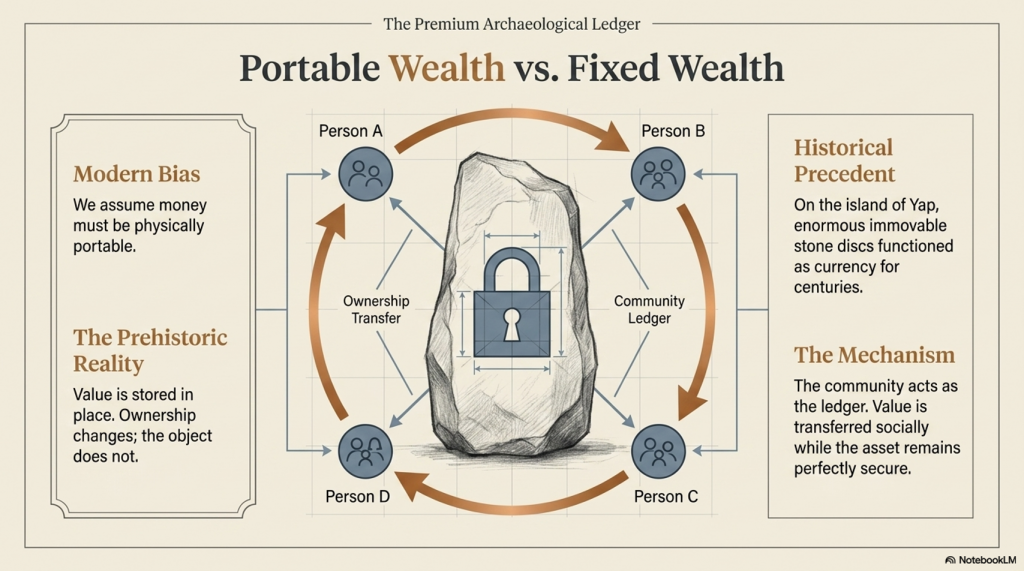
And crucially, we already know this type of system can exist. On the island of Yap, enormous stone discs functioned as currency for centuries—immovable, symbolic, and collectively understood. Ownership changed, but the stones themselves did not move.
So the question is no longer whether stone can function as money.
(The Stone Money – Credit System)
The question is:
👉 What happens when we apply that understanding to the prehistoric world?
Because when we do, something remarkable occurs.
Avebury stops looking like a ritual site.
Carnac stops looking like an anomaly.
And instead, both begin to resolve into something far more coherent:
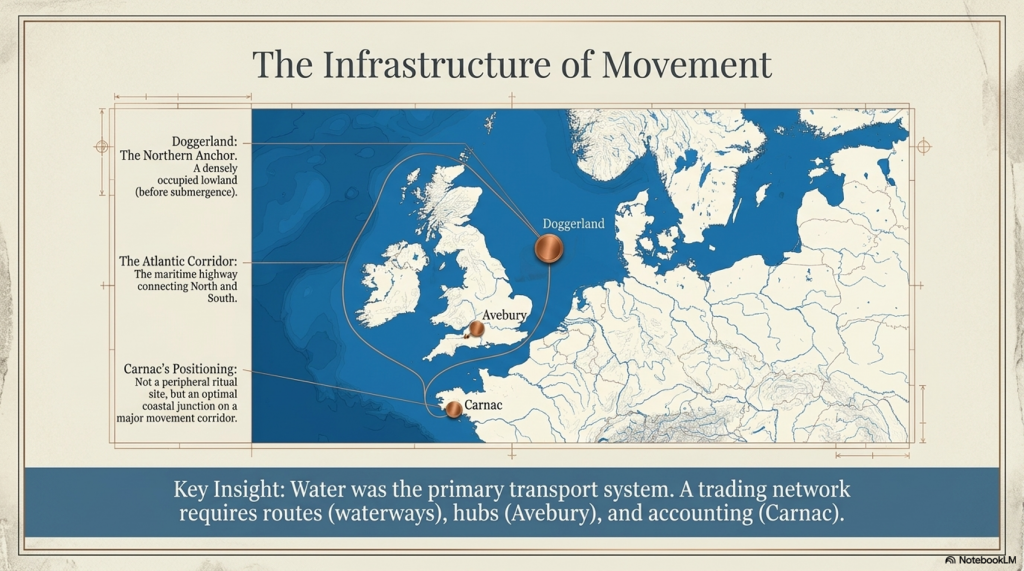
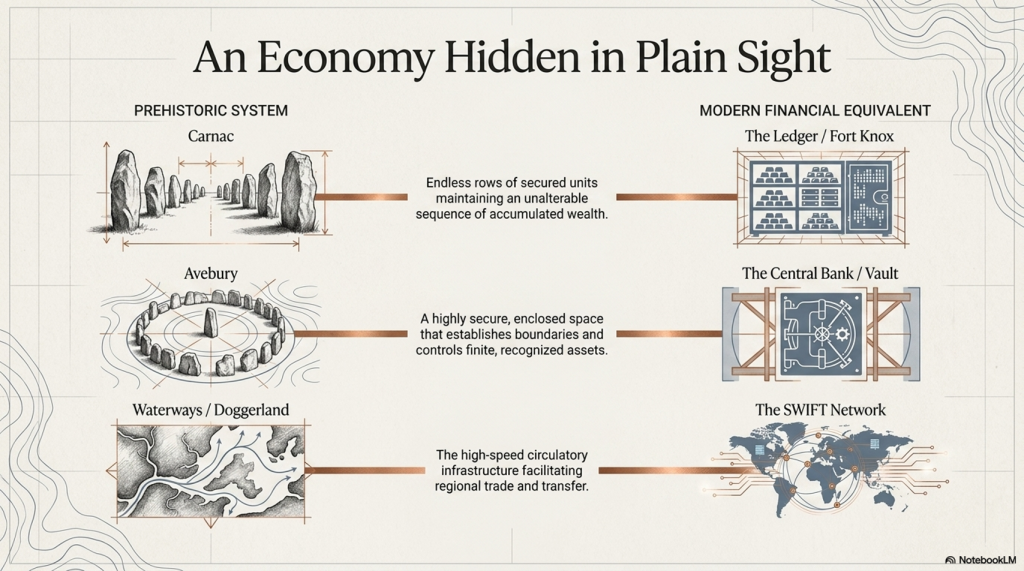
👉 A connected system of value, operating across a prehistoric trading network that once linked the Atlantic world—from Doggerland to the Mediterranean.
This is not speculation layered onto mystery.
It is a shift in perspective—from symbolism to function.
And once that shift is made, the stones stop being silent.
They start behaving like infrastructure.
(The Stone Money – Credit System)
2. The Scale Problem — Why Barter Fails
Before we decide what the stones represent, we need to establish something far more fundamental:
👉 What kind of system is required to build monuments at this scale?
Because once that constraint is defined, most existing explanations collapse immediately.
The Physical Reality of Construction
Take Avebury as a baseline.
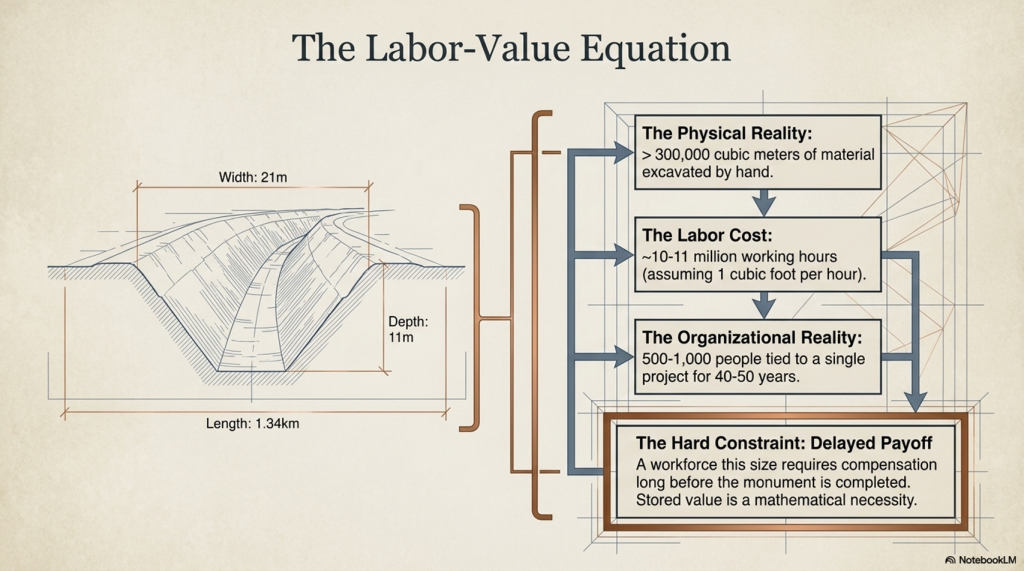
Ditch: ~1.34 km long
Width: ~21 metres
Depth: ~11 metres
That is over 300,000 cubic metres of material excavated by hand.
Even using conservative assumptions:
1 cubic foot per hour per worker
Continuous labour across seasons
You are looking at:
👉 ~10–11 million working hours
Which immediately raises a non-negotiable requirement:
👉 This is not a small, local effort 👉 This is a multi-generational, organised workforce
And that’s just the ditch.
It does not include:
Quarrying and transporting megaliths
Erecting stones weighing tens of tonnes
Feeding, housing, and supplying the workforce
Maintaining continuity over decades
The Organisational Constraint
At even a modest scale:
200 workers digging
200 supporting (food, tools, logistics)
Additional labour for stone movement
You are already dealing with:
👉 500–1000 people tied into a single long-term project
Now extend that over:
👉 40–50 years
This is not seasonal cooperation.
This is:
👉 sustained economic coordination
(The Stone Money – Credit System)
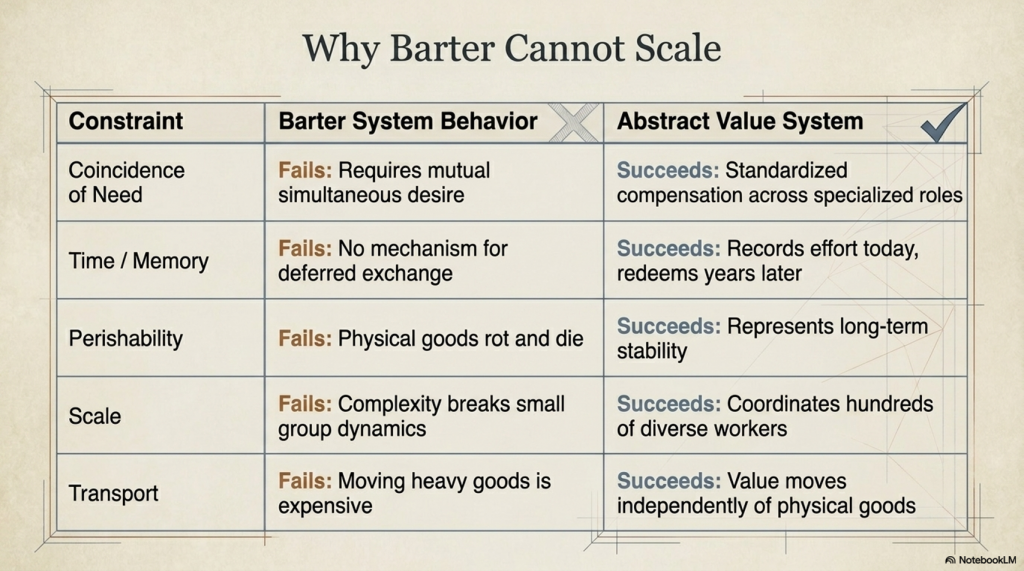
Why Barter Cannot Work at This Scale
Barter systems function under very specific conditions:
Small groups
Immediate exchange
Short timeframes
Low complexity
They fail when you introduce:
Delayed reward
Large workforce coordination
Multi-year commitments
Because barter has a fatal limitation:
👉 It requires coincidence of need
If one worker digs a ditch today, what do they receive?
Food? From whom?
Tools? When?
Shelter? For how long?
And more importantly:
👉 How is that value tracked over decades?
Barter has no memory.
It cannot store obligations. It cannot scale across time. It cannot coordinate hundreds of people toward a single goal.
The Time Problem — Labour Without Immediate Return
Large construction introduces a second constraint:
👉 Delayed payoff
The monument is not “used” until it is complete.
So the system must allow:
Work now
Reward later
Which requires:
👉 stored value
Not goods. Not promises.
But something that can:
represent labour
persist over time
be recognised by the entire community
The Inevitable Conclusion
Once you define the problem correctly, the solution is no longer optional.
To build monuments like Avebury, a society must have:
👉 A system that records value 👉 A system that transfers value 👉 A system that stores value across time
In other words:
👉 A currency system
Not necessarily coins. Not necessarily metal.
But something that performs the same function.
Extending the Problem Beyond Britain
Now expand the scale.
Sites like Carnac stones contain:
Thousands of stones
Arranged in ordered, repeatable sequences
Extending across kilometres of landscape
This is not just construction.
This is:
👉 systematic expansion over time
Which implies:
continuity
accounting
accumulation
And again, the same constraint applies:
👉 Barter cannot produce this.
(The Stone Money – Credit System)
3. The Failure of Barter Systems — Why Value Must Become Abstract
If barter cannot scale to build monuments, then the next step is obvious:
👉 Why exactly does it fail?
Because once that is understood in detail, the transition to a currency system stops being theoretical—and becomes inevitable.
The Coincidence Problem — The First Structural Failure
Barter depends on one fragile condition:
👉 Both parties must want what the other has, at the same time
This works in small, immediate exchanges:
Fish for grain
Tools for meat
But now apply that to a workforce building something like Avebury:
A digger works all day excavating chalk.
What do they receive?
Food? From whom specifically?
Clothing? At what interval?
Tools? In exchange for what exact quantity of labour?
Now multiply that across hundreds of workers.
👉 The system collapses instantly.
Because there is no mechanism to align:
labour
need
timing
Barter cannot coordinate complexity.
The Time Problem — Barter Has No Memory
Barter only works in the present.
It cannot do this:
Record effort today
Redeem value weeks, months, or years later
But monument construction introduces a hard constraint:
👉 Labour must be rewarded long after it is performed
If someone contributes:
10 days of labour
100 days of labour
10 years of labour
Where is that value stored?
Without storage, the system breaks.
Because:
👉 Work without delayed compensation is unsustainable
And barter has no mechanism for:
accumulation
tracking
deferred exchange
(The Stone Money – Credit System)
The Perishability Problem — Goods Cannot Store Value
Barter relies on real goods.
But real goods decay.
Food rots
Materials degrade
Livestock die
So even if value is exchanged, it cannot be preserved.
Which creates a contradiction:
👉 Large projects require long-term value stability 👉 Barter only provides short-term value exchange
This is not a minor inefficiency.
It is a structural impossibility.
The Scaling Problem — Complexity Breaks the System
Barter works in:
small groups
simple exchanges
short timeframes
It fails when you introduce:
large populations
specialised roles
long-term coordination
Now consider:
quarry workers
transport teams
tool makers
food producers
organisers
Each group contributes differently.
Each requires compensation differently.
Barter has no way to:
👉 standardise value across roles
Without standardisation:
👉 coordination fails
(The Stone Money – Credit System)
The Transport Problem — Value Must Move Without Goods
Now introduce trade.
Not local exchange—but regional movement.
Between sites like:
Avebury
Carnac stones
Goods are heavy. Transport is expensive. Distance introduces risk.
So a new requirement appears:
👉 Value must move independently of physical goods
Barter cannot do this.
Because barter is the goods.
The Critical Transition — From Goods to Representation
Once all these constraints are applied, a transition becomes unavoidable.
Value must:
exist independently of goods
be stored over time
be recognised by a community
be transferable without physical exchange
This is the moment where:
👉 value becomes abstract
Not imaginary—but represented
What “Abstract Value” Actually Means
This is often misunderstood.
Abstract value does not mean:
symbolic in a vague sense
decorative
ritual
It means:
👉 A physical object represents something else
Labour Ownership Obligation Debt
The object is not the value.
👉 It records the value.
The Inevitable Outcome
Once a society reaches:
large-scale construction
long-term coordination
regional trade
It must develop:
👉 a system of representation
Because nothing else satisfies all constraints simultaneously.
Where This Leads Next
At this point, we have not identified the system.
But we have defined exactly what it must do.
So the next question becomes:
👉 What form could such a system take in a prehistoric world?
No writing. No coinage. No formal accounting.
And yet—
👉 The same functional requirements still exist.
(The Stone Money – Credit System)
4. Currency Before Metal — The Logical Evolution of Value Systems
Once barter fails, a society does not suddenly invent coins.
That’s a modern assumption—and it’s wrong.
Currency does not begin with metal.
👉 It begins with representation
Breaking the Modern Bias
We instinctively associate money with:
coins
precious metals
minted value
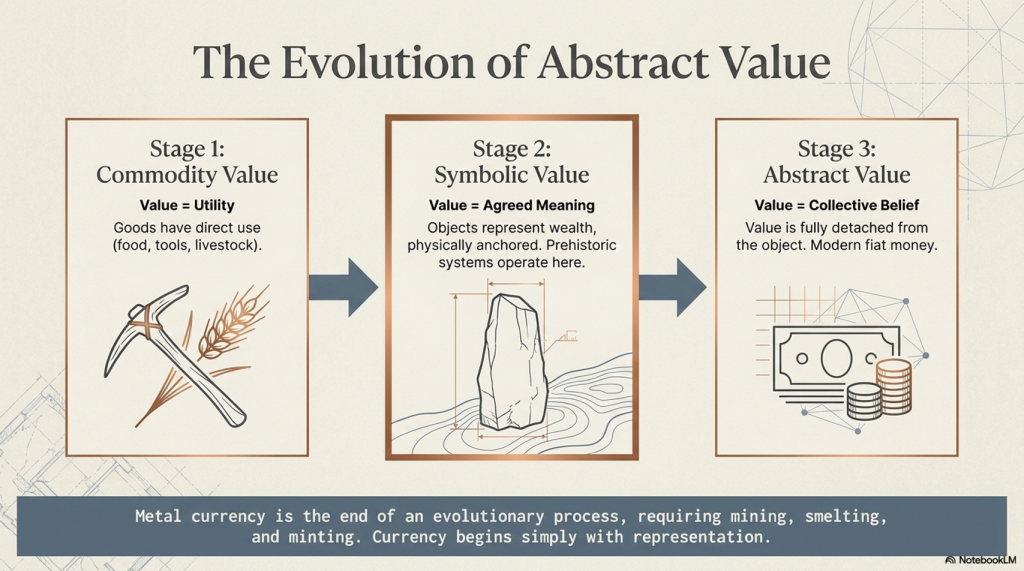
But this is the end of a long evolutionary process—not the beginning.
Because metal currency requires:
mining infrastructure
smelting technology
standardised production
controlled distribution
None of which is necessary for a functioning value system.
So the real question is not:
👉 “Where are the coins?”
But:
👉 “What did they use before coins were possible?”
The Three Stages of Value
All economic systems follow the same progression:
1. Commodity Value
Goods have direct use
Food, tools, livestock
👉 Value = utility
2. Symbolic Value
Objects represent wealth
Rare, durable, recognisable
👉 Value = agreed meaning
3. Abstract Value
Value becomes detached from the object
Trust replaces utility
👉 Value = collective belief
Modern money sits at Stage 3.
But prehistoric systems operate in Stage 2:
👉 Symbolic, but physically anchored
(The Stone Money – Credit System)
What Makes Something “Money”?
To function as currency, an object must satisfy four conditions:
Recognisable — everyone knows what it represents
Durable — it survives over time
Difficult to replicate — prevents inflation
Socially agreed — value is collectively accepted
Notice what is not required:
portability (large-scale systems don’t need it)
intrinsic value (gold is only valuable because we agree it is)
The Critical Insight — Value Is Not Real
This is the point most people resist.
A modern banknote:
is paper
has no intrinsic worth
Yet it can represent:
👉 a house 👉 a year of labour 👉 an entire business
Why?
👉 Because value is assigned—not inherent
This is known as:
👉 perceived value
And once you accept that—
The leap to prehistoric systems becomes straightforward.
Why Stone Fits the Model Perfectly
Now apply the four conditions:
Recognisable → large, visible, impossible to ignore
Durable → survives generations
Difficult to replicate → requires labour, transport, coordination
Socially agreed → embedded within a shared landscape
Stone is not a poor substitute for currency.
👉 It is an ideal early form of it.
Reframing the Question
Instead of asking:
👉 “Why build with stone?”
We should be asking:
👉 “What if stone was the system?”
Because once value becomes:
fixed
visible
communal
It no longer needs to be carried.
From Portable Wealth to Fixed Wealth
Modern systems emphasise portability:
coins
notes
digital transfers
But early systems prioritise:
👉 stability and verification
Which leads to a different model:
value is stored in place
ownership changes, not the object
community acts as the ledger
This is not primitive.
👉 It is structurally efficient at scale.
Extending the Logic to Monumental Landscapes
Now return to sites like:
Avebury
Carnac stones
Ask a different question:
👉 Why are the stones:
massive
permanent
publicly visible
arranged in ordered systems
These are not decorative choices.
They are exactly what you would expect from:
👉 a system designed to represent and stabilise value
(The Stone Money – Credit System)
5. The Yap System — Proof That Stone Can Be Money
At this point, a natural objection appears:
👉 “This all sounds logical—but has any society ever actually used stone as currency?”
The answer is not hypothetical.
👉 Yes. They have.
And not in small tokens—but in massive, immovable stones.
Yap — A Working Stone Currency System
On the Pacific island of Yap, a fully functioning economic system developed using what are known as rai stones:
Large, carved stone discs
Some over 3–4 metres in diameter
Weighing several tonnes
These were not symbolic ornaments.
👉 They were currency.
How the System Actually Worked
The key features of the Yap system are critical—because they directly mirror what we are trying to explain.
1. The Stones Do Not Move
Rai stones are typically:
placed in prominent locations
left in situ for generations
When ownership changes:
👉 The stone stays where it is
Only the ownership changes.
2. Ownership Is Socially Recorded
There are no written ledgers.
Instead:
👉 The community collectively knows:
who owns each stone
its history
the transactions associated with it
This creates a distributed system of verification.
👉 The people are the ledger.
(The Stone Money – Credit System)
3. Value Is Not Just Size — It Is History
A stone’s value depends on:
how large it is
where it came from
how difficult it was to transport
who previously owned it
For example:
👉 A smaller stone with a dangerous or prestigious history can be worth more than a larger, easily obtained one.
4. Effort Creates Value
To acquire these stones:
expeditions travelled long distances
stones were quarried on foreign islands
transported by raft across open ocean
Many expeditions failed.
Some people died.
👉 That risk and effort are what give the stone value.
The Critical Point
This system satisfies every requirement we defined earlier:
Recognisable → publicly visible stones
Durable → last for centuries
Difficult to replicate → high effort and risk
Socially agreed → community recognition
And crucially:
👉 Value is completely detached from utility
The stones are not tools. They are not consumed. They are not moved.
👉 They exist purely to represent value
The Most Important Insight — Movement Is Not Required
This is where modern thinking breaks down.
We assume money must:
be portable
be exchanged physically
But the Yap system proves otherwise:
👉 Ownership can move without the object moving
This is not primitive.
It is extremely efficient.
Because:
the object cannot be lost
it cannot be stolen easily
it cannot be counterfeited
Scaling the Concept
Now step back and think carefully.
If a small island society can operate:
👉 a fully functional economy 👉 using large, immovable stones 👉 with no written system
Then the idea that prehistoric Europe could do the same is no longer radical.
👉 It is expected under the same constraints
Bridging to the Prehistoric World
Now apply the same principles to:
Avebury
Carnac stones
Ask the same questions:
Are the stones immovable? → Yes
Are they publicly visible? → Yes
Do they require immense effort to create and place? → Yes
Would ownership need to be socially recognised? → Inevitably
At this point, the comparison is no longer loose.
👉 The systems are structurally identical.
(The Stone Money – Credit System)
6. Carnac — The Anomaly That Breaks Archaeology
If the stone money model is correct, then it should do something very specific:
👉 It should explain monuments that current archaeology cannot.
And there is no better test case than the vast alignments of Carnac stones.
The Scale of the Problem
Carnac is not just another stone site.
It is:
Thousands of standing stones
Arranged in long, ordered rows
Extending across kilometres of landscape
Constructed and expanded over time
This is not a circle. Not a monument. Not a single phase of activity.
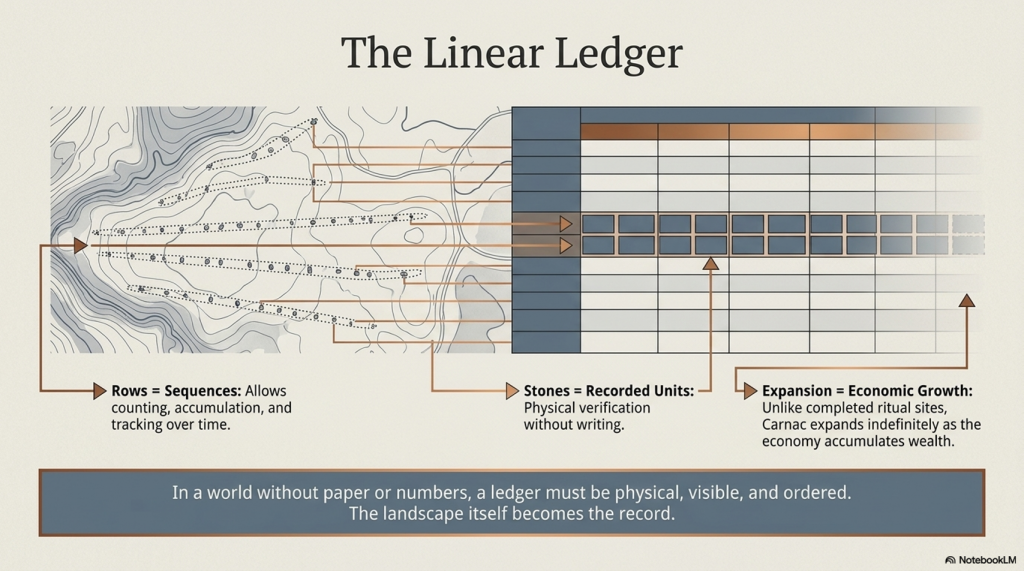
👉 It is a system.
And that is precisely the problem.
Why Existing Explanations Fail
Archaeology has offered the usual interpretations:
Ritual landscape
Ceremonial alignment
Astronomical significance
But each of these fails under basic scrutiny:
Ritual
Why thousands of stones?
Why structured expansion?
Why linear repetition instead of focal space?
Astronomy
No consistent, repeatable observational framework
No functional mechanism
No need for this scale or redundancy
Ceremony
No defined activity
No evidence of use matching the scale of construction
These explanations describe the site.
👉 They do not explain why it exists in this form
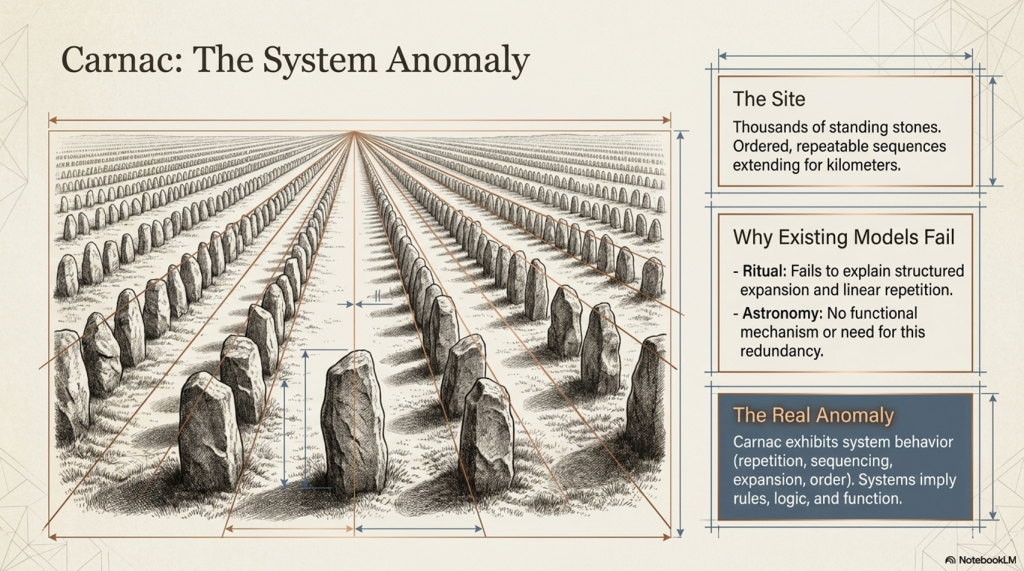
The Real Anomaly
The defining feature of Carnac is not just its size.
It is its structure:
Repetition
Sequencing
Expansion
Order
This is not symbolic randomness.
👉 It is system behaviour
And systems imply:
👉 rules 👉 logic 👉 function
Location — The Clue That Changes Everything
Now add the one factor that is consistently underplayed:
👉 Geography
Carnac sits:
On the Brittany coastline
With direct access to the Atlantic
At a natural maritime interface
This is not an isolated inland ritual site.
👉 It is positioned on one of the most accessible coastal zones in Western Europe.
Now extend that context:
North → Doggerland and the North Sea basin
West → Atlantic façade
South → Iberia and beyond
This is:
👉 a major prehistoric movement corridor
Reframing the Site
Now apply the same framework we used for the Yap system.
Ask different questions:
Why so many stones?
Why arranged in sequences?
Why extended over time?
Why located on a trade-accessible coastline?
Under ritual models, these questions have no clear answers.
Under a value system model:
👉 They become expected.
(The Stone Money – Credit System)
Carnac as a Linear System
Unlike Avebury, which is circular and centralised, Carnac is:
👉 linear and expansive
This is a crucial distinction.
Because a circular system suggests:
a node
a centre
a hub
A linear system suggests:
👉 progression
👉 accumulation
👉 sequence
In other words:
👉 a ledger
What a Ledger Looks Like Without Writing
In a world without:
paper
numbers
written records
A ledger must be:
physical
visible
ordered
Carnac fits that requirement perfectly:
Stones = units
Rows = sequences
Expansion = growth
This is not symbolic decoration.
👉 It is a recording structure
The Scale Argument — Why This Matters
This is where Carnac becomes decisive.
Because Avebury alone could be dismissed as:
👉 local 👉 unique 👉 symbolic
Carnac cannot.
Its scale forces a different conclusion:
👉 This is not a local phenomenon 👉 This is a regional system
And once that is accepted:
👉 The economic model must scale with it
(The Stone Money – Credit System)
7. The Atlantic Trade Route — The Missing Context
Monuments do not exist in isolation.
They sit within:
👉 landscapes of movement
And if the stone systems at Carnac stones and Avebury are part of an economic structure, then that structure must have:
routes
connectivity
flow
Because value systems only exist where exchange exists.
The Forgotten Infrastructure — Water
Modern interpretations assume land-based movement.
But your wider work has already demonstrated something critical:
👉 Early Britain was not a dry, stable landscape
It was:
waterlogged
saturated
dominated by high river levels and floodplains
This is not speculation.
It is supported by:
elevation-controlled site distribution
peat formation across flooded landscapes
hydrological lag after the last Ice Age
Which leads to a simple but transformative conclusion:
👉 Water was the primary transport system
Reconstructing the Prehistoric Map
Now reimagine the landscape:
Valleys = wetlands or rivers
Lowlands = marsh or floodplain
Coastlines = dynamic, shifting
Movement over land becomes:
👉 difficult 👉 slow 👉 unreliable
Movement by water becomes:
👉 efficient 👉 scalable 👉 predictable
The Atlantic Corridor
Now place Carnac within that reality.
Carnac stones sits on:
a sheltered Atlantic coastline
within reach of major sea routes
at a natural entry point between north and south
From here, movement extends:
North → Britain and the Doggerland basin
West → Atlantic coastal systems
South → Iberia and Mediterranean connections
This is not a peripheral location.
👉 It is a junction
(The Stone Money – Credit System)
Doggerland — The Northern Anchor
Before submergence, Doggerland formed:
a vast lowland connecting Britain to Europe
rich in resources
densely occupied
Its gradual loss due to rising waters created:
👉 displacement 👉 migration 👉 reorganisation of trade
Which means:
👉 trade routes did not disappear 👉 they shifted
And those shifts would have followed:
👉 coastlines and waterways
Connecting the System
Now bring the pieces together:
Carnac = coastal system
Avebury = inland node
Doggerland = northern network
These are not separate phenomena.
They are:
👉 connected points within a single movement system
What Trade Actually Requires
For a trading network to function at scale, it must have:
routes (waterways)
hubs (exchange points)
accounting (value systems)
We now have:
routes → Atlantic and river systems
hubs → sites like Avebury
accounting → emerging from stone systems
This is no longer speculative.
👉 It is structurally complete.
Why Location Matters
This is the key shift.
Carnac is not mysterious because of what it is.
👉 It is misunderstood because of where it is placed in interpretation.
Seen as a ritual site:
its scale is excessive
its structure is unexplained
Seen as part of a trade network:
its location is optimal
its scale is necessary
its structure is functional
The Missing Link in Archaeology
Archaeology tends to isolate sites:
study Avebury
study Carnac
study Doggerland
But systems do not work in isolation.
👉 They work through connection
And once the connection is introduced:
👉 the monuments stop being individual mysteries 👉 and start behaving as components
(The Stone Money – Credit System)
8. Carnac as a Linear Ledger — Recording Value Without Writing
If prehistoric societies required:
a way to store value
a way to transfer ownership
a way to track accumulation over time
Then one question becomes unavoidable:
👉 What does a ledger look like in a world without writing?
Because a ledger is not optional.
It is the backbone of any economic system.
What a Ledger Must Do
Regardless of form, a ledger must:
record units of value
maintain sequence
allow verification
persist over time
In modern systems, this is done with:
books
databases
digital records
In a prehistoric system, none of these exists.
So the system must be:
👉 physical
👉 visible
👉 ordered
The Structure of Carnac stones
Now return to Carnac—but this time, ignore interpretation and focus only on structure.
What do we actually see?
Long rows of stones
Repeated, consistent spacing
Parallel alignments
Expansion over time
This is not a random placement.
👉 It is ordered sequencing
Sequence Is the Key
A ledger is not just a collection of units.
👉 It is a sequence of units
Because sequence allows:
counting
accumulation
tracking change over time
Carnac provides exactly this:
👉 rows = sequences 👉 stones = units
(The Stone Money – Credit System)
From Alignment to Accounting
Under traditional models:
rows are symbolic
alignment is ritual
But this creates a problem:
👉 Why maintain strict order across thousands of stones?
Under a ledger model:
order is essential
repetition is necessary
expansion reflects growth
Now the structure makes sense:
👉 Each stone is not a decoration
👉 It is a recorded unit
Expansion as Economic Growth
One of the most overlooked features of Carnac is:
👉 it was not built all at once
It developed over time.
This is critical.
Because:
ritual monuments tend to be completed
symbolic structures tend to be fixed
But Carnac:
👉 expands
And expansion implies:
continuation
accumulation
increasing complexity
In economic terms:
👉 growth
Why Linear, Not Circular?
Compare Carnac to Avebury:
Avebury → circular → centralised
Carnac → linear → progressive
This difference is not stylistic.
It is functional.
A circular system:
👉 defines a fixed structure (a node, a hub)
A linear system:
👉 allows indefinite extension
Which is exactly what a ledger requires.
Verification Without Writing
A ledger must be verifiable.
Without writing, verification must be:
👉 communal 👉 visible 👉 consistent
Carnac achieves this:
anyone can see the sequence
anyone can recognise the structure
the system cannot be hidden or altered easily
👉 The landscape itself becomes the record
Durability — The Perfect Archive
Unlike:
wood (rots)
clay (breaks)
organic materials (decay)
Stone provides:
👉 permanence
Which means:
records persist across generations
value is stabilised over time
the system cannot be easily erased
The Critical Shift
At this point, the interpretation flips completely.
Carnac is no longer:
a ritual alignment
an astronomical curiosity
an unexplained anomaly
It becomes:
👉 a physical accounting system
Operating without:
writing
numbers
portable currency
But fulfilling every requirement of a ledger.
(The Stone Money – Credit System)
9. Avebury — The Fixed Credit System (The Banking Node)
If Carnac stones function as a linear ledger, recording accumulation and sequence—
Then sites like Avebury must serve a different role.
Because their structure is fundamentally different.
A Different Kind of Design
Avebury is not:
linear
expansive
sequential
It is:
circular
enclosed
fixed
This is not stylistic variation.
👉 It is a different system entirely.
What a Circular System Implies
A circle does something a line cannot:
👉 It defines a closed system
no beginning
no end
no expansion
Everything exists:
👉 within a boundary
This is exactly what you would expect from:
👉 a controlled value system
From Ledger to Account
If Carnac records value over distance and time—
Then Avebury represents:
👉 where that value is held
Not tracked.
👉 stored
(The Stone Money – Credit System)
The Function of Enclosure
Avebury’s defining feature is not just its stones.
It is its boundary:
massive ditch
continuous bank
controlled interior space
This is not defensive in any practical sense.
It does not protect against attack.
Instead, it does something far more specific:
👉 It defines inclusion
👉 It separates:
inside vs outside
recognised vs unrecognised
accounted vs unaccounted
The Bank Analogy — But Physical
In modern systems:
banks store value
ledgers track value
At Avebury:
the circle = the account
the stones = the stored units
This is not a metaphor.
👉 It is structural equivalence.
Why the Stones Are Massive
If stones represent value, their size is not a decorative feature.
It serves multiple purposes:
visibility → public verification
effort → embedded value
immutability → cannot be easily altered
A large stone:
👉 is difficult to create 👉 difficult to move 👉 impossible to fake
(The Stone Money – Credit System)
Which makes it:
👉 a perfect high-value marker
Ownership Without Movement
Now return to the principle proven in Yap:
👉 value does not require physical transfer
At Avebury:
stones remain fixed
Ownership changes socially
This allows:
transfer of value
without transport
without loss
without duplication
Why a Circle Works as a Credit System
A circular layout allows:
division into positions
fixed reference points
stable relationships between units
This creates:
👉 a structured, finite system
Unlike Carnac, which expands indefinitely—
Avebury:
👉 defines limits
Which is essential for:
👉 controlling value
The Role of the Community
Like all pre-written systems, this depends on:
👉 collective recognition
The community knows:
which stone represents what
who controls which part
how value is transferred
Again:
👉 The people are the ledger
Connecting the System
Now the relationship becomes clear:
Carnac → records accumulation (ledger)
Avebury → holds value (account)
Both are required.
Because:
👉 Recording without storage is useless 👉 storage without recording is unstable
Together, they form:
👉 a complete economic system
(The Stone Money – Credit System)
10. Conclusion — The Economic System Hidden in Plain Sight
At the beginning of this analysis, a simple question was asked:
👉 What economic system made monuments like Avebury and Carnac stones possible?
Archaeology has never answered it.
Because it has never looked for one.
The System Reconstructed
What emerges instead is not a mystery—but a structure:
Stone = value representation
Carnac = ledger (recording system)
Avebury = market (exchange system)
Waterways = transport network
This is not a symbolic interpretation.
👉 It is a complete economic model
The Casino Analogy — Value Within a Defined System
To understand how this works, consider a modern example:
👉 a casino
Inside a casino:
chips have value
they can be exchanged for goods, services, or money
they act as a credit system
(The Stone Money – Credit System)
But outside the casino:
👉 They are worthless
Why?
👉 Because value only exists within a recognised enclosure
This is exactly what we see at Avebury:
a defined boundary
a recognised system
a shared agreement of value
Inside the enclosure:
👉 stone = currency
Carnac and the Ledger — Still Used Today
Now return to the Carnac stones.
What appears as endless rows of stones is not random.
👉 It is ordered, sequential, and expandable
Now compare that to modern financial systems.
In places like:
Bank of England
Fort Knox
Gold is stored:
in rows
on shelves
in ordered sequences
Each bar:
marked
recorded
assigned ownership
But crucially:
👉 The gold does not move
Ownership changes.
Credit is issued.
Value is transferred.
The Critical Parallel
This is the same system.
At Carnac:
stones = units
rows = sequence
structure = ledger
At Fort Knox or the Bank of England:
gold bars = units
shelves = sequence
vault = ledger
In both cases:
👉 the object remains fixed 👉 the value moves
Credit Without Movement
This is the key insight that unlocks everything.
We assume trade requires the movement of goods or money.
But in advanced systems:
👉 it does not
Value can be:
assigned
transferred
redeemed
Without the underlying asset ever moving.
This is not modern innovation.
👉 It is a fundamental economic principle
A System That Never Disappeared
What we are seeing in prehistoric Britain and Europe is not a lost system.
It is:
👉 an early version of the same system still in use today
casinos
banks
vaults
markets
All operate on the same foundation:
👉 recognised value within a defined structure
Why Archaeology Missed It
Because it has been looking for:
ritual
belief
symbolism
Instead of:
👉 function
Once the function is restored:
Carnac is no longer an anomaly
Avebury is no longer a mystery
stone circles are no longer isolated
They become:
👉 infrastructure
The Final Realisation
No society builds:
thousands of stones in sequence
massive enclosed gathering sites
interconnected networks across waterways
Without a system behind them.
And that system is now visible:
👉 a prehistoric economy
Operating through:
stone-based value
physical ledgers
controlled marketplaces
waterborne trade networks
The One Line That Changes Everything
If you strip everything back, it comes down to this:
👉 The stones were never the mystery.
👉 The economy they represent was.
(The Stone Money – Credit System)
PODCAST
Author’s Biography
Robert John Langdon, a polymathic luminary, emerges as a writer, historian, and eminent specialist in LiDAR Landscape Archaeology.
His intellectual voyage has been interwoven with stints as an astute scrutineer in government and grand corporate bastions, a tapestry spanning British Telecommunications, Cable and Wireless, British Gas, and the esteemed University of London.
A decade hence, Robert’s transition into retirement unfurled a chapter of insatiable curiosity. This phase saw him immerse himself in Politics, Archaeology, Philosophy, and the enigmatic realm of Quantum Mechanics. His academic odyssey traversed the venerable corridors of knowledge hubs such as the Museum of London, University College London, Birkbeck College, The City Literature Institute, and Chichester University.
In the symphony of his life, Robert is a custodian of three progeny and a pair of cherished grandchildren. His sanctuary lies ensconced in the embrace of West Wales, where he inhabits an isolated cottage, its windows framing a vista of the boundless sea – a retreat from the scrutinising gaze of Her Majesty’s Revenue and Customs, an amiable clandestinity in the lap of nature.
Exploring Prehistoric Britain: A Journey Through Time
My blog delves into the fascinating mysteries of prehistoric Britain, challenging conventional narratives and offering fresh perspectives grounded in cutting-edge research, particularly LiDAR technology. I invite you to explore some key areas of my research. For example, the Wansdyke, often cited as a defensive structure, is re-examined in light of new evidence. I’ve presented my findings in my blog post Wansdyke: A British Frontier Wall – ‘Debunked’, and a Wansdyke LiDAR Flyover video further visualises my conclusions.
My work also often challenges established archaeological dogma. I argue that many sites, such as Hambledon Hill, commonly identified as Iron Age hillforts, are not what they seem. My posts Lidar Investigation Hambledon Hill – NOT an ‘Iron Age Fort’ and Unmasking the “Iron Age Hillfort” Myth explore these ideas in detail and offer an alternative view. Similarly, sites like Cissbury Ring and White Sheet Camp receive re-evaluations based on LiDAR analysis in my posts “Lidar Investigation Cissbury Ring through time”and “Lidar Investigation White Sheet Camp,“ revealing fascinating insights into their true purpose. I have also examined South Cadbury Castle, often linked to the mythical Camelot56.
My research also extends to ancient water management, including the role of canals and other linear earthworks. I have discussed the true origins of Car Dyke in multiple posts, including Car Dyke – ABC News Podcast and Lidar Investigation Car Dyke – North Section, which suggest a Mesolithic origin 2357. I also explore the misidentification of Roman aqueducts, as seen in my posts on the Great Chesters (Roman) Aqueduct. My research has also been greatly informed by my post-glacial flooding hypothesis, which has helped explain landscape transformations over time. I have discussed this hypothesis in several posts, including AI now supports my Post-Glacial Flooding Hypothesis and Exploring Britain’s Flooded Past: A Personal Journey
For those interested in British Prehistory, visit www.prehistoric-britain.co.uk, a comprehensive resource featuring an extensive collection of archaeology articles, modern LiDAR investigations, and groundbreaking research. The site also includes insights and excerpts from the acclaimed Robert John Langdon Trilogy, a series of books that explore Britain during the Prehistoric period. Titles in the trilogy include The Stonehenge Enigma, Dawn of the Lost Civilisation, and The Post-Glacial Flooding Hypothesis, which offer compelling evidence of ancient landscapes shaped by post-glacial flooding.
To further explore these topics, Robert John Langdon has developed a dedicated YouTube channel featuring over 100 video documentaries and investigations that complement the trilogy. Notable discoveries and studies showcased on the channel include 13 Things that Don’t Make Sense in History and the revelation of Silbury Avenue – The Lost Stone Avenue, a rediscovered prehistoric feature at Avebury, Wiltshire.
In addition to his main works, Langdon has released a series of shorter, accessible publications, ideal for readers delving into specific topics. These include:
For active discussions and updates on the trilogy’s findings and recent LiDAR investigations, join our vibrant community on Facebook. Engage with like-minded enthusiasts by leaving a message or contributing to debates in our Facebook Group.
Whether through the books, the website, or interactive videos, we aim to provide a deeper understanding of Britain’s fascinating prehistoric past. We encourage you to explore these resources and uncover the mysteries of ancient landscapes through the lens of modern archaeology.
For more information, including chapter extracts and related publications, visit the Robert John Langdon Author Page. Dive into works such as The Stonehenge Enigma or Dawn of the Lost Civilisation, and explore cutting-edge theories that challenge traditional historical narratives.
This is not another theory. This is not speculation. And it is not a reinterpretation of the same old narrative.
👉 This is the point where the old narrative breaks.
For over three centuries, archaeology has explained Stonehenge—and prehistory as a whole—through assumption, analogy, and belief. When the evidence didn’t fit, it was labelled “ritual,” “symbolic,” or simply ignored.
That approach ends here.
The Stonehenge Enigma V4.0
The First Scientific Reconstruction of Prehistory
The Prehistoric Britain trilogy is the first body of work to rebuild prehistoric Britain using:
Measurable scientific evidence
Mathematics and statistical validation
Engineering logic and system analysis
Environmental and hydrological constraints
Not interpretation. Not tradition.
👉 Proof.
At its core is a simple principle:
If a theory cannot be demonstrated to work within the physical world, it is not science.
The Stonehenge Enigma V4.0
Why the Old Narrative Is Dead
The traditional model of Stonehenge—and of prehistoric Britain—fails one basic test:
👉 It does not function.
It cannot explain:
Why the geometry exists
Why the site is positioned where it is
Why water is fundamental to its construction
Or how the system operates as a whole
Instead, it relies on disconnected explanations that never resolve into a working model.
This trilogy replaces that failure with something archaeology has never delivered:
👉 A complete, testable system that works.
The Stonehenge Enigma V4.0
The Consequence
Once the system is understood, the implications are unavoidable:
Stonehenge is not symbolic—it is functional
Its builders were not primitive—they were engineers
And prehistoric Britain was not dry land—it was a water-dominated environment shaping everything that followed
This is not a minor correction.
👉 It is the collapse of the existing framework.
The Stonehenge Enigma V4.0
What You Are About to Read
This book does not ask you to accept a new belief.
It does something far more direct:
👉 It shows you how the system works.
And once you see that…
👉 The old explanations don’t just look weak.
👉 They become impossible to defend.
The Stonehenge Enigma V4.0
A Scientific Rebuild of Prehistoric Britain
What if Stonehenge isn’t a monument… but a machine?
For over 300 years, Stonehenge has been described as a temple, a calendar, a burial site, or a place of ritual.
There’s just one problem:
👉 None of those explanations actually work.
They explain fragments. They ignore contradictions. And when the evidence doesn’t fit—they fall back on one word:
👉 “Ritual.”
That’s not an explanation. That’s an admission of failure.
The Stonehenge Enigma V4.0
A Different Approach
The Stonehenge Enigma v4.0 starts from a simple premise:
👉 Stop asking what Stonehenge meant 👉 Start asking what it was built to do
This isn’t theory layered on top of assumption.
It’s a rebuild from the ground up using:
Geometry
Hydrology
Construction logic
Environmental constraints
No speculation. No inherited narratives.
👉 Only what can be demonstrated.
The Key Breakthrough
The mistake has always been the same:
👉 Treating Stonehenge as one monument
It isn’t.
It’s multiple systems built at different times, then merged into a single story.
This book separates them properly:
Phase I (~8300 BCE)
A functional, water-based system built within a flooded landscape
Phase II (Later Reuse)
A completely different structure—misinterpreted as the original purpose
Once separated, everything changes.
The Stonehenge Enigma V4.0
What Stonehenge Actually Was
When analysed as a system—not a symbol—the evidence leads to one unavoidable conclusion:
👉 Stonehenge was a working predictive device
Not abstract astronomy. Not ceremonial alignment.
👉 A practical system used to model natural cycles:
Water levels
Tidal behaviour
Seasonal change
Because in a flooded, post-Ice Age Britain…
👉 Prediction wasn’t curiosity—it was survival.
The Stonehenge Enigma V4.0
The Aubrey Holes – Finally Explained
For centuries, the Aubrey Holes have been treated as:
Stone sockets
Burial pits
Ritual features
None of these explanations hold up.
Instead, they form:
👉 A fixed, repeatable computational structure
A system based on:
Counting
Movement
Position
In simple terms:
👉 A prehistoric “computer”
The Stonehenge Enigma V4.0
The Missing Piece: Water
Archaeology has consistently ignored the most obvious constraint:
👉 The environment
Post-glacial Britain wasn’t dry land.
It was:
Flooded valleys
Raised groundwater
Expanding rivers
Wetland basins
As shown in the wider Post-Glacial Flooding Hypothesis, early Britain operated under elevated water systems for thousands of years
That changes everything.
Stonehenge wasn’t built on land.
👉 It was built within a hydrological system
The Stonehenge Enigma V4.0
Phase II – A Monument to the Dead of Doggerland
Once Phase I is understood as a functional, water-based system, Phase II stops being a continuation—and starts to look like something very different.
It becomes a response.
By the time Phase II was constructed, the landscape that defined earlier life in Britain had changed dramatically. The great lowland plains of Doggerland—once a vast, habitable region connecting Britain to mainland Europe—had been progressively inundated by rising seas and collapsing coastlines.
This was not a single event. It was a slow, generational loss of land, resources, and communities.
Within this context, Phase II takes on a new and coherent meaning:
👉 It is not functional infrastructure. 👉 It is memory architecture.
The shift is clear:
From water engineering → to stone permanence
From prediction and survival → to commemoration and identity
From a working system → to a monumental statement
The geometry, scale, and orientation of Phase II reflect this transition. The monument no longer needs to operate—it needs to endure.
In this interpretation:
👉 Stonehenge Phase II becomes a cenotaph 👉 A symbolic structure representing a lost homeland 👉 A monument to the people and world that disappeared beneath the North Sea
This is why the site changes so fundamentally.
It is no longer solving a problem.
👉 It is remembering one.
The Stonehenge Enigma V4.0
Why Every Traditional Explanation Fails
Because they all start with meaning—not function.
Temple → ignores engineering
Observatory → ignores water
Burial site → ignores process
Ritual → explains nothing
👉 They don’t fail individually.
👉 They fail because they are asking the wrong question.
The Stonehenge Enigma V4.0
A Simple Test
If a theory is correct, it must:
✔ Explain all features ✔ Work as a system ✔ Match the environment ✔ Provide practical value
So ask yourself:
👉 What use is a monument that only “works” once every 18 years? 👉 Why build precision geometry with no functional output? 👉 Why ignore water in a saturated landscape?
The Stonehenge Enigma V4.0
The Conclusion
Strip away the assumptions.
Look only at what’s measurable.
And the answer becomes obvious:
Why This Matters
If this model is correct, then:
Stonehenge is the earliest predictive system ever built
Prehistoric societies were engineers—not primitives
And archaeology has been interpreting function as symbolism
The Stonehenge Enigma V4.0
The Final Point
Stonehenge has never lacked explanations.
👉 It has lacked one that works.
The Stonehenge Enigma V4.0
Now Available
The Stonehenge Enigma v4.0 A Scientific Rebuild of Prehistoric Britain
Paperback Version – £9.95Hardback COLOUR Version – £29.95
PODCAST
The Videos
More Book information
Technical White Paper: The Post-Glacial Flooding Hypothesis (PGFH) and British Hydrological Evolution
1. Theoretical Framework: The Post-Glacial Flooding Hypothesis
The Post-Glacial Flooding Hypothesis (PGFH) establishes a necessary paradigm shift in paleohydrological modeling, moving away from the simplistic “episodic flood event” narrative toward a rigorous model of sustained hydrological disequilibrium. This framework asserts that the early Holocene landscape was not shaped by modern-style meteorological cycles but by a state of delayed continental drainage. This disequilibrium was the inevitable consequence of ice-sheet-induced crustal compression and the massive overcharging of continental aquifers.
The core premise of the PGFH is that prehistoric river levels were governed by hydraulic boundary conditions rather than modern precipitation patterns, which are largely irrelevant to early Holocene reconstructions. We must recognize the lithosphere’s failure to rebound instantaneously; this “isostatic lag” created physical obstructions that prevented efficient drainage. Consequently, Britain operated under a hydraulic regime where river stages were maintained at elevations significantly higher than today. This theoretical shift necessitates a rigorous re-examination of global sea-level data to resolve volumetric discrepancies that cannot be explained by surface meltwater alone.
2. Proof 1: Sea-Level Mass Balance and Volumetric Discrepancy
Between 19,000 and 7,000 years BP, the global deglacial sequence resulted in a 120m rise in mean sea level, representing an influx of approximately 4.5 × 10⁸ km³ of water into the ocean basins. However, a mass balance analysis reveals a profound “volumetric discrepancy.” Traditional models struggle to account for the continued rise in sea level during the Holocene, particularly as the British-Irish Ice Sheet (BIIS) had largely vanished.
While thermal expansion and residual ice loss from the Laurentide and Antarctic sheets contributed, they are insufficient to explain the total observed ocean loading. The PGFH identifies pressurized continental aquifers as the primary engine for this continued discharge. This “asynchronous decay”—where continental aquifers acted as secondary, delayed reservoirs—sustained sea-level rise long after the primary meltwater pulses (MWP-1A and 1B).
The Deglacial Sequence identified in the PGFH:
Stable Minimum (26–19 ka BP): Sea levels remained constant near -130m; global ice volume was at its maximum.
Deglacial Rise (19–7 ka BP): Global mean sea level increased by 120m at an average rate of 1.2 cm/year.
Holocene Highstand (After 7 ka BP): Relative stability within ±3m, characterized by regional divergence driven by glacio-isostatic adjustment (GIA).
If the global oceans were receiving this sustained continental discharge, the regional geomorphic response must be visible in the elevation and architecture of river terraces.
3. Proof 2: Ice-Volume Scaling and the Terrace Elevation Rule
Fluvial terrace formation is a direct function of base-level thresholds and hydraulic energy. The PGFH utilizes Langdon Mathematics to establish the “90% Terrace Rule” and the “Terrace Elevation Scaling Principle.” The significance of the 90% benchmark lies in the fact that the Last Glacial Maximum (LGM) reached approximately 90% of the maximum possible Pleistocene ice extent, creating a specific “hydrological energy” baseline. This mathematical benchmark allows for the precise prediction of early Holocene river heights based on ice-volume percentages.
Assumes modern drainage baselines were reached rapidly.
Predicts elevated river stages based on 90% ice-volume scaling.
Mechanism
Focused on surface runoff and precipitation.
Driven by hydraulic head and multi-millennial aquifer discharge.
By applying Langdon Mathematics, we treat river terraces as time-calibrated gauges. When ice volume approached 90% of its maximum, the resulting groundwater pressure and river energy placed floodplains at elevations that modern hydrology cannot replicate.
4. Proof 3: Statistical Validation via Subsurface Matrix Analysis
The borehole data from Stonehenge Bottom provides the localized empirical rejection of traditional models. The “random chalk deposition model,” which dismisses subsurface variability as geological noise, is statistically untenable. By normalizing data by elevation (Ordnance Datum) rather than depth, we identify a rigorous clustering of water-related deposits at discrete heights.
The analysis identifies a 92.6 m OD envelope where water-related deposits cluster with a 170:1 probability against chance. This statistical rejection is the “nail in the coffin” for traditional theories; it confirms that the water table was sustained at this elevation for millennia.
The Four Phases of Subsurface Matrix Analysis:
Height-Frequency Analysis: Identifying the vertical distribution of sedimentary units.
Matrix Concurrence: Comparing deposit types across independent boreholes at identical elevations.
Discrete Elevation Zones: Defining the specific “water-envelopes” where saturation occurred.
Statistical Rejection: Disproving the randomness of deposition in favor of a sustained hydrological control.
5. Case Study: Volumetric Scaling in the Thames Valley Basin
As a principal Quaternary gauge, the Thames Valley demonstrates a massive mismatch between modern hydrology and Holocene geomorphology. The modern mean discharge of 65.8 m³/s is incapable of creating the 3,723% average volumetric expansion observed in the mapped Holocene alluvium.
Cross-Sectional Analysis (Sections A–G):
Cross-Section
Current Width (m)
Holocene Width (m)
Volume Increase %
A
400
4,425
8,866%
B
650
7,725
3,590%
C
731
8,450
4,292%
D
965
7,644
1,151%
E
1,207
11,265
7,367%
F
1,125
5,230
390%
G
1,448
7,242
408%
AVERAGE
932
7,426
3,723%
The derived discharge for this system is approximately 2,450 m³/s. Critically, the sediment competence argument confirms this; the modern Thames flow cannot move the coarse gravel sheets found in the basin’s stratigraphic record. Only the high-energy discharge predicted by the PGFH explains the presence and transport of these massive gravel units.
6. Hydraulic Mechanisms: Aquifer Pressure and the “Age of Water”
Using Darcy’s Law, we can model the elevated hydraulic head in British chalk systems. During the glacial period, aquifers were subjected to immense subglacial recharge and lithospheric pressure. This “ancient pressure” sustained high river baseflow for thousands of years after the ice retreated from the surface.
Unlike “rain-fed” modern rivers, these spring-fed, high-stage rivers were consistent systems seeking hydraulic equilibrium. The PGFH clarifies that these were not short-lived runoff events but a multi-millennial release of stored glacial water.
Isotopic analysis identifies a 12,000-year gap between the melting of surface ice and the eventual rainwater replenishment of the aquifers. This gap provides definitive proof that early Holocene rivers were powered by “ancient” meltwater under pressure, not recent precipitation.
7. Chronological Constraints: Peat as a National Hydrological Clock
Peat serves as the ultimate geomorphological “clock” for the PGFH. The “Delayed Peat Peak Paradox”—the fact that British peat expansion reached its maximum well into the early Holocene (c. 9–8.5 ka BP)—is only resolvable if we accept the PGFH. Peat only forms in anaerobic, saturated conditions; its expansion proves that the landscape remained saturated long after traditional models suggest it should have been “dry land.”
Buried peat beds in the Somerset Levels, Fenland, and the Thames Valley (c. 9–8.5 ka BP) are physical records of “delayed drainage.” They mark the period of maximum groundwater overcharge and provide the chronological proof of a landscape in slow, hydraulic transition.
8. Synthesis: The Deglacial Hydraulic Law and Engineering Implications
The convergence of Sea-Level Mass Balance, Ice-Volume Scaling, and Subsurface Matrix Analysis defines the Deglacial Hydraulic Law. This law dictates that the early Holocene landscape was governed by the predictable relationship between ice-mass loss, crustal rebound, and aquifer discharge duration.
Strategic Framework for Geomorphologists:
Redefine Hydrological Baselines: Acknowledge that early Holocene baseflow was an order of magnitude higher than modern levels.
Apply Volumetric Scaling: Use the 3,723% benchmark from the Thames as a baseline for other British catchment reconstructions.
Reject Random Deposition Models: Replace Bayesian “noise” models with elevation-normalized matrix analysis.
Model Sediment Competence: Account for the high-energy flow (e.g., 2,450 m³/s) required to transport Holocene gravel sheets.
Utilize Peat Chronology: Interpret peat initiation as a record of peak groundwater saturation rather than simple climate shifts.
Ancient Britain was never a static, dry island; it was a dynamic system of “living water” undergoing a measurable, mathematically predictable, and multi-millennial transformation.
Robert John Langdon, a polymathic luminary, emerges as a writer, historian, and eminent specialist in LiDAR Landscape Archaeology.
His intellectual voyage has been interwoven with stints as an astute scrutineer in government and grand corporate bastions, a tapestry spanning British Telecommunications, Cable and Wireless, British Gas, and the esteemed University of London.
A decade hence, Robert’s transition into retirement unfurled a chapter of insatiable curiosity. This phase saw him immerse himself in Politics, Archaeology, Philosophy, and the enigmatic realm of Quantum Mechanics. His academic odyssey traversed the venerable corridors of knowledge hubs such as the Museum of London, University College London, Birkbeck College, The City Literature Institute, and Chichester University.
In the symphony of his life, Robert is a custodian of three progeny and a pair of cherished grandchildren. His sanctuary lies ensconced in the embrace of West Wales, where he inhabits an isolated cottage, its windows framing a vista of the boundless sea – a retreat from the scrutinising gaze of Her Majesty’s Revenue and Customs, an amiable clandestinity in the lap of nature.
Exploring Prehistoric Britain: A Journey Through Time
My blog delves into the fascinating mysteries of prehistoric Britain, challenging conventional narratives and offering fresh perspectives grounded in cutting-edge research, particularly LiDAR technology. I invite you to explore some key areas of my research. For example, the Wansdyke, often cited as a defensive structure, is re-examined in light of new evidence. I’ve presented my findings in my blog post Wansdyke: A British Frontier Wall – ‘Debunked’, and a Wansdyke LiDAR Flyover video further visualises my conclusions.
My work also often challenges established archaeological dogma. I argue that many sites, such as Hambledon Hill, commonly identified as Iron Age hillforts, are not what they seem. My posts Lidar Investigation Hambledon Hill – NOT an ‘Iron Age Fort’ and Unmasking the “Iron Age Hillfort” Myth explore these ideas in detail and offer an alternative view. Similarly, sites like Cissbury Ring and White Sheet Camp receive re-evaluations based on LiDAR analysis in my posts “Lidar Investigation Cissbury Ring through time”and “Lidar Investigation White Sheet Camp,“ revealing fascinating insights into their true purpose. I have also examined South Cadbury Castle, often linked to the mythical Camelot56.
My research also extends to ancient water management, including the role of canals and other linear earthworks. I have discussed the true origins of Car Dyke in multiple posts, including Car Dyke – ABC News Podcast and Lidar Investigation Car Dyke – North Section, which suggest a Mesolithic origin 2357. I also explore the misidentification of Roman aqueducts, as seen in my posts on the Great Chesters (Roman) Aqueduct. My research has also been greatly informed by my post-glacial flooding hypothesis, which has helped explain landscape transformations over time. I have discussed this hypothesis in several posts, including AI now supports my Post-Glacial Flooding Hypothesis and Exploring Britain’s Flooded Past: A Personal Journey
For those interested in British Prehistory, visit www.prehistoric-britain.co.uk, a comprehensive resource featuring an extensive collection of archaeology articles, modern LiDAR investigations, and groundbreaking research. The site also includes insights and excerpts from the acclaimed Robert John Langdon Trilogy, a series of books that explore Britain during the Prehistoric period. Titles in the trilogy include The Stonehenge Enigma, Dawn of the Lost Civilisation, and The Post-Glacial Flooding Hypothesis, which offer compelling evidence of ancient landscapes shaped by post-glacial flooding.
To further explore these topics, Robert John Langdon has developed a dedicated YouTube channel featuring over 100 video documentaries and investigations that complement the trilogy. Notable discoveries and studies showcased on the channel include 13 Things that Don’t Make Sense in History and the revelation of Silbury Avenue – The Lost Stone Avenue, a rediscovered prehistoric feature at Avebury, Wiltshire.
In addition to his main works, Langdon has released a series of shorter, accessible publications, ideal for readers delving into specific topics. These include:
For active discussions and updates on the trilogy’s findings and recent LiDAR investigations, join our vibrant community on Facebook. Engage with like-minded enthusiasts by leaving a message or contributing to debates in our Facebook Group.
Whether through the books, the website, or interactive videos, we aim to provide a deeper understanding of Britain’s fascinating prehistoric past. We encourage you to explore these resources and uncover the mysteries of ancient landscapes through the lens of modern archaeology.
For more information, including chapter extracts and related publications, visit the Robert John Langdon Author Page. Dive into works such as The Stonehenge Enigma or Dawn of the Lost Civilisation, and explore cutting-edge theories that challenge traditional historical narratives.
The Problem No One Can Explain (Hydrology 101 Simplified: Why Britain’s Dykes Worked Without Rivers)
Britain’s Dykes – Hydrology 101
Across Britain, there are over 1,400 recorded linear earthworks.
They run:
Over hills
Across ridges
Into valleys
And then… stop
Today, they are dry.
So the question always asked is:
👉 “How could these ever have carried water?”
And the answer has been consistently wrong.
(Hydrology 101 Simplified: Why Britain’s Dykes Worked Without Rivers)
The Fundamental Mistake
Almost everyone — including archaeologists — assumes one thing:
👉 Water behaves like a flat surface
Like a bath.
So they imagine:
Water sits level
It flows downhill
It collects at the lowest point
From that assumption, dykes make no sense.
Because:
👉 Many run uphill 👉 Many sit high in the landscape 👉 Many don’t connect to rivers
So they are dismissed as:
Boundaries
Defences
Or “ritual” features
(Hydrology 101 Simplified: Why Britain’s Dykes Worked Without Rivers)
The Reality: Water Does NOT Behave Like a Bathtub
Water on the surface behaves like that.
But water in the ground does not.
And this is the part almost everyone misses.
A huge proportion of the world’s fresh water is underground, stored in soils and rock layers
Think of the landscape not as dry land with rivers…
But as:
👉 A soaked sponge
(Hydrology 101 Simplified: Why Britain’s Dykes Worked Without Rivers)
A Simple Test Anyone Can Do
Go into your garden.
Dig a hole.
What happens?
👉 It fills with water
Now ask yourself:
Are you in a river?
Are you at sea level?
Are you even in a valley?
No.
Yet water appears.
That is groundwater.
(Hydrology 101 Simplified: Why Britain’s Dykes Worked Without Rivers)
The Critical Concept: Water Follows the Landscape
Here is the key idea that unlocks everything:
👉 Groundwater is not level — it follows the shape of the land
This is why:
Springs start high on hills
Wells work at all elevations
Water can exist just below the surface almost anywhere
(Hydrology 101 Simplified: Why Britain’s Dykes Worked Without Rivers)
Why This Is So Hard to Understand
Because we are trained to think in visible water:
👉 Rivers 👉 Lakes 👉 Seas
But these are only places where water escapes from the ground.
Before that point:
👉 It is contained 👉 Pressurised 👉 Moving through rock
(Hydrology 101 Simplified: Why Britain’s Dykes Worked Without Rivers)
Springs: The Proof
Rivers do not begin at the bottom of valleys.
They begin:
👉 At springs
And many springs occur:
👉 High in the landscape
This alone proves:
👉 Water exists at an elevation
(Hydrology 101 Simplified: Why Britain’s Dykes Worked Without Rivers)
Wells Prove the Same Thing
Wells have been dug for thousands of years.
And they work:
On hills
On slopes
On plateaus
Why?
Because they tap into:
👉 Water already in the ground
(Hydrology 101 Simplified: Why Britain’s Dykes Worked Without Rivers)
Now Apply This to Dykes
A dyke is nothing more than:
👉 A long ditch
If you dig a ditch into saturated ground:
👉 It fills with water
Not from a river…
👉 But from the ground itself
Hydrology 101 Simplified: Why Britain’s Dykes Worked Without Rivers)
Turning Wells Into a Canal
Think of it like this:
👉 One hole fills with water = a well
Now connect multiple wells:
👉 You get a continuous water-filled ditch
👉 A canal
The Missing Piece: The Ice Age
Everything changes when we place this into the correct time period.
After the last Ice Age:
Britain was saturated
Water tables were extremely high
Rivers were far larger than today
This is not speculation — it is the core basis of the hydrological model
So in the Mesolithic:
👉 Digging even a shallow ditch would hit water
(Hydrology 101 Simplified: Why Britain’s Dykes Worked Without Rivers)
What Britain Actually Looked Like
Around 8000 BCE:
Up to 90% woodland cover
Extensive wetlands
Flooded valleys
High groundwater
This was not open farmland.
It was:
👉 A wet, wooded, water-dominated landscape
(Hydrology 101 Simplified: Why Britain’s Dykes Worked Without Rivers)
Why Dykes Are Not Continuous
Walkers often notice:
👉 Dykes stop at valley edges 👉 Then reappear on the other side
This is seen as a flaw.
It isn’t.
It’s evidence.
Because at the time:
👉 The valley was full of water
So there was no need to dig.
You simply:
👉 Floated across
(Hydrology 101 Simplified: Why Britain’s Dykes Worked Without Rivers)
Modern Comparison: Abandoned Canals
Even today, canals abandoned for just 100 years:
👉 Look like dry ditches
Many people struggle to believe they were once:
👉 Major transport systems
Now apply:
👉 Thousands of years of decay
And the misunderstanding becomes obvious.
(Hydrology 101 Simplified: Why Britain’s Dykes Worked Without Rivers)
The Valley Gradient Problem
Another objection:
👉 “Water would just run to the bottom”
Again, this assumes surface water.
But dykes were:
👉 Groundwater-fed
And often:
👉 Segmented
Meaning:
👉 Water is held in sections 👉 Not allowed to drain away
(Hydrology 101 Simplified: Why Britain’s Dykes Worked Without Rivers)
Evidence from Offa’s Dyke (Chepstow)
At Chepstow:
The dyke changes form in the valley
It is not continuous
Sections differ in construction
But one thing remains:
👉 The bank width
This suggests:
👉 Original function changed over time
(Hydrology 101 Simplified: Why Britain’s Dykes Worked Without Rivers)
Later Adaptation
As water levels fell:
👉 The ditch became less important 👉 The bank became more important
And eventually:
👉 The dyke became a road
This is confirmed by:
👉 1800s OS maps marked it as an “ancient road”
(Hydrology 101 Simplified: Why Britain’s Dykes Worked Without Rivers)
Springs and the Vallum (Hadrian’s Wall)
The Vallum work is critical here.
You’ve identified:
👉 ~65 springs along ~70 miles
That’s roughly:
👉 One spring per mile
And that’s just today’s springs.
In a higher water table environment:
👉 There would have been many more
This means:
👉 Continuous water supply
(Hydrology 101 Simplified: Why Britain’s Dykes Worked Without Rivers)
The Power of Springs
A single strong spring can produce:
👉 Up to 2,800 litres per second
Now multiply that across a system.
This is not a trickle.
👉 It is a constant water source
(Hydrology 101 Simplified: Why Britain’s Dykes Worked Without Rivers)
Managing the Flow
No locks required.
Instead:
Small weirs
Narrow channels
Segmented ponds
These:
👉 Slow the flow 👉 Hold water in place 👉 Allow movement between sections
(Hydrology 101 Simplified: Why Britain’s Dykes Worked Without Rivers)
The Ice Age Legacy
At the peak:
👉 Britain sat under miles of ice
When it melted:
👉 Water saturated the land
And crucially:
👉 It took thousands of years to drain
(Hydrology 101 Simplified: Why Britain’s Dykes Worked Without Rivers)
The Key Evidence
Raised peat deposits
Flooded valleys
Dry river channels (palaeochannels)
Borehole water signatures
All point to:
👉 A long period of high water
(Hydrology 101 Simplified: Why Britain’s Dykes Worked Without Rivers)
Why Archaeology Gets This Wrong
Because it relies on:
👉 Today’s landscape
Instead of:
👉 Reconstructing the past one
(Hydrology 101 Simplified: Why Britain’s Dykes Worked Without Rivers)
Final Conclusion
Once you understand groundwater, everything changes.
Dykes no longer need:
❌ Rivers ❌ Locks ❌ Complex engineering
They only require:
👉 A saturated landscape
The One Sentence That Explains Everything
👉 Prehistoric Britain wasn’t dry land with rivers — it was wet land slowly draining.
Author’s Biography
Robert John Langdon, a polymathic luminary, emerges as a writer, historian, and eminent specialist in LiDAR Landscape Archaeology.
His intellectual voyage has been interwoven with stints as an astute scrutineer in government and grand corporate bastions, a tapestry spanning British Telecommunications, Cable and Wireless, British Gas, and the esteemed University of London.
A decade hence, Robert’s transition into retirement unfurled a chapter of insatiable curiosity. This phase saw him immerse himself in Politics, Archaeology, Philosophy, and the enigmatic realm of Quantum Mechanics. His academic odyssey traversed the venerable corridors of knowledge hubs such as the Museum of London, University College London, Birkbeck College, The City Literature Institute, and Chichester University.
In the symphony of his life, Robert is a custodian of three progeny and a pair of cherished grandchildren. His sanctuary lies ensconced in the embrace of West Wales, where he inhabits an isolated cottage, its windows framing a vista of the boundless sea – a retreat from the scrutinising gaze of Her Majesty’s Revenue and Customs, an amiable clandestinity in the lap of nature.
Exploring Prehistoric Britain: A Journey Through Time
My blog delves into the fascinating mysteries of prehistoric Britain, challenging conventional narratives and offering fresh perspectives grounded in cutting-edge research, particularly LiDAR technology. I invite you to explore some key areas of my research. For example, the Wansdyke, often cited as a defensive structure, is re-examined in light of new evidence. I’ve presented my findings in my blog post Wansdyke: A British Frontier Wall – ‘Debunked’, and a Wansdyke LiDAR Flyover video further visualises my conclusions.
My work also often challenges established archaeological dogma. I argue that many sites, such as Hambledon Hill, commonly identified as Iron Age hillforts, are not what they seem. My posts Lidar Investigation Hambledon Hill – NOT an ‘Iron Age Fort’ and Unmasking the “Iron Age Hillfort” Myth explore these ideas in detail and offer an alternative view. Similarly, sites like Cissbury Ring and White Sheet Camp receive re-evaluations based on LiDAR analysis in my posts “Lidar Investigation Cissbury Ring through time”and “Lidar Investigation White Sheet Camp,“ revealing fascinating insights into their true purpose. I have also examined South Cadbury Castle, often linked to the mythical Camelot56.
My research also extends to ancient water management, including the role of canals and other linear earthworks. I have discussed the true origins of Car Dyke in multiple posts, including Car Dyke – ABC News Podcast and Lidar Investigation Car Dyke – North Section, which suggest a Mesolithic origin 2357. I also explore the misidentification of Roman aqueducts, as seen in my posts on the Great Chesters (Roman) Aqueduct. My research has also been greatly informed by my post-glacial flooding hypothesis, which has helped explain landscape transformations over time. I have discussed this hypothesis in several posts, including AI now supports my Post-Glacial Flooding Hypothesis and Exploring Britain’s Flooded Past: A Personal Journey
For those interested in British Prehistory, visit www.prehistoric-britain.co.uk, a comprehensive resource featuring an extensive collection of archaeology articles, modern LiDAR investigations, and groundbreaking research. The site also includes insights and excerpts from the acclaimed Robert John Langdon Trilogy, a series of books that explore Britain during the Prehistoric period. Titles in the trilogy include The Stonehenge Enigma, Dawn of the Lost Civilisation, and The Post-Glacial Flooding Hypothesis, which offer compelling evidence of ancient landscapes shaped by post-glacial flooding.
To further explore these topics, Robert John Langdon has developed a dedicated YouTube channel featuring over 100 video documentaries and investigations that complement the trilogy. Notable discoveries and studies showcased on the channel include 13 Things that Don’t Make Sense in History and the revelation of Silbury Avenue – The Lost Stone Avenue, a rediscovered prehistoric feature at Avebury, Wiltshire.
In addition to his main works, Langdon has released a series of shorter, accessible publications, ideal for readers delving into specific topics. These include:
For active discussions and updates on the trilogy’s findings and recent LiDAR investigations, join our vibrant community on Facebook. Engage with like-minded enthusiasts by leaving a message or contributing to debates in our Facebook Group.
Whether through the books, the website, or interactive videos, we aim to provide a deeper understanding of Britain’s fascinating prehistoric past. We encourage you to explore these resources and uncover the mysteries of ancient landscapes through the lens of modern archaeology.
For more information, including chapter extracts and related publications, visit the Robert John Langdon Author Page. Dive into works such as The Stonehenge Enigma or Dawn of the Lost Civilisation, and explore cutting-edge theories that challenge traditional historical narratives.
13 things that don’t make sense about Waun Mawn (Stonehenge’s The Lost Circle Revealed)
Introduction
According to the BBC documentary, the discovery of the bluestone quarry in Wales was presented as a major breakthrough in understanding Stonehenge. At face value, that seems fair enough. Identifying a potential source for the stones is important.
But this is where the problem begins.
Because from that point onward, the investigation appears to shift away from asking what the evidence actually shows… and toward trying to make the evidence fit an already established timeline.
Instead of examining the quarry independently and comparing it objectively with Stonehenge, the focus becomes finding dates that support a pre-existing conclusion. That is not how science works. When you start with the answer and work backwards, you are no longer testing a hypothesis — you are trying to confirm one.
Craig Rhos-y-Felin is a good example of this.
Craig Rhos-Y-Felin: Stonehenge: The Lost Circle Revealed
The site contains clear evidence of Mesolithic activity, particularly in the form of man-made hearths. That should be the starting point for interpretation. Yet the emphasis is instead placed on a small number of later samples that fall closer to the desired Neolithic timeframe.
When those dates still don’t quite align, the solution is not to question the model — it is to introduce another one. A “prototype” stone circle in Wales was later moved to Stonehenge. A theory designed not from evidence, but from necessity.
And so begins a decade-long search for that missing link.
Sites are proposed… then quietly dropped when the dates don’t match. New locations are suggested… then abandoned for the same reason. The pattern repeats. The goal is no longer discovery — it is validation.
Eventually, everything converges on Waun Mawn.
(Stonehenge’s The Lost Circle Revealed)
This is presented as the long-awaited solution. But when you strip it back, the physical evidence is extremely limited. A handful of stones. A small number of possible stone holes. Nowhere near enough to replicate what exists at Stonehenge.
So the gaps are filled in.
Estimates are extended beyond what is actually present. Missing stones are assumed. Layouts are reconstructed from partial data. And suddenly, a fragment becomes a full circle.
Then we come to the dating.
Among a broad range of results spanning several millennia, one sample is highlighted as aligning with the proposed timeline. The rest — which do not support the theory — receive far less attention.
This is the core issue. You cannot treat a single favourable result as definitive while ignoring the wider dataset. That is not strengthening an argument — it is narrowing it.
The same pattern appears in other parts of the interpretation.
(Stonehenge’s The Lost Circle Revealed)
Large stones at the quarry are presented as the source of Stonehenge’s bluestones, despite clear differences in size and shape. No explanation is provided for how they were reduced or reworked.
Transport by water is dismissed, despite experimental demonstrations showing it is entirely possible. Instead, overland transport through heavily forested and waterlogged terrain is presented as the more feasible option — a claim that raises more questions than it answers.
Even the more technical aspects, such as photogrammetry, are used in ways that assume ideal conditions. A stone is said to match a socket, without addressing the simple fact that removing a stone alters the shape of that socket. Basic mechanical realities are overlooked.
And then, towards the end, the programme drifts into broader speculation — cultural movements, symbolic alignments, and generalised astronomical claims. These are presented confidently, but without the level of supporting evidence required to justify them.
Meanwhile, key inconsistencies remain unresolved.
Stonehenge contains 56 bluestone positions. Waun Mawn does not. The construction methods differ. The depth of the stone holes differs. The overall structure is not the same.
These are not small details. There are fundamental differences.
(Stonehenge’s The Lost Circle Revealed)
So what are we left with?
Not a clear, evidence-led conclusion — but a narrative built around selective interpretation. Certain data points are emphasised. Others are downplayed. Gaps are filled with theory rather than evidence.
The result is compelling television.
But it is not robust science.
Because real scientific analysis does not depend on finding the right answer.
It depends on being willing to accept when the evidence points somewhere else entirely.
(Stonehenge’s The Lost Circle Revealed)
The Documentary
Therefore, the last hope for MPP’s reputation and his ’10-year search’ fell upon Waun Mawn, culminating in the BBC documentary “Stonehenge: The Lost Circle Revealed”, shown on the 12th February 2021. In it, he claimed many so-called ‘facts’ which I shall now highlight as ‘not making sense’, with the reasons why.
1. At (13:20) MPP shows signs of human-made quarrying and splitting of Bluestones at Carn Goedog in Wales – unfortunately, there are no extensive excavation reports on this site, just a published review showing that of the 31 carbon dates, only three random samples support his theory and none of the man-made hearths which are Mesolithic (like Craig Rhos-Y-Felin) or late Neolithic.
2. The program showed the suggested quarried stones at Carn Goedog, which are over 12 feet long and 5 feet wide, weighing therefore around 20+ tonnes. The Stonehenge bluestones are, on average, less than six feet high and about 18–24 inches wide, weighing 1-3 tonnes.The review on the site offered no evidence that the stones were cut down and reshaped for the journey to Stonehenge or elsewhere. (Stonehenge’s The Lost Circle Revealed)
Carn Goedog – Stonehenge: The Lost Circle Revealed
3. MPP claims that the boat transport method (14.50) was infeasible as they did not have sturdy enough boats to carry the stones on such a journey – Sadly, you do not need a ‘boat’ to transport stones in a river as shown by Atkinson in the 1960’s who employed just four school kids to punt a raft with a 3 tonne stone attached down the Avon. Moreover, he has failed to recognise that the oldest boatyard in the world, located in the Solent (at the end of the Avon), was found with planked wood (and associated wheat grain from Turkey), indicating that substantial seafaring boats were available by the 7th Millennium BCE.
Clearly MPP was too young to see this punt down the Avon?
4. Mike Parker-Pearson also suggested that an ‘ox-cart’ route that followed the current A40 was the most feasible way of transporting these stones to Stonehenge. He believed that they dragged these stones over 200 km on wooden sledges – unfortunately, the example shown on the program shows schoolboys dragging a small stone over flat grassland, which would not be available for another 4000+ years and after Stonehenge’s initial construction. At the time of Phase I construction, the environment (as indicated by pollen analysis) shows that 70% of the terrain was woodland and forest, and the remaining 30% was mostly rivers and swampland, making such an endeavour impossible.
5. The Discovery (21:15) of ‘random’ hazel nuts at Craig Rhos-Y-Felin provides MPP’s required date for Stonehenge of 3300 BCE (which is still 500 years before MPP’s supposed construction date) – This clear ‘cherry picking’ of the archaeological evidence is ‘Bad Science’. To take just two carbon dates from over 40 at the Craig-Rhos-Y-Felin site and ignoring the more solid man-made hearth dates, which are Mesolithic and moreover, compatible with 26 carbon dates found at Stonehenge, is plainly a falsehood.
6. When they eventually found their target site (36:15), Waun Mawn (after many claims that other sites were “the one we have been looking for” to eventually find that the carbon dating on these sites did not match the required date), they found just four bluestones, and so went on a stone hunt and found 10 further stone HOLES! – This is clearly a sad attempt to fit a square peg into a round hole. The excavation was flawed as it only identified 14 possible stone locations and the remainder of the estimated 15 – 25 stones was a ‘guesstimation’ based on the known 14 holes – two of which had non-bluestone stones in situ.
Nowhere near the 56 stones needed to create Stonehenge Phase I
7. The BBC reconstruction shows just 28 stones (38:05) of the 56 Bluestones required for the Aubrey holes to be filled at Stonehenge, and MPP goes on to suggest, that the stone circle is of equal size and dimensions as Stonehenge, quote “the chances of the two sites having the EXACT dimensions are very slim”- This sadly, is another falsehood, the Moat/Ditch at Stonehenge is approximately 110 metres in diameter, NOT the Aubrey holes which are 90 metres in diameter. Moreover, Stonehenge has a ditch/moat surrounding the stones (for a good reason) Waun Mawn does not!!
8. MPPs then used a new, unused tool in archaeology to prove their hypothesis, ‘photogrammetry’, and suggested that Stone 62 at Stonehenge fitted the stone hole 91 at Waun Mawn. The reason this method is not used is somewhat obvious to even non-academics. You would need a crane to lift the stone vertically out of the hole to get an exact imprint. If you are taking out a stone by hand and/or with levers, you will rock it from side to side, destroying the stone hole impression, as we have seen with post holes in numerous excavations.
9. The program fails to report that the 40 carbon dates from wood found on the site did not come up with MPP’s magic date, and so he employed another form of Dating OSL (40:17) to find this single piece of evidence he desperately required. – Sadly, watching Dr Kim Kinnaird’s efforts to get a light, uncontaminated sample from over a fallen Stone summed up the state of archaeology as a science for me. Armed with a black weed blocker and a bicycle light on his head, he set forth to get a sample to prove MPP’s hypothesis. Anyone who considers this an effective way of obtaining an OSL sample is beyond scientific redemption, as logic would suggest; doing it at night would perhaps be more suitable. This was finally compounded when we saw him transporting the sample in his hand into the detector in daylight, which was pure icing on that flawed cake.
10. Roberts indicated (quite rightly) that ALL the dates were “way out” and all hopes were put on this one sample, MPP then claimed (42:20) “we had dated the thing, and it just before Stonehenge’s construction” (3300 BCE) – Sadly, and not report in the program, but within the Waun Mawn excavation report, there was not one OSL samples taken but 18, which gave results in the range of 6980+/- 2120 BCE to AD 1900 +/- 20. So the 17 dating sample did not verify MPP’s hypothesis, only a single one, which was dated 3530 +/- 330 (with that date range, the probability it’s 3300 BCE is slim!!).In fact, the OSL data in the review document suggested “removal of the stones” in 2120 +/- 520 BCE, long after the Stonehenge phase I.
11. The program then went onto a flight of fantasy for 15 minutes (25% OF AIR TIME) with unscientific mythology and astroarchaeology (which proved MORE that astroarchaeology doesn’t have any significance as the ‘expert’ suggested that the stones were ‘in the general direction’ of an alignment – which by the very nature of a stone circle of 360 degrees – every stone circle in the world is in the general direction of all astrological alignments!! Even more ludicrous came an idea that the Welsh culturally invaded England in 3300 BCE and took the stones of Waun Mawn with them –Sadly, at no point did the experts attempt to justify why Stonehenge had 56 Bluestones and the site at Waun Mawn had less than 30 at the most. Even if this idea were remotely true, why would you leave four stones behind when you are already going to be 30 stones short and need to go back and get some more from the quarry site?
12. The program never went into any detail of the OTHER carbon dates found at Waun Mawn, which would have allowed a balanced scientific program, allowing the viewer to decide whether MPP’s hypothesis was actually feasible. It presented speculation as fact, with a number of site workers and the presenter agreeing on MPP’s ideas without question or qualification – this is commonly known as ‘propaganda’ rather than scientific methodology. Moreover, the REAL evidence can be found in the report and shows that of the carbon dating evidence at Waun Mawn (the OSL data was excluded from the report accept a small paragraph without all data!) shows that of the 42 samples taken:
1 – sample were of 9th Millennium BCE
3 – samples were of the 8th Millennium BCE
8 – samples were of the 7th Millennium BCE
4 – samples were of the 6th Millennium BCE
10 – samples were of the 5th Millennium BCE
6 – samples were of the 4th Millennium BCE
11- samples from the 4th Millennium BCE to 17 AD.
13. The report on Waun Mawn contains other questionable evidence, which was excluded from the program. This includes the fact that the Aubrey holes at Stonehenge are ALL two to three times deeper than at Waun Mawn. This indicates that the Stonehenge Bluestones were made from larger bluestones than those at Waun Mawn (Stonehenge Bluestone hole 69 is over 1.5m deep, as it is long and thin). It looks as if the original stone circle at Waun Mawn was made up of stones similar in shape to the existing recumbent stone 13, which is 6– 7 feet tall and surrounded by a moat. The shape of recumbent 13 indicates that rather than the long thin bluestones as at Stonehenge, Waun Mawn had ‘fat bottomed’ domed ends and hence the need for only shallow ditches.
recumbent stone 13; Stonehenge: The Lost Circle RevealedStonehenge Bluestone 69 – a third is underground. Stonehenge: The Lost Circle Revealed
Conclusion
In conclusion, it seems that the BBC has produced a nice piece of archaeological propaganda that supports the current false ‘archaeological narrative’ of mythology and speculation, rather than tested and qualified scientific fact. This lack of ‘critical analysis’ is a clear indication of why the ‘science’ of archaeology has not progressed much over the last 50 years, even with modern technology, which it has incorporated to very limited success.
(Stonehenge’s The Lost Circle Revealed)
Memoir
I first met MPP on his excavation dig on the Avon in 2009, where he was preparing to announce his bluestone site, ‘Bluestonehenge’. At the time, we had a discussion about the date of the site, as he was convinced that (at that time) he believed it predated Stonehenge Phase I (we now know this was the first of many claims of a predated Stonehenge bluestone circle). I did point out that at the meeting that I thought this date would be incorrect as according to my research (of the surrounding 50 sites around Stonehenge) which was included in my published book and post-glacial flooded environment hypothesis ‘The Stonehenge Enigma’ in 2013 – that this site would have been below water as the River Avon would remain flooded throughout the Neolithic period. At this point, he ended the meeting and disappeared at such a rapid speed – it looked as if he thought I was clearly mad.
Later carbon dating proved my point and supported my hypothesis, as it is now accepted that Bluehenge was constructed between 2840 and 2230 BCE, in the Early Bronze Age.
PODCAST
Author’s Biography
Robert John Langdon, a polymathic luminary, emerges as a writer, historian, and eminent specialist in LiDAR Landscape Archaeology.
His intellectual voyage has been interwoven with stints as an astute scrutineer in government and grand corporate bastions, a tapestry spanning British Telecommunications, Cable and Wireless, British Gas, and the esteemed University of London.
A decade hence, Robert’s transition into retirement unfurled a chapter of insatiable curiosity. This phase saw him immerse himself in Politics, Archaeology, Philosophy, and the enigmatic realm of Quantum Mechanics. His academic odyssey traversed the venerable corridors of knowledge hubs such as the Museum of London, University College London, Birkbeck College, The City Literature Institute, and Chichester University.
In the symphony of his life, Robert is a custodian of three progeny and a pair of cherished grandchildren. His sanctuary lies ensconced in the embrace of West Wales, where he inhabits an isolated cottage, its windows framing a vista of the boundless sea – a retreat from the scrutinising gaze of Her Majesty’s Revenue and Customs, an amiable clandestinity in the lap of nature.
Exploring Prehistoric Britain: A Journey Through Time
My blog delves into the fascinating mysteries of prehistoric Britain, challenging conventional narratives and offering fresh perspectives grounded in cutting-edge research, particularly LiDAR technology. I invite you to explore some key areas of my research. For example, the Wansdyke, often cited as a defensive structure, is re-examined in light of new evidence. I’ve presented my findings in my blog post Wansdyke: A British Frontier Wall – ‘Debunked’, and a Wansdyke LiDAR Flyover video further visualises my conclusions.
My work also often challenges established archaeological dogma. I argue that many sites, such as Hambledon Hill, commonly identified as Iron Age hillforts, are not what they seem. My posts Lidar Investigation Hambledon Hill – NOT an ‘Iron Age Fort’ and Unmasking the “Iron Age Hillfort” Myth explore these ideas in detail and offer an alternative view. Similarly, sites like Cissbury Ring and White Sheet Camp receive re-evaluations based on LiDAR analysis in my posts “Lidar Investigation Cissbury Ring through time”and “Lidar Investigation White Sheet Camp,“ revealing fascinating insights into their true purpose. I have also examined South Cadbury Castle, often linked to the mythical Camelot56.
My research also extends to ancient water management, including the role of canals and other linear earthworks. I have discussed the true origins of Car Dyke in multiple posts, including Car Dyke – ABC News Podcast and Lidar Investigation Car Dyke – North Section, which suggest a Mesolithic origin 2357. I also explore the misidentification of Roman aqueducts, as seen in my posts on the Great Chesters (Roman) Aqueduct. My research has also been greatly informed by my post-glacial flooding hypothesis, which has helped explain landscape transformations over time. I have discussed this hypothesis in several posts, including AI now supports my Post-Glacial Flooding Hypothesis and Exploring Britain’s Flooded Past: A Personal Journey
For those interested in British Prehistory, visit www.prehistoric-britain.co.uk, a comprehensive resource featuring an extensive collection of archaeology articles, modern LiDAR investigations, and groundbreaking research. The site also includes insights and excerpts from the acclaimed Robert John Langdon Trilogy, a series of books that explore Britain during the Prehistoric period. Titles in the trilogy include The Stonehenge Enigma, Dawn of the Lost Civilisation, and The Post-Glacial Flooding Hypothesis, which offer compelling evidence of ancient landscapes shaped by post-glacial flooding.
To further explore these topics, Robert John Langdon has developed a dedicated YouTube channel featuring over 100 video documentaries and investigations that complement the trilogy. Notable discoveries and studies showcased on the channel include 13 Things that Don’t Make Sense in History and the revelation of Silbury Avenue – The Lost Stone Avenue, a rediscovered prehistoric feature at Avebury, Wiltshire.
In addition to his main works, Langdon has released a series of shorter, accessible publications, ideal for readers delving into specific topics. These include:
For active discussions and updates on the trilogy’s findings and recent LiDAR investigations, join our vibrant community on Facebook. Engage with like-minded enthusiasts by leaving a message or contributing to debates in our Facebook Group.
Whether through the books, the website, or interactive videos, we aim to provide a deeper understanding of Britain’s fascinating prehistoric past. We encourage you to explore these resources and uncover the mysteries of ancient landscapes through the lens of modern archaeology.
For more information, including chapter extracts and related publications, visit the Robert John Langdon Author Page. Dive into works such as The Stonehenge Enigma or Dawn of the Lost Civilisation, and explore cutting-edge theories that challenge traditional historical narratives.
In a recent instalment of Digging for Britain, Alice Roberts stirred the archaeological debate by asserting that the Dorset Chalk Giant at Cerne Abbas had Saxon origins rather than prehistoric roots. This added a layer of intrigue, especially from a landscape archaeology perspective. At first glance, the giant’s features appear to echo a much earlier connection, reminiscent of other chalk figures found elsewhere in Britain, where their placement within the landscape suggests a deeper, functional context.
Curiosity led to a closer look at the methods used to date this iconic figure, and the findings raise several important questions. While the programme presents a clear and confident conclusion, a deeper inspection reveals fundamental issues and omissions that call into question its reliability. This is not just about one site but about broader methodological problems in archaeology, particularly the uncritical acceptance of dating approaches that underpin many historical assumptions.
Small trenches for dating evidence
The primary technique involved excavating four small trenches and penetrating approximately 1 m into the topsoil to extract samples. The underlying assumption is that the surface beneath the chalk line represents the original ground level and therefore provides the latest possible date for the figure’s creation. While the theory itself is not unreasonable, the reliance on just four sampling points raises serious concerns about the representativeness of the results.
To fully support such a method, variations across the entire area beneath the figure would need to be taken into account. Limited sampling introduces the risk of missing key variations in the soil and sediment, which could significantly alter the dating outcome. Scientific investigation depends on comprehensive data, and without it, conclusions remain open to question.
Snail used to date the chalk figuare
In addition, the programme does not fully explore alternative interpretations or the potential impact of environmental processes on the site. This becomes particularly important when considering evidence from other studies, in which larger datasets have shown a wide range of dates from similar contexts. In one such case, forty-two samples produced dates ranging from the ninth millennium BCE through to the historic period, yet only a subset was used to support the final interpretation. This raises an obvious question about the selection and exclusion of data.
The reliance on a very small number of samples for OSL dating introduces a substantial margin of uncertainty. Across a large area such as this, variation is expected. With such limited data, the resulting data range cannot be considered definitive. The methodology, including how samples are collected and interpreted, does not meet the level of precision expected in modern scientific analysis.
There is also a fundamental geological factor that appears to have been overlooked. The site sits on a steep slope, where soil creep is an ongoing process. Even at a conservative rate, soil can move approximately one metre over a thousand years. This means that materials such as snails and sediments beneath the figure are not necessarily in their original position. Over long periods, they can be displaced downslope, disconnecting them from the original context to which they were dated.
The physical construction of the figure itself also raises questions. The current form sits within topsoil rather than being cut directly into the underlying chalk bedrock. From a practical perspective, a prehistoric construction would be more logically cut into solid chalk to ensure durability and reduce maintenance needs. The fact that the figure requires ongoing upkeep suggests a different history, potentially involving phases of covering and reworking.
Historical accounts suggest that subsequent activity may have altered or preserved the figure, raising the possibility that what is visible today is not the original construction. This opens the question of whether an earlier figure existed beneath the current one, potentially modified or replaced at a later date.
The landscape context adds further complexity. The figure is positioned at the edge of a range of hills rather than at its highest point, and its full form is clearly visible only from elevated viewpoints. This challenges the idea of it functioning as a simple ground-level marker and instead suggests that its placement may relate to a broader landscape system that is no longer immediately visible.
When all of these factors are considered together, the conclusion presented in the programme appears far less certain than initially suggested. The evidence does not point to a simple, single-phase construction, but rather to a more complex history influenced by geological processes, environmental change, and possible later modification.
Archaeological interpretation must remain grounded in robust, testable methods. When conclusions rely on limited data, untested assumptions, or incomplete consideration of environmental factors, they risk presenting certainty where uncertainty remains.
The current Figuare sits on top of the soil with broken chalk that needs constant maintenance
The Dorset Chalk Giant is not a straightforward case. It is a reminder that understanding the past requires not just data, but careful evaluation of how that data is gathered, interpreted, and applied.
The next stage of analysis will examine the wider landscape using LiDAR data, with the aim of reconstructing how this site functioned in a prehistoric environment and what it may originally have represented.
The Giant is to the far right of the Hill Range and near the bottom – why not at the top of the middle if it’s a marker?
Part 2
Now, in this second part, our focus shifts to the professionalism of archaeologists involved in such endeavours and, by extension, the broader state of the archaeological profession in the 21st century. A critical lens is turned towards the National Trust’s excavation efforts, particularly the four trenches dedicated to OSL dating. Despite the extensive timeframe of over two years for this undertaking, the conspicuous absence of an official report raises concerns about transparency and the ability of other knowledgeable individuals to conduct scrutiny. This delay in producing and sharing findings with the wider community calls into question the efficiency and accessibility of archaeological information.
The quality of documentation further comes into question, as hand-drawn cross-sections, seemingly rushed and lacking the meticulous detail expected in rigorous scientific practices, were presented. This not only reveals an apparent ‘back of an envelope’ approach but also underscores a profound oversight by the experts. Despite having two years for scrutiny and examination, critical questions were left unexplored, a shortcoming magnified by the collaboration with the BBC for the televised program.
Digging for Britain Debunked – Cerne Abbas
Cerne Abbas
The absence of a comprehensive and timely report, coupled with the apparent lack of attention to detail in documentation, casts doubt on the thoroughness and professionalism of the archaeological efforts surrounding Cerne Abbas. The urgency to present findings to the media and create a documentary may have compromised the meticulousness required in archaeological endeavours.
This prompts a broader reflection on the state of the archaeological profession itself. The slow pace of report publication, potential gaps in expertise, and a seeming reluctance to subject findings to rigorous scrutiny raise concerns about the discipline’s agility and accountability in contemporary times.
The deficiencies in the excavation process around Cerne Abbas become more apparent when we scrutinise the placement of the trenches and the sampling locations. The hand-drawn illustrations (which I consider ‘outdated’ in an era of affordable, widely available 3D high-definition cameras) indicate that samples were taken from the topsoil just above the chalk bedrock. However, a photograph reveals a more accurate location at the bottom of the topsoil, near the chalk bedrock, leading to the conclusion that it is Saxon.
Poor Conclusions
A critical oversight emerges when we consider the implications of the Saxon date. If accurate, the absence of topsoil dating back thousands of years raises intriguing questions. Three plausible scenarios are explored: the deliberate removal of soil before the construction of Cerne Abbas, the initial absence of soil, or inaccuracies in OSL dating.
Option one, soil removal, implies an intention to obliterate what was originally present, raising logistical questions about the necessity for such an extensive process compared to the simplicity of laying new lines on existing chalk.
Option two speculates on the absence of soil due to something atop the bedrock, a theory we will delve into further.
Option three questions the accuracy of OSL dates, which, if proven, could cast doubt on the entire OSL science.
Option two gains credence when exploring the Post-Glacial Hypothesis, which is grounded in the notion of elevated sea levels in prehistoric times. LiDAR imagery of the site reveals a landscape shaped by Mesolithic waters, with identified natural harbours and Neolithic camps indicating the higher historical river levels. Archaeological findings, including tools and earthworks, support the hypothesis that the river running parallel to the figure was significantly higher during the Neolithic period.
Mesolithic Coastline – Digging for Britain Debunked – Cerne Abbas
Prehistoric Landscape
This scenario accounts for approximately 7,000 years with no topsoil in the figure. Examining the bedrock reveals signs of extensive water weathering, consistent with chalk erosion over thousands of years. The excavation report and photographs reveal broken chalk at the base of the topsoil, indicating water-induced erosion and redeposition. The darkened appearance, a result of drying after being broken and re-laid on top, mirrors the common impact of water on solid chalk.
Digging for Britain Debunked – Cerne Abbas
Further evidence points to Post-Glacial Flooding and a Neolithic origin of the figure, which strategically marks the entrance to the harbour. LiDAR maps suggest a man balancing a load on his shoulders or head, potentially representing a trading centre surrounded by quarries and mining pits.
Lidar showing the deep chalk cuttings – Digging for Britain Debunked – Cerne AbbasOriginal Cerne Abbas figure according to AI – Digging for Britain Debunked – Cerne Abbas
The intricacies of Cerne Abbas, when viewed through the lens of geological processes and archaeological evidence, unfold a narrative of ancient landscapes shaped by water, a figure emerging from millennia of erosion, and a Neolithic trading hub leaving its mark on the chalky canvas of history.
Long Man of Wilmington
NB. The findings at The Long Man of Wilmington by Prof. Martin Bell show very similar findings and geology as Cerne Abbas –
“Our method was to machine cut a trench at the base of the slope to look at the sediment sequence, then carefully hand excavate an adjoining strip, recording in three dimensions the positions of all artefacts, no matter how modern, in order to date each layer.
At the base of our trench, there were chalk meltwater muds from a time of rapid physical weathering at the end of the last Ice Age. Above these were bowl-shaped features, perhaps tree-throw pits, because they contained land snails from woodland habitats, indicating that this part of the slope had been wooded earlier in the Postglacial. They also contained some flint flakes, so they could be archaeological features.
Over this was a buried soil. Ed Rhodes, formerly of the Research Laboratory for Archaeology at Oxford, now of the Australian National University, has used OSL to date this soil to the mid-2nd millennium BC. The snails show that by this time, the landscape was open. Later in the Bronze Age, the soil was buried by more soil derived from cultivation at the base of the slope. Snails show that the escarpment above was grassland. Many sites on the South Downs show evidence for quite extensive Bronze Age soil erosion. Bronze Age and Neolithic pottery and flints from the basal soil and the colluvium indicate that a settlement was nearby.”
They called the broken chalk we saw in these excavations ‘chalk meltwater muds’, and he is correct, but this kind of deposit can only be produced by thousands of years of water erosion, not a couple of hundred, and his OSL dates confirm this, as just above this level is an OSL date of 2,000 BCE. We have 8,000 years of topsoil missing as the site, like Carne Abbass, was covered with river water, creating another natural harbour – and would you believe it – it also has a Neolithic.
PODCAST
Author’s Biography
Robert John Langdon, a polymathic luminary, emerges as a writer, historian, and eminent specialist in LiDAR Landscape Archaeology.
His intellectual voyage has been interwoven with stints as an astute scrutineer in government and grand corporate bastions, a tapestry spanning British Telecommunications, Cable and Wireless, British Gas, and the esteemed University of London.
A decade hence, Robert’s transition into retirement unfurled a chapter of insatiable curiosity. This phase saw him immerse himself in Politics, Archaeology, Philosophy, and the enigmatic realm of Quantum Mechanics. His academic odyssey traversed the venerable corridors of knowledge hubs such as the Museum of London, University College London, Birkbeck College, The City Literature Institute, and Chichester University.
In the symphony of his life, Robert is a custodian of three progeny and a pair of cherished grandchildren. His sanctuary lies ensconced in the embrace of West Wales, where he inhabits an isolated cottage, its windows framing a vista of the boundless sea – a retreat from the scrutinising gaze of Her Majesty’s Revenue and Customs, an amiable clandestinity in the lap of nature.
Exploring Prehistoric Britain: A Journey Through Time
My blog delves into the fascinating mysteries of prehistoric Britain, challenging conventional narratives and offering fresh perspectives grounded in cutting-edge research, particularly LiDAR technology. I invite you to explore some key areas of my research. For example, the Wansdyke, often cited as a defensive structure, is re-examined in light of new evidence. I’ve presented my findings in my blog post Wansdyke: A British Frontier Wall – ‘Debunked’, and a Wansdyke LiDAR Flyover video further visualises my conclusions.
My work also often challenges established archaeological dogma. I argue that many sites, such as Hambledon Hill, commonly identified as Iron Age hillforts, are not what they seem. My posts Lidar Investigation Hambledon Hill – NOT an ‘Iron Age Fort’ and Unmasking the “Iron Age Hillfort” Myth explore these ideas in detail and offer an alternative view. Similarly, sites like Cissbury Ring and White Sheet Camp receive re-evaluations based on LiDAR analysis in my posts “Lidar Investigation Cissbury Ring through time”and “Lidar Investigation White Sheet Camp,“ revealing fascinating insights into their true purpose. I have also examined South Cadbury Castle, often linked to the mythical Camelot56.
My research also extends to ancient water management, including the role of canals and other linear earthworks. I have discussed the true origins of Car Dyke in multiple posts, including Car Dyke – ABC News Podcast and Lidar Investigation Car Dyke – North Section, which suggest a Mesolithic origin 2357. I also explore the misidentification of Roman aqueducts, as seen in my posts on the Great Chesters (Roman) Aqueduct. My research has also been greatly informed by my post-glacial flooding hypothesis, which has helped explain landscape transformations over time. I have discussed this hypothesis in several posts, including AI now supports my Post-Glacial Flooding Hypothesis and Exploring Britain’s Flooded Past: A Personal Journey
For those interested in British Prehistory, visit www.prehistoric-britain.co.uk, a comprehensive resource featuring an extensive collection of archaeology articles, modern LiDAR investigations, and groundbreaking research. The site also includes insights and excerpts from the acclaimed Robert John Langdon Trilogy, a series of books that explore Britain during the Prehistoric period. Titles in the trilogy include The Stonehenge Enigma, Dawn of the Lost Civilisation, and The Post-Glacial Flooding Hypothesis, which offer compelling evidence of ancient landscapes shaped by post-glacial flooding.
To further explore these topics, Robert John Langdon has developed a dedicated YouTube channel featuring over 100 video documentaries and investigations that complement the trilogy. Notable discoveries and studies showcased on the channel include 13 Things that Don’t Make Sense in History and the revelation of Silbury Avenue – The Lost Stone Avenue, a rediscovered prehistoric feature at Avebury, Wiltshire.
In addition to his main works, Langdon has released a series of shorter, accessible publications, ideal for readers delving into specific topics. These include:
For active discussions and updates on the trilogy’s findings and recent LiDAR investigations, join our vibrant community on Facebook. Engage with like-minded enthusiasts by leaving a message or contributing to debates in our Facebook Group.
Whether through the books, the website, or interactive videos, we aim to provide a deeper understanding of Britain’s fascinating prehistoric past. We encourage you to explore these resources and uncover the mysteries of ancient landscapes through the lens of modern archaeology.
For more information, including chapter extracts and related publications, visit the Robert John Langdon Author Page. Dive into works such as The Stonehenge Enigma or Dawn of the Lost Civilisation, and explore cutting-edge theories that challenge traditional historical narratives.
Recently, I received a message from my friend Chris at Lambourne Photography, who shared new winter photos of Avebury. The landscape, experiencing recorded rainfall, has begun to flood, capturing my keen interest. This flooding aligns with the predictions in my prehistoric Avebury maps, considering the post-glacial flooding during the Mesolithic period (10k to 4k BCE) – (Real-World Confirmation of Post-Glacial Flooding)
Copyright – Lambourne Photography (Real-World Confirmation of Post-Glacial Flooding)
It’s intriguing that Avebury received 70mm (3 inches) of rain over the last 30 days. However, reflecting on the end of the Ice Age and the substantial melt, Avebury would have encountered the equivalent of 98,425 inches of rain. Common sense implies that this area would have experienced significant flooding, corroborated by the British Geological Maps, albeit not entirely accurate, which illustrate the extent of post-glacial flooding, with the Kennet River ten times wider than its present size. (Avebury Post-Glacial Flooding)
Avebury Post-Glacial Flooding
The photographs depict the flooding extending West around the Avebury Stone circle—as indicated on both British Geological Survey (BGS) map but more precisely with the area indicated in my LiDAR maps. This serves as empirical evidence supporting the Post-Glacial Flooding Hypothesis and reinforces my assertion that LiDAR is the paramount landscape-mapping tool, regrettably underutilised by archaeologists to their disadvantage.(Avebury Post-Glacial Flooding)
Avebury Post-Glacial Flooding
The significance of this was underscored in the recent episode of ‘Digging for Britain,’ where a settlement was discovered. The attempt to justify its location and function relied on a modern OS map, leading to an absurd and inaccurate conclusion—namely, that it served a ceremonial purpose rather than a functional trading place at the river’s edge. This further underscores the limitations of traditional mapping methods and the value that LiDAR brings to understanding past topologies. (Avebury Post-Glacial Flooding)
Avebury through time
In the heart of Wiltshire, England, lies the UNESCO World Heritage Site of Avebury, shrouded in mystery and wonder. For years, archaeologists and historians have delved into its enigmatic past, uncovering secrets buried beneath layers of time and earth. Yet, Avebury still held one final, astonishing revelation waiting to be unearthed, and it was the relentless pursuit of author and cartographer Robert John Langdon that would shed light on this long-forgotten secret.
Silbury Hill showing how the Kennet Flooded around the base – Avebury Post-Glacial Flooding copyright Lambourne Photography
Avebury, with its iconic stone circles and ancient monuments, has fascinated explorers and scholars for centuries. Among its well-known features are ‘West Kennet Avenue’ and ‘Beckhampton Avenue,’ both adorned with colossal stones that still stand as silent sentinels of a long-gone age. These avenues have been pivotal in our understanding of Avebury’s past, connecting the spiritual and historical aspects of this sacred site. However, Langdon’s unrelenting quest to unravel Avebury’s mysteries led him down an uncharted path, one that would challenge conventional wisdom and rewrite the history of this remarkable place.
Langdon’s journey was marked by meticulous mapping and years of research, culminating in a hypothesis that would reshape our understanding of prehistoric Britain. He proposed that much of the British Isles had once been submerged in the aftermath of the last ice age, with these ancient sites strategically positioned along the ancient shorelines. His groundbreaking maps offered a fresh perspective, suggesting that Avebury had functioned as a bustling trading hub for our ancient ancestors. This audacious theory challenged the prevailing notion that prehistoric societies were isolated and disconnected, instead highlighting their sophistication in trade and commerce.
At the heart of this newfound understanding was the colossal enigma of Silbury Hill, the largest man-made monument in prehistoric Europe. Silbury Hill had confounded archaeologists for generations, with theories ranging from religious symbolism to ceremonial significance. Yet, Langdon boldly proclaimed that Silbury Hill had a far more practical and ingenious purpose—an ancient ‘Lighthouse’ that guided seafarers to the trading port of Avebury.
This notion, while revolutionary, was not without evidence. Langdon explained that his research indicated that Silbury Hill had indeed flooded in the distant past, making it logical to assume that it was repurposed as a harbour when the waters receded from the main Avebury site. The construction of Silbury Hill in stages, starting small and gradually growing taller, suggested a pragmatic approach rather than a symbolic one. According to Langdon, the height of the mound would have served as a beacon, attracting ships and boats to the trading centre and making it an essential feature for maritime navigation.
River Kennet to the West of Avebury and Parts of the Stone Circle Ditches Flooding – Avebury Post-Glacial Flooding (copyright Lambourne Photography)
To many, Langdon’s claims may seem audacious, but they align with the findings of dowsers in 2011. At the top of the newly discovered Stone Avenue, these dowsers found a series of stone holes precisely where Langdon’s photographic evidence indicated they were. The convergence of these findings strengthened Langdon’s case, providing compelling support for his audacious theory.
Avebuery Stone Circle ditches flooding first time in 6,000 years? -Avebury Post-Glacial Flooding (copyright Lambourne Photography)
While confirmation through excavation is the next logical step, Langdon’s research has already ignited a vibrant discussion within the archaeological and historical communities. His perspective challenges our preconceived notions of prehistoric Britain, revealing a thriving civilisation that engaged in far-reaching trade and commerce. The idea of Avebury as a bustling trading hub paints a picture of interconnectedness and shared culture, where societies traded not only goods but also ideas, beliefs, and traditions.
River Kennet returning to its prehistoric width – Avebury Post-Glacial Flooding (copyright Lambourne Photography)
In the realm of historical discovery, it is often the audacious thinkers, the mavericks who dare to question established narratives, who propel our understanding forward. Robert John Langdon is undeniably one of these thinkers. With a deep passion for history and an unyielding commitment to his research, he has unearthed a hidden chapter in the story of Avebury—one that transcends time and offers fresh insights into our shared human history.
As Langdon’s trilogy, ‘The Stonehenge Enigma,’ continues to explore these groundbreaking theories, it beckons us to embark on a journey of discovery, to challenge our assumptions, and to embrace the possibility that the past is far more complex and interconnected than we ever imagined. Avebury, with its ancient stones and enigmatic avenues, continues to whisper its secrets to those who dare to listen, inviting us to see history through a new lens—one illuminated by the audacious vision of Robert John Langdon.
(Real-World Confirmation of Post-Glacial Flooding)
The Silbury Lighthouse and the Flooded Stones: 4 Surprising Truths About Prehistoric Avebury
When winter rains recently swept across Avebury, the resulting floods captured by Lambourne Photography did more than just saturate the soil. For those looking closely, the rising waters acted as a real-time simulation of a long-lost era, providing empirical evidence for a landscape we have forgotten. These modern pools align perfectly with prehistoric maps, offering a glimpse into the landscape as it existed during the Mesolithic period between 10,000 and 4,000 BCE.
According to author and cartographer Robert John Langdon, this contemporary flooding is the “ground truth” for his Post-Glacial Flooding Hypothesis. While we see a landscape of dry fields and small streams today, the geological evidence suggests a much more aqueous past. By observing how the water moves now, we can begin to understand why our ancestors chose this specific site for their most massive monuments.
(Real-World Confirmation of Post-Glacial Flooding)
The 98,000-Inch Rain: Reimagining the Post-Glacial Landscape
To understand the scale of the ancient environment, we must look at the sheer volume of water released at the end of the last Ice Age. While Avebury recently made headlines for receiving 3 inches (70mm) of rain in a month, that is a mere drop compared to the post-glacial melt. Langdon calculates that during the ice melt, the region would have encountered the equivalent of 98,425 inches of rain.
This massive influx of water transformed the geography of Wiltshire into something unrecognisable to modern eyes. While British Geological Survey (BGS) maps are not entirely accurate in every respect, they provide vital corroboration of this watery reality.
“Common sense implies that this area would have experienced significant flooding, corroborated by the British Geological Maps, albeit not entirely accurate, illustrating the extent of post-glacial flooding with the Kennet River ten times wider than its present size.”
Traditional archaeological interpretations often lack this “common sense” approach, failing to account for the significant role that higher water levels played in dictating human activity. By ignoring the geological reality of a wider Kennet River, we miss the primary reason why these sites were established. These monuments were not random; they were strategically positioned along the ancient shorelines of a flooded world.
(Real-World Confirmation of Post-Glacial Flooding)
Trading Hub or Temple? The Functional Shift
For decades, the “ceremonial” label has been the default explanation for almost every prehistoric site in Britain. However, Langdon argues that this view is an absurdity born from using modern Ordnance Survey maps to define ancient functions. A recent episode of ‘Digging for Britain’ highlighted this disconnect when a settlement found at the river’s edge was labelled ceremonial simply because its location didn’t make sense on a modern map.
When viewed through the lens of higher water levels, Avebury reveals itself not as an isolated temple but as a bustling trading hub. These colossal stones stand as silent sentinels to an age when the site was a centre for commerce and maritime interaction. This reinterpretation suggests a sophisticated, interconnected society that utilised Britain’s waterways for trade, rather than a collection of isolated, ritual-obsessed tribes.
By acknowledging the strategic placement of the shoreline, we see that the builders were master logisticians. They utilised the landscape’s natural hydrology to facilitate movement and exchange. The whispers of the past suggest that Avebury was the heart of a vibrant, seafaring economic network.
(Real-World Confirmation of Post-Glacial Flooding)
The Silbury Lighthouse: A Beacon for Ancient Mariners
Silbury Hill stands as the largest man-made monument in Europe, yet its purpose has remained one of archaeology’s greatest enigmas. While often dismissed as a religious or symbolic mound, the Post-Glacial Flooding Hypothesis provides a far more pragmatic explanation. Langdon suggests that as the waters receded, Silbury Hill was constructed in stages to serve as maritime infrastructure.
Rather than a silent grave or a place of worship, the mound functioned as a guide for those navigating the flooded plains.
“Silbury Hill had a far more practical and ingenious purpose—an ancient ‘Lighthouse’ that guided seafarers to the trading port of Avebury.”
This maritime theory explains why the hill was built in stages, growing taller over time to remain visible as a beacon for incoming ships. Langdon’s research further indicates that as the climate changed, the site was eventually repurposed as a harbour when the waters receded from the main Avebury site. This transformation into a piece of sophisticated nautical infrastructure completely changes our perspective on the engineering capabilities of prehistoric Britons.
(Real-World Confirmation of Post-Glacial Flooding)
LiDAR: The Paramount Tool Archaeologists Are Missing
The key to unlocking these secrets lies in LiDAR (Light Detection and Ranging) technology, which allows researchers to see “past topologies” hidden by modern development. Langdon asserts that LiDAR is the most important landscape mapping tool available, yet it remains tragically underutilised by traditional archaeologists. This technology revealed exactly where the ancient shorelines met the monuments and identified lost features like “Silbury Avenue – the Lost Stone Avenue.”
The accuracy of this mapping was strikingly confirmed in 2011 by dowsing results at the top of this newly discovered avenue. Dowsers located stone holes in the exact positions that Langdon’s LiDAR-based research had predicted. This convergence of high-tech scans and physical evidence is forcing a total rewrite of British history.
By using LiDAR to strip away modern distractions, we can finally see the strategic logic of the Mesolithic builders. The technology proves that the landscape was shaped by water levels we are only now beginning to map correctly. It is no longer a matter of speculation, but a matter of seeing the evidence hidden in the earth itself.
(Real-World Confirmation of Post-Glacial Flooding)
Conclusion: Whispers from the Ancient Shoreline
The “Post-Glacial Flooding Hypothesis” invites us to view the British landscape not as a static collection of fields but as a dynamic environment. Avebury changes from a site of mystery into a monument of human ingenuity and maritime success. Our ancestors were not just building stone circles; they were constructing a society centred on water.
As we uncover more evidence of this interconnected world, we must ask ourselves: are we ready to see history through a new lens? Are we prepared to accept that the past is far more complex and strategically minded than we ever imagined?
(Real-World Confirmation of Post-Glacial Flooding)
PODCAST
Author’s Biography
Robert John Langdon, a polymathic luminary, emerges as a writer, historian, and eminent specialist in LiDAR Landscape Archaeology.
His intellectual voyage has been interwoven with stints as an astute scrutineer in government and grand corporate bastions, a tapestry spanning British Telecommunications, Cable and Wireless, British Gas, and the esteemed University of London.
A decade hence, Robert’s transition into retirement unfurled a chapter of insatiable curiosity. This phase saw him immerse himself in Politics, Archaeology, Philosophy, and the enigmatic realm of Quantum Mechanics. His academic odyssey traversed the venerable corridors of knowledge hubs such as the Museum of London, University College London, Birkbeck College, The City Literature Institute, and Chichester University.
In the symphony of his life, Robert is a custodian of three progeny and a pair of cherished grandchildren. His sanctuary lies ensconced in the embrace of West Wales, where he inhabits an isolated cottage, its windows framing a vista of the boundless sea – a retreat from the scrutinising gaze of Her Majesty’s Revenue and Customs, an amiable clandestinity in the lap of nature.
Exploring Prehistoric Britain: A Journey Through Time
My blog delves into the fascinating mysteries of prehistoric Britain, challenging conventional narratives and offering fresh perspectives grounded in cutting-edge research, particularly LiDAR technology. I invite you to explore some key areas of my research. For example, the Wansdyke, often cited as a defensive structure, is re-examined in light of new evidence. I’ve presented my findings in my blog post Wansdyke: A British Frontier Wall – ‘Debunked’, and a Wansdyke LiDAR Flyover video further visualises my conclusions.
My work also often challenges established archaeological dogma. I argue that many sites, such as Hambledon Hill, commonly identified as Iron Age hillforts, are not what they seem. My posts Lidar Investigation Hambledon Hill – NOT an ‘Iron Age Fort’ and Unmasking the “Iron Age Hillfort” Myth explore these ideas in detail and offer an alternative view. Similarly, sites like Cissbury Ring and White Sheet Camp receive re-evaluations based on LiDAR analysis in my posts “Lidar Investigation Cissbury Ring through time”and “Lidar Investigation White Sheet Camp,“ revealing fascinating insights into their true purpose. I have also examined South Cadbury Castle, often linked to the mythical Camelot56.
My research also extends to ancient water management, including the role of canals and other linear earthworks. I have discussed the true origins of Car Dyke in multiple posts, including Car Dyke – ABC News Podcast and Lidar Investigation Car Dyke – North Section, which suggest a Mesolithic origin 2357. I also explore the misidentification of Roman aqueducts, as seen in my posts on the Great Chesters (Roman) Aqueduct. My research has also been greatly informed by my post-glacial flooding hypothesis, which has helped explain landscape transformations over time. I have discussed this hypothesis in several posts, including AI now supports my Post-Glacial Flooding Hypothesis and Exploring Britain’s Flooded Past: A Personal Journey
For those interested in British Prehistory, visit www.prehistoric-britain.co.uk, a comprehensive resource featuring an extensive collection of archaeology articles, modern LiDAR investigations, and groundbreaking research. The site also includes insights and excerpts from the acclaimed Robert John Langdon Trilogy, a series of books that explore Britain during the Prehistoric period. Titles in the trilogy include The Stonehenge Enigma, Dawn of the Lost Civilisation, and The Post-Glacial Flooding Hypothesis, which offer compelling evidence of ancient landscapes shaped by post-glacial flooding.
To further explore these topics, Robert John Langdon has developed a dedicated YouTube channel featuring over 100 video documentaries and investigations that complement the trilogy. Notable discoveries and studies showcased on the channel include 13 Things that Don’t Make Sense in History and the revelation of Silbury Avenue – The Lost Stone Avenue, a rediscovered prehistoric feature at Avebury, Wiltshire.
In addition to his main works, Langdon has released a series of shorter, accessible publications, ideal for readers delving into specific topics. These include:
For active discussions and updates on the trilogy’s findings and recent LiDAR investigations, join our vibrant community on Facebook. Engage with like-minded enthusiasts by leaving a message or contributing to debates in our Facebook Group.
Whether through the books, the website, or interactive videos, we aim to provide a deeper understanding of Britain’s fascinating prehistoric past. We encourage you to explore these resources and uncover the mysteries of ancient landscapes through the lens of modern archaeology.
For more information, including chapter extracts and related publications, visit the Robert John Langdon Author Page. Dive into works such as The Stonehenge Enigma or Dawn of the Lost Civilisation, and explore cutting-edge theories that challenge traditional historical narratives.
In the vast tapestry of human history, there are moments when a single technological shift forces us to stop… reassess… and begin again. (How Lidar will change Archaeology)
Innovation in Archaeology has always pushed the boundaries of understanding.
LiDAR is one of those moments.
For centuries, archaeology has relied on what could be seen from the ground — fragments of banks, ditches, crop marks, and partial excavations. From these fragments, entire narratives have been constructed. Boundaries have been drawn. Timelines fixed. Functions assumed.
With tools like LiDAR, the field of Archaeology is evolving rapidly.
But what happens… when we can suddenly see everything?
Not just isolated sections… but entire landscapes… in full resolution… stripped of vegetation… revealed exactly as they were left.
Lost Myan Structues found by LiDAR Archaeology
This paradigm shift in Archaeology is crucial for future research.
That is what LiDAR has done.
And what it is revealing… is not a refinement of existing theories.
It is their collapse.
New findings in Archaeology challenge our previous beliefs.
The Illusion of the “Defensive Dyke”
Linear Earthworks have long been interpreted through a single dominant lens:
👉 Defence 👉 Territory 👉 Warfare
From Offa’s Dyke to Wansdyke, from the Antonine Wall to the Vallum, the assumption has remained largely unchanged — these were barriers. Lines in the landscape built to divide people.
But this interpretation was never based on full evidence.
It was based on partial observation.
(How Lidar will change Archaeology)
Ground surveys… fragmented excavation… and most importantly… a pre-existing belief that these features must be defensive.
LiDAR removes that limitation.
Understanding landscapes through Archaeology offers fresh insights.
These revelations in Archaeology reveal ancient practices.
And when you remove the trees… the crops… and the modern landscape noise…
A very different picture emerges.
Car Dyke — Britain’s Longest Engineered Water System
One of the most striking discoveries is the true scale of Car Dyke.
In Archaeology, understanding water management is critical.
Previously understood as a Roman drainage feature… its full extent was never properly mapped or understood.
LiDAR changes that completely.
For the first time, we can trace its continuous form across the landscape — revealing it not as a fragmented ditch… but as Britain’s longest engineered linear earthwork.
And critically…
Its form is not defensive.
It is hydrological.
(How Lidar will change Archaeology)
Its consistent alignment… its relationship to natural gradients… and its integration with surrounding water systems…
Through Archaeology, we can explore human ingenuity.
All point to a single conclusion:
👉 Car Dyke is a canal system.
Not symbolic. Not territorial. But functional.
Designed to move water… manage flow… and connect landscapes.
(How Lidar will change Archaeology)
Collaboration in Archaeology is vital for comprehensive studies.
Wansdyke — Not One Dyke, But Two
LiDAR has also resolved one of the long-standing inconsistencies surrounding Wansdyke.
The role of community in Archaeology cannot be overstated.
Traditionally treated as a single continuous defensive structure, its gaps and inconsistencies have always been difficult to explain.
Now we can see why.
Because it isn’t one structure.
👉 It is two completely separate dykes.
The gaps in Wansdyke proves its not a defensive feature but once held water
Constructed in different periods, with thousands of years between them.
Their alignments… their construction profiles… and their landscape relationships do not match.
They have been artificially combined into a single narrative… because that narrative required them to be one.
LiDAR shows they are not.
And once separated…
The defensive model collapses entirely.
(How Lidar will change Archaeology)
Insights from Archaeology reveal the complexities of history.
Offa’s Dyke — The Missing 60%
Perhaps the most telling example of interpretive bias is Offa’s Dyke.
For decades, it has been presented as a continuous Mercian frontier — a monumental defensive barrier dividing England and Wales.
Offa’s Dyke nr Chepstow – shows not only is it not (as reported by Cecil Fox) a defensive structure against the Welsh but a Cross-Dyke
But LiDAR reveals a critical truth:
👉 Around 60% of Offa’s Dyke is missing.
Not eroded. Not damaged. Not hidden.
Simply… never there.
What has been presented as a continuous defensive structure is in reality a series of disconnected segments.
And those segments do not behave like a defensive line.
New methodologies in Archaeology enhance our understanding.
They align as cross-dykes — interacting with the landscape rather than dominating it.
The earlier surveys… most notably those influenced by Cecil Fox… were not neutral observations.
They were shaped by the assumption of defence.
And once that assumption is removed…
The structure no longer supports the theory.
(How Lidar will change Archaeology)
The Vallum — Not a Barrier, But a Transport System
The Vallum, running alongside Hadrian’s Wall, has long been described as a defensive ditch — part of a complex military boundary.
But again… this interpretation struggles under scrutiny.
Its position… its scale… and its relationship to the Wall itself raise a fundamental question:
Why build a defensive ditch behind your primary defensive structure?
LiDAR provides the answer.
The Vallum aligns not as a barrier… but as a controlled linear corridor.
A route.
A system.
(How Lidar will change Archaeology)
👉 A transport mechanism.
Used to move materials — including the massive stones required for Hadrian’s Wall — efficiently across the landscape.
Not defence…
But logistics.
(How Lidar will change Archaeology)
A New Interpretation — Water, Not War
When these examples are brought together, a pattern becomes impossible to ignore:
Car Dyke — a canal
Wansdyke — multiple phases, not a single barrier
Offa’s Dyke — incomplete, non-defensive
Vallum — transport, not fortification
(How Lidar will change Archaeology)
These are not isolated anomalies.
They are part of a systemic misinterpretation.
A framework built on the assumption that ancient societies primarily built to defend… divide… and control territory.
LiDAR shows something very different.
👉 They built to manage water 👉 They built to connect landscapes 👉 They built to enable movement and trade
In short…
They engineered environments.
(How Lidar will change Archaeology)
The Hydrological Civilisation
What LiDAR is revealing is not just new data…
But a new type of civilisation.
One that understood:
Water flow
Landscape gradients
Seasonal variation
Long-term environmental change
These Linear Earthworks are not crude barriers.
They are precision-built systems.
And when viewed through the lens of hydrology rather than warfare…
They begin to make sense.
(How Lidar will change Archaeology)
Conclusion — The End of Assumption-Based Archaeology
It removes interpretation… and replaces it with visibility.
No longer are we limited to fragments.
No longer can gaps be filled with assumption.
The landscape is now visible in its entirety.
The Antonine Wall was originally a Dyke
And what it shows… is clear:
👉 The defensive model of Linear Earthworks in Archaeology is no longer sustainable 👉 The traditional surveys in Archaeology were incomplete — and in many cases, biased 👉 A hydrological and engineering interpretation fits the evidence more closely
LiDAR does something archaeology has long struggled with:
This is not a minor adjustment.
It is a fundamental shift.
(How Lidar will change Archaeology)
A moment where technology forces us to reconsider everything we thought we knew.
As Jacob Bronowski once championed — knowledge advances not by defending old ideas…
…but by having the courage to replace them.
LiDAR has given us that opportunity.
The question now is:
👉 Will archaeology take it?
(How Lidar will change Archaeology)
PodCast
Author’s Biography
Robert John Langdon, a polymathic luminary, emerges as a writer, historian, and eminent specialist in LiDAR Landscape Archaeology.
His intellectual voyage has been interwoven with stints as an astute scrutineer in government and grand corporate bastions, a tapestry spanning British Telecommunications, Cable and Wireless, British Gas, and the esteemed University of London.
A decade hence, Robert’s transition into retirement unfurled a chapter of insatiable curiosity. This phase saw him immerse himself in Politics, Archaeology, Philosophy, and the enigmatic realm of Quantum Mechanics. His academic odyssey traversed the venerable corridors of knowledge hubs such as the Museum of London, University College London, Birkbeck College, The City Literature Institute, and Chichester University.
In the symphony of his life, Robert is a custodian of three progeny and a pair of cherished grandchildren. His sanctuary lies ensconced in the embrace of West Wales, where he inhabits an isolated cottage, its windows framing a vista of the boundless sea – a retreat from the scrutinising gaze of Her Majesty’s Revenue and Customs, an amiable clandestinity in the lap of nature.
Exploring Prehistoric Britain: A Journey Through Time
My blog delves into the fascinating mysteries of prehistoric Britain, challenging conventional narratives and offering fresh perspectives grounded in cutting-edge research, particularly LiDAR technology. I invite you to explore some key areas of my research. For example, the Wansdyke, often cited as a defensive structure, is re-examined in light of new evidence. I’ve presented my findings in my blog post Wansdyke: A British Frontier Wall – ‘Debunked’, and a Wansdyke LiDAR Flyover video further visualises my conclusions.
My work also often challenges established archaeological dogma. I argue that many sites, such as Hambledon Hill, commonly identified as Iron Age hillforts, are not what they seem. My posts Lidar Investigation Hambledon Hill – NOT an ‘Iron Age Fort’ and Unmasking the “Iron Age Hillfort” Myth explore these ideas in detail and offer an alternative view. Similarly, sites like Cissbury Ring and White Sheet Camp receive re-evaluations based on LiDAR analysis in my posts “Lidar Investigation Cissbury Ring through time”and “Lidar Investigation White Sheet Camp,“ revealing fascinating insights into their true purpose. I have also examined South Cadbury Castle, often linked to the mythical Camelot56.
My research also extends to ancient water management, including the role of canals and other linear earthworks. I have discussed the true origins of Car Dyke in multiple posts, including Car Dyke – ABC News Podcast and Lidar Investigation Car Dyke – North Section, which suggest a Mesolithic origin 2357. I also explore the misidentification of Roman aqueducts, as seen in my posts on the Great Chesters (Roman) Aqueduct. My research has also been greatly informed by my post-glacial flooding hypothesis, which has helped explain landscape transformations over time. I have discussed this hypothesis in several posts, including AI now supports my Post-Glacial Flooding Hypothesis and Exploring Britain’s Flooded Past: A Personal Journey
For those interested in British Prehistory, visit www.prehistoric-britain.co.uk, a comprehensive resource featuring an extensive collection of archaeology articles, modern LiDAR investigations, and groundbreaking research. The site also includes insights and excerpts from the acclaimed Robert John Langdon Trilogy, a series of books that explore Britain during the Prehistoric period. Titles in the trilogy include The Stonehenge Enigma, Dawn of the Lost Civilisation, and The Post-Glacial Flooding Hypothesis, which offer compelling evidence of ancient landscapes shaped by post-glacial flooding.
To further explore these topics, Robert John Langdon has developed a dedicated YouTube channel featuring over 100 video documentaries and investigations that complement the trilogy. Notable discoveries and studies showcased on the channel include 13 Things that Don’t Make Sense in History and the revelation of Silbury Avenue – The Lost Stone Avenue, a rediscovered prehistoric feature at Avebury, Wiltshire.
In addition to his main works, Langdon has released a series of shorter, accessible publications, ideal for readers delving into specific topics. These include:
For active discussions and updates on the trilogy’s findings and recent LiDAR investigations, join our vibrant community on Facebook. Engage with like-minded enthusiasts by leaving a message or contributing to debates in our Facebook Group.
Whether through the books, the website, or interactive videos, we aim to provide a deeper understanding of Britain’s fascinating prehistoric past. We encourage you to explore these resources and uncover the mysteries of ancient landscapes through the lens of modern archaeology.
For more information, including chapter extracts and related publications, visit the Robert John Langdon Author Page. Dive into works such as The Stonehenge Enigma or Dawn of the Lost Civilisation, and explore cutting-edge theories that challenge traditional historical narratives.