The Stonehenge Hoax – The Slaughter Stone

Conundrum 12 – The Slaughter Stone……………………… Book Extract (The Great Stonehenge Hoax)

“The Killing of great numbers of human beings”

The Problem

The slaughter stone has always been associated with mythology and speculation.  Some say it was where Druids sacrificed bodies to their gods (hence the name); others suggested that it is merely a fallen Sarsen stone that once stood upright as the entrance to the monument.  But recent scanning has shown that it was once sculpted to look ’lumpy and ‘rolling’,’ but why?

The Solution

In the centre of the Sarsen circle lies an extraordinary stone – the Altar stone; the reason it’s unique is two-fold. Firstly, it’s made of mica, unlike the other Sarsen standing stones. ‘Hawkins notes that while all the other stones were either bluestone or Sarsen, the so-called altar-stone is ‘of fine-grained pale green sandstone, containing so many flakes of mica that its surface, wherever, wherever it is freshly exposed, shows the typical mica glitter’.  The second reason is that it was positioned to be ‘flat’ with the landscape; the only other stone designed in that fashion is the Slaughter Stone.
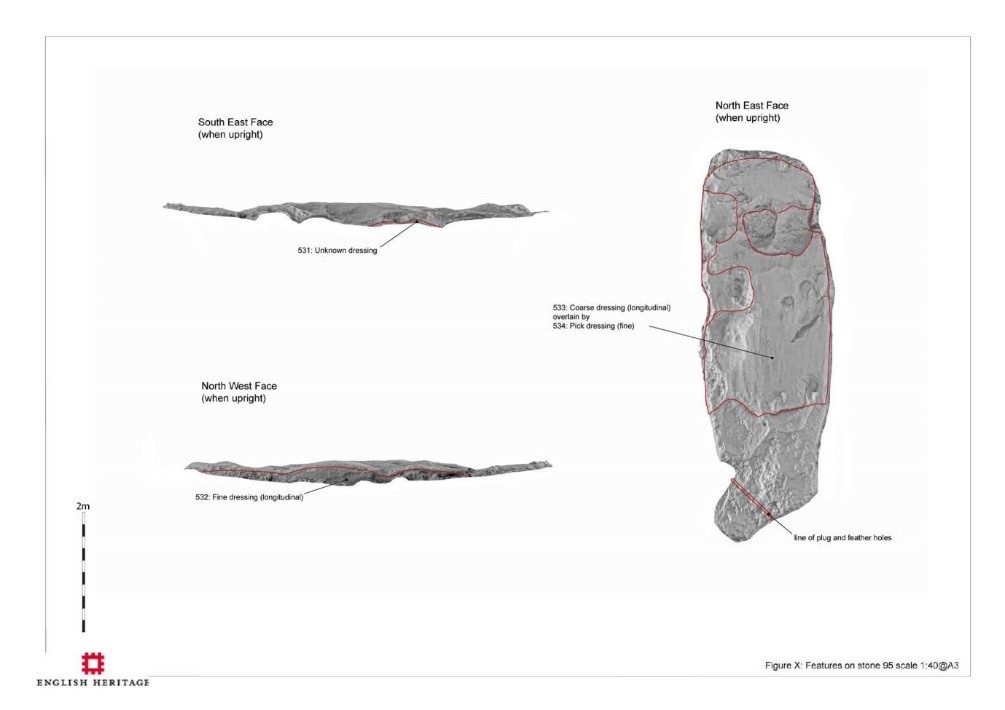
Unpublished EH scan of the Slaughter Stone – (The Stonehenge Hoax – The Slaughter Stone)

Most archaeologists believe that the Slaughter Stone was once a standing stone at the monument’s entrance; this is a flawed theory resulting from a hypothetical drawing by Inigo Jones in 1655. This drawing shows Stonehenge as a perfect circle (Roman Solar Temple), with a hexagon-shaped trilithon and three entrances into the site, with six upright standing stones serving as access points, one of which was the slaughter stone. This idea was incorporated into John Aubrey’s drawing in 1666, which was more accurate but again tended to place all the fallen stones upright.

This false assumption was further compounded by William Cunning in 1880, when (it was reported) that he suggested his grandfather “saw” the upright slaughter stone in the 17th Century. This mistake was later corrected, yet the myths among archaeologists persist (Stones of Slaughter, E. Herbert Stone, 1924, p. 120). (The Stonehenge Hoax – The Slaughter Stone)
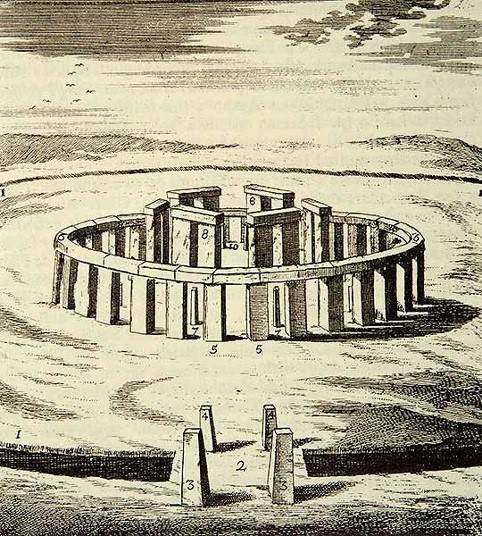
hypothetical drawing by Inigo Jones in 1655.(The Stonehenge Hoax - The Slaughter Stone)
Hypothetical drawing by Inigo Jones in 1655 – (The Stonehenge Hoax – The Slaughter Stone)

The reality is that the Slaughter Stone was always (like the Altar Stone) a deliberate recumbent, as the excavations of this stone by Hawley and Newall in the 1920s clearly show, as the chalk subsoil was also deliberately flattened before it was placed in its current position. Hawley presumed that the Slaughter Stone was once ‘buried’; this idea is understandable as the stone does lie below the ground level, but what Hawley never understood is that the reason the stone was in this position was for the same reason the ditch was built around Stonehenge, as it was made to be full of water.

This can be observed by the size of the stone hole called ‘E’ (WA1165), which lies two metres North West of the Slaughter stone but still within the ‘hollow’ that contains the stone. Most stone holes at Stonehenge are relatively shallow – less than a metre in-depth, but stone hole ‘E’ is twice as deep, over 2m. So if the Slaughter stone were placed in it (as the experts have suggested), it would be only 3m high at the surface, compared to 4.57m for the Heel Stone a few yards away.
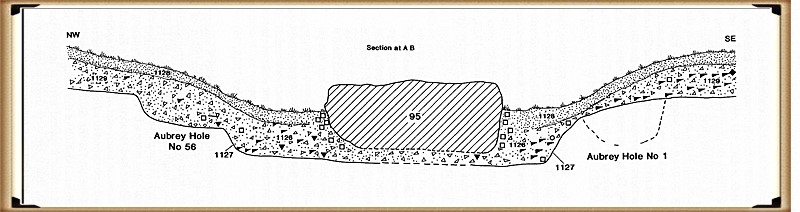
Slaughter stone was deliberately buried below the chalk surface.
Slaughter stone was deliberately buried below the chalk surface. – (The Stonehenge Hoax – The Slaughter Stone)

The only other place in Stonehenge with these more massive pits is within the Ditch section surrounding the site, which is the same depth, allowing access to the groundwater levels. In the past, when the Slaughter stone was placed in this ditch, as in the moat, water would have surrounded the stone, making it appear like an island.

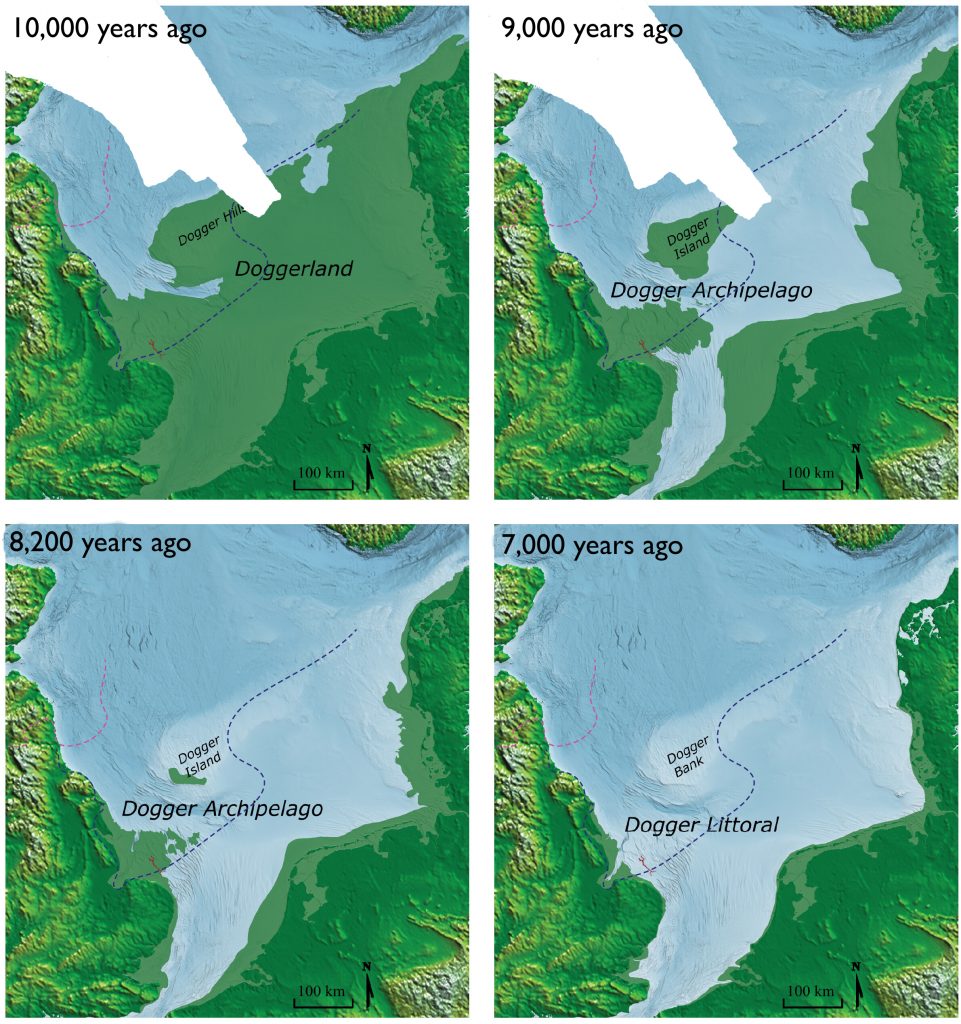
Therefore, what we see today at Stonehenge is a 6,000-year-old relief map of the land the megalithic builders originated from – Doggerland, which now lies below the North Sea.
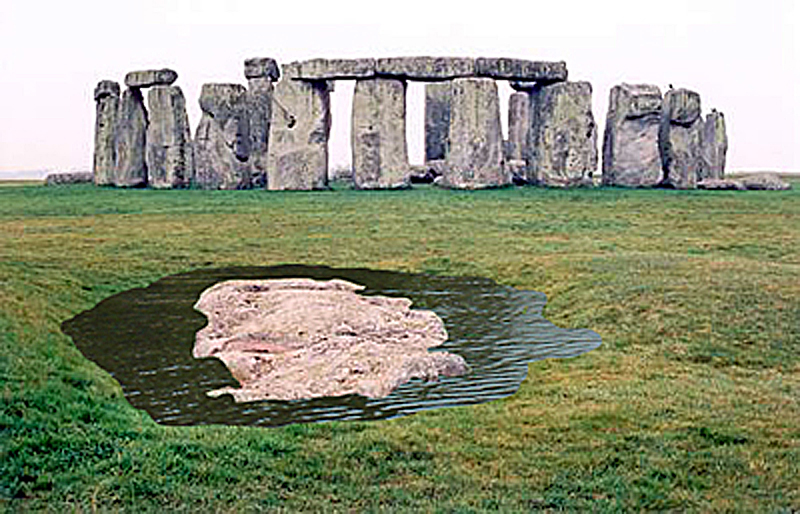
(The Stonehenge Hoax - The Slaughter Stone)
They created a relief Map of their Island – (The Stonehenge Hoax – The Slaughter Stone)

Not only did they place a 6ft piece of Sarsen stone, flat in a watery ditch, but they also carved out the island’s contours, showing high and low ground, like a contour relief map.  Archaeologists have always believed these features were ‘weather-worn’ by age (although the other recumbent stones have not been weathered in the same fashion), but recent laser technology has confirmed our belief that this stone was carved, as the tool marks are still visible at the microscopic level.
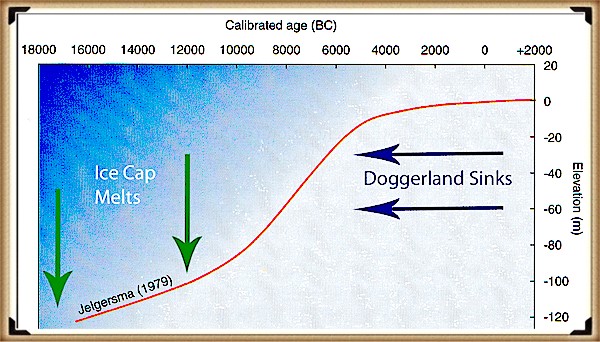
Sea Level Changes sunk Doggerland
Sea Level Changes sank Doggerland – (The Stonehenge Hoax – The Slaughter Stone)

Moreover, and more importantly, the stone has been placed in a bizarre position, almost in the way of The Avenue. This shows that this stone and the Avenue have a connection; this type of relationship is seen in association with Egyptian Pyramids, where ‘sight lines’ are cut into the sides of the burial chambers toward important star constellations to show their associations with the Gods.

At Stonehenge, the Slaughter Stone and the Avenue are important as they link death with rebirth for this Megalithic Civilisation, for if we look from the Altar stone and follow a line past the Slaughter stone, they make a sight-line, which quite remarkably points directly to their homeland, Doggerland. This was only a small island at the time of the Avenues’ construction in 4100 BCE, but it was constantly shrinking as sea levels (as now) continued to rise.  Geologists currently estimate the sinking of Doggerland to have occurred 2,000 years earlier, at 6200 BCE, after finding a Tsunami that would have hit the island at that time.

Moreover, as we have seen in the Indian ocean and Japan – when tsunami’s hit, they do NOT sink the region, sadly, this is just another example of ‘bad science’ within archaeology.  We can confirm that Doggerland did not disappear at this stage of history with a bit of simple maths.  We know that the island is between 15m and 36m (average 25m) (Wikipedia) under the sea as a sandbank (and hence covered in modern-day wind farms).  And we know (from satellites) that the sea rises 3.6mm per annum – consequently, by 4100 BCE it was still 6m above sea level, but probably so small it was uninhabitable.
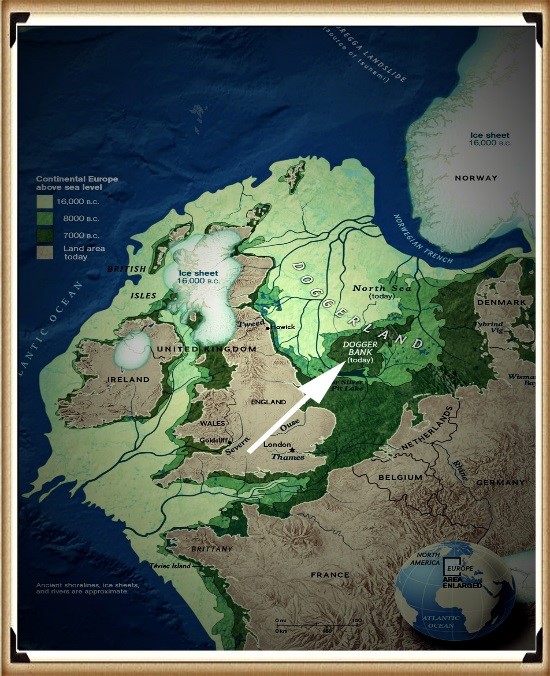
The Slaughter Stone Points to Doggerland
The Slaughter Stone Points to Doggerland – Enigma V2.0 (2015) page 95 – (The Stonehenge Hoax – The Slaughter Stone)

2026 Update

When I first published The Stonehenge Enigma almost twenty years ago, one of the most controversial suggestions was that the accepted story of Stonehenge’s stones was incomplete. At the time, archaeologists largely confined their search for sources to Wales and southern Britain, while suggestions of much longer-distance transport were routinely dismissed.

Today, the debate looks very different.

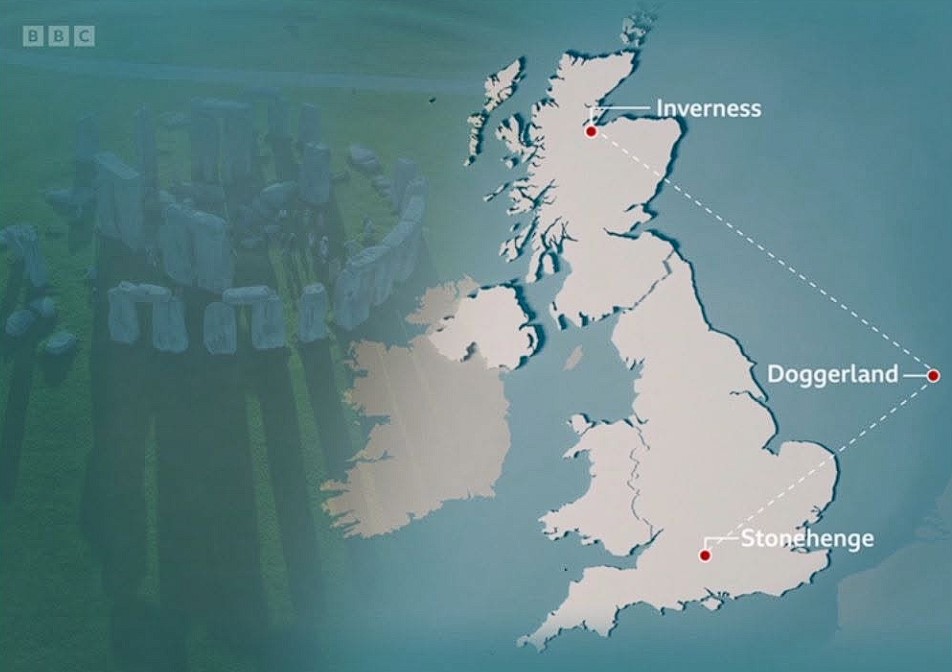
Researchers have now concluded that Stonehenge’s six-tonne Altar Stone most likely originated in north-east Scotland, approximately 700 kilometres from Salisbury Plain. More significantly, the latest peer-reviewed study has examined how such a journey may have been achieved.

According to Dr Anthony Clarke of Curtin University:

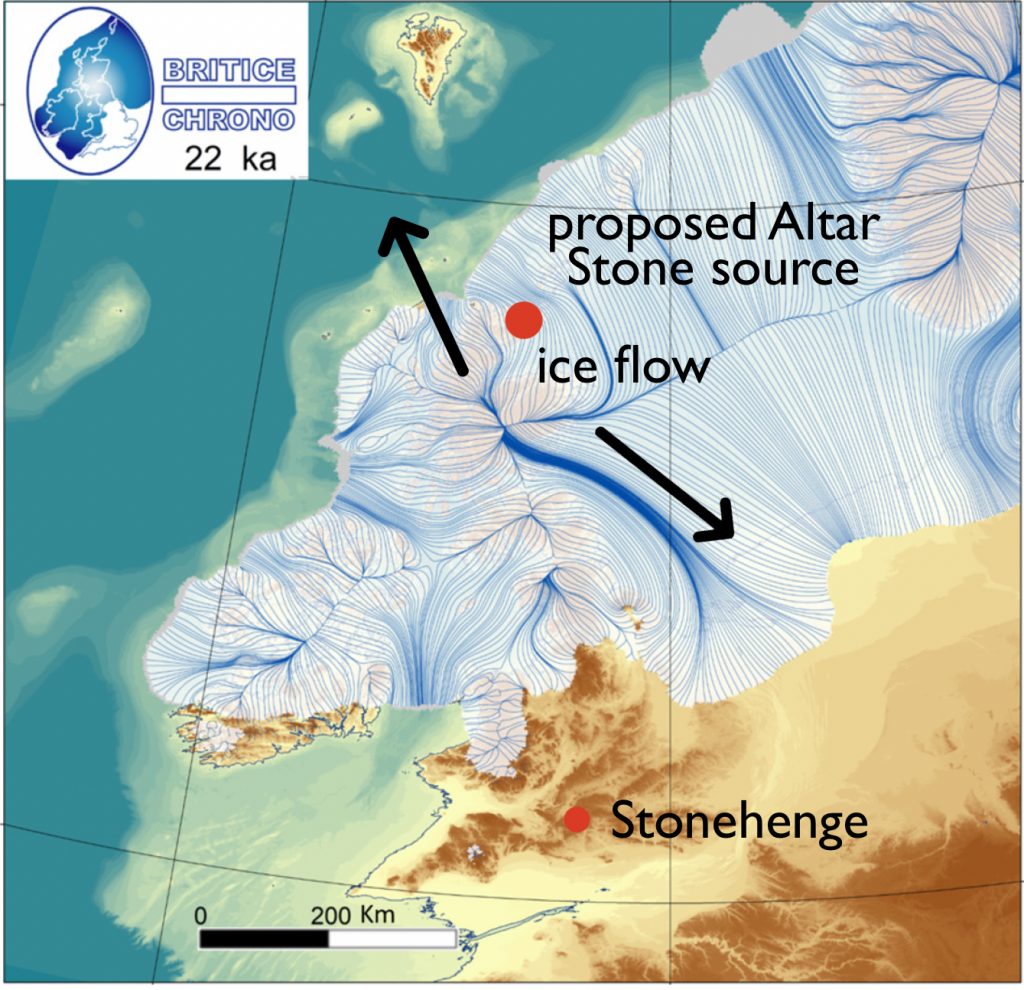
“Our modelling shows glaciers may have transported rocks part of the way during the last Ice Age — potentially as far as Dogger Bank in the North Sea — but not into southern England, meaning the stone would still have needed to be moved hundreds of kilometres by people.”

That statement is remarkable.

For decades, the standard objection to long-distance transport was that prehistoric people simply could not move such massive stones across Britain. The new research reaches the opposite conclusion. Not only was human transport required, but the journey appears to have involved multiple stages, combining overland movement with river and coastal transport.

The paper concludes there were no viable glacial pathways connecting the source region directly to Stonehenge. Human organisation, planning and transport networks were therefore essential.

What makes this particularly interesting is the appearance of Dogger Bank within the discussion.

Dogger Bank occupies the heart of the drowned North Sea landscape known as Doggerland. For years, Doggerland has often been portrayed as little more than a submerged hunting ground. Yet the new study identifies the region as a potential staging point within the wider movement of material from Scotland towards southern Britain.

(The Stonehenge Hoax - The Slaughter Stone)
The Stonehenge Hoax – The Slaughter Stone

In other words, the researchers are now discussing precisely the kind of interconnected landscape that I have been putting forward for nearly twenty years.

The significance of the paper is therefore not simply that the Altar Stone came from Scotland.

The significance is that a peer-reviewed transport model now places Dogger Bank directly into the discussion and confirms that prehistoric communities were capable of moving multi-tonne stones across hundreds of kilometres using a combination of routes and technologies.

Twenty years ago, such ideas were considered pseudoscience or conspiracy theory.

Today, they appear in the scientific literature.

The lesson is simple.

Never underestimate prehistoric people.

The real mystery is not how they moved the stone.

The real mystery is why it took archaeology so long to accept that they could.
The Stonehenge Hoax - The Slaughter Stone)
The Stonehenge Hoax – The Slaughter Stone

Fast forward to today, and the story has taken a remarkable turn. Advances in geochemical analysis and improved scientific methods have provided new insights into the origin of Stonehenge’s stones, particularly the Altar Stone. Researchers have determined that this unique stone, composed of fine-grained pale green sandstone with a high mica content, does not match the geology of Wales or Cornwall, as once thought. Instead, studies now strongly suggest that it originated in Scotland, a revelation that challenges long-held assumptions and lends credibility to my earlier hypothesis.

The Altar Stone has always been an outlier in terms of its composition. Unlike the bluestones of Preseli or the massive Sarsens from the Marlborough Downs, its distinctive mica-rich material immediately set it apart. Early examinations by archaeologists such as Richard Atkinson noted these differences but lacked the tools to trace their exact origins. It wasn’t until recent years that advanced geochemical fingerprinting techniques were applied, allowing scientists to identify its likely provenance with greater accuracy.

One pivotal breakthrough came in 2016 when researchers conducted isotopic analysis on fragments of the Altar Stone. These tests revealed a chemical composition that closely matched sandstone formations found in southern Scotland. This discovery was groundbreaking, as it opened the door to a broader understanding of how far people in the Neolithic were willing to travel—or trade—to obtain materials for their monumental constructions.
The Stonehenge Hoax - The Slaughter Stone)
The Stonehenge Hoax – The Slaughter Stone)

In 2020, further studies refined this analysis, narrowing the possible source to the southern uplands of Scotland. However, the exact quarry site remains unknown. This uncertainty stems from a lack of comprehensive geological mapping of underwater sandstone formations along Scotland’s eastern coast. Some experts have speculated that the stone may have been transported via waterways, possibly from a submerged quarry site now lying beneath the North Sea.

This raises intriguing questions about the logistical capabilities of Neolithic societies. How did they transport such a massive stone across hundreds of miles? Did they rely on an extensive network of waterways and seafaring routes, or were the stones traded overland in a series of exchanges between communities? These questions remain unanswered, but they highlight the sophistication of the builders’ organisational and engineering skills.

The story of the Altar Stone also underscores the slow pace of archaeological research. Despite the clear potential for groundbreaking discoveries, investigations into the stone’s origins have been limited by funding constraints and the challenges of underwater archaeology. The sandstone formations off the east coast of Scotland, which could provide definitive answers, have yet to be explored in detail. Without such investigations, the hypothesis that the Altar Stone came from this region remains partially validated but not fully proven.

Interestingly, the Altar Stone’s unique material properties may have held symbolic significance for the builders of Stonehenge. The shimmering mica within the sandstone gives it a luminous quality when freshly exposed, which may have been interpreted as spiritually or ritually important. Its placement at the centre of the Sarsen circle, lying flat rather than upright like the surrounding stones, further suggests it played a central role in the monument’s purpose.

The debate over the Altar Stone’s origin is part of a broader reevaluation of Stonehenge’s construction and function. The monument was interpreted primarily as a solar temple or astronomical observatory for centuries. However, newer theories emphasise its role as a site of cultural and ritual significance, with connections to far-flung regions of the Neolithic world. The diversity of the stones’ origins supports the idea that Stonehenge was not just a local project but a monument with broader regional and possibly even international connections.
The Stonehenge Hoax - The Slaughter Stone)
The Stonehenge Hoax – The Slaughter Stone)

This evolving understanding of the Altar Stone exemplifies the dynamic nature of archaeology. What was once dismissed as pseudoscience is now recognised as a plausible, even likely, explanation. It also highlights the importance of revisiting old assumptions with new tools and technologies. Had geochemical fingerprinting not been applied, the Altar Stone’s Scottish origin might still be unknown.

The following steps in this journey will likely involve underwater archaeology, a field that has only recently begun to gain traction. As technology improves and funding becomes available, it is hoped that investigations into the submerged sandstone formations along Scotland’s coast will uncover the exact source of the Altar Stone. Such a discovery would not only validate this hypothesis but also shed light on the broader network of trade and communication that existed in Neolithic Britain.

Until then, the story of the Altar Stone remains a testament to the resilience of ideas and science’s slow but steady progress. It serves as a reminder that archaeology, while painstakingly slow, has the power to rewrite our understanding of history. My initial hypothesis, once dismissed, has found a place in the growing body of evidence that challenges traditional narratives about Stonehenge and its builders.

Unearth the Astonishing Secrets of Stonehenge (The Stonehenge Hoax)

Introduction

Video

Synopsys

Stonehenge, a timeless enigma etched in stone and earth, has stood as a formidable puzzle challenging the intellects of archaeologists and historians alike. Despite the myriad attempts, including books, TV programs, and academic conferences, the secrets of these ancient stones and their encircling ditches have proven elusive. Against this backdrop, we scrutinise the existing thirteen hypotheses, each presenting its narrative but collectively lacking a coherent thread.

In adopting the deductive reasoning akin to Sherlock Holmes, we endeavour to weave these disparate threads into a unified tapestry that not only unravels the mystery of Stonehenge but also shakes the foundations of established academic narratives. This intellectual journey may induce some discomfort as we challenge conventional perceptions and invite a reevaluation of our understanding of the past. Apologies are extended in advance for any cognitive dissonance, but the pursuit of truth and reason mandates an unfiltered presentation of the facts.

So, fasten your seatbelts for an expedition into the archaeological unknown.

As we navigate this intellectual rollercoaster, be prepared for a revelation that might reshape our understanding of Stonehenge and question the foundations of our historical narratives. The dawn of a new archaeological era awaits promising insights that could leave even the most curious minds astonished. As we delve into this intellectual rabbit hole, be ready for a revelation that could astonish Alice.

Robert John Langdon (2023) – (The Stonehenge Hoax)

Author’s Biography

Robert John Langdon, a polymathic luminary, emerges as a writer, historian, and eminent specialist in LiDAR Landscape Archaeology.

His intellectual voyage has been interwoven with stints as an astute scrutineer in government and grand corporate bastions, a tapestry spanning British Telecommunications, Cable and Wireless, British Gas, and the esteemed University of London.

A decade hence, Robert’s transition into retirement unfurled a chapter of insatiable curiosity. This phase saw him immerse himself in Politics, Archaeology, Philosophy, and the enigmatic realm of Quantum Mechanics. His academic odyssey traversed the venerable corridors of knowledge hubs such as the Museum of London, University College London, Birkbeck College, The City Literature Institute, and Chichester University.

In the symphony of his life, Robert is a custodian of three progeny and a pair of cherished grandchildren. His sanctuary lies ensconced in the embrace of West Wales, where he inhabits an isolated cottage, its windows framing a vista of the boundless sea – a retreat from the scrutinising gaze of Her Majesty’s Revenue and Customs, an amiable clandestinity in the lap of nature.

Exploring Prehistoric Britain: A Journey Through Time

My blog delves into the fascinating mysteries of prehistoric Britain, challenging conventional narratives and offering fresh perspectives grounded in cutting-edge research, particularly LiDAR technology. I invite you to explore some key areas of my research. For example, the Wansdyke, often cited as a defensive structure, is re-examined in light of new evidence. I’ve presented my findings in my blog post Wansdyke: A British Frontier Wall – ‘Debunked’, and a Wansdyke LiDAR Flyover video further visualises my conclusions.

My work also often challenges established archaeological dogma. I argue that many sites, such as Hambledon Hill, commonly identified as Iron Age hillforts, are not what they seem. My posts Lidar Investigation Hambledon Hill – NOT an ‘Iron Age Fort’ and Unmasking the “Iron Age Hillfort” Myth explore these ideas in detail and offer an alternative view. Similarly, sites like Cissbury Ring and White Sheet Camp receive re-evaluations based on LiDAR analysis in my posts “Lidar Investigation Cissbury Ring through time” and “Lidar Investigation White Sheet Camp,“ revealing fascinating insights into their true purpose. I have also examined South Cadbury Castle, often linked to the mythical Camelot56.

My research also extends to ancient water management, including the role of canals and other linear earthworks. I have discussed the true origins of Car Dyke in multiple posts, including Car Dyke – ABC News Podcast and Lidar Investigation Car Dyke – North Section, which suggest a Mesolithic origin 2357. I also explore the misidentification of Roman aqueducts, as seen in my posts on the Great Chesters (Roman) Aqueduct. My research has also been greatly informed by my post-glacial flooding hypothesis, which has helped explain landscape transformations over time. I have discussed this hypothesis in several posts, including AI now supports my Post-Glacial Flooding Hypothesis and Exploring Britain’s Flooded Past: A Personal Journey

Finally, my blog also investigates prehistoric burial practices, as seen in Prehistoric Burial Practices of Britain and explores the mystery of Pillow Mounds, often mistaken for medieval rabbit warrens, but with a potential link to Bronze Age cremation in my posts: Pillow Mounds: A Bronze Age Legacy of Cremation? and The Mystery of Pillow Mounds: Are They Really Medieval Rabbit Warrens?. My research also includes astronomical insights into ancient sites, for example, in Rediscovering the Winter Solstice: The Original Winter Festival. I also review new information about the construction of Stonehenge in The Stonehenge Enigma.

Further Reading

For those interested in British Prehistory, visit www.prehistoric-britain.co.uk, a comprehensive resource featuring an extensive collection of archaeology articles, modern LiDAR investigations, and groundbreaking research. The site also includes insights and excerpts from the acclaimed Robert John Langdon Trilogy, a series of books that explore Britain during the Prehistoric period. Titles in the trilogy include The Stonehenge Enigma, Dawn of the Lost Civilisation, and The Post-Glacial Flooding Hypothesis, which offer compelling evidence of ancient landscapes shaped by post-glacial flooding.

To further explore these topics, Robert John Langdon has developed a dedicated YouTube channel featuring over 100 video documentaries and investigations that complement the trilogy. Notable discoveries and studies showcased on the channel include 13 Things that Don’t Make Sense in History and the revelation of Silbury Avenue – The Lost Stone Avenue, a rediscovered prehistoric feature at Avebury, Wiltshire.

In addition to his main works, Langdon has released a series of shorter, accessible publications, ideal for readers delving into specific topics. These include:

For active discussions and updates on the trilogy’s findings and recent LiDAR investigations, join our vibrant community on Facebook. Engage with like-minded enthusiasts by leaving a message or contributing to debates in our Facebook Group.

Whether through the books, the website, or interactive videos, we aim to provide a deeper understanding of Britain’s fascinating prehistoric past. We encourage you to explore these resources and uncover the mysteries of ancient landscapes through the lens of modern archaeology.

For more information, including chapter extracts and related publications, visit the Robert John Langdon Author Page. Dive into works such as The Stonehenge Enigma or Dawn of the Lost Civilisation, and explore cutting-edge theories that challenge traditional historical narratives.

Other Blogs

s

t

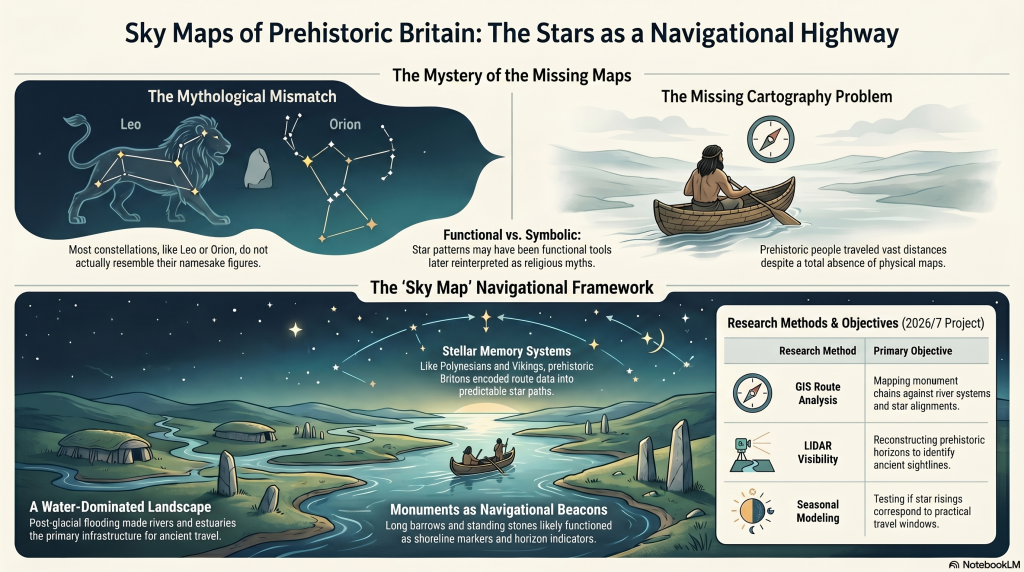
Sky Maps of Prehistoric Britain

Were the Constellations Originally a Navigational System?

A Long-Term Research Project for 2026/7


Introduction

For thousands of years, humanity has looked upward and seen stories written in the stars.

Ancient cultures named constellations after animals, heroes, gods, monsters, hunters and mythical creatures. Archaeologists and historians generally assume these star patterns were primarily symbolic, religious, or mythological in nature. (Sky Maps of Prehistoric Britain)

But there is a major problem.

Most constellations do not actually resemble the creatures they supposedly represent.

The Great Bear resembles neither a bear nor a wagon.
Orion does not resemble a hunter.
Leo looks nothing like a lion.
Draco barely resembles a dragon.

In many cases, the supposed shapes appear forced, inconsistent, or entirely dependent on later artistic interpretation.

This raises an important question:

What if the original purpose of many stellar patterns was not mythology at all?

What if they were functional?

More specifically:

What if ancient star systems originally formed part of a navigational framework used by an early maritime civilisation operating across the flooded landscapes of post-glacial Europe?

This article outlines a new long-term research project planned for 2026, investigating whether the stars themselves may once have formed part of an integrated navigational system connected to prehistoric waterways, coastlines, monuments, and seasonal movement.

The purpose of this project is not to make unsupported claims, but to establish whether this idea can be scientifically investigated using measurable evidence.

(Sky Maps of Prehistoric Britain)

The Foundation of the Hypothesis

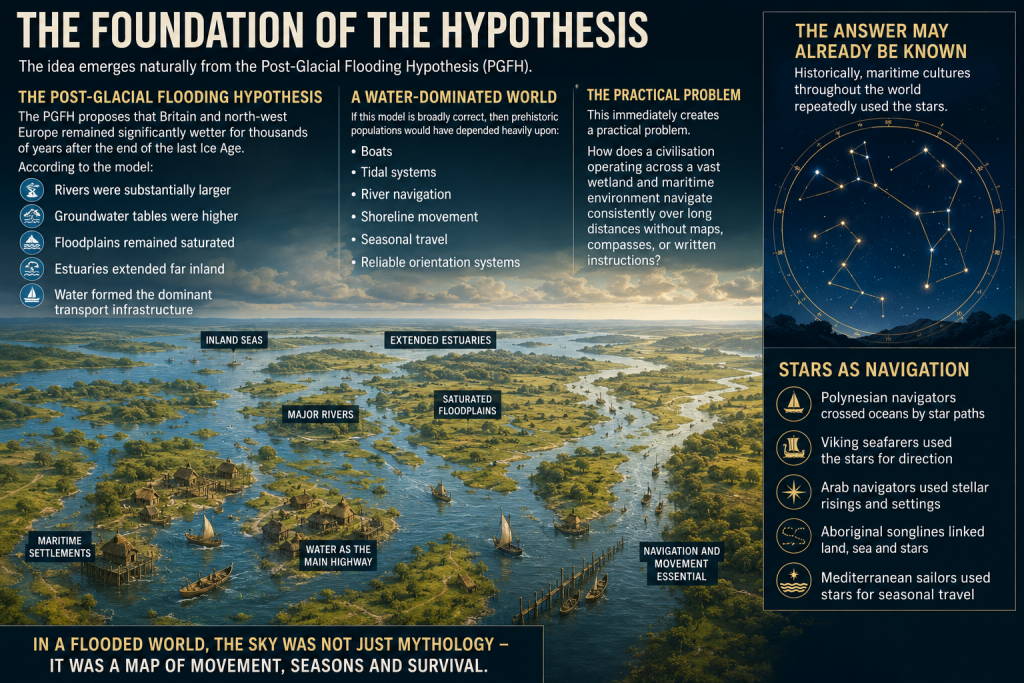
The idea emerges naturally from the Post-Glacial Flooding Hypothesis (PGFH).

The PGFH proposes that Britain and north-west Europe remained significantly wetter for thousands of years after the end of the last Ice Age.

According to the model:

  • rivers were substantially larger,
  • groundwater tables were higher,
  • floodplains remained saturated,
  • estuaries extended far inland,
  • and water formed the dominant transport infrastructure.

If this model is broadly correct, then prehistoric populations would have depended heavily upon:

  • boats,
  • tidal systems,
  • river navigation,
  • shoreline movement,
  • seasonal travel,
  • and reliable orientation systems.

This immediately creates a practical problem.

How does a civilisation operating across a vast wetland and maritime environment navigate consistently over long distances without maps, compasses, or written instructions?

The answer may already be known.

Historically, maritime cultures throughout the world repeatedly used the stars.


 (Sky Maps of Prehistoric Britain)
(Sky Maps of Prehistoric Britain)

The Stars as Navigation

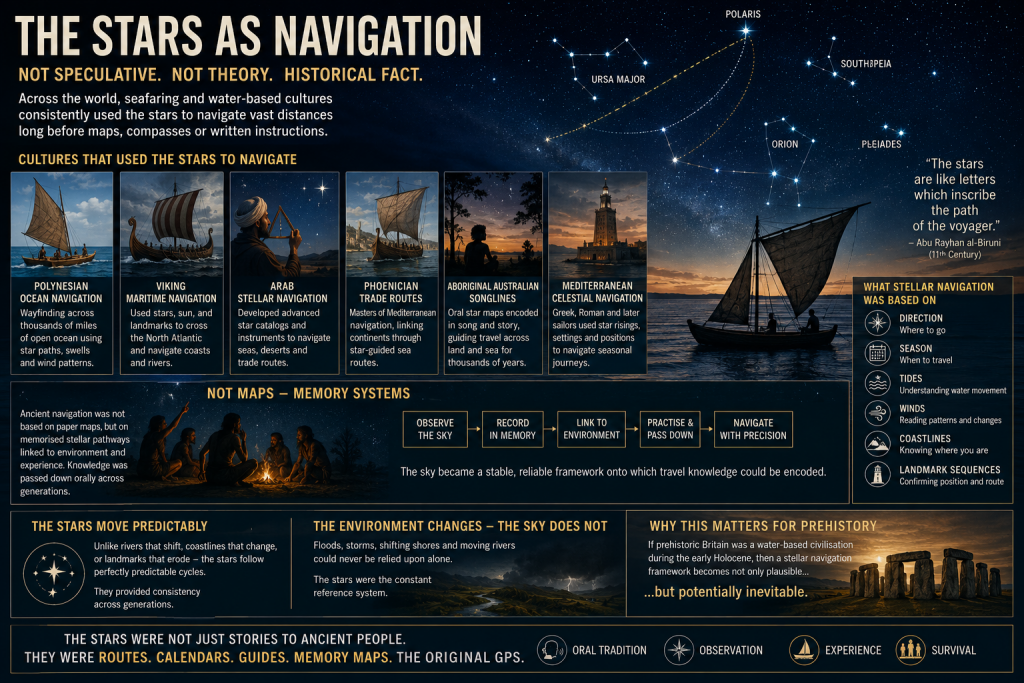
The use of stars for navigation is not speculative.
It is a historical fact.

Examples include:

  • Polynesian ocean navigation
  • Viking maritime navigation
  • Arab stellar navigation
  • Phoenician trade routes
  • Aboriginal Australian songlines
  • Mediterranean celestial navigation

In many cases, navigation was not based on maps in the modern sense, but on memorised stellar pathways tied to:

  • direction,
  • season,
  • tides,
  • winds,
  • coastlines,
  • and landmark sequences.

This is critical.

Ancient navigation often functioned as a memory system.

The sky became a stable framework onto which travel knowledge could be encoded.

Unlike coastlines or rivers, the stars moved predictably.
They provided consistency across generations.

If prehistoric Britain operated as a water-based civilisation during the early Holocene, then a stellar navigation framework becomes not only plausible, but potentially inevitable.


 (Sky Maps of Prehistoric Britain)
(Sky Maps of Prehistoric Britain)

The Missing Maps Problem

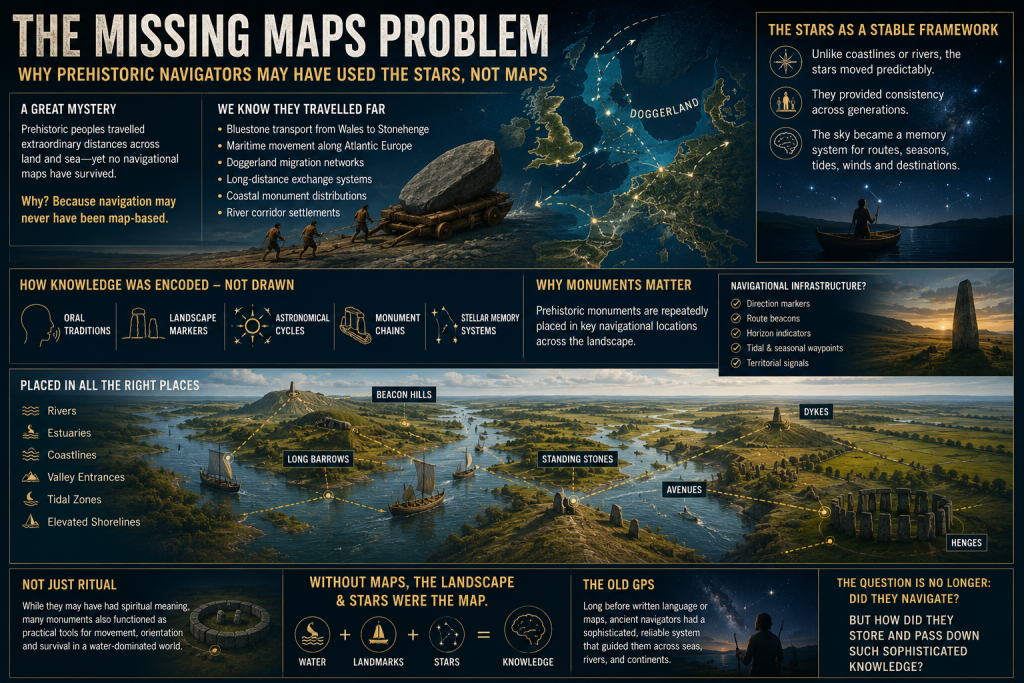
One of the great mysteries of prehistoric maritime movement is the apparent absence of navigational maps.

We know prehistoric populations travelled extraordinary distances.

Examples include:

  • Bluestone transport from Wales to Stonehenge
  • Maritime movement along Atlantic Europe
  • Doggerland migration networks
  • Long-distance exchange systems
  • Coastal monument distributions
  • River corridor settlements

Yet no conventional cartographic systems survive.

This may be because navigation itself was never primarily map-based.

Instead, route knowledge may have been embedded within:

  • oral traditions,
  • landscape markers,
  • astronomical cycles,
  • monument chains,
  • and stellar memory systems.

This possibility becomes especially interesting when viewed alongside the repeated placement of prehistoric monuments near:

  • rivers,
  • estuaries,
  • coastlines,
  • valley entrances,
  • tidal zones,
  • and elevated shoreline positions.

Long barrows, standing stones, beacon hills, avenues, dykes, and henges may not simply represent ritual locations.

Some may have functioned as navigational infrastructure.

 (Sky Maps of Prehistoric Britain)
(Sky Maps of Prehistoric Britain)

Long Barrows and Landscape Markers

One of the most intriguing aspects of prehistoric Britain is the repeated positioning of monuments along visible movement corridors.

Long barrows in particular often occupy:

  • ridge lines,
  • valley edges,
  • coastal approaches,
  • elevated viewpoints,
  • or route intersections.

Traditionally, these sites are interpreted almost exclusively through ritual or funerary frameworks.

But there is another possibility.

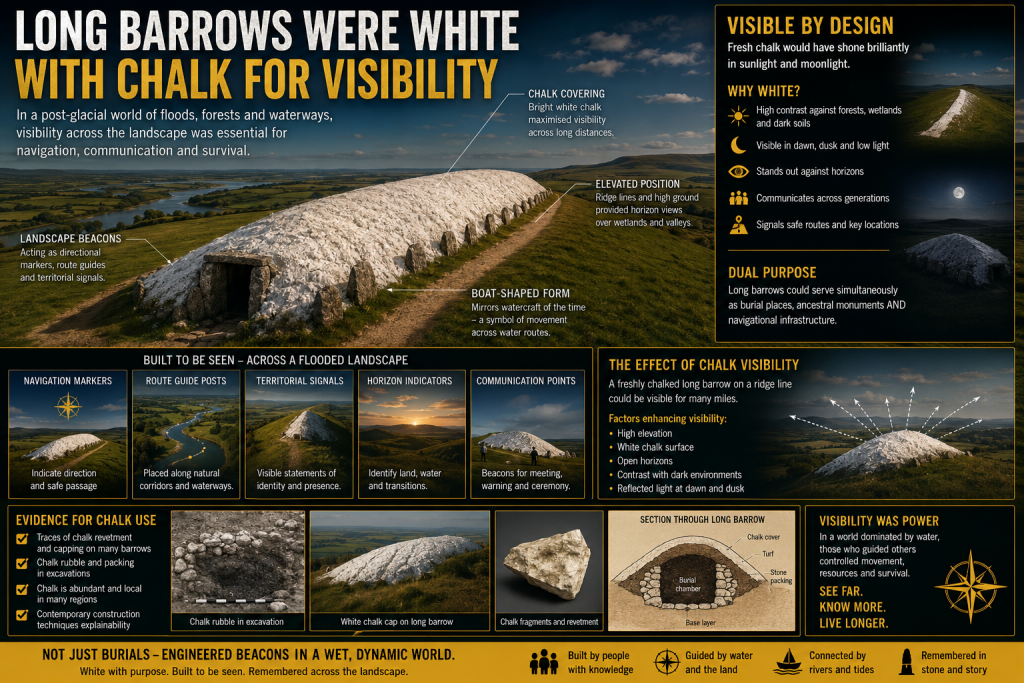
In a landscape dominated by wetlands and waterways, elevated monuments would naturally function as:

  • directional markers,
  • navigation points,
  • horizon indicators,
  • territorial signals,
  • or route beacons.

This does not exclude symbolic meaning.

The same structure can serve both practical and cultural purposes simultaneously.

Indeed, this dual-function model is common throughout human history.

Church towers, lighthouses, harbour beacons, hill forts, and even modern skyscrapers operate as both symbols and navigational markers.

The same may have applied in prehistory.


 (Sky Maps of Prehistoric Britain)
(Sky Maps of Prehistoric Britain)

Why the Constellations Matter

The more complex question is whether the constellations themselves formed part of this navigational architecture.

This project proposes a cautious working hypothesis:

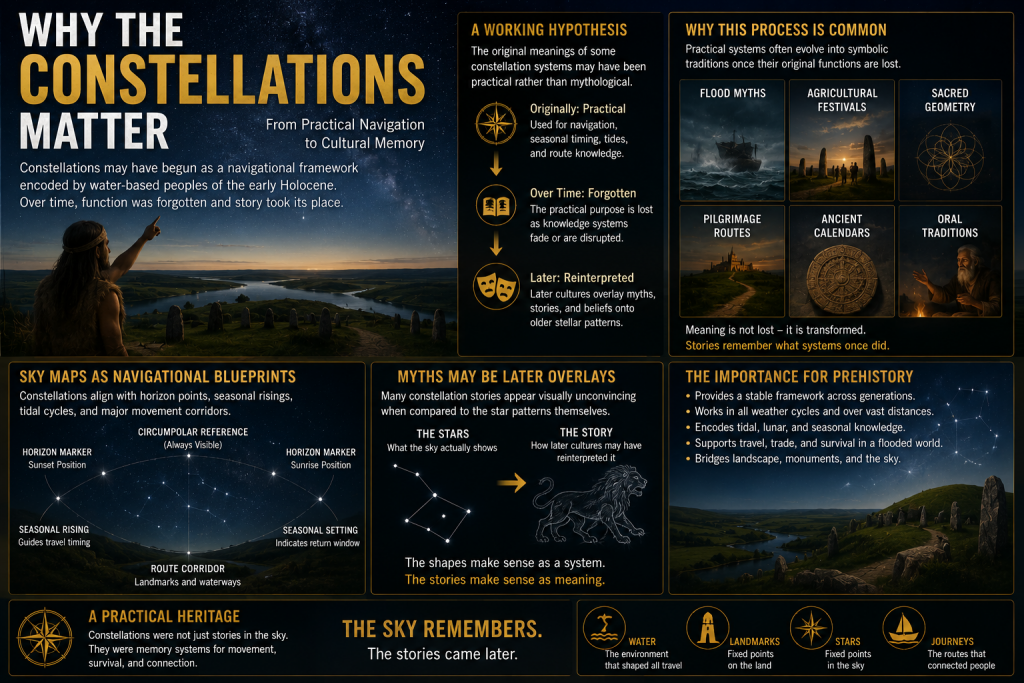
The original meanings of some constellation systems may have been practical rather than mythological.

Over time, as the original navigational framework was forgotten, later cultures may have reinterpreted older stellar systems through:

  • mythology,
  • religion,
  • folklore,
  • and storytelling.

This process is not unusual.

Throughout history, practical systems often evolve into symbolic traditions once their original functions are lost.

Examples include:

  • flood myths,
  • agricultural festivals,
  • sacred geometry,
  • pilgrimage routes,
  • and ancient calendrical systems.

The same process may explain why many modern constellation interpretations appear visually unconvincing.

The animals and heroes may represent later narrative overlays applied onto much older orientation frameworks.

 (Sky Maps of Prehistoric Britain)
(Sky Maps of Prehistoric Britain)

Current Evidence Supporting the Idea

At present, there is no direct proof that constellations encoded prehistoric navigation routes.

However, several independent lines of evidence support the broader possibility.

1. Proven Stellar Navigation in Ancient Cultures

The use of stars for navigation is universally documented.

This establishes that:

  • stars can encode movement systems,
  • oral navigation is possible,
  • and complex route memory can operate without maps.

2. Water-Dominated Early Holocene Landscapes

The PGFH and associated geological evidence suggest:

  • extensive wetlands,
  • enlarged river systems,
  • inland tidal environments,
  • and maritime dependency.

Such environments strongly favour navigation-based societies.


3. Monument Distribution Along Water Systems

Many prehistoric sites cluster around:

  • rivers,
  • floodplains,
  • estuaries,
  • coastal corridors,
  • and elevated shoreline terrain.

This pattern is more consistent with movement infrastructure than isolated ritual placement.


4. Horizon Astronomy in Prehistory

Prehistoric societies demonstrably tracked:

  • solar cycles,
  • lunar cycles,
  • solstices,
  • equinoxes,
  • and horizon alignments.

Once astronomical observation is accepted, the application to navigation becomes entirely plausible.


5. Seasonal Movement Systems

Maritime societies depend upon predictable seasonal timing.

Stars naturally provide:

  • seasonal indicators,
  • directional consistency,
  • and long-distance orientation.

6. Ethnographic Parallels

Multiple indigenous cultures linked:

  • landscape movement,
  • memory systems,
  • navigation,
  • and stars.

This provides real-world functional parallels.


What This Project Will Attempt to Test

The 2026 project will focus on measurable and testable questions rather than speculation.

Key research areas include:

GIS Route Analysis

Testing whether:

  • monument chains,
  • river systems,
  • long barrows,
  • beacon hills,
  • and prehistoric movement corridors

show statistically significant astronomical relationships.


Seasonal Navigation Modelling

Investigating whether:

  • key stars,
  • heliacal risings,
  • lunar cycles,
  • or stellar azimuths

correspond to practical travel windows within prehistoric water systems.


Horizon Visibility Studies

Using LiDAR and digital terrain models to reconstruct:

  • prehistoric horizons,
  • sightlines,
  • beacon visibility,
  • and navigational marker ranges.

Maritime Route Reconstruction

Reconstructing:

  • post-glacial coastlines,
  • flooded valleys,
  • inland estuaries,
  • and navigable river systems.

The aim is to determine whether major monuments occupy logical positions within ancient transport networks.


Statistical Testing

This is essential.

Any proposed alignment or pattern must be tested against random distributions.

Without statistical controls, pattern recognition rapidly becomes subjective.

The project, therefore, intends to:

  • establish falsifiable criteria,
  • use control datasets,
  • compare against random models,
  • and avoid arbitrary alignment selection.

What This Project Is NOT Claiming

This research does not claim:

  • that every constellation is a map,
  • that mythology is irrelevant,
  • or that all prehistoric monuments were navigational.

Nor does it claim direct proof already exists.

Instead, the project asks a more careful scientific question:

Could an aquatic civilisation operating across flooded post-glacial landscapes have encoded navigational knowledge into stable stellar frameworks?

At present, the answer appears plausible.

Whether it is correct remains to be tested.


Why This Matters

If even part of this hypothesis proves correct, the implications would be profound.

It would suggest that:

  • prehistoric Britain possessed far more advanced navigational systems than traditionally assumed,
  • monuments may have functioned as infrastructure as well as symbolism,
  • astronomy was practical rather than purely ceremonial,
  • and early maritime societies may have operated sophisticated memory-based route systems long before formal cartography.

Most importantly, it would further support the emerging picture of a civilisation shaped not by isolated ritual sites, but by movement, water, navigation, and environmental adaptation.

In short:

The stars may not simply have inspired prehistoric civilisation.

They may have guided it.


Future Research Updates

This article represents the beginning of a long-term research project planned for 2026.

Future work will include:

  • GIS modelling
  • Hydrological reconstruction
  • Stellar simulation analysis
  • Monument alignment databases
  • Statistical testing
  • Maritime route reconstruction
  • LiDAR visibility studies
  • Ethnographic comparison

Updates will be published through:

Prehistoric Britain

and associated research publications.


Final Thought

Modern civilisation separates:

  • astronomy,
  • geography,
  • navigation,
  • religion,
  • engineering,
  • and landscape.

Prehistoric societies may not have.

For people living in a flooded world of rivers, marshes, estuaries, tides, and coastlines, the sky itself may have functioned as the oldest navigation system humanity ever created.

And perhaps, hidden within the stars, fragments of those ancient water routes still remain.

PODCAST

Author’s Biography

Robert John Langdon, a polymathic luminary, emerges as a writer, historian, and eminent specialist in LiDAR Landscape Archaeology.

His intellectual voyage has been interwoven with stints as an astute scrutineer in government and grand corporate bastions, a tapestry spanning British Telecommunications, Cable and Wireless, British Gas, and the esteemed University of London.

A decade hence, Robert’s transition into retirement unfurled a chapter of insatiable curiosity. This phase saw him immerse himself in Politics, Archaeology, Philosophy, and the enigmatic realm of Quantum Mechanics. His academic odyssey traversed the venerable corridors of knowledge hubs such as the Museum of London, University College London, Birkbeck College, The City Literature Institute, and Chichester University.

In the symphony of his life, Robert is a custodian of three progeny and a pair of cherished grandchildren. His sanctuary lies ensconced in the embrace of West Wales, where he inhabits an isolated cottage, its windows framing a vista of the boundless sea – a retreat from the scrutinising gaze of Her Majesty’s Revenue and Customs, an amiable clandestinity in the lap of nature.

Exploring Prehistoric Britain: A Journey Through Time

My blog delves into the fascinating mysteries of prehistoric Britain, challenging conventional narratives and offering fresh perspectives grounded in cutting-edge research, particularly LiDAR technology. I invite you to explore some key areas of my research. For example, the Wansdyke, often cited as a defensive structure, is re-examined in light of new evidence. I’ve presented my findings in my blog post Wansdyke: A British Frontier Wall – ‘Debunked’, and a Wansdyke LiDAR Flyover video further visualises my conclusions.

My work also often challenges established archaeological dogma. I argue that many sites, such as Hambledon Hill, commonly identified as Iron Age hillforts, are not what they seem. My posts Lidar Investigation Hambledon Hill – NOT an ‘Iron Age Fort’ and Unmasking the “Iron Age Hillfort” Myth explore these ideas in detail and offer an alternative view. Similarly, sites like Cissbury Ring and White Sheet Camp receive re-evaluations based on LiDAR analysis in my posts “Lidar Investigation Cissbury Ring through time” and “Lidar Investigation White Sheet Camp,“ revealing fascinating insights into their true purpose. I have also examined South Cadbury Castle, often linked to the mythical Camelot56.

My research also extends to ancient water management, including the role of canals and other linear earthworks. I have discussed the true origins of Car Dyke in multiple posts, including Car Dyke – ABC News Podcast and Lidar Investigation Car Dyke – North Section, which suggest a Mesolithic origin 2357. I also explore the misidentification of Roman aqueducts, as seen in my posts on the Great Chesters (Roman) Aqueduct. My research has also been greatly informed by my post-glacial flooding hypothesis, which has helped explain landscape transformations over time. I have discussed this hypothesis in several posts, including AI now supports my Post-Glacial Flooding Hypothesis and Exploring Britain’s Flooded Past: A Personal Journey

Finally, my blog also investigates prehistoric burial practices, as seen in Prehistoric Burial Practices of Britain and explores the mystery of Pillow Mounds, often mistaken for medieval rabbit warrens, but with a potential link to Bronze Age cremation in my posts: Pillow Mounds: A Bronze Age Legacy of Cremation? and The Mystery of Pillow Mounds: Are They Really Medieval Rabbit Warrens?. My research also includes astronomical insights into ancient sites, for example, in Rediscovering the Winter Solstice: The Original Winter Festival. I also review new information about the construction of Stonehenge in The Stonehenge Enigma.

Further Reading

For those interested in British Prehistory, visit www.prehistoric-britain.co.uk, a comprehensive resource featuring an extensive collection of archaeology articles, modern LiDAR investigations, and groundbreaking research. The site also includes insights and excerpts from the acclaimed Robert John Langdon Trilogy, a series of books that explore Britain during the Prehistoric period. Titles in the trilogy include The Stonehenge Enigma, Dawn of the Lost Civilisation, and The Post-Glacial Flooding Hypothesis, which offer compelling evidence of ancient landscapes shaped by post-glacial flooding.

To further explore these topics, Robert John Langdon has developed a dedicated YouTube channel featuring over 100 video documentaries and investigations that complement the trilogy. Notable discoveries and studies showcased on the channel include 13 Things that Don’t Make Sense in History and the revelation of Silbury Avenue – The Lost Stone Avenue, a rediscovered prehistoric feature at Avebury, Wiltshire.

In addition to his main works, Langdon has released a series of shorter, accessible publications, ideal for readers delving into specific topics. These include:

For active discussions and updates on the trilogy’s findings and recent LiDAR investigations, join our vibrant community on Facebook. Engage with like-minded enthusiasts by leaving a message or contributing to debates in our Facebook Group.

Whether through the books, the website, or interactive videos, we aim to provide a deeper understanding of Britain’s fascinating prehistoric past. We encourage you to explore these resources and uncover the mysteries of ancient landscapes through the lens of modern archaeology.

For more information, including chapter extracts and related publications, visit the Robert John Langdon Author Page. Dive into works such as The Stonehenge Enigma or Dawn of the Lost Civilisation, and explore cutting-edge theories that challenge traditional historical narratives.

Other Blogs

s

t

London – The Thames through time

The Thames through time

Introduction

This is a journey through time, looking at the prehistoric London (The Thames) through time, Landscape based on the book ‘The Post-Glacial Flooding Hypothesis’ – that contains conclusive and extended evidence of Robert John Langdon’s hypothesis, that rivers of the past were higher than today, which changes the history of not only Britain, but the world. In this extract, we look at the Case Study within the book about the Thames. (The Thames through time ).

Case Study – The Thames

The Lower Thames sequence has been thoroughly studied not only because it is one of the largest river systems in the country but also because of its fortuitous exposure in many of the quarries and recent development programmes in and around London. The Thames was diverted into its current valley during the Anglian period, where it proceeded to lay down extensive gravel deposits before reaching the sea. Archaeological interest in the Thames alluvial deposits and the raised beaches of the south-east coast is also due to the presence of significant Lower and Middle Palaeolithic artefacts and hominin remains within these deposits.

The depositional chronology of the Thames gravel terraces has not yet been universally accepted, and the two significant sequences have been proposed by Gibbard (1985) and Bridgland (1994).  This is because the terraces are dated by the artefacts found within them, which are archaeologically dated and not carbon-dated.  The problem with this method is that if the area flooded after the original deposits were laid down, the artefacts could have been washed down from upstream and embedded at random.

(The Thames through time)
Traditional View of the Thames River terraces
(The Thames through time)

The modern floodplain of the Lower Thames, downstream of central London, is bounded either by older Pleistocene sands or gravels at the higher levels or by bedrock. The depositional chronology of the Thames gravel terraces has not yet been universally accepted, and the two significant sequences were proposed by Gibbard (1985).

The SBAB model of floodplain evolution proposes that during the early Holocene, multi-channel braided systems stabilised as some channels narrowed and deepened, and others were progressively abandoned over the course of the Holocene (Brown et al. 1994).

The Lower Thames saw a rise of about 15m in relative sea level between c. 10,000 and c. 6000 BP (Rackham and Sidell, 2000; Sidell, 2003b). This would have had a significant effect on the settlement of the outer and mid estuary floodplain. It has been suggested, for example, that settlement areas along the river margin progressively moved to higher ground as the land below was overtaken by the rising water levels (Rackham and Sidell 2000).

During the early Holocene, the Lower Thames floodplain was a complex environment of peat-forming areas, migrating channels and raised eyots (Sidell 2003a). Often, these eyots were the focus of prehistoric occupation, for example, at Runnymede (Needham 1991; 1992), Westminster, Southwark (Bowsher 1991; Dillion et al. 1991; Merriman 1992), and Bermondsey (Sidell et al. 2002). These areas tended to lie at the junction between the higher ground on the edge of an island and the adjacent peat and alluvium, which preserved evidence of human activity that occurred when river levels were lower (Merriman 1992; Sidell et al. 2002).

The investigations carried out for the Jubilee Line extension have suggested that the sand eyots of Westminster and north Southwark did not complete their formation by the early Holocene as initially believed. Still, instead, they formed in the mid-Neolithic (c. 3500 cal B.C.). This could help explain why there is a lack of Early Neolithic occupation in the floodplain (Sidell 2003b).

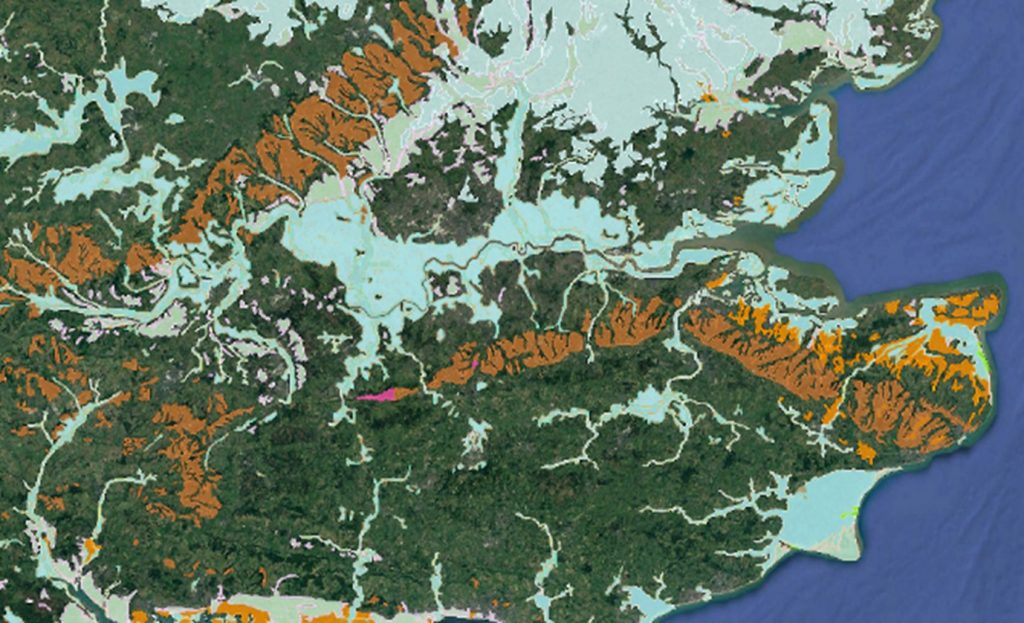
An extensive number of boreholes (> 1100) have enabled the British Geological Society to map the extent of flooding in the early Holocene, as it left extensive alluvium up to 10m deep in places, showing the long duration of the raised water levels.

(The Thames through time)
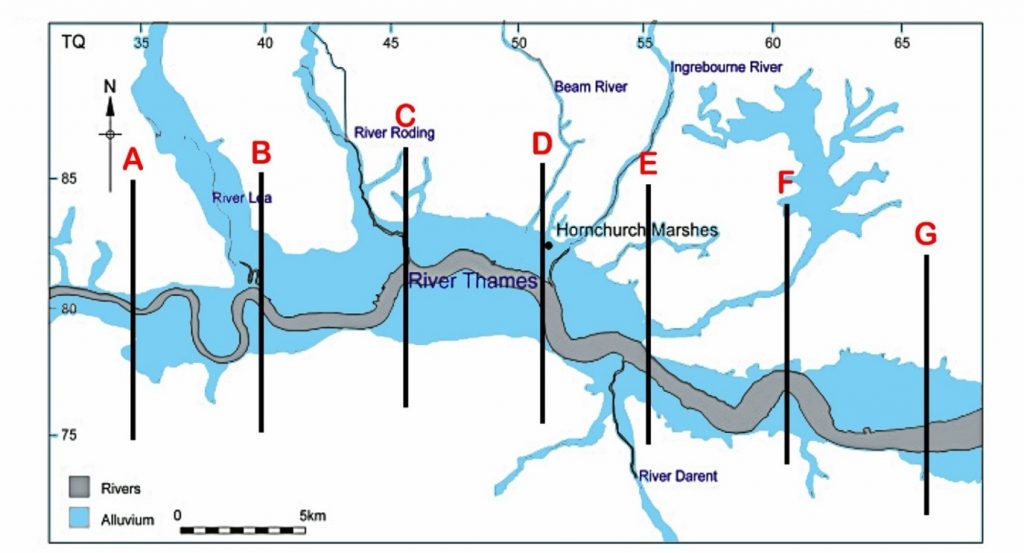
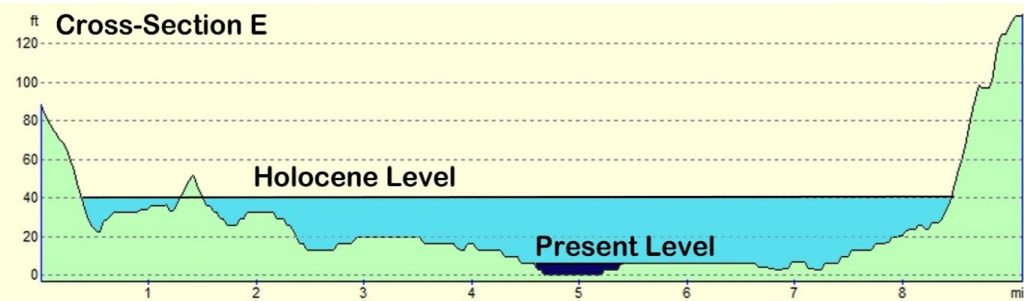
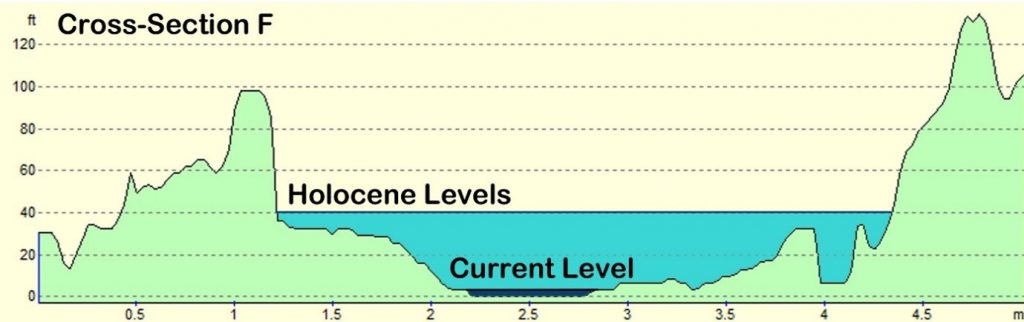
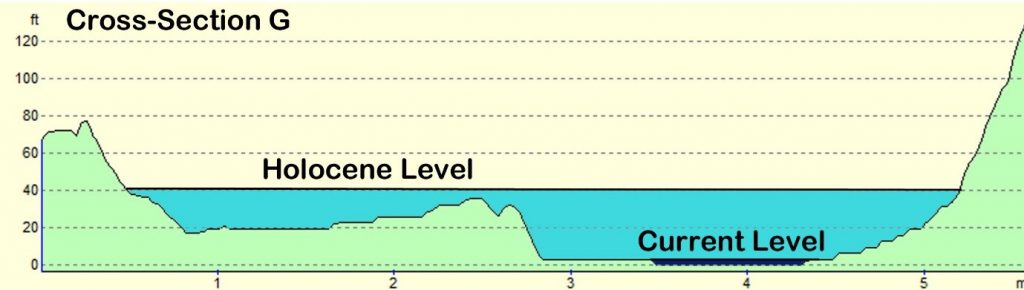
BGS Map of London showing in blue the Alluvium deposited at the end of the LGM.  We have sectioned off A- G areas to look at their cross-sections. 
(The Thames through time)

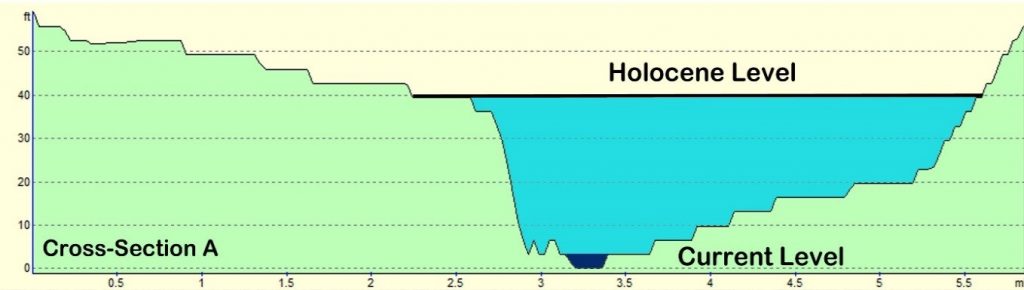
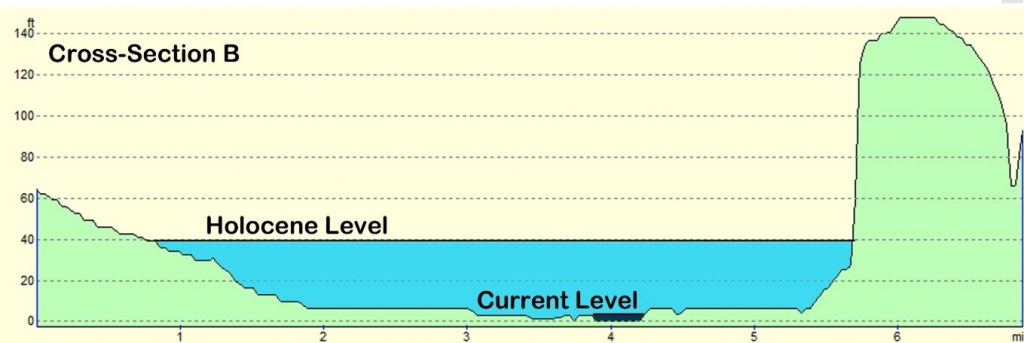
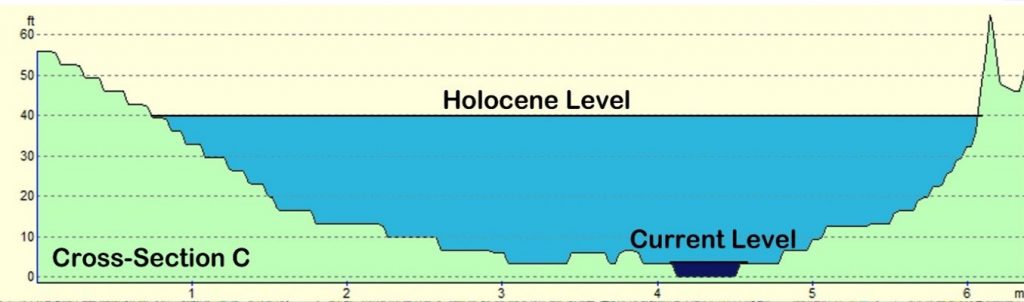
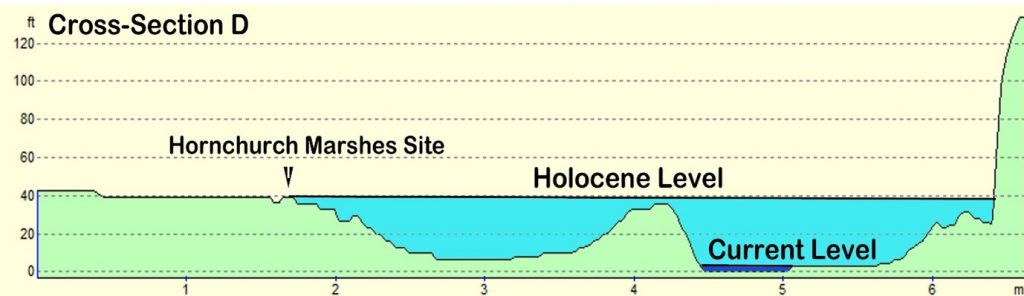
If we section off (A to G) the Thames and look at the volume and width of the Holocene Thames in comparison to today, we can get an estimation of the discharge of water at its peak during this period.

Increased discharge levels during the Holocene

Cross- SectionCurrent WidthHolocene WidthWidth Increase %Volume Increase – (Holo. – Present =) Cu.m3Increase in Volume
A400m4,425m1,10071,724 – 800 = 70,9248,866%
B650m7,725m1,18871,950 – 1950 = 70,0003,590%
C731m8,450m1,156128,430 – 2924 = 125,5064,292%
D965m7,644m79260,348 – 4825 = 55,5231,151%
E1,207m11,265m93390,122 – 7274 = 82,8807,367%
F1,125m5,230m46538,622 – 7875 = 30,747390%
G1,448m7,242m50058,902 – 11584 = 47318408%
Average932m7426m797% 3723%
(The Thames through time)
Thames River Cross-Sections A – G
(The Thames through time)

The current average discharge is 65.8 m³/s; therefore, with a 3723% increase in the watershed area, we can estimate that, at its peak, the Thames River discharged 2450 m³/s (0.0025 Gt/s or 1314 Gt per annum). 

About the same rate of one of the smaller rivers ‘Susquehanna/Chesapeake River’ (Table 5) in North America – which is minor, in comparison to the eight North American river discharge ratios, which begs the question as the Thames is the largest river in the country, would it not be affected mostly by the meltwater at the end of the last ice age – so, have the scientists got the extent of the alluvium flooding correct?

To investigate further, we need to examine a detailed excavation at the edge of the BGS superficial Alluvium flood map to obtain real evidence of dates and clues about which sediments are present, compared with the ages suggested in past publications.

‘Holocene environmental changes in the Lower Thames Valley’ (Branch et al.,2012) excavated parts of Hornchurch marsh at the edge of the BSG alluvium deposit (Cross-Section D). 

The paper suggests that “Palaeoenvironmental data (publicly or in the form of commercial archaeological reports) on these near-surface sediments indicate that following the end of the last glaciation, the lower reaches of the Thames Valley and its tributaries were inundated by the sea, and marine and estuarine sediments accumulated. Since that time, the evidence suggests that sea level continued to rise at a much slower rate as a response to either glacio-eustatic or sedimentary processes”.  But the idea of any recent “inundation by the sea” can now be easily rebuked.

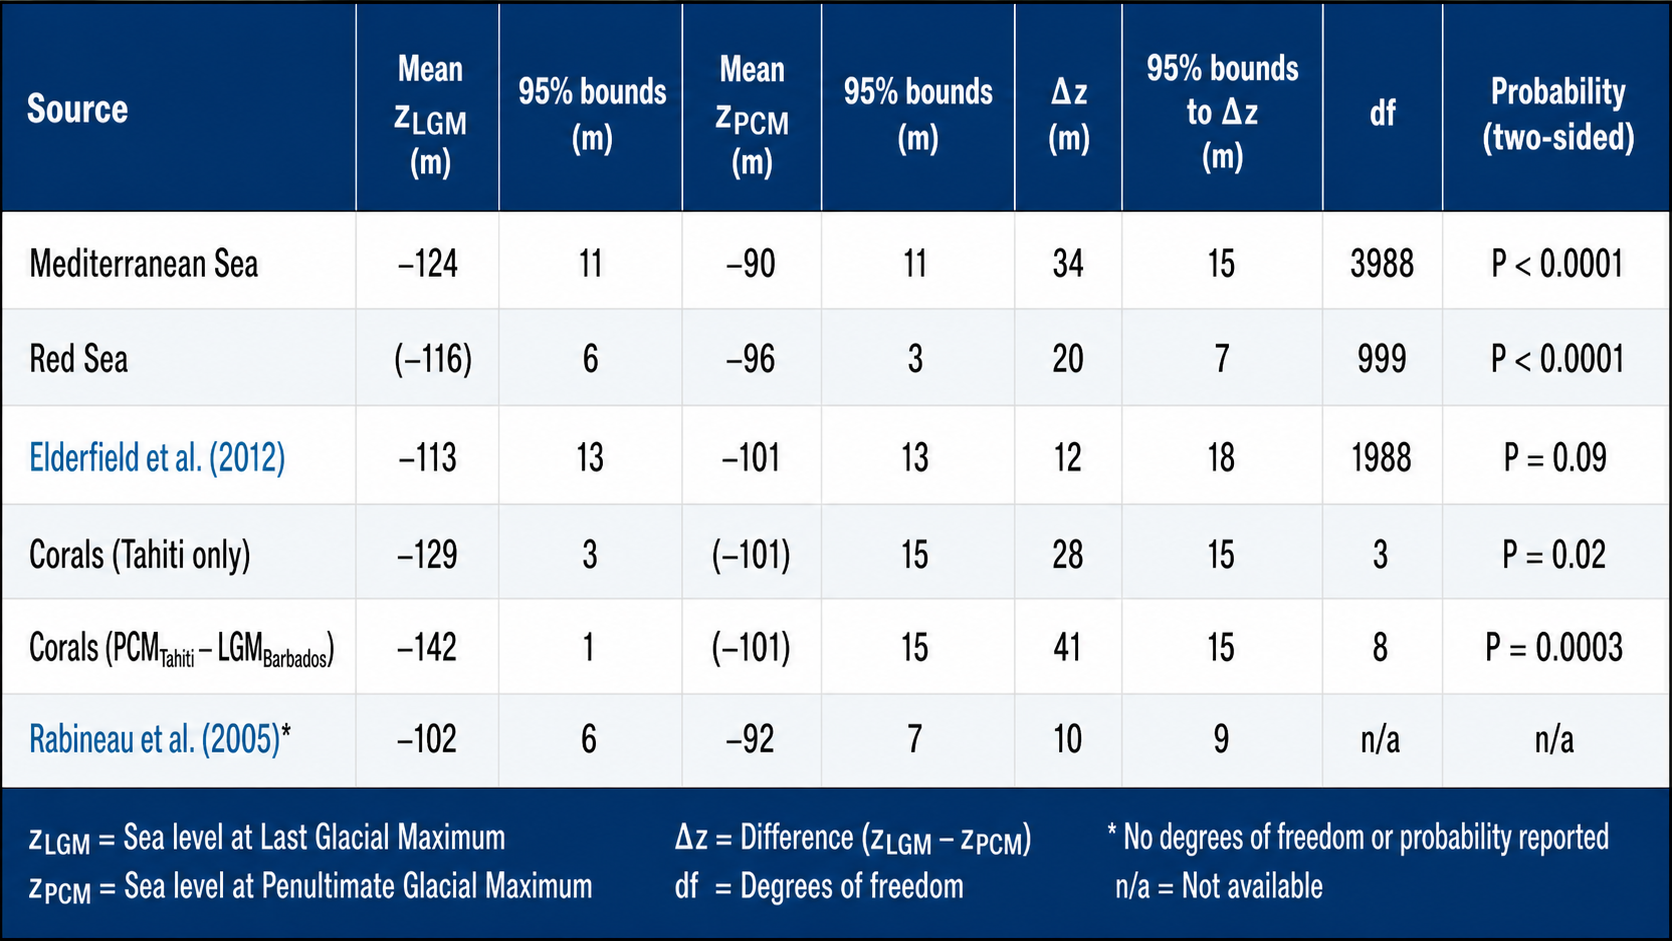
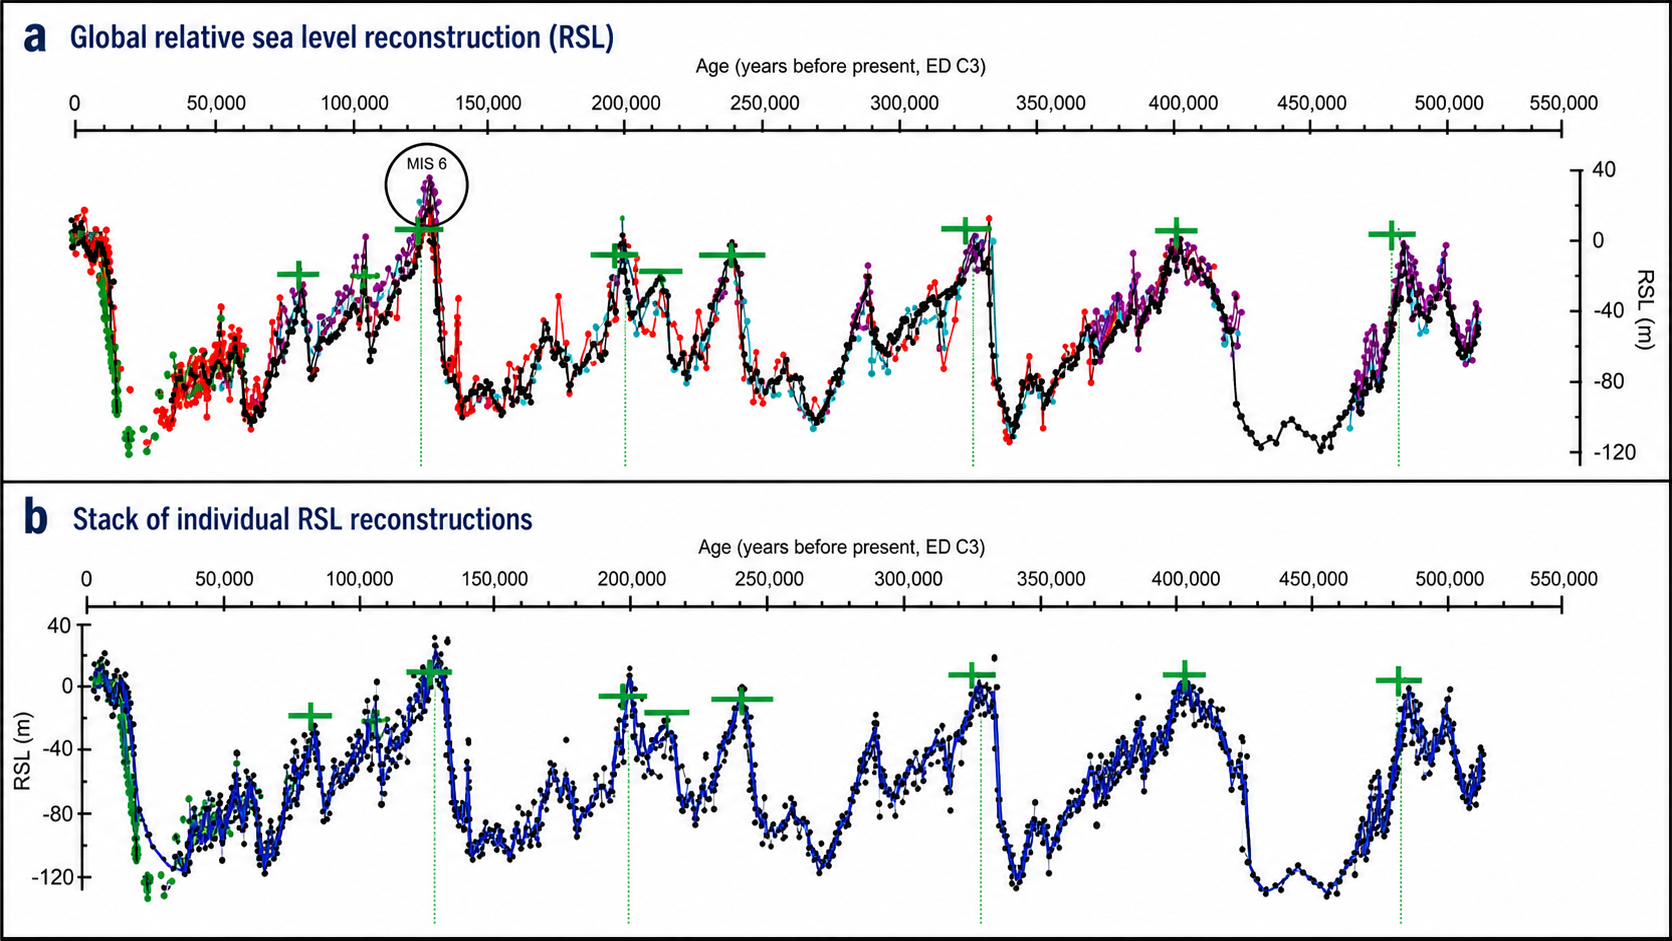
The reason for this incorrect interpretation of sediments was that past Geologists believed that the LGM was much smaller than previous ice ages – this has now been disproved by new research at sea level data from the Mediterranean (Rohling et al., 2017) as they could only measure by observation the extent of the ice sheets on the surface of the landmass and took for granted the greater the area, the larger the ice mass by estimation.

The conclusion of this study is to show that the last Ice Age was far more significant than previously thought (PCM) as illustrated below in Table 6 and Fig. 30)

(The Thames through time)

Table 6 – (Rohling et al., 20170 Comparison of LGM v PGM by sea-level difference

(Rohling et al.,2009) sea levels over the last 500k years – notice that they are either equivalent or smaller than the LGM
(The Thames through time)

🔍 Validating the 40 Metre Flood Model: A Conservative Benchmark with Room for Expansion

Recent analysis of Thames River terrace data, combined with marine isotope stages (MIS) and global sea-level reconstructions, has confirmed that the highest river terrace associated with the Anglian glaciation (MIS 12) reaches elevations of up to 45–50 metres above the present-day floodplain. These terraces are preserved in locations such as Wimbledon Common, Islington, Dartford Heath, and around the Goring Gap and represent the earliest and most substantial fluvial deposits in the Thames Valley. Their considerable height corresponds with what is now understood to be the largest ice volume of the last 500,000 years, when sea levels were more than 130 metres below modern levels.

In contrast, our working model for reconstructing prehistoric Thames hydrology assumes a maximum flood level of 40 metres above modern—a figure chosen deliberately to provide a conservative and defensible baseline. This height has been used to calculate post-glacial meltwater volume, floodplain extent, and terrace formation through time. Although lower than the peak terrace cuts, 40 metres accurately reflects the likely active flood height during the most extreme meltwater episodes, accounting for factors such as sediment infill, compaction, and subsequent erosion that would have reshaped the original floodplain surface.

River Thames
Sea level minimum equals Ice On land, and hence the River sizes after it melts – (Case Study – River Thames)

That said, the confirmation of higher terrace cuts opens the door for revising the volume model upwards. If we were to use the 45–50 metre elevation as our baseline for MIS 12, the resulting model would show a 12.5% to 25% increase in total flood volume compared to the current 40 metre assumption. This adjustment could significantly strengthen the case for post-glacial aquifer discharge and explain the massive sediment loads and geomorphic features observed downstream. However, such a shift would require recalibration of all terrace heights and their correlation with glacial episodes, which, while feasible, may introduce new assumptions and reduce the clarity of the proportional model.

In conclusion, the existing 40 metre model remains sound—anchored in observable data and consistent with LiDAR-documented terrace formations. Nevertheless, this model should be viewed as a minimum estimate of post-glacial river height and volume. Future work could explore enhanced modelling scenarios using 45–50-metre benchmarks to test the upper limits of Thames flooding during MIS 12. Such refinements would not undermine the current hypothesis but rather strengthen the argument that prehistoric Britain experienced hydrological conditions far more dynamic and extreme than currently acknowledged in traditional archaeological and geological narratives.

📊 Table: Sea-Level Minima and Estimated River Terrace Heights by Glacial Cycle

Glacial Period Marine Isotope Stage (MIS) Approx. Date (ka) Sea-Level Minimum (m below present) % of Maximum Ice Volume Estimated Thames Terrace Height (if MIS 12 = 45 m)
Fifth Glacial (Anglian) MIS 12 ~480 – 430 –130 m 100% 45 m
Penultimate Glacial MIS 6 ~190 – 135 –125 m 96.2% 43.3 m
Last Glacial Maximum MIS 2 ~26 – 19 –120 m 92.3% 41.5 m
Third Glacial MIS 8 ~300 – 245 –105 m 80.8% 36.4 m
Fourth Glacial MIS 10 ~360 – 335 –120 m 92.3% 41.5 m

📚 References

  • Grant, K.M. et al. (2014). Sea-level variability over five glacial cycles. Nature Communications, 5, 5076. DOI: 10.1038/ncomms6076
  • Rohling, E.J. et al. (2009). Relative sea-level and climate change over the past 500,000 years. Quaternary Science Reviews, 28(17–18), 1537–1552. DOI: 10.1016/j.quascirev.2009.02.026
  • British Geological Survey. (n.d.). Quaternary deposits and river terraces of the Thames Valley. Earthwise: The BGS Open Geoscience knowledge base. earthwise.bgs.ac.uk

Dated Geology

This new information has created a problem for Geologists, as their sequences were based on the assumption of more significant ice caps, and consequently, meltwater deposits prior to the last ice age formed the foundations of our geological river terracing.

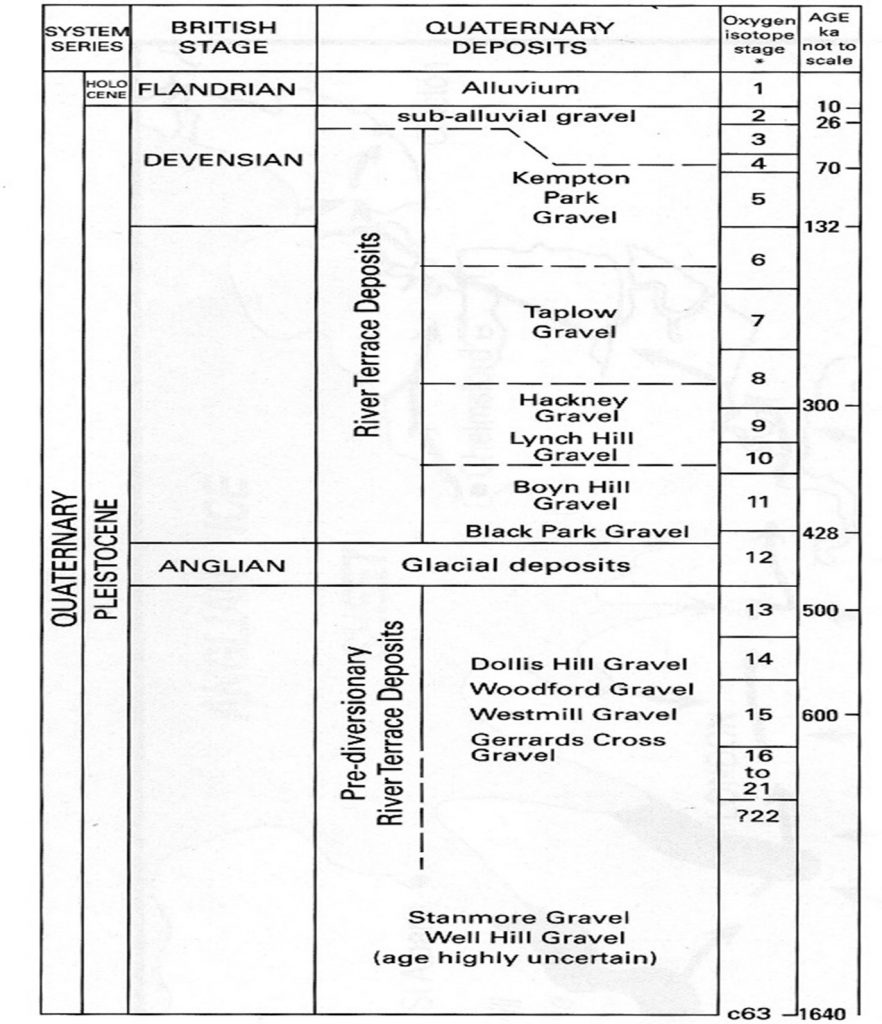
According to previous publications, only ‘Alluvium’ OIS 1 was laid down on the landscape (as at our Case Study site in the Thames Valley) directly after the last Ice Age, 10k years ago.  But there is no evidence that that is true or that the larger rivers would not have washed the previous deposits further down the stream, making these sequences incorrect; consequently, the ‘River Terrace’ Deposits of:

Kempton Park – Taplow – Hackney – Lynch Hill – Boyn Hill and Black Park are Holocene in origin (or a mixture) and not solely Late Pleistocene as suggested in Geology books.   In practical terms, when we examine boreholes, we should look for the ‘floodplain Terrance’ to indicate the extent of Holocene flooding and ignore the guestimations of gravel deposits.

(The Thames through time)
Figure 31. Traditionally expressed river terrace deposits by ‘guesstimated’ age
(The Thames through time)

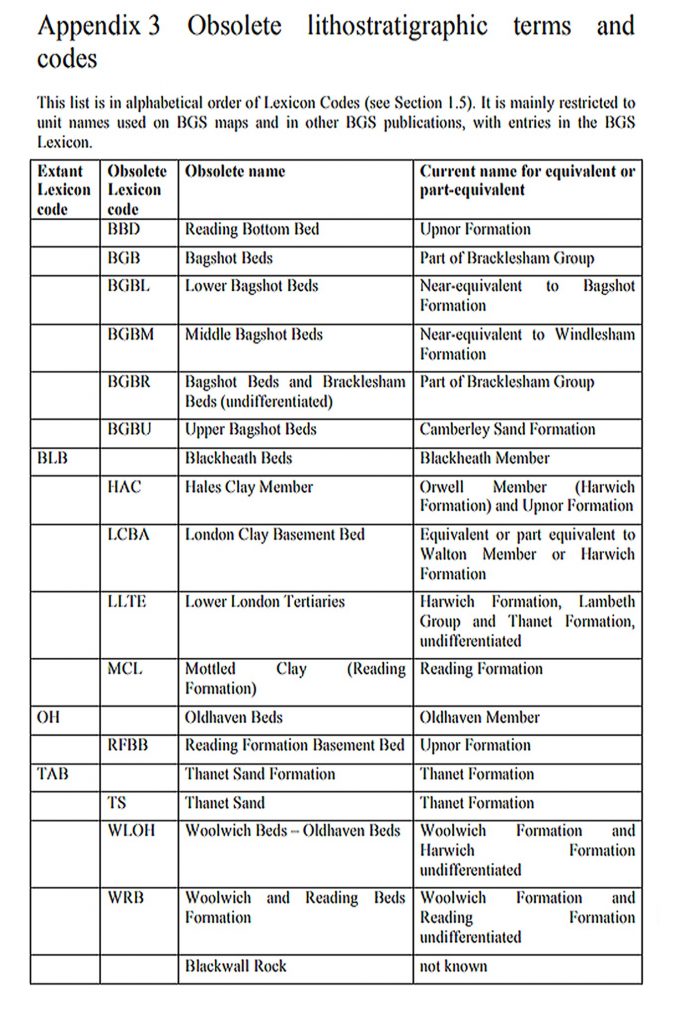
This ambiguity is, in fact, pointed out in BGS’s –‘The stratigraphical framework for the Palaeogene successions of the London Basin, the U.K. where it states that “In some areas, notably the north-eastern part of the London Basin, it has proved difficult to subdivide the strata between the Chalk and the London Clay with confidence” and this view is commonplace through the history of British Geology and hence the constant reclassification as shown in their obsolete terms table.

(The Thames through time)
Figure 32. Obsolete terms are a common occurrence in Geology as modern new methods are incorporated. BGS Superficial Deposits Handbook.
(The Thames through time)

This assumption is also highlighted by Lewin et al. (2005), who state –

“Furthermore, their assumption that floodplain gravels were Pleistocene in age was not supported by dating, and work both on the Thames (Robinson, 1992, Fig. 19.2) and more widely elsewhere (Brown et al., 1994) tends to suggest that late dates for overbank sedimentation may generally be constrained by the fact that the gravels beneath are themselves often of considerably later date than was earlier assumed.”

And concluded with “Overall, the skewed distributions suggest rapid autogenic recycling of older materials, with earlier deposits only being preserved beyond the reach of river activity (e.g. in terraces or floodplains which have not been impinged on by later river migration). The exceptions to this are floodplain environments where localised long-term aggradation has permitted the greater preservation of older Holocene units. To obtain evidence from parts of the Holocene that remain less well known, such sites still require discovery and study, whilst commonplace deposits (notably floodplain gravels) would benefit from the application of dating techniques that are less dependent on the fortuity’s preservation of datable organic materials”.

When we look at Palaeolithic sites on a regional scale, such as in the Thames basin, several general problems become apparent. The first is correlation and chronology. By their very nature, terrace fragments may not be unequivocally traceable down a river system. Ideally, a combination of surveying, stratigraphic description and lithological analysis is required to correlate fragments with key sites where more than one formation is present. None of these methods alone can be relied upon; for example, the same lithological content does not necessarily imply time equivalence, especially where rivers are reworking previous gravel terraces. (Brown et al., 1997)

Until the 1950s, archaeology dated the geology, but it is now increasingly the other way around. From the nineteenth century onwards, the traditional chronology of Northern European Pleistocene terraces was based on a combination of hand-axe typology, stratigraphy and counting climatic episodes back in time or from the top of the sequence down. This methodology was based on the belief that axe typology followed a clear progression from what we perceive as crude or simple to elegant or sophisticated, and that this progression occurred at roughly the same rate across different places. This was allied to the belief that a typology represented a ‘culture’.

Chronology

This chronology and methodology have been questioned for a variety of reasons (Green and McGregor, 1980). First, the traditional chronology was at odds with revised Pleistocene chronologies from ocean cores and from new terrestrial sites in North-West Europe, which showed an extremely complex picture of glacial, interglacial, stadial and interstadial stages. The ocean cores, for example, show at least 30 warm/cold cycles, and the terrestrial record has improved through the discovery of more sites and new chronometric dating techniques (Lowe and Walker, 1984; Jones and Keen, 1993).

However, the terrestrial record in Britain still shows major discontinuities in comparison with the ocean record and the much more detailed chronologies from the Netherlands and Germany. A chronology, and it must be noted that there is considerable debate and uncertainty about not only the position of major British stratigraphic units but also the number of pre-Pastonian and post-Hoxnian-pre-Ipswichian climatic cycles present in the British record (Jones and Keen, 1993).

Moreover, given that the river gravel sequences are ‘problematical’, we can now revisit the Holocene ‘Alluvium’ map to see whether the boundaries of the Holocene Thames were even more significant than those shown in the original BGS map.

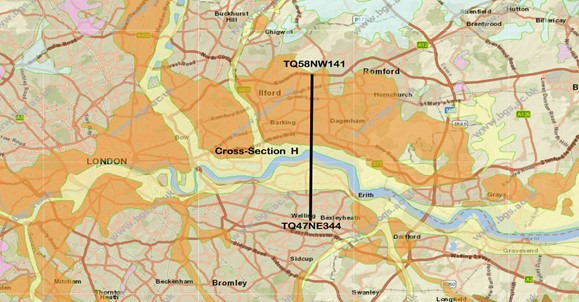
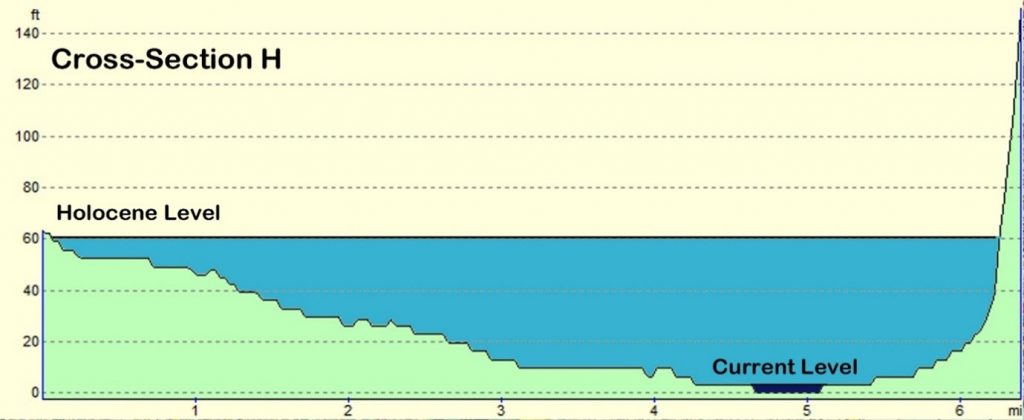
If we look at the Cross-Section H profile, we see that the area of the Holocene effect increases by at least one mile and is terminated by Boreholes TQ47NE344 and TQ58NW141.

(The Thames through time)
Figure 34. Cross-Section H
(The Thames through time)
BGS map of ‘superficial’ deposits left by the last LGM with cross-section H and the two boreholes (borehole details in Appendix A)
(The Thames through time)

Borehole TQ47NE344 – shows 5.95m of “Brown Silty Sand” before hitting Chalk and TQ58NW141 4.42m of “Loamy Sand and Stones” with a base of “sand and Gravel”.

This increases the Thames Flood Model from a discharge of 2,450 m3/s to 12,250 m3/s, which more accurately reflects the North American Discharge Model.

If we take this new model into account, the Thames valley will look very different to today, with all of the ‘superficial sediments’ being covered by water at the start of the Holocene period, 10 – 6 Ka.

(The Thames through time)
How London probably looked just after the LGM, about 10,000 BCE, with as much water as land and most of it swampy.
(The Thames through time)

We can review the Hornchurch Marshes Paper (Branch et al., 2012) and examine the results to identify outcomes and possible related dates for our new Thames Valley flooding model.

(The Thames through time)
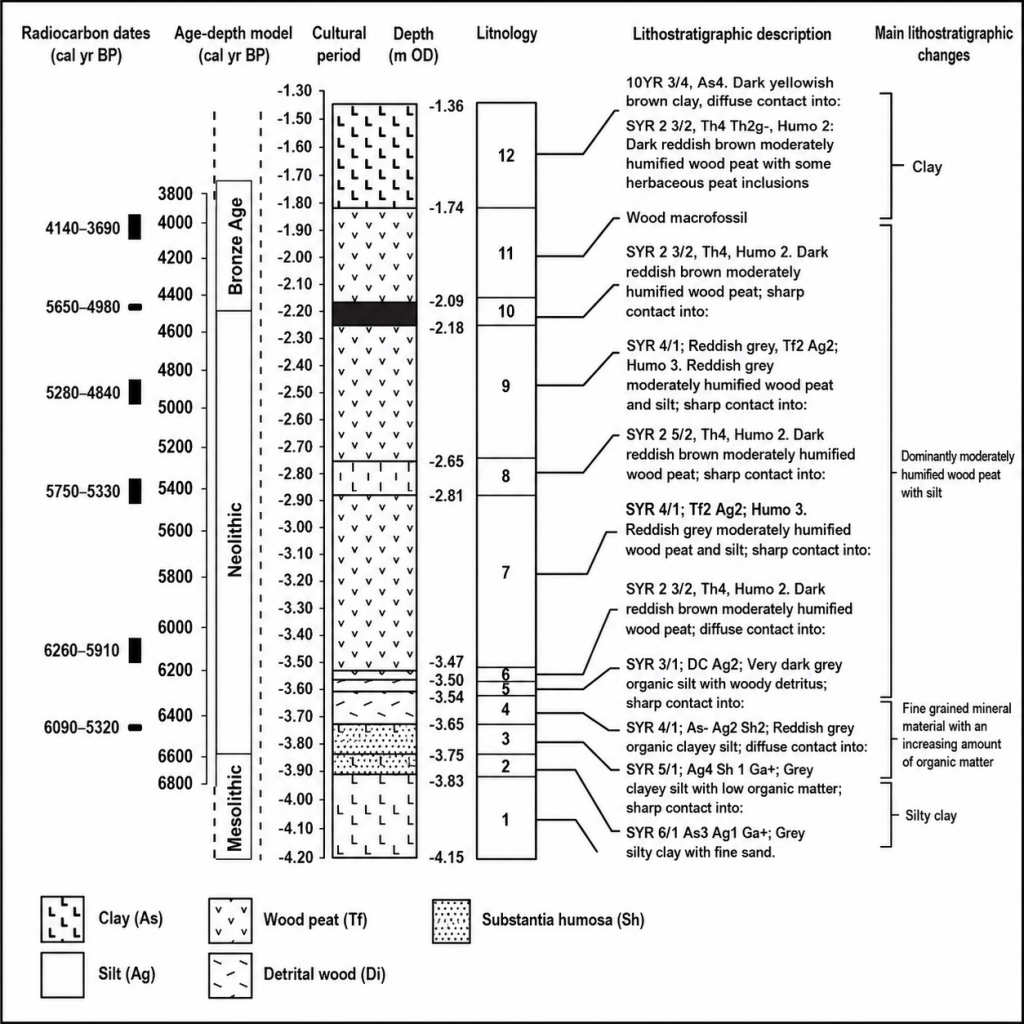
(Branch et al.,2012) Hornchurch marshes investigation
(The Thames through time)

The radiocarbon dates show that the site was inhabited during the early Holocene period “Between −4.15 and −3.83 m O.D., a clay-rich sedimentary unit was deposited probably on the margins of a river channel (floodplain)” This would give us an idea of how much sediment was deposited by the river during the early Holocene, directly after the last ice age.  If we look at boreholes around this site and within a few hundred metres of it, those bored lower, we can develop a working hypothesis.

Borehole TQ58SW:1 – the closest to the site (Appendix A) shows the sand and pebbles go down another 12.8m until it reaches “Coloured Sands and Stones”, whilst Borehole TQ58SW762 shows the names of many more segments, including ‘terrace gravel’ that goes down to 12.2m below the surface – which confirms our Holocene water level set at 40′ or 12.2m.

Between −3.54 m O.D. and −1.74 m O.D., the formation of wood peat represents the creation of more terrestrial conditions at the site. The results of the radiocarbon dating indicate that peat formation commenced at c. 6300 cal. Yr B.P. and ceased at c. 3900 cal. Yr B.P. with the onset of estuarine sedimentation.

Closer inspection of the Lithostratigraphic descriptions and Lithology reveals that the site suffered possible flooding about 6800 yr B.P. as silt deposits are found in unit number 2&3 (Figure 36.) after over 3000 years of flooding since the end of the last ice age and a build-up of ‘Grey Silty Clay and fine sand’ as would be expected.

There is then a sequence of peat (an accumulation of partially decayed vegetation or organic matter. It is unique to natural areas called peatlands, bogs, mires, moors, or muskegs) growth as this become a marsh area because of the Holocene flooding as is a majority of Britain (as we have seen in Fig. 25). This marshland lasted for 1200 – 1600 years (Unit number 4 -7, figure 36.).

Then there seems to be a flood period of about 200 years during which the area was inundated with a deposit of Sand and clay, replacing the marshland peat, dated 5750 – 5330 cal yr B.P. We then see another 1500 years as a marshland, with new peat samples, before another river flood at 3800 BP. The carbon dating of this site provides the evidence we require to finally prove that rivers were not only higher in the Holocene/Mesolithic period, but also remained high to such an extent that they periodically flooded into recent history, as we will now further illustrate.

NB. Extract from the Book ‘Post-Glacial Flooding Hypothesis’

  PODCAST

Author’s Biography

Robert John Langdon, a polymathic luminary, emerges as a writer, historian, and eminent specialist in LiDAR Landscape Archaeology.

His intellectual voyage has been interwoven with stints as an astute scrutineer in government and grand corporate bastions, a tapestry spanning British Telecommunications, Cable and Wireless, British Gas, and the esteemed University of London.

A decade hence, Robert’s transition into retirement unfurled a chapter of insatiable curiosity. This phase saw him immerse himself in Politics, Archaeology, Philosophy, and the enigmatic realm of Quantum Mechanics. His academic odyssey traversed the venerable corridors of knowledge hubs such as the Museum of London, University College London, Birkbeck College, The City Literature Institute, and Chichester University.

In the symphony of his life, Robert is a custodian of three progeny and a pair of cherished grandchildren. His sanctuary lies ensconced in the embrace of West Wales, where he inhabits an isolated cottage, its windows framing a vista of the boundless sea – a retreat from the scrutinising gaze of Her Majesty’s Revenue and Customs, an amiable clandestinity in the lap of nature.

Exploring Prehistoric Britain: A Journey Through Time

My blog delves into the fascinating mysteries of prehistoric Britain, challenging conventional narratives and offering fresh perspectives grounded in cutting-edge research, particularly LiDAR technology. I invite you to explore some key areas of my research. For example, the Wansdyke, often cited as a defensive structure, is re-examined in light of new evidence. I’ve presented my findings in my blog post Wansdyke: A British Frontier Wall – ‘Debunked’, and a Wansdyke LiDAR Flyover video further visualises my conclusions.

My work also often challenges established archaeological dogma. I argue that many sites, such as Hambledon Hill, commonly identified as Iron Age hillforts, are not what they seem. My posts Lidar Investigation Hambledon Hill – NOT an ‘Iron Age Fort’ and Unmasking the “Iron Age Hillfort” Myth explore these ideas in detail and offer an alternative view. Similarly, sites like Cissbury Ring and White Sheet Camp receive re-evaluations based on LiDAR analysis in my posts “Lidar Investigation Cissbury Ring through time” and “Lidar Investigation White Sheet Camp,“ revealing fascinating insights into their true purpose. I have also examined South Cadbury Castle, often linked to the mythical Camelot56.

My research also extends to ancient water management, including the role of canals and other linear earthworks. I have discussed the true origins of Car Dyke in multiple posts, including Car Dyke – ABC News Podcast and Lidar Investigation Car Dyke – North Section, which suggest a Mesolithic origin 2357. I also explore the misidentification of Roman aqueducts, as seen in my posts on the Great Chesters (Roman) Aqueduct. My research has also been greatly informed by my post-glacial flooding hypothesis, which has helped explain landscape transformations over time. I have discussed this hypothesis in several posts, including AI now supports my Post-Glacial Flooding Hypothesis and Exploring Britain’s Flooded Past: A Personal Journey

Finally, my blog also investigates prehistoric burial practices, as seen in Prehistoric Burial Practices of Britain and explores the mystery of Pillow Mounds, often mistaken for medieval rabbit warrens, but with a potential link to Bronze Age cremation in my posts: Pillow Mounds: A Bronze Age Legacy of Cremation? and The Mystery of Pillow Mounds: Are They Really Medieval Rabbit Warrens?. My research also includes astronomical insights into ancient sites, for example, in Rediscovering the Winter Solstice: The Original Winter Festival. I also review new information about the construction of Stonehenge in The Stonehenge Enigma.

Further Reading

For those interested in British Prehistory, visit www.prehistoric-britain.co.uk, a comprehensive resource featuring an extensive collection of archaeology articles, modern LiDAR investigations, and groundbreaking research. The site also includes insights and excerpts from the acclaimed Robert John Langdon Trilogy, a series of books that explore Britain during the Prehistoric period. Titles in the trilogy include The Stonehenge Enigma, Dawn of the Lost Civilisation, and The Post-Glacial Flooding Hypothesis, which offer compelling evidence of ancient landscapes shaped by post-glacial flooding.

To further explore these topics, Robert John Langdon has developed a dedicated YouTube channel featuring over 100 video documentaries and investigations that complement the trilogy. Notable discoveries and studies showcased on the channel include 13 Things that Don’t Make Sense in History and the revelation of Silbury Avenue – The Lost Stone Avenue, a rediscovered prehistoric feature at Avebury, Wiltshire.

In addition to his main works, Langdon has released a series of shorter, accessible publications, ideal for readers delving into specific topics. These include:

For active discussions and updates on the trilogy’s findings and recent LiDAR investigations, join our vibrant community on Facebook. Engage with like-minded enthusiasts by leaving a message or contributing to debates in our Facebook Group.

Whether through the books, the website, or interactive videos, we aim to provide a deeper understanding of Britain’s fascinating prehistoric past. We encourage you to explore these resources and uncover the mysteries of ancient landscapes through the lens of modern archaeology.

For more information, including chapter extracts and related publications, visit the Robert John Langdon Author Page. Dive into works such as The Stonehenge Enigma or Dawn of the Lost Civilisation, and explore cutting-edge theories that challenge traditional historical narratives.

Other Blogs

s

t

Mesolithic River Avon

Rivers were higher in the past – Now UPDATED here: https://prehistoric-britain.co.uk/case-study-river-avon

At the outset, the clay-with-flints, a vestige of ancient weathering and erosion, stands as a testament to the relentless forces of nature that sculpted the landscape. Born from the remnants of Palaeogene sediments and the dissolution of chalk, these deposits serve as silent witnesses to the Pleistocene’s cold embrace. Their presence on the hilltop flats signifies a chronological anchor, predating the rhythmic succession of river terraces that stitch the valley’s quilt. (The Mesolithic River Avon)

Rivers were higher in the past (The Mesolithic River Avon)

As one descends the slopes, a mosaic of older head deposits unfolds, their genesis tied to the ancient processes of solifluction and solution. These sediments, bound to the clay-with-flint, narrate a tale of gradual descent and transformation, shaping the valley’s upper reaches with a subtle, yet profound, hand.

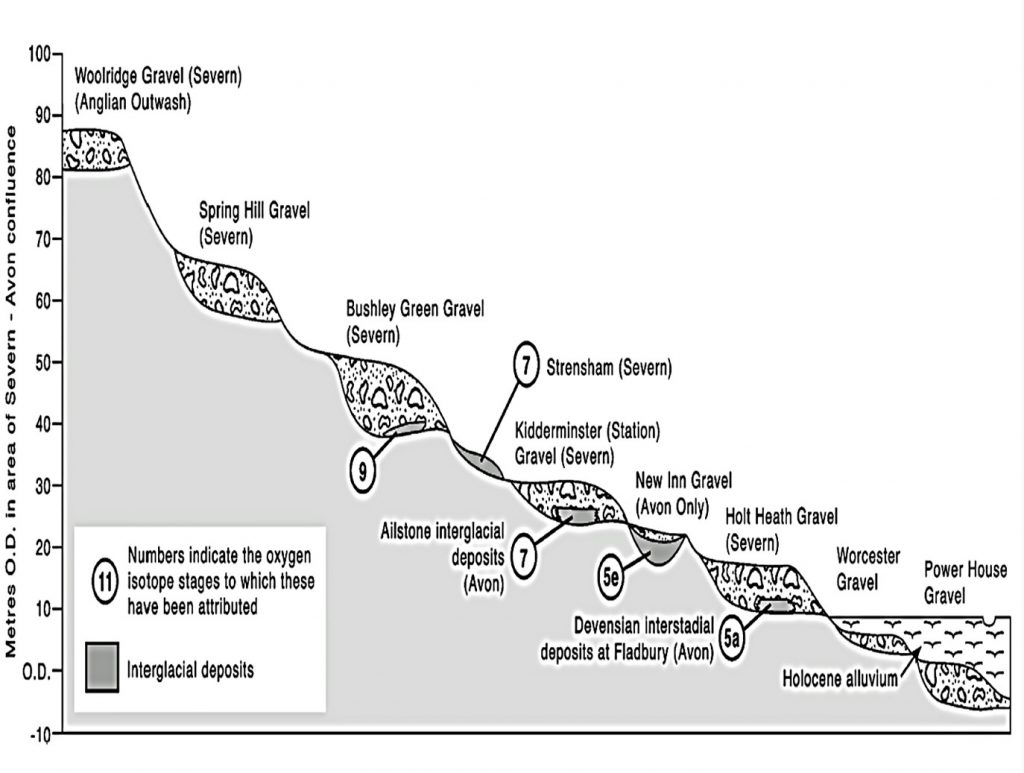
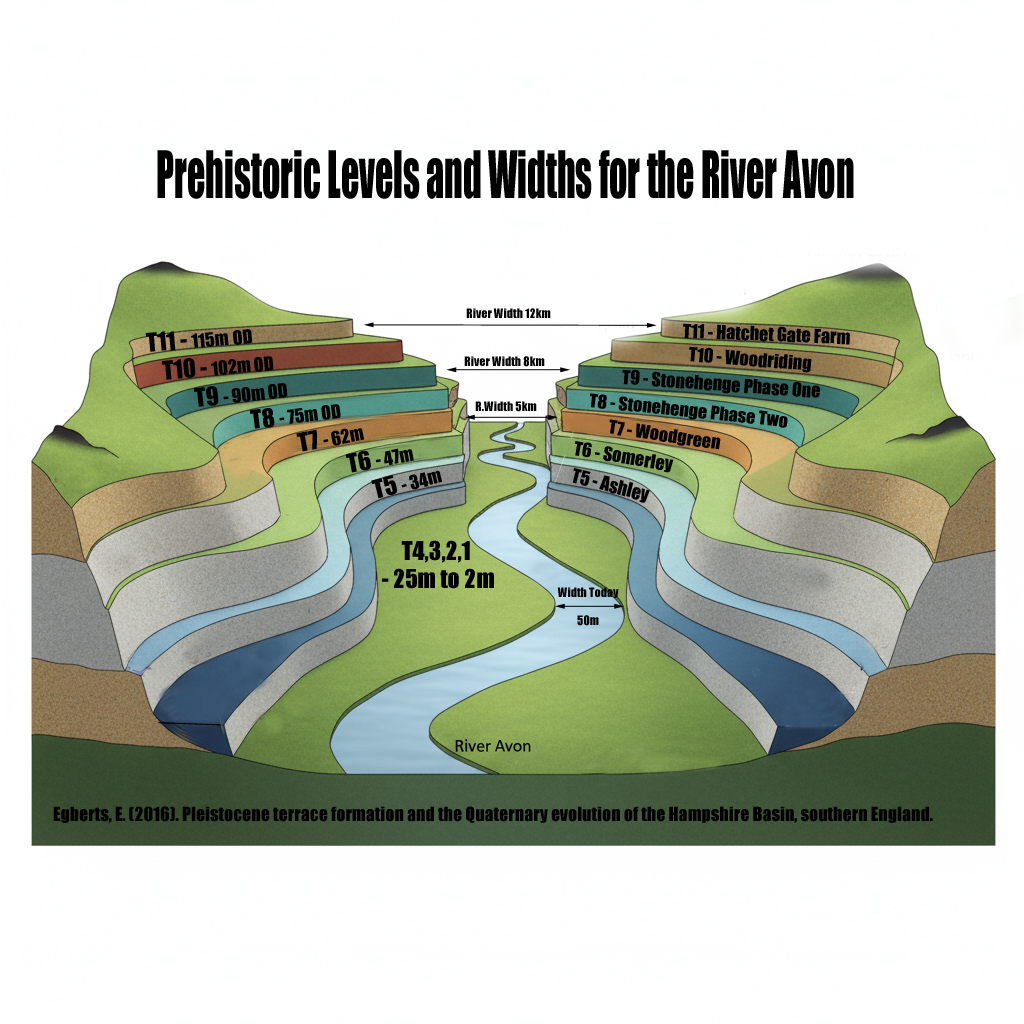
Further down the valley, the narrative evolves with the introduction of head gravel, gravelly head, and head deposits. These characters in the valley’s story are borne of fluvial transport, hill wash, hill creep, and solifluction—agents of change that have, over millennia, contributed to the valley’s sculptural form. The river terraces, numbering fourteen, ascend like steps from the valley floor, each a plateau from which to view the passage of time. The highest terraces, perched up to 100 meters above the valley, offer a broad vista extending 12 kilometers across, while the lower terraces, more intimate in their proximity to the present-day river, mark the recent chapters of geological history.

The consistency of thickness across these terraces speaks to a dynamic equilibrium of erosion and deposition, influenced by sediment overloading and tributary contributions. This interplay suggests a complex narrative of landscape evolution, one not solely dictated by the simplistic rhythm of Marine Isotope Stage cycles but enriched by a multifaceted process of lateral erosion and sediment redeposition.

Amidst this discussion of terraces and quaternary deposits, the narrative briefly diverges to contemplate the pre-Quaternary geology, where terraces from the River Avon linger in the Hampshire basin, their ages enshrouded in mystery. The challenges of dating these terraces, and by extension, understanding the full scope of the valley’s geological history, are underscored by recent findings that question traditional dating methods. Such inquiries not only deepen the mystery but also invite a reevaluation of our understanding of the Earth’s past.

Thus, we are reminded that the study of the Avon valley’s quaternary deposits is not merely an academic exercise but a profound exploration of the human quest for knowledge and understanding. It is a journey that connects us to the very essence of the natural world, revealing the intricate interplay of forces that have shaped not only the valley but also the broader tapestry of Earth’s geological history. (The Mesolithic River Avon)

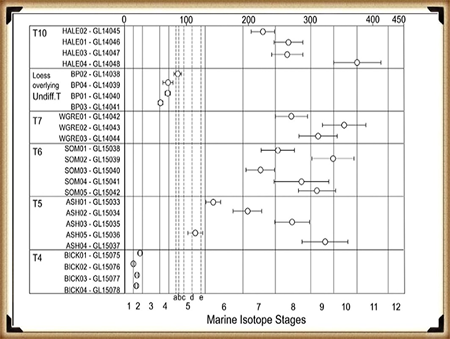
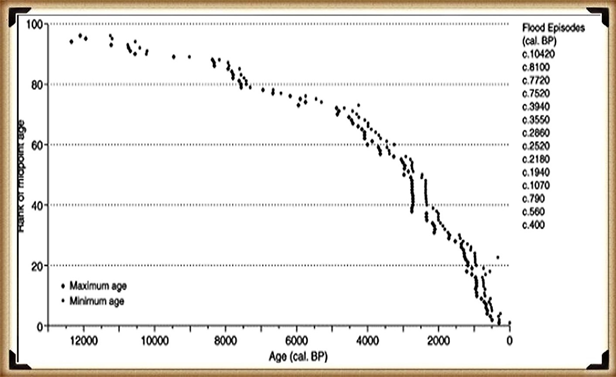
Figure 5 - OSL Results Avon River (The Mesolithic River Avon)
Figure 5 – OSL Results Avon River
(The Mesolithic River Avon)

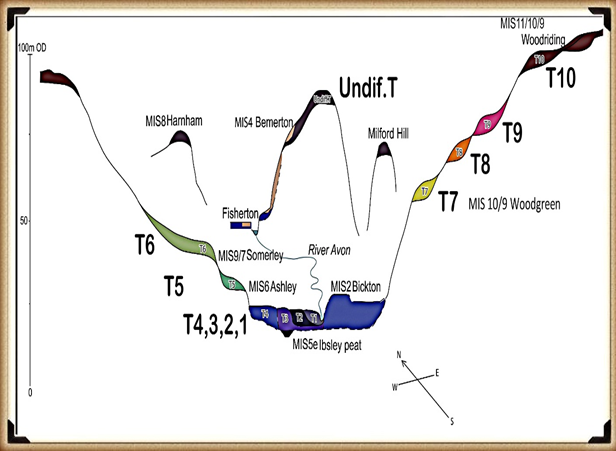
The intriguing findings presented in the diagrams regarding Optically Stimulated Luminescence (OSL) dating within the Avon valley unearth a complex narrative of sediment deposition and geological processes that challenges traditional understandings. The OSL results, as depicted in Figure 5, illuminate the temporal relationship between terrace formations and Marine Isotope Stages (MIS), while Figure 6, based on a three-dimensional model constructed from borehole data, offers a visual cross-section of the valley’s superficial geology.

The OSL ages for terraces T10 through T7, indicating deposition during or before MIS10/9, including the Last Glacial Maximum (LGM), suggest a timeline that not only aligns with but also refines previously established chronological frameworks. This refinement has significant implications for interpreting the archaeological record associated with Terrace T7 and recalibrating regional uplift and incision rates, which are crucial for understanding landscape evolution over geological timescales.

However, the apparent inconsistencies in the OSL dating results, particularly the dating of Terrace T7 before Terrace T10 and the identification of a Loess Terrace laid during the LGM, introduce a paradox into the sedimentary record. These anomalies challenge the linear progression implied by the terrace hypothesis that has guided interpretations of the valley’s geological history.

The highest terrace, T10, positioned at 102 meters above ordnance datum (OD) as illustrated in Figure 6, spans an unexpectedly broad temporal range of over 200,000 years, according to OSL dating. This finding disrupts the presumed chronological order, especially when juxtaposed with the dating of Terrace T7 at 58 meters OD, which, perplexingly, predates T10. Additionally, the Loess Terrace, situated at 77 meters OD and undifferentiated in the terrace sequence, laid down during the LGM, along with Terrace T4, which harbors the youngest dates, further complicates the scenario.

These results hint at a more intricate story of terrace formation and sediment deposition than previously thought. The seeming randomness and inconsistencies in the dating challenge the traditional terrace hypothesis and suggest that other factors, perhaps related to climatic variations, tectonic activities, or both, played significant roles in shaping the valley’s geomorphology.

The evidence points to a dynamic and possibly non-linear process of terrace formation, where episodes of sediment deposition were influenced by a combination of environmental conditions, rather than a simple chronological succession. This complexity underscores the need for a reassessment of the methods and models used to date and interpret terrace formations, advocating for a more nuanced understanding of the interplay between geological processes and climate change over the Pleistocene.

Thus, while the OSL dating provides valuable insights into the timing of terrace deposition, it also raises critical questions about the reliability of traditional chronological frameworks and the factors driving landscape evolution in the Avon valley. These findings invite further investigation and a reevaluation of existing hypotheses, highlighting the ongoing dialogue between past and present in the quest to decipher Earth’s geological history.

Figure 6- Avon River Terrace Levels - Avon River
Figure 6- Avon River Terrace Levels – Avon River
(The Mesolithic River Avon)

The authors’ observations highlight significant discrepancies and anomalies in the OSL dates that raise questions about the method’s reliability in certain contexts, particularly when compared to other dating methods like radiocarbon dating. These discrepancies are not merely academic curiosities; they fundamentally challenge our understanding of the temporal and environmental context in which these sediment layers were deposited.

The attempt to explain the notable discrepancy in the age estimates of Terrace T4 across different locations within the Avon valley suggests that sediment reworking due to recent fluvial processes or the presence of compound terraces exhibiting different depositional behaviors might be responsible. This acknowledgment of variability within the depositional environment underscores the dynamic nature of fluvial landscapes and the complexity of accurately dating such contexts.

The variability in OSL dates for samples taken at the same soil level (e.g., GL14039, GL14041, GL14038, GL14040) further complicates the narrative. The presence of nearly contemporaneous dates within error limits, juxtaposed with the significantly different sedimentation rates observed just below the topsoil, suggests that the depositional history of the Avon valley is more nuanced than previously understood. These findings indicate that relying solely on visual stratigraphy for dating purposes can lead to inaccuracies, reinforcing the need for a multi-methodological approach to construct a reliable chronological framework.

The comparison between OSL and radiocarbon dating, as discussed in the Gaigalas (2000) study, exemplifies the potential for significant age discrepancies between different dating methods. The observation that OSL dates can be substantially older than their radiocarbon counterparts highlights the need for caution and cross-validation when interpreting chronological data, especially in contexts where sediment exposure and reworking may have occurred.

The discussion of Holocene river flooding and its impact on the dating of river terraces introduces an additional layer of complexity. Flooding events can lead to the deposition of silt and other materials that obscure the original depositional sequence, potentially leading to out-of-sequence terrace dates. This phenomenon complicates attempts to use uplift modeling or the Palaeolithic record as reliable chronological markers, as evidenced by the discrepancies in age estimates for Terrace T7.

The passage concludes by emphasizing the potential of terrace deposits to provide a valuable chronological framework, albeit one that must be approached with caution. By integrating chronometric age control with detailed modeling of deposit height and thickness, researchers can gain a more nuanced understanding of the Avon valley’s landscape evolution. This approach not only enhances our interpretations of past hominin landscape use but also improves the predictive modeling of Palaeolithic sites. The challenges and discrepancies encountered in OSL dating underscore the importance of adopting a holistic and critically engaged approach to understanding the geological past, one that acknowledges the inherent complexities and uncertainties of dating dynamic fluvial landscapes.

Finally, archaeologists and geologists resist the fact that the river Avon was in Stonehenge Bottom during the Mesolithic and Neolithic period.  They insist that there is no evidence in the form of Alluvium or Colluvium in sufficient quantities to support my hypothesis.  This objection has a simple solution as Julian Richard’s suggested in his book ‘The Stonehenge Environs Project’: “colluvium sediments may have been removed or thinned by the action of seasonal streams or higher water tables in the past”. 

Macklin, as we have now seen in this section has identified over one hundred Holocene river floods, twelve of which lasted hundreds of years, that would have contributed to this lack of alluvium or colluvium at Stonehenge Bottom.  Moreover, the sources of the rivers that lay this sediment over the centuries of water flow, rely on massive precipitation entering the rivers, cutting through rocks and valleys making them flow at extreme levels which create this erosion and consequential sediment. However, the source of Palaeochannel water are natural springs found locally underground and therefore would not contain the same alluvium levels as active flowing rivers – resolving this dilemma.

Model of the number of flooded rivers in Britain - River Avon
Model of the number of flooded rivers in Britain – River Avon

UPDATE

More Empirical Evidence of Post-Glacial Flooding and a Flooded Stonehenge

River Avon River Terraces

 Prehistoric Levels and Widths for the River Avon

Take a close look at this illustration. It is not speculation, it is empirical science — mapped and measured river terraces from the Avon Valley, published in Egberts (2016), Pleistocene terrace formation and the Quaternary evolution of the Hampshire Basin, Bournemouth University.

What are we looking at?

  • These are the terrace steps cut by the River Avon over multiple glacial–interglacial cycles.
  • Each “T-level” marks a former stable floodplain where the river held its height for centuries, often millennia.
  • The heights are measured in metres OD (Ordnance Datum) and tied to known quarry and pit sites (e.g. Hatchet Gate Farm, Woodgreen, Somerley, Ashley).

💧 How much bigger was the Avon?

  • Today, the river meanders with a width of just ~50 m near Salisbury.
  • At its maximum (T11), the Avon floodplain stretched ~12 km across.
  • That is ~240 times wider than the river today.

🌊 What does this mean for Stonehenge?

  • Phase 1 of Stonehenge (Car Park Postholes) sits on T9 (~90 m OD).
  • Phase 2 (ditch, Aubrey Holes, bluestones) cuts into T8 (~75 m OD).
  • The terraces show that the palaeochannel not only flooded up to the old car park, but at times overtopped the entire Stonehenge site.

📐 Why this matters:

  • Terraces are not theory — they are empirical geomorphological evidence.
  • They prove that the Avon has flooded to multiple levels, sometimes far higher than the monument itself.
  • This is not about “if” water could reach those heights — the terraces prove it already has, repeatedly, over many Ice Age cycles.

So when critics dismiss the role of high water tables or argue “the site couldn’t have been wet,” they are ignoring the most basic geological record in front of us. The terraces are the diary of the river — written in gravel, chalk, and silt — showing that water rose and fell, over and over again.

👉 The real question is not if Stonehenge was surrounded by water. It is when, and how many times it happened during its long prehistory.

More information on the River Avon can be found at: https://youtu.be/j5LJ2sGcKOA

Further Reading

For information about British Prehistory, visit www.prehistoric-britain.co.uk for the most extensive archaeology blogs and investigations collection, including modern LiDAR reports.  This site also includes extracts and articles from the Robert John Langdon Trilogy about Britain in the Prehistoric period, including titles such as The Stonehenge Enigma, Dawn of the Lost Civilisation and the ultimate proof of Post Glacial Flooding and the landscape we see today.

Robert John Langdon has also created a YouTube web channel with over 100 investigations and video documentaries to support his classic trilogy (Prehistoric Britain). He has also released a collection of strange coincidences that he calls ‘13 Things that Don’t Make Sense in History’ and his recent discovery of a lost Stone Avenue at Avebury in Wiltshire called ‘Silbury Avenue – the Lost Stone Avenue’.

Langdon has also produced a series of ‘shorts’, which are extracts from his main body of books:

The Ancient Mariners

Stonehenge Built 8300 BCE

Old Sarum

Prehistoric Rivers

Dykes ditches and Earthworks

Echoes of Atlantis

Homo Superior

For active discussions on the findings of the TRILOGY and recent LiDAR investigations that are published on our WEBSITE, you can join our and leave a message or join the debate on our Facebook Group.

Other Blogs

s

t