Chapter 3 – Stonehenge Phase II

Book Extract…………………………….. The Stonehenge Enigma (Stonehenge Phase II)

The Avenue

When the waters started to subside, the builders of Stonehenge had an engineering problem: how to cope with the lower groundwater table, to allow the Stonehenge moat to remain full.  Firstly, as we have already illustrated, by lining the Stonehenge moat with a clay waterproofing, so it acted like a dew pond, and in this chapter we shall go into detail of how they built a new earthwork called ‘the Avenue’ with its own moat which brought the waters closer to the monuments bathing moat – (Stonehenge Phase II).

Processional Walkway

The Avenue was created sometime after the original moated henge, once the original Mesolithic groundwater and shoreline lowered towards the new Neolithic groundwater level.  When the water levels fell, the builders faced two problems; firstly, the original mooring could no longer accept boats or cargo, so a new entrance was required. Secondly, the moat would no longer fill as it did in Mesolithic times, as the water table had dropped by about 10 metres.

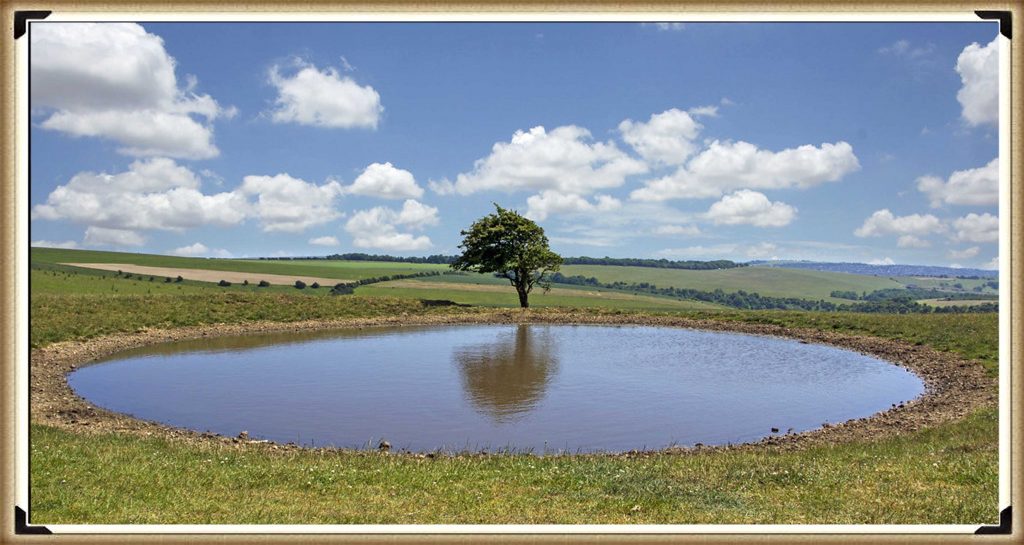
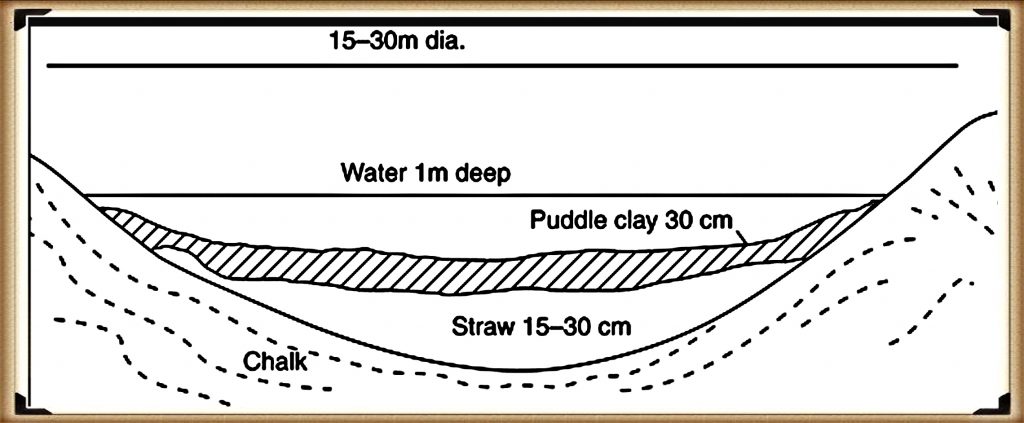
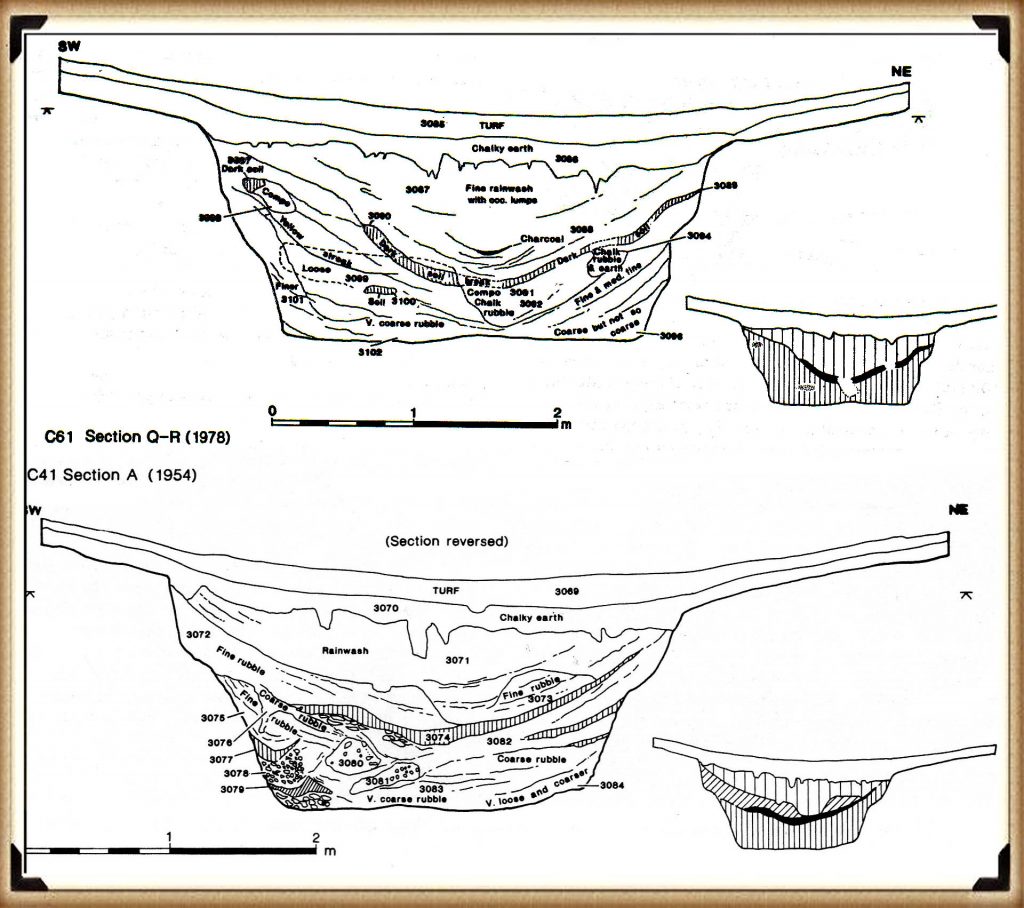
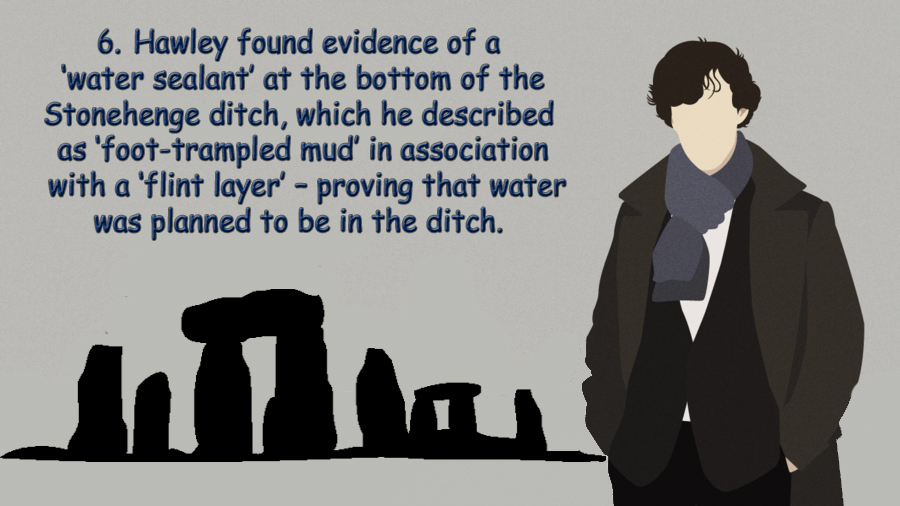
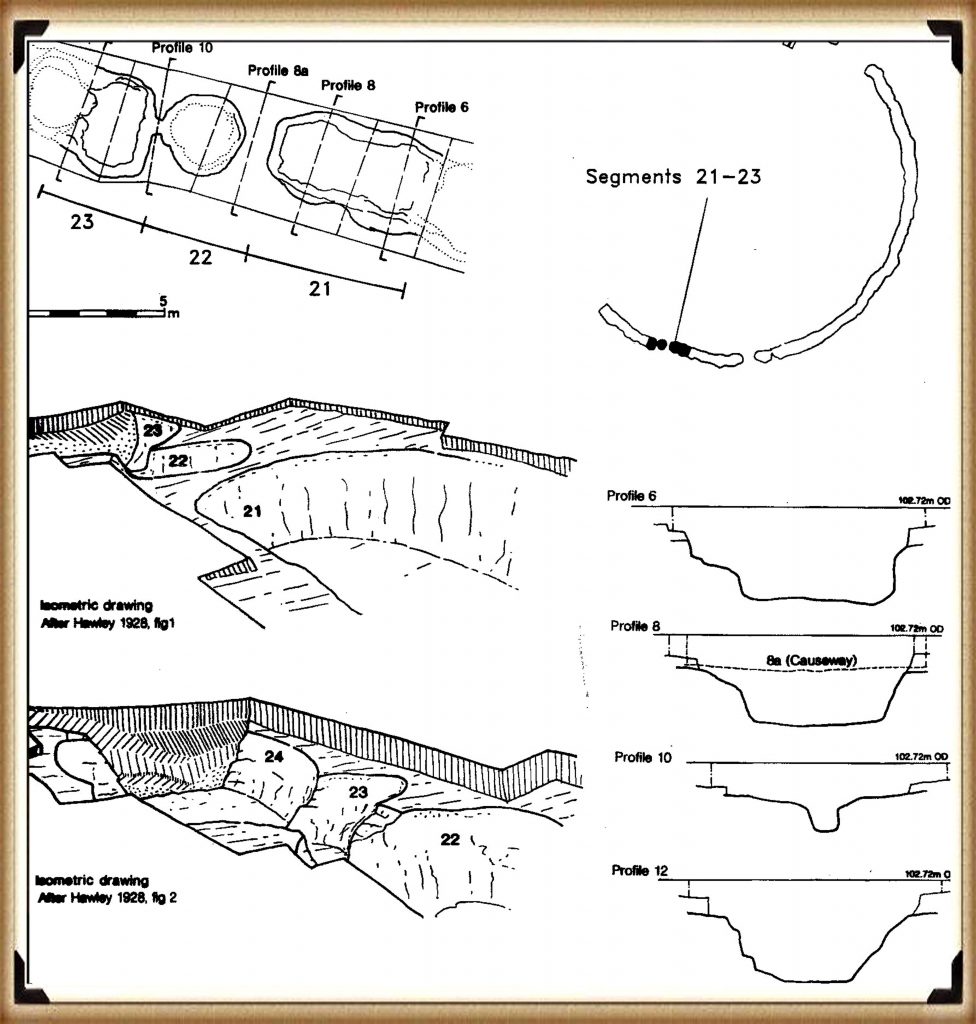
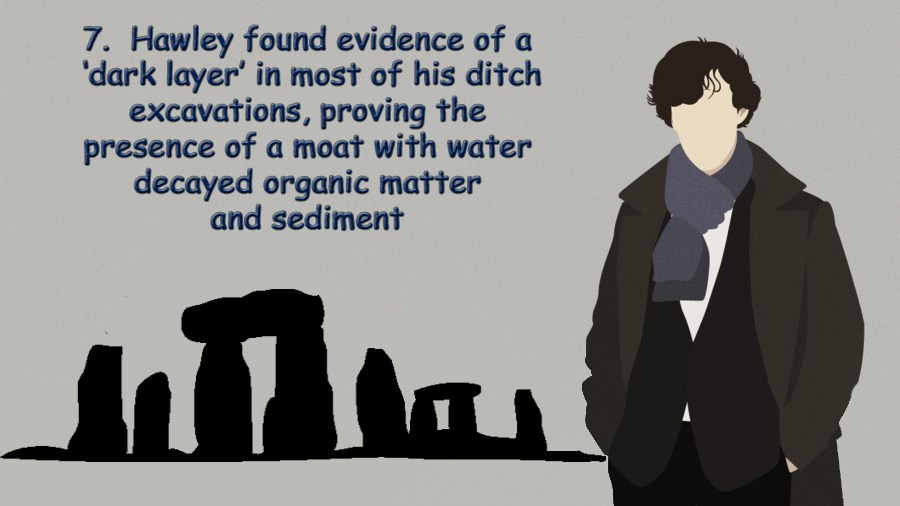
As we have seen from the excavations by Hawley in the 1920s, the builders had added a liner similar to those found in other Mesolithic period constructions like ‘dew ponds’ also found in this area. The reason for the liner would have been to retain the water that accumulated by the natural rain and seasonal high tides that would have replenished the moat.   It is entirely plausible that insufficient, or infrequently water levels were a common occurrence during the late Mesolithic, therefore if they wished to continue the bluestone treatments, an alternative method to fill the moat needed to be found.

The Avenue is quite curious, and excavations have revealed its ongoing development, as indicated by the post holes dotted down its entire length. This clearly shows that it ‘adapted’ over a long period to match the retreating shoreline in the Neolithic period, which lasted over two and a half thousand years.   Moreover, the physical construction of the Avenue earthwork shows the incorporation of water features.  The Southern ditch is much shallower than the Northern ditch of the Avenue. This is because the water lies on the Southern side of the Avenue and does not need extra depth to fill the Southern ditch evenly, while the Northern ditch is further away from the water (and on a gradient). For it to fill evenly to the same depth of water as the Southern ditch, the Northern ditch would therefore need to be 10% deeper.  Furthermore, this extra depth to one side of the monument can also be seen in the main ditch of Stonehenge as the main ditch corresponding to the northern avenue ditch is also 10% deeper.

Stonehenge Phase II
Stonehenge Phase II

Figure 31– North and South Avenue Ditch comparison

The wooden poles within the Avenue seem to be somewhat sporadic and impractical at first glance. But if you then add the prehistoric waters to the Avenue, you can see that the poles actually line up in pairs.  These pairs of posts seem to appear every ten metres as you proceed down the Avenue, indicating that the Avenue was created in sections.  This is a consequence of the periodic need to replacement of the poles as the shoreline retreated. The first main brace of these shoreline poles are seen quite close to the famous North-Eastern entrance by the Heel Stone, extending to the last evidence of the poles at the ‘elbow’ at the end.

Stonehenge Phase II
Stonehenge Phase II

The current ‘expert’ theories suggest that the path of the Avenue is a processional walkway down to the River Avon. But a careful study of this walkway shows that it makes absolutely no sense in the route it follows – it’s not direct, nor logical in its course.  What the avenue shows as we see today, is the continuation of its association with the River Avon, after the original Avenue that finished at Stonehenge Bottom had fallen into disuse.  This explains the strange haphazard route it now shows.  Archaeologists, not finding the valid reason for its course, attempt to justify the route as a ‘ceremonial’ pathway, which ignores the facts.  These ‘facts’ are compounded as later ancestors constructed Barrows that mimicked their ancestor’s constructions and placed burials within them, totally confusing the timeline.

Stonehenge Phase II
Stonehenge Phase II

The later attempts to keep a connection to the original builders of Stonehenge can be seen in the Avenue as it moves off to the North East for about 500 metres (the original construction), then suddenly swings off East for another 1,000 metres, then turns again and heads South, like a stretched lower case ‘n’. Archaeologists suggest that this is a ‘natural route’ deliberately passing burial mounds that lay to the East of Stonehenge.

The facts are; the walkway came first, followed by the introduction of the burial mounds – which is borne out by carbon dating showing that the Avenue was first introduced in Neolithic times, and the burial mounds much later in the Iron Age.  Also, archaeologists have identified that the Avenue was built in sections; the first section up to the ‘elbow’, according to Julian Richards in his book ‘The Stonehenge Environs Project’, was built during what archaeologists’ call ‘Period II’, including:

  • Modification of the original enclosure
  • Entrance
  • Construction of the first straight stage of the Avenue
  • Erection of the Station Stones
  • Resetting of the two entrance stones
  • Dismantling of the double bluestone circle

Our hypothesis (unlike the current expert views) answers this question fully.  The Avenue was built to meet the new shoreline that emerged during the Neolithic period, where (as at the old North West entrance) they received and moored the boats, cargo, and even the stones. Consequently, this then acted as a new entrance to the Stonehenge monument.

Stonehenge Phase II
Stonehenge Phase II

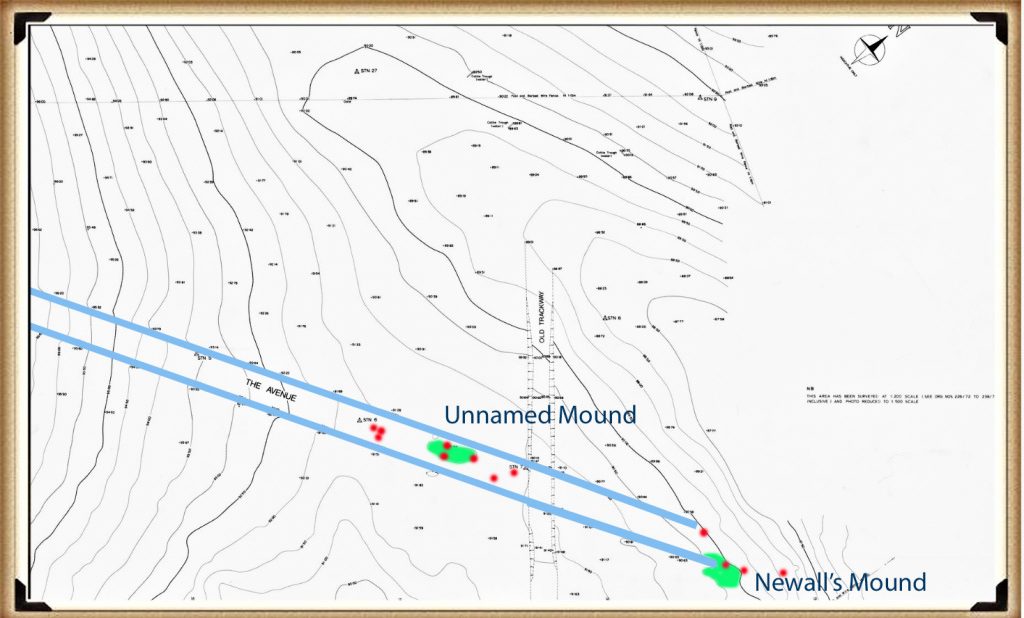
Further evidence of this shoreline can be seen in the post holes found in the Avenue. These post holes do not make sense, as they would have blocked the walkway unless they are mooring posts for various phases in the Avenue’s construction and water level.  A small survey carried out from 1988 to 1990 investigated the last 100m of the Avenue up to the elbow. (Cleal et al., 1995) It found 14 large post holes that could have been used as moorings for boats. These moorings are paired off at 45 degrees to the Avenue, which would match the exact shoreline predicted over several periods.
Stonehenge Phase II
Figure 32– The Avenue showing its termination and the wooden post holes and man-made mounds that were used to unload ships and boats
Stonehenge Phase II

Recent investigations have revealed that as well as post holes down the Avenue, there is a  distinctive man-made mound of ‘clay and flint’ called Newall’s mount (named after it’s discoverer) and a second mount, can also be found on the contour maps of the avenue (but has yet to be named or excavated), which has the same characteristics and post hole alignment. This indicates that these human-made mounds were used as raised platforms to unload boats as they could not serve any other practical purpose. (Stonehenge – the environment in the Late Neolithic and Early Bronze Age and a Beaker-Age burial, WANHS Magazine, 78, 1984, pp. 7-30)

NB. Such platforms are also found in the nearby site of Avebury, at a location I called Silbury Avenue, (which I discovered in 2014) and leads over Waden Hill, to a mooring platform called ‘Waden Mount’ located by photographer Pete Glastonbury in 2004. (Langdon, 2015, ‘Avebury’s Lost Stone Avenue’)

We can also date the extension past the ‘elbow’, as it no longer has the elaborate moats on either side of the processional walkway. The Avenue beyond the ‘elbow’ travels over a series of hillocks that could not hold water at any level and therefore made such moats useless and unnecessary.  This, again, shows that our ancestors were practical and pragmatic people who included aspects such as ditches for useful purposes, not for religious or aesthetic reasons as current archaeologists believe.

At this stage of the monument’s construction, I believe Stonehenge finally turned from being a monument to the moon, for curing the sick for excarnating the dead, to become a shrine to life and the sunrise – which was, in the Bronze Age and after that, taken over by a new civilisation of druids and iron age tribal cultures.

Stonehenge Phase II

The Avenue II

An indication of the changes that were introduced in Phase II of Stonehenge can be seen in the development of the Avenue to maintain the ceremonial link between Stonehenge and the river system.  Our ancestors started by backfilling the ditch in the North-East sector of the site. Both Hawley and Atkinson observed that the secondary filling was not natural. This backfill extended to a depth of 1 m, at which pottery and bluestone fragments are first seen, clearly indicating that it preceded the arrival of the bluestones.

When the Avenue was first constructed, it could have had a dual purpose: to serve as the new mooring processional way for the dead, and also to help maintain the groundwater levels, because the moat had been reduced to a trickle as a consequence of the lower river levels.

Stonehenge Phase II
Figure 33– The Avenue terminating at Stonehenge bottom showing the ditches on each side
Stonehenge Phase II

We have seen in the archaeological section of our hypothesis that Hawley had found a liner in the moat. This liner would not have been required when the moat was first constructed, as the groundwater tables were sufficiently high to fill the moat, whether daily or periodically. But a liner would have been necessary once the tidal groundwater no longer reached the base of the pits. To keep the moat waters at a suitable depth, the pits would have needed to be topped up from time to time with either groundwater from the receding rivers around Stonehenge, precipitation like dew ponds or manual transference (or a combination of all three).

The Avenue is a processional causeway that had a deep trench built into both sides (over 1m deep in places). This trench is totally unnecessary unless there is another reason for its use, and that reason was either practical or symbolic.

The ditch allows water to travel along the Avenue all the way up to the existing moat, but there is no evidence that it is directly connected – but it doesn’t need to be as we have already illustrated the fact that chalk is a porous material that will allow water to flow through it over short distances.

Sarsen Stones

The Sarsen stones would have been brought to the Stonehenge site before the river disappeared from ‘Stonehenge Bottom” to become the River Avon of today.   The reason why our ancestors used Sarsen stones is fascinating, as the original structure, which consisted of Welsh bluestones, lasted over 4,000 years as a centre for curing sickness. Clearly, they had a requirement for a very large monument built of a different stone.

From an engineering point of view, the size and structure were significant, and because of the size of these stones, the most effective means of transportation to this site would again be by boat. Even though the deeply forested landscape would have started to thin, the sub-soils would still have been waterlogged and marshy after the groundwater had receded, making it impossible to drag heavy stones across large distances.

The construction of the Sarsen monument is of even greater interest, because if they were building only for aesthetic pleasure, then you would imagine that simply laying one giant stone on top of another would be sufficient, as seen at other megalithic sites. But our ancestors wanted to do something special with these stones, so they carved mortise and tenon joints on their surfaces.  The only engineering reason for this method of construction would be that they required this site to last for a considerable time in history and hence it’s importance to this civilisation. 

The exact date of this process may never be fully known, for we have yet to excavate fully and carbon date the post holes in the Avenue similar to those in the car park at Stonehenge, which would give us an accurate date.  But we still have a few clues to provide us with an approximate date, as we know that the river must yet have been present at the end of the Avenue for the unloading of these stones to take place. And it must have been after the groundwater left the North West shoreline, but before the groundwater reached the ‘elbow’.

The arranging of the Sarsen stones has left archaeologists without any clues about the dating of Stonehenge. The current theories are based on pottery, and the dating of antler picks found in the ditch; all these items could have been left at a later date.  For traditional archaeologists to be correct, then the pottery and the antler picks had to be left ‘in situ’, the archaeologist’s way of saying that something has not moved from the place where it was originally deposited – unfortunately, they were not! 

Stonehenge Phase II
Stonehenge Phase II

As an example, the antler picks were found in the ditch. If the moat had been dug and then left untouched for 5,000 years, then you could have an entirely accurate date – but we have proved that the ditch was in fact a moat filled with groundwater. These picks would have floated away. All we can say regarding the picks is that the last time the moat was cleaned out was about 2500 BCE – and that’s it! And the same can be said about the pottery.

Let’s revisit the Avenue. It clearly follows a path to the river, but the river reached all the way to the East of the site in Neolithic times, and therefore, in theory, the Avenue could have been built anywhere. So why did they build it in that particular direction?  The North West entrance is oriented quite deliberately towards the midwinter moonset, perceived as the place of the dead and afterlife. After 4,000 years, is it possible that the monument changed its purpose? Four thousand years is a colossal amount of time – the same period before now, we were in the Bronze Age living in mud huts and dancing to druid music. In the landscape, we see that the monument’s use changed, as round barrows started to appear, and burial practices started to change.

If so, perhaps they decided to use the trusted waters of the past still, but change it from curing the sick to celebrating life and rebirth through the sun.

This may explain why the Avenue was oriented to the summer sunrise and, this being the case, give us our third clue to the date the site was built.  We are familiar with the masses that welcome the midsummer sunrise over Stonehenge – people wait in expectation, then (if you’re lucky) the sun creeps over the Heel Stone to welcome another day; everyone’s happy and goes home drunk.  When you look at the Heel Stone, it is on the extreme right-hand side of the Avenue, bent over at a silly angle. Our ancestors did not build it that way – the monument was very nearly completely rebuilt at the end of the last century, and stones were moved, and this process happened throughout Stonehenge’s history.

The most sensible alignment is straight down the middle of the avenue. This is apparent alignment has only been partially investigated and as a result questions the ‘traditional’ dating of the site

The sun does not always rise and set in the same place in history as you may expect.  The earth ‘wobbles’ on its axis in a process known as ‘procession’ – I will not go into detail here, but all you need to understand is that the Sun and moon rises and sets in a different location over a 43,000 year period.

This means that the summer and winter Solstice moves in relation to the horizon a fraction every year.  This movement is TINY it’s .0002 of a degree every year, but over a long time, say 10,000 years it’s a full two degrees. It may not sound much, but when you consider that the moon is half a degree in diameter, then two degrees is the same as four moons (or suns) in a row on the horizon.

We can also ‘reverse engineer’ this figure to give us a date for the construction of the Avenue.  The problem with this measurement is that the point of sunrise is somewhat subjective – as the horizon is obscured with trees at Stonehenge, so the tip of the first sunlight can never be fully seen.  What current observers accept is the position of the ‘Heel Stone’ which obscures the sunrise until a point that it appears to rise above the stones upper part (the peak point).

Stonehenge Phase II
Figure 34– The Avenue showing the summer solstice sunrise at the time of construction
Stonehenge Phase II

If we accept, this is the correct point for today’s Summer solstice sunrise and plot this point on Google Earth – we obtain a reading of 50.81 degrees.  If we now take a reading down the centre of the avenue with the same software, we get a reading of 49.57 degrees.  This is a difference of 1.24 degrees since the Avenue was constructed.  If each year the sun moves 0.0002 degrees per annum then we will have an approximate date (when the sun is at the centre of the Avenue) this, gives us a construction date of 6200 years ago, or 4180 BCE.

Moreover, to support this dating – there is one antler bone that was found under a Sarsen stone, which does not support the current dating. Now this one can’t be explained away like the others, as a 12 ton stone was on top of it for thousands of years, guaranteeing that it could not have been placed there at a later date, or floated there from another part of the site.

Figure 35– Antler bone found in Stone 27 filling dated 4191 BCE
Stonehenge Phase II

It was found in the ‘packing’ for Sarsen Stone 27 (OxA-4902). This gives us a carbon dating of 4342 – 4039 (IntCal20) or 4191 BCE +/- 152, which is remarkably similar to the Avenue dating method.  Therefore, I am happy to conclude that Stonehenge phase two started around 4185 BCE.

The experts suggest that the antler bone was placed there by ‘accident’ and was found in the vicinity of the stone hole when constructed – sadly, this is very improbable as the bone would have been some 1700 years old (if current theory dates are correct) and would have rotted any if found on or near the surface.

Further Reading

For information about British Prehistory, visit www.prehistoric-britain.co.uk for the most extensive archaeology blogs and investigations collection, including modern LiDAR reports.  This site also includes extracts and articles from the Robert John Langdon Trilogy about Britain in the Prehistoric period, including titles such as The Stonehenge Enigma, Dawn of the Lost Civilisation and the ultimate proof of Post Glacial Flooding and the landscape we see today.

Robert John Langdon has also created a YouTube web channel with over 100 investigations and video documentaries to support his classic trilogy (Prehistoric Britain). He has also released a collection of strange coincidences that he calls ‘13 Things that Don’t Make Sense in History’ and his recent discovery of a lost Stone Avenue at Avebury in Wiltshire called ‘Silbury Avenue – the Lost Stone Avenue’.

Langdon has also produced a series of ‘shorts’, which are extracts from his main body of books:

The Ancient Mariners

Stonehenge Built 8300 BCE

Old Sarum

Prehistoric Rivers

Dykes ditches and Earthworks

Echoes of Atlantis

Homo Superior

For active discussions on the findings of the TRILOGY and recent LiDAR investigations that are published on our WEBSITE, you can join our and leave a message or join the debate on our Facebook Group.
The Henge and River Relationship

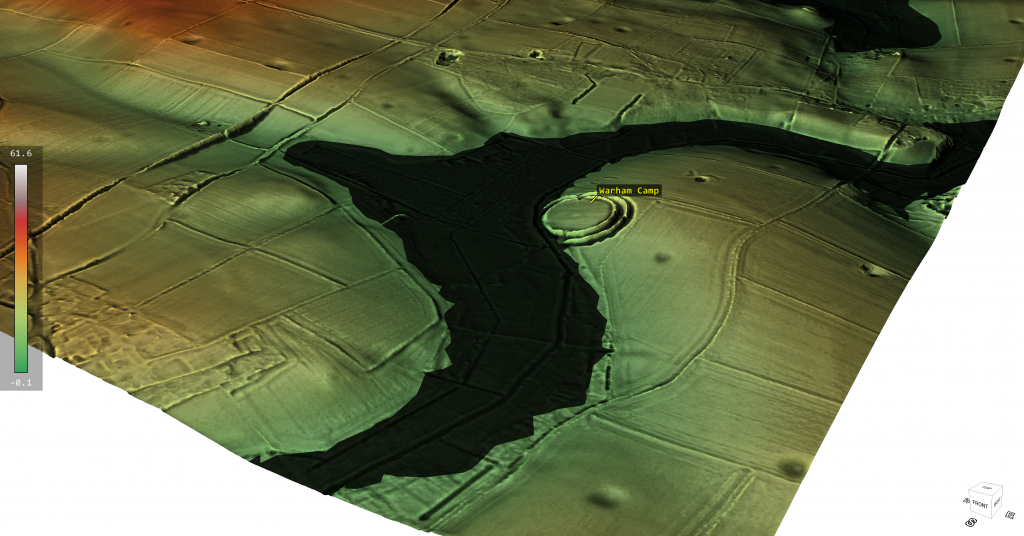
Recently I have been in conversation with FB members who have identified a little known henge (to me at least!) in Norfolk. The discussion was around if the locals had rerouted the local stream (River Stiffkey) towards the ancient henge (Warham Camp) and consequently , by design, removed the huge chalk banks to accommodate this redesign – this was a flood prevention scheme of the past according to local records. Moreover, there was a suggestion that the river had originally lay on the opposite side of the henge, on top of the hill? – (Henge and River Relationship)

When I looked at the site via Google Earth, there was a sudden realisation that most of this story was just misplaced and confused fantasy and nonsense. The site had been built at a direct angle on the edge of a hill (plenty of flat places to built the henge elsewhere) were this strange angle and dip into the local river would have not occured – so clearly it was purpose built.

The LiDAR maps show that this henge ‘dips’ into an ancient river channel of the past and as the animation shows when this river is replaced by the larger ancient water levels the design and location of the henge finally makes sense as it is a harbour to the river and the ditches would have been used for boats as a mooring canal. Furthermore, if we look at the road that goes over the hill on the opposite side River – it’s strangely ‘wibbly wobbly’ and not straight – this would suggest that it was once a manmade ‘Dyke’ a short-cut that went over the hill from river to river, which (like some dykes) the bank was used at a later date to build a road (and explain the local mythology?).

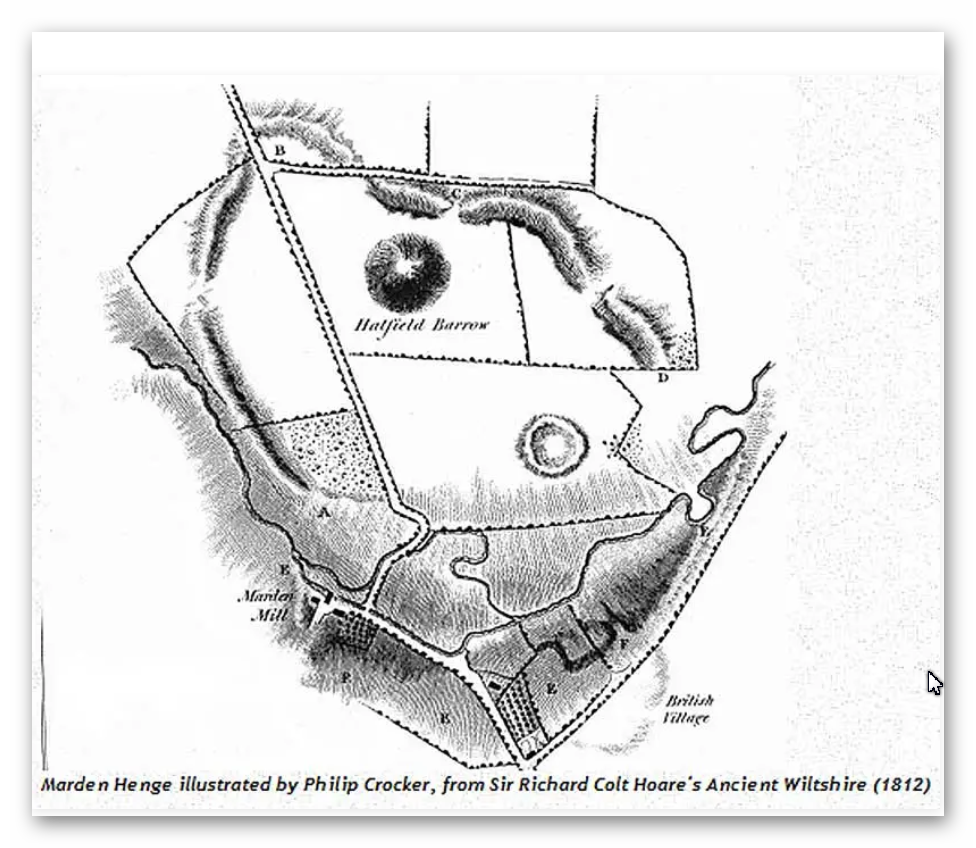
However, this is not the only Henge that is closely linked to Rivers and their use as trading posts with canal facilities for boats. The most famous recently found henge henge that also has half of the henge walls missing in relation to the local river is ‘Marden Henge’ near Stonehenge and down river from Avebury.

Warham Camp/Henge - Henge and River Relationship
Warham Camp/Henge – Henge and River Relationship

Interestingly the archaeologists of this site (you would imagine) would have analyses why this henge was placed so close to the River Avon – but as you see from the book extracts below…. it’s not even mentioned?

What was originally commented upon was In the 1810 publication Ancient Wiltshire, where Colt Hoare describes it as a ‘deep and wide ditch. . . which in winter is nearly full of water, although the soil consists of a greenish sand.’ Soil of a sandy composition should allow decent drainage – the fact that the ditch (though it’s tempting to use the word moat) remained full of water throughout the winter months is a probable indication of the water table being swollen by winter rain rather than being filled by it from above. The English Heritage geophysical survey shows the ditch in great clarity – their estimate of its size is 25 m across, and 105 m in diameter, with the remains of the barrow showing as a comparatively small island in the centre.

Henge with moated ditches…. my oh my…. are we seeing an archaeologist supporting my Post-Glacial Hypothesis..LOL!! – well I’m sure the academic world will attempt to qualify it as ‘the only one’…… but its not!!

Marden Henge - built to meet the River Avon so the ditches will become canals for boats - Henge and River Relationship
Marden Henge – built to meet the River Avon so the ditches will become canals for boats – Henge and River Relationship

You would expect modern archaeologist to have read up on Sir Richard Colt Hoare’s investigation and the obvious link to a river in their papers and books….. yet sadly they seem to ignore the obvious for the more obtrusive aspects of the site?

AUBREY BURL
“Earthworks like those at Waulud’s Bank, Durrington Walls, Marden, Mount Pleasant, all in southern England, seem to have been put up on the sites of earlier unenclosed settlements of the middle Neolithic once occupied by the users of Windmill Hill pottery. Forest clearance and crop growing had been followed by a long cessation of cultivation before the earthworks were thrown up as many as five centuries later. In every one of these enclosures Grooved Ware has been found.”

Burl, A (2002). Prehistoric Avebury. Yale. P125

“At the earthwork of Marden, the Grooved Ware settlement only a few miles south of Avebury in the marshy vale of Pewsey, the body of a young woman who seemed to have suffered from malnutrition in her childhood was put in the ditch alongside the north entrance. Again, this could have been an ordinary burial but, if so, it is remarkable that the body of yet another young woman should have been found at Avebury’s south entrance, buried there like the skeleton at Marden some time after the ditch was dug.”

Burl, A (2002). Prehistoric Avebury. Yale. P248

JAN HARDING
“Excavations at a number of the henge monuments located across the chalklands of Wiltshire and Dorset have produced large quantities of Grooved Ware pottery, and this has lead some to consider both monument and pottery as closely linked phenomena, even as components of a single socio-religious complex of artefacts, practices and beliefs.”

Harding, J (2003). Henge Monuments of the British Isles. Tempus. P12

“At a number of excavated sites, the ditch is certainly wider and deeper on either side of the causeway: at the ‘henge enclosure’ of Marden, in Wiltshire, it expanded to 59ft (18m) wide and about 10ft (3m) deep instead of the more normal 52.5 (16m) and 6.5 (2m) respectively (Wainright 1972, 185-7), whilst two of the three excavated terminals at the double entrance site of Arbor Low were deeper than elsewhere around its circuit (Gray 1903).”

Harding, J (2003). Henge Monuments of the British Isles. Tempus. P66

JOSH POLLARD
“Other large mounds of similar date are known closer to Avebury, including those at Marden in the Vale of Pewsey (Wainright 1971) and Mount Pleasant, Dorset (1979). Both are associated with henge enclosures. These are not on the same scale as the final phase of Silbury, though close in size to Silbury I and II (Thomas 1999, 216). The massive mound in the grounds of Marlborough College might be another, while the curiously large mound and wide ditches that form the Beckhampton long barrow (adjacent to the ditched enclosure) provide a tantalising possibility that this monument was enlarged and elaborated during the late Neolithic.”

Pollard J & Reynolds, A (2002). Avebury, The Biography of a Landscape. Tempus. P121

“The postholes of large timber circles, originally comprising multiple concentric rings of posts of telegraph-pole size, were discovered within the interiors of Durrington Walls and Mount Pleasant; another may exist within Avebury; and a smaller example was discovered just inside the northern entrance at Marden.”

Pollard, J (1997). Neolithic Britain. Shire. P43

MARTIN GREEN
“Due east of the centre circle, covered in trees, is the great mound still surviving to a height of 6.5m. Two concentric ditches surround it, one within 5m of the mound and the outer, segmented ditch, set some 30m distant from it. It is possible that this outer ditch, over 10m in diameter, is in fact a fifth henge which enclosed the likely earlier mound. Supporting this hypothesis are some aerial photographs that clearly reveal traces of an external bank. A rescue excavation in 1958 (Field 1962), following a pipe trench which cut the ditch, uncovered a profile apparently less than 2m deep which is admittedly rather un-henge like.

However, bearing in mind the causewayed nature of the ditch, the profile could vary significantly around its circuit. Nothing is known of this mound but similar combinations of henges and large mounds are known in other parts of the country — notably at Arbor Low in Derbyshire, Marden in Wiltshire and the most extreme example of all Silbury Hill and the Avebury complex. The large Neolithic round mound Duggleby Howe on the Yorkshire Wolds is now known to lie at the centre of a surrounding causewayed enclosure (Selkirk 1980). Silbury Hill is known to date from 3000 BC and it is likely that the other mounds are of broadly similar date.”

Green, M (2000). A Landscape Revealed – 10,000 years on a Chalkland Farm. Tempus. P90

ALEX GIBSON
“A more common ceramic association with timber circles is Grooved Ware. This sometimes plain but often highly decorated flat-based ceramic occurs at 16 (timber circle) sites and most notably at large, elaborate, complex circles. These are the large Wessex sites of Durrington Walls, Mount Pleasant, and Marden.”

Gibson, Alex (2005) Stonehenge and Timber Circles. Tempus. P66

“Beaker [pottery] was unusually found at Durrington Walls North Circle (Phase II) and South Circle (Phase II) and at the Sanctuary (though largely from the later stone holes). The Durrington contexts suggest that the Beaker represents a secondary activity at the site and that the sherds were recovered from the upper fills of pits or settling cones in the tops of the dismantled post rings. Like the other sites, therefore, the Beaker at Durrington represents a terminus ante quem for the circles. At Mount Pleasant and Marden the Beaker sherds were likewise not in primary contexts.”

Gibson, Alex (2005) Stonehenge and Timber Circles. Tempus. P68

“Most notably at the large Wessex henges, where chalky soil is conducive to the survival of faunal remains, there appears to be evidence for feasting. This would appear to have taken place at Durrington Walls, Mount Pleasant, Marden and Woodhenge, and is represented by the large quantities of bones of immature or young adult pig and other domesticated animals recovered from the excavations at these sites.”

Gibson, Alex (2005) Stonehenge and Timber Circles. Tempus. P105

MIKE PARKER PEARSON
“The huge grey sarsen uprights that can be seen today at Stonehenge were put up around 2400 BC (Phase 3ii). No one knows precisely where they came from but their most likely source is thought to be the Marlborough Downs about 20km (12 miles) to the north. However, reports of large buried sarsens near the henge enclosure at Marden, 15 km (9 miles) to the north, hint at a less distant origin.”

Parker Pearson, M (2005). Bronze Age Britain. Batsford. P65

JULIAN THOMAS
“When completed, Silbury would have had an imposing appearance, with stepped concentric revetment walls of chalk blocks, infilled with rubble (Whittle 1997a, 25). The connotations of this architecture are arguable. It may be that the various remodellings were attempts to draw upon quite different traditions derived from different places. In this way the earlier mounds find parallels in the Hatfield Barrow inside the Marden henge, the nearby Marlborough Mound (if indeed it is Neolithic in date: Whittle 1997a, 169–70), the Conquer Barrow in southern Dorset, and the large round mounds of Yorkshire. The final phase, by contrast, may be modelled on the passage tombs of the Boyne Valley and Brittany, traditions whose use had long lapsed by the time that Silbury was completed. Whittle (1997a, 147–9) suggests even more far-flung prototypes for the great mound.”

Thomas, J (2002). Understanding the Neolithic. Routledge. P217

TIMOTHY DARVILL
“Like causewayed camps before them, henges in southern England may have performed a variety of functions and most probably changed their role over the course of time. The majority were probably somehow utilized as ritual monuments, but three large sites in Wessex—Mount Pleasant, Dorset, Marden, Wiltshire and Durrington Walls, Wiltshire—stand apart from the others in having abundant evidence for occupation within them, including timber buildings, middens and large amounts of occupation debris. Indeed, Mount Pleasant contains within its bounds a conventional henge, and Durrington Walls has a similar structure just outside its perimeter at Woodhenge. The site at Waulud’s Bank, Luton, Bedfordshire, may also belong to this group of henge enclosures.”

Darvill, T (1987) Prehistoric Britain. Routledge. P82

BARBARA BENDER
“At Avebury there is also a dramatic link-up between the Avebury circle, the Avenue and Sanctuary, and the great stepped white mound of Silbury. From the Sanctuary the ‘hill’ takes up the low ground, and picks up the sky-line between two long hill ranges (Jarman, pers. comm.). Moving either down or up the Avenue the hill comes in and out of sight, and it can again be seen from the great encircling bank (perhaps a viewing platform) at Avebury. There are, or were, other artificial white hills, one to the east of Avebury in the grounds of what is now Marlborough College, another southward at Marden on the route between Avebury and Stonehenge, and perhaps yet another at Silk Hill, 5 km northeast of Stonehenge.”

Bender, B (1992). Theorising Landscapes, and the Prehistoric Landscapes of Stonehenge. Royal Anthropological Institute of Great Britain and Ireland. P 784.

JSTOR Stable URL – http://www.jstor.org/stable/2804172?origin=JSTOR-pdf

MIKE PITTS
“At Durrington Walls, the size and positioning of his trenches were determined by the roadworks. At Marden, Wainright could choose where he wanted to dig. Tony Clarke’s geophysical survey was no help, as the wet sandy subsoil yielded no clues, So Wainright decided to dig at the one entrance that was accessible, that to the north. At the Walls, the large southern circles were close to the southern entrance, and the end of the ditch there had been particularly rich in pottery and other finds. And, lo and behold, in their relatively small trench just inside the entrance they found the post holes of a simple, circular structure, and in the ditch a human skeleton, red deer antlers and quantities of Grooved Ware exactly like that found at Durrington Walls.”

Pitts, M (2000). Hengeworld.  Arrow. P64

The latest of the investigations is been by Jim Leary, of Reading university – the conclusion of his work in 2010 – is best summed up in this video.

Typical modern archaeologists failing to understand the significance of the site and why they were created taking hundreds of working hours. This video sadly shows the state of current archaeology, with more questions than answers and the solutions they do suggest are based on very unscientific evidence as ‘ceremonial’ and ‘religious’ concepts which quite frankly is just ‘bad science’. But at least Jim actually mentioned the River Avon – even if he failed to understand the true relationship and why the gigantic moats were once full of water!!

Oh by the way…. the gigantic mount (like Silbury Hill) was empty of bodies (like Marlborough Mound) due to the fact these are fire beacons to attract ships and boats to the camp…. history can be painfully obvious..to some?

Let’s look at the LiDAR map video of Marden Henge that shows the size and function within in the landscape.

Finally, the most famous Henge that meet a major river is Durrington Walls – the LiDAR map clearly shows (like the previous examples) the site was built tilted to the enlarge river of the past and hence it does not have banks or ditches in this section. Durrington is slightly different as it looks like when the River retreated as the river levels shrank, the builders attempted to prolong the use of the site by adding ditches which were much smaller and shallower than the original sites feature showing it was adapted much later in history. This adaption included a ‘dyke’ cut from the lower river shoreline to the original banks in the west of the site.

Further Reading

For information about British Prehistory, visit www.prehistoric-britain.co.uk for the most extensive archaeology blogs and investigations collection, including modern LiDAR reports.  This site also includes extracts and articles from the Robert John Langdon Trilogy about Britain in the Prehistoric period, including titles such as The Stonehenge Enigma, Dawn of the Lost Civilisation and the ultimate proof of Post Glacial Flooding and the landscape we see today.

Robert John Langdon has also created a YouTube web channel with over 100 investigations and video documentaries to support his classic trilogy (Prehistoric Britain). He has also released a collection of strange coincidences that he calls ‘13 Things that Don’t Make Sense in History’ and his recent discovery of a lost Stone Avenue at Avebury in Wiltshire called ‘Silbury Avenue – the Lost Stone Avenue’.

Langdon has also produced a series of ‘shorts’, which are extracts from his main body of books:

The Ancient Mariners

Stonehenge Built 8300 BCE

Old Sarum

Prehistoric Rivers

Dykes ditches and Earthworks

Echoes of Atlantis

Homo Superior

For active discussions on the findings of the TRILOGY and recent LiDAR investigations that are published on our WEBSITE, you can join our and leave a message or join the debate on our Facebook Group.
To understand why rivers were larger in the past we have video with all the relevant information.

Chapter 3 – Post Glacial Sea Levels

Book Extract…………………………….. The Post Glacial Flooding Hypothesis (Post Glacial Sea Levels)

If our ‘flooded Britain’ hypothesis is correct, we should be able to get verification via the empirical evidence of sea level changes to see if it has been constant over the last 12,500 years.

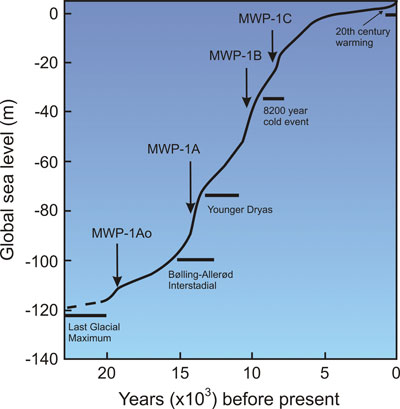
Most scientists and historians when talking about the end of the LGM, refer people to the phenomenon called the ‘Meltwater Pulses’ to prove that the exchange from frozen glaciers to today’s landscape was rapid.

 The Post Glacial Flooding Hypothesis
Figure 6.. Generalized sea level rise since the last ice age showing several meltwater pulses (MWP). MWP-1A0, c. 19,600-18,800 years ago; MWP-1A, 14,600 to 13,800 years ago; MWP-1B, 11,000-8,800 years ago; and MWP-1C, ~8,200-7,600 years ago. © Nasa model.
Post Glacial Sea Levels

The first significant increase in sea levels was (meltwater pulse 1Ao, or MWP 1Ao), 19,600-18,800 years ago, ocean levels climbed at least 10m within 800 years. However, not all sea-level proxies register this event.

A faster rise began 14,600 years ago during the comparatively mild Bølling-Allerød interstadial, which accelerated about 300 years later and peaked about 13,800 years ago (meltwater pulse 1A, or MWP 1A) (Stanford et al., 2011). Although it is a tremendous 20m surge in height, it should be recognised that this ‘pulse’ as only 16% of the total sea rise since the end of the LGM.

Computer models that “fingerprint” spatial patterns of sea-level rise attribute much of the meltwater to Antarctica. Different sources of ice melt leave geographically distinctive sea-level fingerprints because their ice unloading histories and the gravitational pull between shrinking ice masses and oceans vary.

On the other hand, geological data indicate significant deglaciation in Antarctica starting only toward the end of MWP 1A, which suggests that most of the meltwater originated from the breakup of Northern Hemisphere ice sheets.

During the Younger Dryas cold period, between 12,900 and 11,800 years ago, the encroaching oceans slowed their upward pace. A massive freshwater influx via the Mackenzie River into the Arctic Sea and ultimately the eastern North Atlantic may have triggered this cold episode. Once the warmth returned, rates of sea-level rise averaged 13 to 15 mm/yr during meltwater pulse 1B, 11,000-9,000 years ago, an event recorded in Barbados, but not in Pacific corals. This difference may arise from glacial isostatic or gravitational effects; alternatively, the increase at Barbados may have been overestimated.

Around 9,300 years ago, a glacial dam burst at the south-eastern end of Lake Superior, provoking pervasive Northern Hemisphere cooling, followed by a minor meltwater pulse about 9,000 years ago. However, meltwater pulse 1C (8,200-7,600 years ago) left traces at numerous locations in the United States, north-western Europe, and China. 

Most glacial melting ended by about 7,000-6,000 years ago.

Because of slowly diminishing adjustments of Earth’s lithosphere to ice sheet removal, sea level falls near formerly ice-covered regions and rises along the margins of the vanished ice sheets. (Kemp et al., 2011).

This ‘conveyor belt’ carries warm water from the tropics (represented by red arrows) into the North Atlantic. There, the water cools and sinks before flowing back toward the south (yellow arrows). This pattern of circulation plays a vital role in regulating climate in the North Atlantic as well as the rest of the world. Image: (Muschitiello et al., 2019).

 The Post Glacial Flooding Hypothesis
Figure 7 – A simplified diagram of the Atlantic Meridional Overturning circulation
Post Glacial Sea Levels

What is of interest to our hypothesis is that the constant rise in sea levels is gradual if we takeout the meltwater pulses since the LGM ended.

Table 2 – Dates of meltwater Pulses

PulseDate B.P.Sea-Level AddedRate (mm) per annum
MWP-1A019,500-19.00010m2.00
MWP-1A14,500 – 13,60019m2.11
MWP-1B11,500 – 11,20013m4.33
MWP-1C8,200 – 7,60020m2.94
Total 59m (44%) 
Post Glacial Sea Levels

Table 2 – lists the meltwater pulses and consequential sea level rises, taking away these pulses this leaves the remaining 76m (56%) of sea-level rises coming from a constant steady source over the last 15.6K years.

Meltwater Pulses are created by a sudden change in the climate which it is believed causes glaciation to shrink, as ice falls away from the glacier in large quantities.   These events are probably more connected to sea ice cover that can melt rapidly rather than land-based ice which is usually slow to thaw. 

These events would be in addition to the regular release of meltwater from the underground aquifers and groundwaters that flowed directly into the sea rising sea-levels by an average of 0.45mm per annum.

Figure 8 – shows the ‘Monte Carlo Experiment’ maths model that gives the results using 6m coral depth uncertainty.

  1. The GRIP ice core δ18O record on the GICC05 timescale (Andersen et al., 2006; Svensson et al., 2006; Rasmussen et al., 2006, 2008).
  2. The modelled sea-level probabilities are shown alongside the data used to construct the Monte Carlo simulations. The error bars shown represent the total uncertainties used in our reconstruction
  3. The first derivative of the reconstructed sea-level change. In panels b and c, 100 of the simulations are shown in light grey.

What is a Monte Carlo Simulation?

Monte Carlo simulation is a computerized mathematical technique that allows people to account for risk in quantitative analysis and decision making. The method is used by professionals in such widely disparate fields as finance, project management, energy, manufacturing, engineering, research and development, insurance, oil and gas, transportation, and the environment.

 The Post Glacial Flooding Hypothesis
Figure 8 – Illustration showing the meltwater pulses and constantly rising sea levels for thousands of years after the LGM ice has melted.
Post Glacial Sea Levels

Rivers and Streams

Using satellite and field work after an extreme melt event in Greenland, new research shows that melt-prone areas on the ice sheet develop a remarkably efficient drainage system of streams and rivers that carry meltwater into moulins (sinkholes) and ultimately the ocean.

The most significant single area of melting snow and ice in the world is the massive ice sheet that covers about 80 per cent of Greenland.  This is recognised as the most significant potential contributor to rising sea levels due to glacial meltwater.

Until now, however, scientists’ attention has mostly focused on the ice sheet’s aquamarine lakes — bodies of meltwater that tend to drain abruptly — and on monster chunks of ice that slide into the ocean to become icebergs.

But a new UCLA-led study reveals a vast network of little-understood rivers and streams flowing on top of the ice sheet that could be responsible for at least as much, if not more, sea-level rises as the other two sources combined.   The report measured the discharge across an area of 6,812 km2 of Greenland and found the glacier had created 523 high order stream/river channel networks.

 The Post Glacial Flooding Hypothesis
Figure 9 – UCLA led study reveals a vast network of little- understood rivers and streams flowing on top of the ice sheet.
Post Glacial Sea Levels

Within this area the researchers determined, the ice sheet drained at a rate of 55,000 to 61,000 cubic feet per second – a rate double the average of the Colorado River in the USA produces from less than a tenth of its watershed area. 

Moreover, the researchers also found that there was 25% less discharged into the sea from these rivers than the model predicted, which indicated the balance was being absorbed into the groundwaters assisting their recharge (Smith et al., 2015)

If the same scenario were reflected in the ice sheet that covered Britain at the end of the LGM, then the U.K. ice sheet would have had 18,610 rivers formed on the ice sheet.  Interestingly, we still have 1500 rivers and 15,000 streams in existence today still moving groundwater from land to the sea – some of which were created from the glaciation twenty thousand years ago.

•          6812 km2 / 523 observed rivers – gives us one river every 13.03 km2

•          Britain is 242,495 km² / 13.03 km2 (the average area) per river would provide us with 18,610 ice rivers over Britain

These new observations show that when glaciers melt they not only recharge the groundwater levels and consequently the aquifers under its landmasses they also use the existing or create new rivers to connect the melting glaciers to the sea.

But what evidence is there that existing rivers were used to transport meltwater at the end of the ice age?

Further Reading

For information about British Prehistory, visit www.prehistoric-britain.co.uk for the most extensive archaeology blogs and investigations collection, including modern LiDAR reports.  This site also includes extracts and articles from the Robert John Langdon Trilogy about Britain in the Prehistoric period, including titles such as The Stonehenge Enigma, Dawn of the Lost Civilisation and the ultimate proof of Post Glacial Flooding and the landscape we see today.

Robert John Langdon has also created a YouTube web channel with over 100 investigations and video documentaries to support his classic trilogy (Prehistoric Britain). He has also released a collection of strange coincidences that he calls ‘13 Things that Don’t Make Sense in History’ and his recent discovery of a lost Stone Avenue at Avebury in Wiltshire called ‘Silbury Avenue – the Lost Stone Avenue’.

Langdon has also produced a series of ‘shorts’, which are extracts from his main body of books:

The Ancient Mariners

Stonehenge Built 8300 BCE

Old Sarum

Prehistoric Rivers

Dykes ditches and Earthworks

Echoes of Atlantis

Homo Superior

For active discussions on the findings of the TRILOGY and recent LiDAR investigations that are published on our WEBSITE, you can join our and leave a message or join the debate on our Facebook Group.
Chapter 2 – Variation of the Species

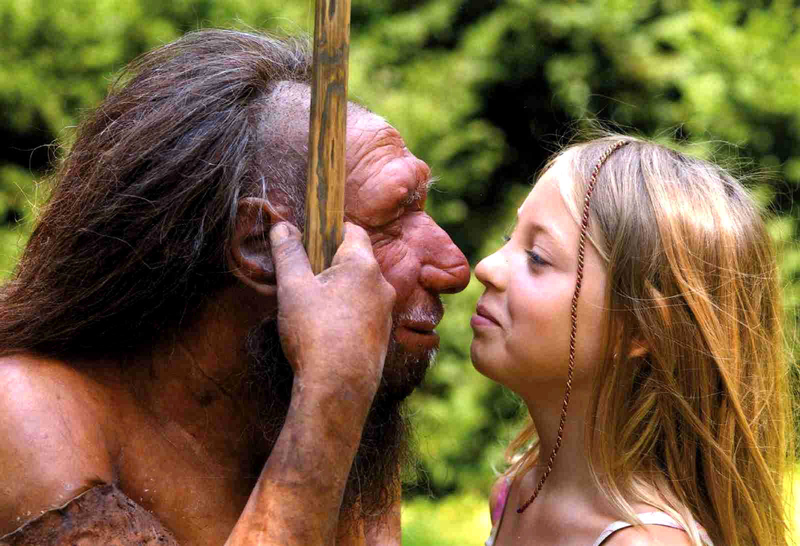
Past genetic studies have set out to verify whether interbreeding between Sapiens and Neanderthals took place. These findings showed that the genetic makeup of ‘Modern Humans’ (Homo Sapien Sapiens) is 4% inherited from this Neanderthal interbreeding, with just one exception – the Sub-Saharan African population, who because of many complex reasons did not travel ‘out of Africa’ with their relations some 50,000 years ago. Their genetic makeup varies from between 0 to just 1% of Neanderthal DNA (probably due to recent intermigration) – (Variation of the Species).

However, the above studies are in conflict with recent findings reported in Nature Magazine in 2015. These findings appear to indicate an even greater percentage of our genes belong to our Neanderthal cousins. Qiaomei Fu, a palaeogenomicist at Harvard Medical School in Boston, Massachusetts, told meeting members how she and her colleagues had sequenced DNA from a 40,000-year-old jawbone that represents some of the earliest modern-human remains in Europe. They estimate that 5 –11 percent of the bone’s genome is Neanderthal. Interestingly, the Neanderthal elements of the genome structure contained large chunks of several chromosomes. Further genetic analysis showed that the individual was a man. Using the theory that lengths of DNA inherited from any one ancestor shorten with each generation; the team estimated that the man had a Neanderthal ancestor in the previous four to six generations.

Different Species?? - Variation of the Species
Different Species?? – Variation of the Species

The interbreeding between Sapiens and Neanderthals probably led to descendants carrying a ‘Mitochondrial DNA’ (mtDNA) inherited exclusively from the mother. Therefore (in theory) we should be able to find in the population today this Neanderthal (mtDNA) group. Sadly, this (mtDNA) group, to date, has never been found. Consequently, the natural conclusion to this lack of evidence is to suggest that the hybrids must only have come from Sapien Mothers with Neanderthal fathers. However, this theory is not without complications. If this is the case it seems to contradict the existing perceived history of the two species meeting and only the Sapiens surviving as they could ‘out think’ their Neanderthal cousins, to obtain sufficient limited food supplies (due to the ice age) for survival.

If the Neanderthal males were taking Homo Sapien women by creating relationships (or gang raping against their will, as some suggest) this would lead us to conclude that the Neanderthals were more assertive and dominating that their Sapien counterparts – they clearly were physically larger (nearly twice as large) so if they were aggressive enough to take Sapien women, could they not also take their food? – The harsh reality is that the Neanderthals died out and Sapiens and moreover, their interbred off-spring the Homo Superior (Cro-Magnons) survived. (Variation of the Species).

So is there another explanation or is this perception of history completely unbalanced?

If we look at the probabilities and how (mtDNA) lines can disappear, we find that it’s not only because of ‘natural selection’ or that the people carrying the (mtDNA) lines don’t reproduce – but because of a random statistical effect. If a Neanderthal female and a Sapien male mate, she could, in time, have fifty living descendants, all carrying a fraction of her DNA. However, her (mtDNA) can disappear completely as it carries through the female line. Consider this example. If a Neanderthal female who carries the (mtDNA) line has five sons and two daughters, but those two daughters have only sons and no daughters this would result in the end of the (mtDNA) line. In a stable population, one where each reproducing female leaves exactly two reproducing children, 90% of the original (mtDNA) lines will be broken in just 34 generations, as some of these families will have just boys, and that’s in less than 1,000 years. So if you start with 1,000 female Neanderthals in a mixed population, less than 100 Neanderthal (mtDNA) lines will survive after 1.000 years – after another 1.000 years, less than 10 – after yet another 1.000 years… gone forever. This is then further influenced by the belief that ancient civilisations will favour the male species and commit infanticide in order to reduce the female heirs when community resources are limited and hunting is a matter of survival.

The DNA Connection - Variation of the Species
The DNA Connection – Variation of the Species

Moreover, you can do the same type of calculation regarding Neanderthal Y chromosome lines. If Neanderthals were a small minority of our common ancestors, it is extremely unlikely that any two Neanderthal genes would survive after 30,000 years. In effect, (mtDNA) and the Y chromosome are inherited as just one gene, since they’re inherited in one piece, therefore, we don’t have to construct intricate theories of marriage customs or patterns of reproduction in order to explain the lack of Neanderthal (mtDNA) or Neanderthal Y chromosomes today; we only have to do some reasonable maths and realise that single sex children in families break the linkage.

However, it is far more probable that ‘Modern Humans’ are the product of the Homo Superior hybrids, as we all have our origin in an individual female hybrid. Their descendants were so exceptionably endowed that they managed to eliminate not only the Neanderthal population, but also the other ‘Out of Africa’ Sapiens, by assimilating all those in the Europe, leaving only the ‘pure’ Sapiens still simply living in sub-Saharan Africa. This hypothesis gives us an opportunity to compare the rise of Homo Superior to native African Sapiens, and will give us an understanding of how close we are to our Homo cousins, so we need to compare the ‘genome’ of both Neanderthals and Homo Superior.

The comparison

At roughly 3.2 billion base pairs, the Neanderthal genome is about the size of the modern human genome. According to preliminary sequences, 99.84% of the base pairs of the modern human and Neanderthal genomes are identical, compared to humans sharing around 94% of base pairs with the chimpanzee. The researchers recovered ancient DNA of Neanderthals by extracting the DNA from the femur bones of three 38,000-year-old female Neanderthal specimens from Vindija Cave, Croatia, and other bones found in Spain, Russia, and Germany. The project faced many difficulties, including the contamination of the samples by the bacteria that had colonised the Neanderthal’s body, the humans who handled the bones at the excavation site and also at the laboratory.  So we must be realistic in the outcomes given and acknowledge that future samples may vary.

Brain Size - Variation of the Species
Brain Size – Variation of the Species

Another comparison is in the cranial capacities of this species. Within the human population, studies have been conducted to determine whether there is a relationship between brain size and a number of cognitive measures. Early anthropologists and psychometricians found these correlations and even modern studies (which began with Van Valen 1974) also suggested a similar correlation with Jensen & Johnson 1994, in ‘Race and Sex differences in Head Size and IQ’.  They wrote “In all of the 25 independent studies we have found in the literature, nonzero positive correlations between head measurements and intelligence measurements to be found, all but five with correlations significant beyond the 0.5 confidence level. The average correlation between various external head size and IQ is close to 0.15.  But external head size is rather weak proxy for brain size. Two recent studies have measured brain size per se by means of magnetic resonance imaging (MRI) and found correlations with IQ in the 0.3 to 0.4 range (Andreasen et al.,1993 Willerman, Schulz, Rutledge, & Bigler, 1991).”

So just how intelligent was Homo Superior in comparison to us and other groups in prehistory?

Today’s human Brain (Modern Man) is on average 1380cm3, while the Homo Superior’s brain averaged 1660cm3, so they are (on average) 20% more intelligent than us. On the IQ scale that would mean that Modern Man has an IQ of between 90 and 110 points (Stanford–Binet Intelligence Scale) – Homo Superior. Therefore, would have an IQ between 108 and 132 (classified as High Average to Superior held by the top 7% of the present population) – hence my new Homo Superior classification.

We can see the same correlation in other animals such as the size of Wolfs and Dogs – the dog’s brain is a deterioration of the animal it used to be in the wild. It does not mean that they are stupid or their lives are poor; in fact, one would suggest (if you were a dog) that their lives today are much more progressive than the life they once lived. But if man was wiped out by disease tomorrow, how many dogs would survive in the long term – It would not be beyond thinking that dogs would become extinct without man to look after them?

Can we not use this same analogy on Modern Man in comparison to Homo Superior? 

Variation of the Species

Further Reading

For information about British Prehistory, visit www.prehistoric-britain.co.uk for the most extensive archaeology blogs and investigations collection, including modern LiDAR reports.  This site also includes extracts and articles from the Robert John Langdon Trilogy about Britain in the Prehistoric period, including titles such as The Stonehenge Enigma, Dawn of the Lost Civilisation and the ultimate proof of Post Glacial Flooding and the landscape we see today.

Robert John Langdon has also created a YouTube web channel with over 100 investigations and video documentaries to support his classic trilogy (Prehistoric Britain). He has also released a collection of strange coincidences that he calls ‘13 Things that Don’t Make Sense in History’ and his recent discovery of a lost Stone Avenue at Avebury in Wiltshire called ‘Silbury Avenue – the Lost Stone Avenue’.

Langdon has also produced a series of ‘shorts’, which are extracts from his main body of books:

The Ancient Mariners

Stonehenge Built 8300 BCE

Old Sarum

Prehistoric Rivers

Dykes ditches and Earthworks

Echoes of Atlantis

Homo Superior

For active discussions on the findings of the TRILOGY and recent LiDAR investigations that are published on our WEBSITE, you can join our and leave a message or join the debate on our Facebook Group.

You May Also Like

Chapter 5 – The Atlantean Period

Chapter 3 – Atlantis

Chapter 8 – Trade Routes

Hadrian’s Wall LiDAR investigation

Historians seems to be comfortable about what we know about Hadrian’s Wall as a concept.  They admit that we need to excavate more to find some details but the overall view of this landscape feature sits comfortably within the pages of the history book. (Hadrian’s Wall LiDAR investigation)

English heritage tells us in its many guidebooks that:

It’s nearly two thousand years since the Roman emperor Hadrian ordered a wall to be built across the north of Britannia following his visit to Britain in AD 122. Hadrian’s Wall is now the most famous frontier of the mighty Roman Empire. It dominated the region for around 300 years, stretching 73 miles (80 Roman miles) coast to coast from Wallsend in the east to Bowness-on-Solway in the west.

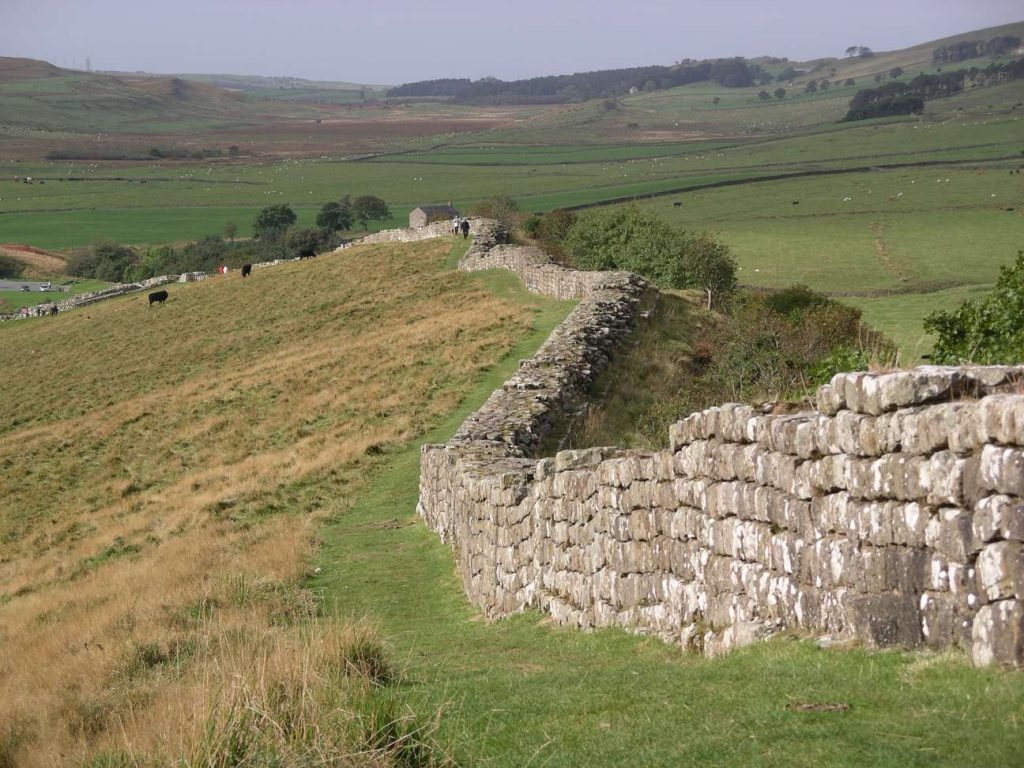
Once built, Hadrian’s Wall boasted 80 milecastles, numerous observation towers and 17 larger forts. Punctuating every stretch of Wall between the milecastles were two towers so that observation points were created at every third of a mile. Constructed mainly from stone and in parts initially from turf, the Wall was six metres high in places and up to three metres deep. All along the south face of the Wall, if there was no river or crag to provide extra defense, a deep ditch called the Vallum was dug. In some areas the Vallum was dug from solid rock.

Roman Forts - Hadrian's Wall
Roman Forts – Hadrian’s Wall Lidar Investigation

Wikipedia will tell you that a bit more:

Hadrian’s Wall (Latin: Vallum Aelium), also known as the Roman Wall, Picts’ Wall, or Vallum Hadriani in Latin, is a former defensive fortification of the Roman province of Britannia, begun in AD 122 in the reign of the emperor Hadrian.  Running “from Wallsend on the River Tyne in the east to Bowness-on-Solway in the west”, the Wall covered the whole width of the island. In addition to the wall’s defensive military role, its gates may have been customs posts.

A significant portion of the wall still stands and can be followed on foot along the adjoining Hadrian’s Wall Path. The largest Roman archaeological feature in Britain, it runs a total of 73 miles (117.5 kilometres) in northern England. Regarded as a British cultural icon, Hadrian’s Wall is one of Britain’s major ancient tourist attractions. In comparison, the Antonine Wall, thought by some to be based on Hadrian’s wall. Hadrian’s Wall marked the boundary between Roman Britannia and unconquered Caledonia to the north. The wall lies entirely within England and has never formed the Anglo-Scottish border.

Hadrian's Wall LiDAR investigation
Hadrian’s Wall LiDAR investigation

Dimensions

The length of the Wall was 80 Roman miles (a unit of length equivalent to about 1,620 yards or 1,480 metres), or 73 modern miles. This covered the entire width of the island, from Wallsend on the River Tyne in the east to Bowness-on-Solway in the west.

Not long after construction began on the Wall, its width was reduced from the originally planned ten feet to about eight feet, or even less depending on the terrain. As some areas were constructed of turf and timber, it would take decades for certain areas to be modified and replaced by stone.

Bede, a medieval historian, wrote the Wall to be standing at 12 feet (4 metres) high, with evidence suggesting it could have been a few feet higher at its formation.

Construction

The first evidence of not quite knowing the detail contained in building the wall is shown when the official accounts suggested it was at first ten foot wide and then reduced to eight – but why and was this for the whole 73 miles and parts were not wall but turf and a palisade.

Hadrian’s Wall – Hadrian’s Wall LiDAR investigation

This is revealed when EH suggest that:

Before the first plan was completed, a radical change led to the placing of forts on the wall line and down the Cumbrian coast, and the construction of an earthwork to the south.

The forts, each apparently built for a single unit and at a basic spacing of 7⅓ miles, were placed astride the Wall wherever possible. This allowed three main gates, each with two entrances, making the equivalent of six milecastle gates, to provide access to the north; the double-portal south gate was supplemented by two small side gates. The position of the forts and the provision of so many gates suggest that a requirement for increased mobility led to this change.

The addition of the forts was followed by the construction of an earthwork to the south 120 Roman feet (an actus – about 35 metres) wide. This consisted of a central ditch between two mounds. Causeways, surmounted by gates, were provided at forts. The purpose of the Vallum, as this earthwork is known, was presumably to protect the rear of the frontier zone.

After the forts had been added, the width of the Wall was narrowed to 8 Roman feet (2.4 metres) or less and the standard of craftsmanship reduced, both presumably in order to speed work.

Route

Sections of Hadrian’s Wall still remain, particularly in its hilly central sector. Little remains in lowland regions, where the Wall was plundered as a source of free stone for new buildings.

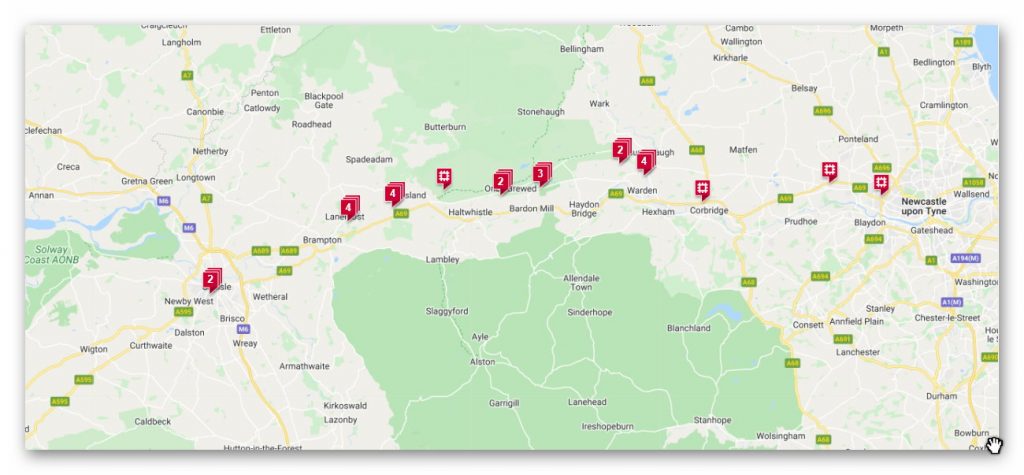
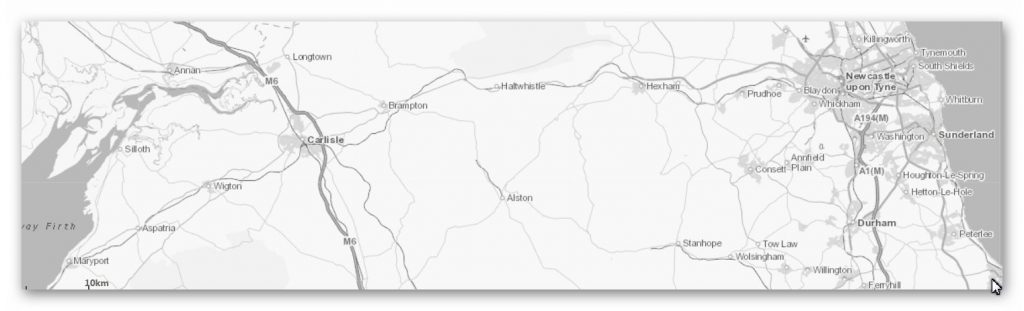
Hadrian’s Wall extended west from Segedunum at Wallsend on the River Tyne, via Carlisle and Kirkandrews-on-Eden, to the shore of the Solway Firth, ending a short but unknown distance west of the village of Bowness-on-Solway. The A69 and B6318 roads follow the course of the wall from Newcastle upon Tyne to Carlisle, then along the northern coast of Cumbria (south shore of the Solway Firth). The route was slightly north of Stanegate, an important Roman road built several decades earlier to link two forts that guarded important river crossings: Corstopitum (Corbridge) on the River Tyne and Luguvalium (Carlisle) on the River Eden.

Although the curtain wall ends near Bowness-on-Solway, this does not mark the end of the line of defensive structures. The system of milecastles and turrets is known to have continued along the Cumbria coast as far as Risehow, south of Maryport. For classification purposes, the milecastles west of Bowness-on-Solway are referred to as Milefortlets.

Historical background

In 79 AD Agricola subdued the Brigantes of northern England and the Selgovae along the southern coast of Scotland, using overwhelming military power to establish Roman control. He built a network of military roads and forts to secure the Roman occupation from around 80 AD.

After Agricola was recalled from Britain in 84 AD the Romans retired to a more defensible line along the Forth–Clyde isthmus, and with the decline of imperial ambitions in Scotland (and Ireland) by AD 87 (the withdrawal of the XX legion), consolidation based on the line of the Stanegate road (between Carlisle and Corbridge) was settled upon. Carlisle was the seat of a ‘centurio regionarius’ (or ‘district commissioner’). When the Stanegate became the new frontier it was augmented by large forts as at Vindolanda and additional forts at half-day marching intervals were built at Newbrough, Magnis (Carvoran) and Brampton Old Church.

While only a few sites north of the Stanegate line were maintained, there does not seem to have been any rout as a result of battles with various tribes.

Modifications to the Stanegate line, with the reduction in the size of the forts and the addition of fortlets and watchtowers between them, seem to have taken place from the mid-90s onwards. Apart from the Stanegate line, other forts existed along the Solway Coast at Beckfoot, Maryport, Burrow Walls (near to the present town of Workington) and Moresby (near to Whitehaven). Other forts in the region were built to consolidate Roman presence (Beckfoot, for example may date from the late 1st century). A fort at Troutbeck may have been established from the period of Trajan (emperor 98–117) onwards. Other forts that may have been established during this period include Ambleside (Galava), positioned to take advantage of ship-borne supply to the forts of the Lake District. From here, a road was constructed during the Trajanic period to Hardknott Roman Fort. A road between Ambleside to Old Penrith and/or Brougham, going over High Street, may also date from this period.

Purpose of Wall construction (wiki)

On Hadrian’s accession to the imperial throne in 117, there was unrest and rebellion in Roman Britain and from the peoples of various conquered lands across the Empire, including Egypt, Judea, Libya and Mauretania. These troubles may have influenced his plan to construct the Wall, as well as his construction of frontier boundaries now known as limes in other areas of the Empire, such as the Limes Germanicus in modern-day Germany. In any case, Hadrian ended his predecessor Trajan’s policy of expanding the empire and instead focused on defending the current borders.

The Historia Augusta states that Hadrian was the first to build a wall 80 miles from sea to sea to separate the barbarians from the Romans. However, this reasoning may not entirely explain all the various motivations Hadrian could have had in mind when commissioning the wall’s construction.

Scholars disagree over how much of a threat the inhabitants of northern Britain really presented to the Romans, and whether there was any economic advantage in defending and garrisoning a fixed line of defences like the Wall, rather than conquering and annexing what has become Northumberland and the Scottish Lowlands and then defending the territory with a looser arrangement of forts.

According to restored sandstone fragments found in Jarrow which date from 118 or 119, it was Hadrian’s wish to keep “intact the empire”, which had been imposed on him via “divine instruction”.  Besides a defensive structure made to keep people out, the Wall also served to keep people within the Roman province. Since the Romans had control over who was allowed in and out of the empire, the Wall was invaluable in controlling trading and the economy.

Recent thought is that the Wall’s primary purpose was as a physical barrier to slow up the crossing of raiders and people intent on getting into the empire for destructive or plundering purposes. It may be that the Wall was not a last-stand type of defensive line, but instead an observation point that could alert Romans of an incoming attack and act as a deterrent to slow down enemy forces so that additional troops could arrive for support.This view is supported by another defensive measure frequently found on the berm or flat area in front of the Wall: pits or holes known as cippi pits which held branches or small tree trunks entangled with sharpened branches (these were the ‘cippi’). The use of such thorns and sharpened stakes was clearly an anti-personnel measure, and might be thought of as the Roman equivalent of barbed wire.

It took six years to build most of Hadrian’s Wall at the hands of three Roman legions – the Legio II Augusta, Legio VI Victrix, and Legio XX Valeria Victrix, totalling 15,000 soldiers, plus some members of the Roman fleet. The production of the Wall was not out of the area of expertise for the soldiers, as some would have trained to be surveyors, engineers, masons, and carpenters.

Once its construction was finished, there is some evidence that Hadrian’s Wall was covered in plaster and then whitewashed: its shining surface would have reflected the sunlight and been visible for miles around.

“Broad Wall” and “Narrow Wall”

R.G. Collingwood cited evidence for the existence of a broad section of the Wall and conversely a narrow section. He argued that plans changed during construction of the Wall and its overall width was reduced.

Broad sections of the Wall are around nine and a half feet (2.9 metres) wide with the narrow sections of the Wall two feet (60 centimetres) thinner, being around seven and a half feet (2.3 metres) wide. The narrow sections were found to be built upon broad foundations. Based on this evidence, Collingwood concluded that the Wall was originally due to be built between present-day Newcastle and Bowness, with a uniform width of ten Roman feet, all in stone. However, in the end, only three-fifths of the Wall was built from stone and the remaining part of the Wall in the west was a turf wall, though it was later rebuilt in stone. Plans possibly changed due to a lack of resources.

In an effort to preserve resources further, the eastern half’s width was therefore reduced from the original ten Roman feet to eight, with the remaining stones from the eastern half used for around five miles (8 kilometres) of the turf wall in the west. This reduction from the original ten Roman feet to eight, created the so-called “Narrow Wall”.

The Vallum

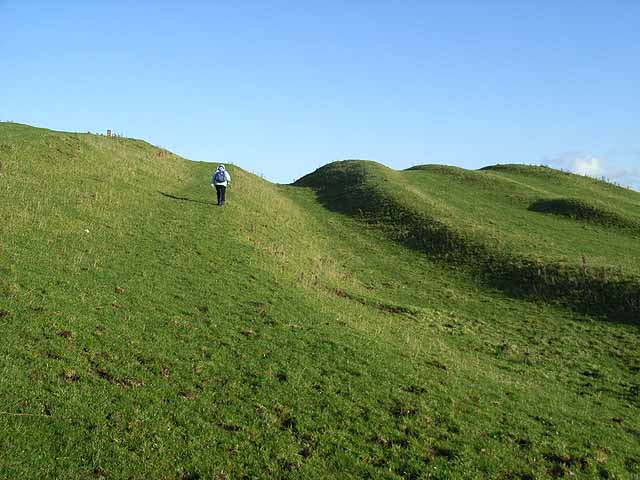
Just south of the Wall there is a ten-foot (3 metres) deep, ditch-like construction with two parallel mounds running north and south of it, known as the Vallum. The Vallum and the Wall run more or less in parallel for almost the entire length of the wall, except between the forts of Newcastle and Wallsend at the east end of the Wall, where the Vallum may have been considered superfluous on account of the close proximity of the River Tyne, at the north bank of which the Wall ended (or began).

Vallum - Hadrian's Wall LiDAR investigation
Vallum – Hadrian’s Wall LiDAR investigation

From 1936, research showed that the Vallum was built shortly after the Wall because the Vallum clearly avoided one of the Wall’s milecastles. This new discovery was continually supported by more evidence, strengthening the idea that there was a simultaneous construction of the Vallum and the Wall.

Other evidence still pointed in other, slightly different directions. Evidence shows that the Vallum preceded sections of the Narrow Wall specifically; to account for this discrepancy, Couse suggests that either construction of the Vallum began with the Broad Wall, or it began when the Narrow Wall succeeded the Broad Wall but proceeded more quickly than that of the Narrow Wall.

The vallum was crossed by causeways only at the forts and strangely seems to have been designed as a barrier to the south. Traffic would have to cross these causeways and then travel along the military road to one of the milecastles to cross the Wall, as farm animals would not have been allowed through the forts. However, modern archaeological opinion is that the Vallum established the southern boundary of an exclusion zone bounded on the north by the wall itself and would have been “out-of-bounds” to civilians. It might thus have been the Roman equivalent to a modern demilitarized zone. 😊

The Vallum limited the routes through the Wall from 78 to about 15 and may therefore have been constructed in response to a threat from the south.

Turf wall

From Milecastle 49 to the western terminus of the wall at Bowness-on-Solway, the curtain wall was originally constructed from turf, possibly due to the absence of limestone for the manufacture of mortar.  Subsequently, the Turf Wall was demolished and replaced with a stone wall. This took place in two phases; the first (from the River Irthing to a point west of Milecastle 54), during the reign of Hadrian, and the second following the reoccupation of Hadrian’s Wall subsequent to the abandonment of the Antonine Wall (though it has also been suggested that this second phase took place during the reign of Septimius Severus). The line of the new stone wall follows the line of the turf wall, apart from the stretch between Milecastle 49 and Milecastle 51, where the line of the stone wall is slightly further to the north.

In the stretch around Milecastle 50TW, it was built on a flat base with three to four courses of turf blocks. A basal layer of cobbles was used westwards from Milecastle 72 (at Burgh-by-Sands) and possibly at Milecastle 53. Where the underlying ground was boggy, wooden piles were used.

At its base, the now-demolished turf wall was 6 metres (20 feet) wide, and built in courses of turf blocks measuring 46 cm (18 inches) long by 30 cm (12 inches) deep by 15 cm (6 inches) high, to a height estimated at around 3.66 metres (12.0 feet). The north face is thought to have had a slope of 75%, whereas the south face is thought to have started vertical above the foundation, quickly becoming much shallower.

Conclusion

Speculation on the reason periods of construction and design are open to active debate as the current archaeological evidence is sparse and more of a judgement call rather than scientific evidenced based hypothesises.

What we will do in this essay is to look at real evidence in the form of LiDAR maps and ascertain what came first and what was already in place and the reasons they used these landscape structures.

Do this with any relevant accuracy we need to establish a grid system that look at all the LiDAR, satellite photography, Old OS maps and excavation evidence to draw new conclusions to the construction of Hadrian’s Wall.

We have therefore subdivided Hadrian’s wall into 23 sections A to W, and we will subsequently investigate each section – CLICK on the section listing to see the Lidar and GE details and investigation conclusions.

Map Grid – Hadrian’s Wall Lidar

Section A – NY26SW

Section B – NY26SE & NY25NE

Section C – NY35NW

Section D – NY35NE

Section E – NY46SW & NY45NW

Section F – NY46SE & NY45NE

Section G – NY56SW

Section H – NY56NE & NY56SE

Section I – NY66NW

Section J – NY66NE

Section K – NY76NW

Section L – NY76NE

Section M – NY87SW & NY86NW

Section N – NY87SE

Section O – NY97SW – NY96NW

Section P – NY96NE

Section Q – NZ06NW

Section R – NZ06NE

Section S – NZ16NW

Section T – NZ16NE

Section U – NZ26NW & NZ26SW

Section V – NZ26NE & NZ26SE

To understand the problem with Hadrian’s Walls history read our article HERE.

Further Reading

For information about British Prehistory, visit www.prehistoric-britain.co.uk for the most extensive archaeology blogs and investigations collection, including modern LiDAR reports.  This site also includes extracts and articles from the Robert John Langdon Trilogy about Britain in the Prehistoric period, including titles such as The Stonehenge Enigma, Dawn of the Lost Civilisation and the ultimate proof of Post Glacial Flooding and the landscape we see today.

Robert John Langdon has also created a YouTube web channel with over 100 investigations and video documentaries to support his classic trilogy (Prehistoric Britain). He has also released a collection of strange coincidences that he calls ‘13 Things that Don’t Make Sense in History’ and his recent discovery of a lost Stone Avenue at Avebury in Wiltshire called ‘Silbury Avenue – the Lost Stone Avenue’.

Langdon has also produced a series of ‘shorts’, which are extracts from his main body of books:

The Ancient Mariners

Stonehenge Built 8300 BCE

Old Sarum

Prehistoric Rivers

Dykes ditches and Earthworks

Echoes of Atlantis

Homo Superior

For active discussions on the findings of the TRILOGY and recent LiDAR investigations that are published on our WEBSITE, you can join our and leave a message or join the debate on our Facebook Group.

Chapter 2 – Stonehenge Phase I

Book Extract…………………………….. The Stonehenge Enigma (Chapter 2 – Stonehenge Phase I )

Looking at the most important prehistoric site in Britain, Stonehenge, we are asked by archaeologists to consider that it is an astronomical calendar showing the rising and setting of the Sun, Moon, etc. This assumption may be partially correct, but why would you place the site in an area were trees would obscure your view – if you wish to study the sunrise and sunset, with any great accuracy, would you not locate your site at the highest point available? – (Stonehenge Phase I)

So why was Stonehenge built where it is, rather than at the top of the hill just 500 metres away that is 30 metres higher – especially considering that the builders took the trouble to get stones from 200 miles away in Wales, for what possible reason would they stop short of obtaining the best setting?

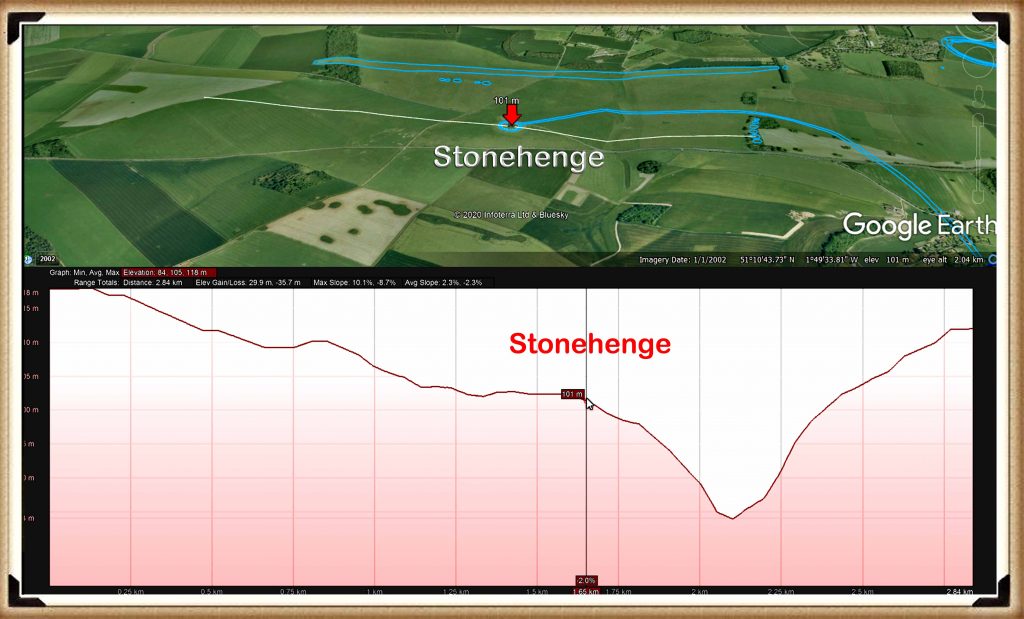
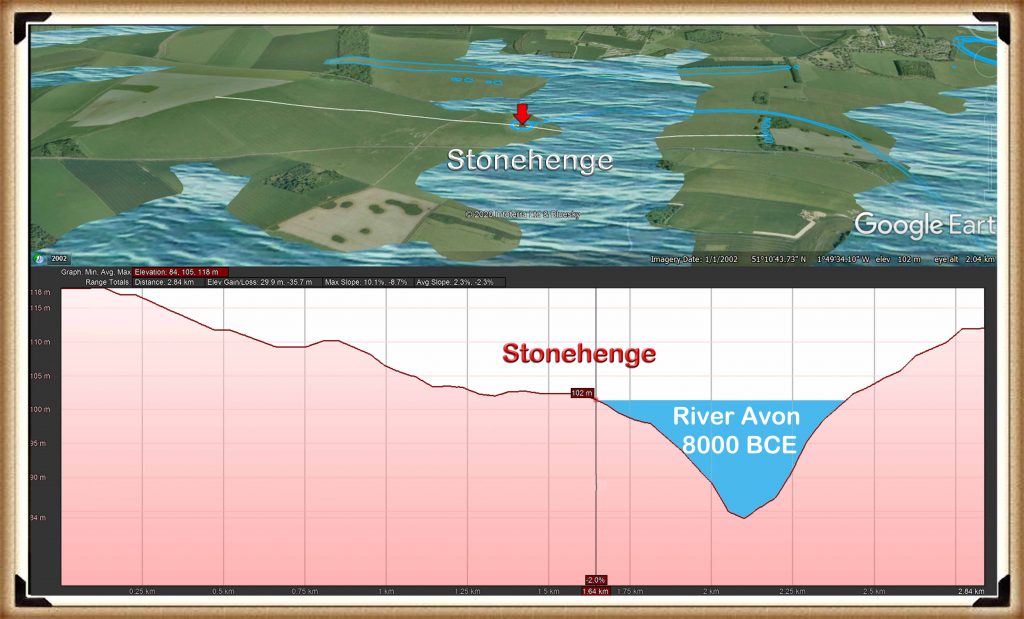
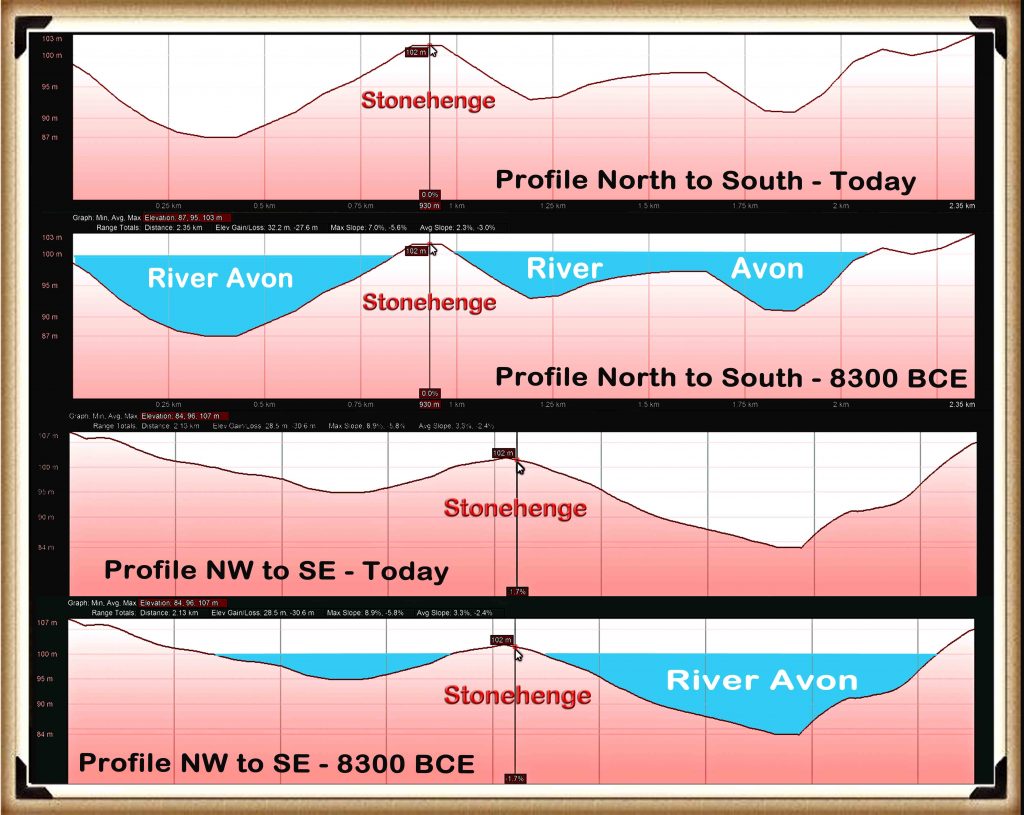
As there is no observational advantage to placing the site in this location, we must therefore conclude that it was access to the area that was of paramount importance.  If we look at a standard Ordnance Survey (OS) map of Stonehenge, it outlines the landscape and topology of the surrounding area by showing the contours of the hillsides. But it does not give you a clear idea of how Stonehenge sits in the landscape; for that, we need to look at a profile of the area.

Figure 9 – Profile of Stonehenge (east to west) and the Palaeochannel that it sits beside - (Stonehenge Phase I )
Figure 9 – Profile of Stonehenge (east to west) and the Palaeochannel that it sits beside – (Stonehenge Phase I )

Amazingly these profiles of Stonehenge show that it was built on the shoreline of a vast river complex. We can see this evidence on any elevation map, where we find that Stonehenge is sited halfway up a ‘Dry River Valley’ (Palaeochannel) known as ‘Stonehenge Bottom’. 

Figure 10 – Stonehenge with the River Avon as it would have looked in 8000BCE - (Stonehenge Phase I)
Figure 10 – Stonehenge with the River Avon as it would have looked in 8000BCE – (Stonehenge Phase I)

Our hypothesis and case study on the river Avon indicates that the groundwater tables during the Mesolithic and Neolithic periods were as high as river terrace T9 (Egberts et al., 2019), which was 100m high.  This would mean that the river Avon would have filled the dry river valley with groundwater 30m above the existing groundwater table – when this happens, the profile changes dramatically.

And so suddenly, the impossible becomes possible, the implausible becomes credible, and myth becomes fact, for these profiles can only indicate one conclusion – Stonehenge was built on the side of a hill surrounded by water!

These amazing features are not just found on a single side of the monument; we can go around the whole circle to see these watery features.  I believe these profiles tell the entire story of Stonehenge. A picture is said to paint a thousand words; these pictures show that our most famous ancient monument was once a magnificent feature in the landscape on the edge of a peninsula, surrounded by water.  Now that we have shown that water existed at the Stonehenge site during Mesolithic and Neolithic times, we can re-sequence the events and building phases.

Figure 11– Profiles of Stonehenge showing the River Avon around the Stonehenge Peninsula - (Stonehenge Phase I)
Figure 11– Profiles of Stonehenge showing the River Avon around the Stonehenge Peninsula – (Stonehenge Phase I)
(Stonehenge Phase I)

The Ditch / Moat

If groundwater was contemporary in the past, then some evidence should still be present.  Consequently, one of the more interesting facts found when studying any prehistoric site is that the constructors seemed to spend a disproportionate amount of time digging ditches to surround their monuments, whether around henges or barrows.

This practice would be considered strange, even if the prehistoric builders had practical and modern, labour saving tools.  However, our ancestors only had the benefit of stone tools, bones and antler – making such excavation exceptionally slow, cumbersome and therefore even more bewildering. 

Looking at Avebury (a henge monument), as an example, the most conservative archaeological estimation, suggests that the ditches surrounding Avebury, would have taken 1.5 million-working hours to build.  That’s equivalent to 100 people working 12 hours a day, every day, for 3.5 years. In comparison, building a wooden palisade using the same tools, would have taken less than one month – merely 2% of the time and exhaustion.

Current archaeological theories surrounding these ditches maintain that they were used either as defensive fortification and/or a landscape feature to keep out/in animals or and even more recently, bizarre interpretations such as a ‘ceremonial’ feature to ward off evil spirits.

All this shows is the levels of desperation the archaeologists have descended into in recent years in an abortive attempt to understand such basic structures, such as a moat.   These quaint ideas strike me as somewhat flawed as a ditch is significantly less effective than a palisade (a long line of sharpened wooden stakes planted into the ground), which would have been considerably more straightforward, quicker to construct and more effective.  As for evil spirits would not a neat little 6-inch channel achieve the same symbolic purpose as a huge five metre ditch?

Lt-Col William Hawley, was one of the amateur archaeologists, employed by the Ministry of Works to undertake excavations at our famous monuments Stonehenge and Avebury in the 1920s.  Unfortunately, he was not the most ‘careful’ of archaeologists. This was a view shared by colleagues such as Atkinson, in his book, ‘Stonehenge’ 3rd edition, London 1979 – where he suggests that Hawley’s methods were somewhat ‘inadequate’.

Despite this accusation of carelessness, he was still able to find some strange features, which can clearly be seen as evidence of a moat. For example, below a layer of chalk rubble infill (chalk which would have fallen naturally into the moat when it was disused) under a layer of flint, he discovered ‘foot-trampled mud’ (Cleal et al., 1995,p.68) – found in an area of chalkland which has no natural mud/clay, with an associated ‘layer of struck flint’ – which he found in many segments.

Now this, in itself, sounds quite interesting, if not conclusive as evidence of the existence of a moat, until you look for other landscape features with similar foundations which when analysed, start to build up a much more conclusive picture.   Such landscape features can be found in ‘dew ponds’.

Figure 12 – Typical Dew Pond as found in Wiltshire - (Stonehenge Phase I)
Figure 12 – Typical Dew Pond as found in Wiltshire – (Stonehenge Phase I)

A dew pond is an artificial pond usually sited on the top of a hill, intended for watering livestock.  Dew ponds are used in areas where a natural supply of surface water may not be readily available. The name dew pond (sometimes cloud pond or mist pond) is first found in the Journal of the Royal Agricultural Society in 1865.  Despite the name, their primary source of water is believed to be rainfall rather than dew or mist.

The mystery of dew ponds has drawn the interest of many historians and scientists, but until recent times there has been little agreement on their early origins. It was widely believed that the technique for building dew ponds had been understood from the earliest times, as Kipling tells us in Puck of Pook’s Hill.  The two Chanctonbury Hill dew ponds were dated, from flint tools excavated nearby and similarity to other dated earthworks to the Neolithic period.

Figure 13– Profile of a typical dew pond construction - (Stonehenge Phase I)
Figure 13– Profile of a typical dew pond construction – (Stonehenge Phase I)

They are usually shallow, saucer-shaped and lined with puddled clay, chalk or marl on an insulating straw layer over a bottom layer of chalk or lime. To deter earthworms from their natural tendency of burrowing upwards, which would in a short while make the clay lining porous, a layer of soot would be incorporated or lime mixed with the clay. The clay is usually covered with straw to prevent cracking by the sun and a final layer of chalk rubble or broken stone to protect the lining from the hoofs of sheep or cattle.

In 1877 Mr H. P. Slade discarded the term ” dew-ponds ” in favour of ” artificial rain-ponds,” and scouted the idea that dew had any part in filling ponds at all. His remarks dealt practically with one pond, the greatest diameter of which was 69½ feet, which was constructed in 1836 at the cost of £40. It was bedded in the Thorpe Downs, near Loughborough, on the Berkshire Hills, at the height of 450 feet above the level of the sea. Being ” fed from the heavens,” this fact probably gave rise to its being classed as a dew-pond. The basis of this pond was stated to be, first a layer of thick clay (mixed with lime to prevent the working of earth-worms), second, a coating of straw, ” to prevent the sun cracking the clay,” and, thirdly, a layer of loose rubble. Moreover, during an interval of 40 years, till 1876, the pond had only once been dry.

(Stonehenge Phase I)

I believe so. Nonetheless, Hawley can be forgiven for not recognising that this clay lining feature being used to stop the lying water being absorbed through the porous chalk into the bedrock.  Because he was not looking for a moat, as he was incorrectly informed by his geologists, that the surrounding area, was perceived to have been dry for over half a million years and therefore did not have a raised water table in the past.

Hawley also found evidence of what he called a strange ‘dark soil layer’ which existed within the primary fill, in many parts of the ditch I would strongly suggest that this ‘dark soil layer’ consisted of decayed remains and sediment, possible the hay which is traditionally lined with the clay to stop cracking.  Moreover, over time, organic matter would have naturally floated to the bottom (like a pond), especially if they had not been cleaned regularly. This would naturally have left a lining of dark soil at the bottom of the moat was it fell into disuse and became dry

By 1923 Hawley reported that this ‘ubiquitous dark layer’ was found throughout his excavations, sometimes up to 8” thick, suggesting its existence in water would have been for some considerable length of time, and it was resting directly at the bottom of the moated ditch.  This ‘Dark Layer’ was also observed by Atkinson in 1954 when the recut a piece of Hawley’s trench (segment 98) and found the same dark layer – not flint this time, but a stone layer.  Moreover, he described the soils above as loamy (sand and clay) (Evans et al., 1984, 7-30) and that this layer (like the construction of dew ponds) was “often associated with a ‘layer’ of struck flint, which was found in many segments” (Cleal et al., 1995, p.68), to protect the clay lining.

Figure 14– Hawley’s Ditch excavation and the ‘dark matter’ - (Stonehenge Phase I)
Figure 14– Hawley’s Ditch excavation and the ‘dark matter’ – (Stonehenge Phase I)

There it has now been established that Stonehenge had, at some stage, a layer of waterproofing, the ‘layer of foot-trampled mud’ plus a ‘layer of struck flint’ added to the ditch. It’s also been established that this ditch was, at some point, filled with water for quite some considerable amount of time, as evidenced by the deep ‘dark layer’ sediment.

This use of the ditch as a moat is escalated in Hawley’s finding of other moats that surrounded the north and south mounds, which ‘connected’ to the Stonehenge moated ditch.  On the shallow associated banks of the ditches, he finds lots of what he calls ‘yellow marl’ – “there was a quantity of the yellowish marl within the ditch and about the site of the palisade” (Cleal et al., 1995, p.278) – Marl was originally an old term loosely applied to a variety of materials, most of which occur as loose, earthy deposits consisting chiefly of an intimate mixture of clay and calcium carbonate, formed under freshwater conditions; specifically an earthy substance containing 35–65% clay and 65–35% carbonate. (Pettijohn, F. J. (1957). p.410)

As this marl had fragments of Blue and Sarsen stones within it – this clearly shows that ‘freshwater’ was in the moat and present at the time of construction.

(Stonehenge Phase I)

If you look at remains of the Stonehenge moat today, it appears very shallow and uneven, but when excavated, it looks very different. It is, in fact, a series of ‘individual pits’, which, in places, are connected by shallow walls.

This opens up a series of fascinating unanswered questions:

  • Was the ditch half-finished, for the pits differ in size, shape and depth, or perhaps they were ‘dodgy Welsh builders’ who did not know what they were doing?
  • If the ditch is indeed defensive or symbolic as some archaeologists suggest, why not pile the chalk on one side rather than both sides?
  • Why are their seats or shelves left in the ditch?
  • Why are there stone holes at the bottom of the moated ditch?
The Stonehenge Ditches are really pits - Stonehenge Phase I
The Stonehenge Ditches are really pits – Stonehenge Phase I

The ability to build defensive structures was available to our ancestors. Still, on this occasion, they decided not to use it, as clearly it was made for another purpose, and that purpose was as a groundwater filled moat. 

(Stonehenge Phase I)


The only reason you would cut the ditch down to different levels is to search for the groundwater level under the chalk bedrock.   As chalk is a porous substance and water travels freely through it, the groundwater table over an area like Stonehenge can vary by a metre or so depending on the makeup of the chalk, as water runs through the fault lines in the chalk strata, leading to varying groundwater levels over an area.

This variation of groundwater tables would also explain why the builders left shallow walls and why none of the walls goes up to the surface – so the water could flow between the individual pits.

(Stonehenge Phase I)

There are TWO answers to this question.

First, CHALK

Our ancestors needed a place with a chalk sub-soil as it has two exceptional properties – it’s porousness and its resistance to dissolve in water.

The problem with chalk is that it’s difficult to excavate, in fact almost impossible. So, if Mesolithic Man wanted an easy time and needed a large defensive ditch, he would have chosen a site with soft soil, unless he’s insane or had nothing better to do for the next few years or so!

These builders were attracted to chalk and its unique characteristics.  Not only is it porous, but it is SLOW porous, which means that a pit or hole below the local groundwater table would gradually fill with or empty with water at a consistent rate.  In addition, because it’s part of the limestone family, it would not crumble and dissolve.

If these moats are used in conjunction with natural groundwater reeds (Phragmites australis is one of the main wetland plant species used for phytoremediation water treatment) placed on the shelves within the ditch, the result is pure, clean, freshwater good enough to drink comparable to modern tap water. This type of water purification would not be seen in Britain for another 8,000 years.  It would also leave Hawley’s unidentified ‘dark layer’.

Further Reading

For information about British Prehistory, visit www.prehistoric-britain.co.uk for the most extensive archaeology blogs and investigations collection, including modern LiDAR reports.  This site also includes extracts and articles from the Robert John Langdon Trilogy about Britain in the Prehistoric period, including titles such as The Stonehenge Enigma, Dawn of the Lost Civilisation and the ultimate proof of Post Glacial Flooding and the landscape we see today.

Robert John Langdon has also created a YouTube web channel with over 100 investigations and video documentaries to support his classic trilogy (Prehistoric Britain). He has also released a collection of strange coincidences that he calls ‘13 Things that Don’t Make Sense in History’ and his recent discovery of a lost Stone Avenue at Avebury in Wiltshire called ‘Silbury Avenue – the Lost Stone Avenue’.

Langdon has also produced a series of ‘shorts’, which are extracts from his main body of books:

The Ancient Mariners

Stonehenge Built 8300 BCE

Old Sarum

Prehistoric Rivers

Dykes ditches and Earthworks

Echoes of Atlantis

Homo Superior

For active discussions on the findings of the TRILOGY and recent LiDAR investigations that are published on our WEBSITE, you can join our and leave a message or join the debate on our Facebook Group.
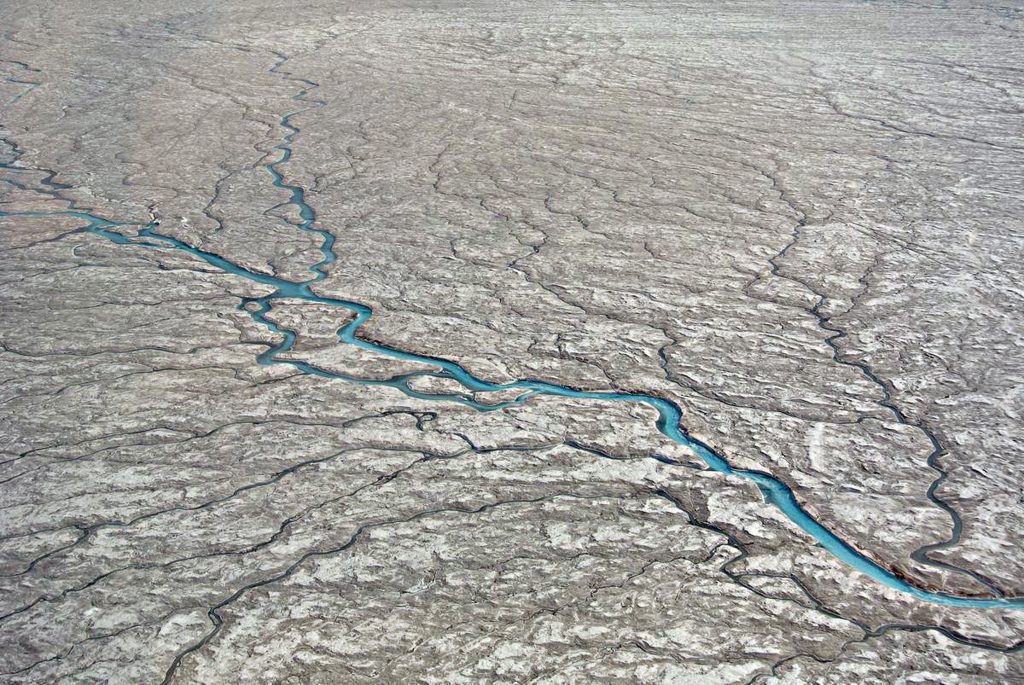
Chapter 7 – Britain’s Post-Glacial Flooding

Book Extract…………………………….. The Post-Glacial Flooding Hypothesis (Chapter 7 – Britain’s Post-Glacial Flooding)

When floods rise and fall, they characteristically leave behind a sediment signature. This is generally heterolithic in character; they incorporate sequences or couplets both of coarser material from peak discharges and finer material from waning flows or even inter-flood discharges (Macklin et al.,1992).

In channel zones, flood mobilisation of coarse materials may lead to both channel erosion, and deposition producing mesoscale bed and bar forms  (Fig. 23),  which have a distinct topographic expression  (unit bars of languid form, scour pools, and flood berms and scrolls at channel margins, for example). These may be extended by growth at their margins during succeeding and lesser discharges. 

Britain’s Post-Glacial Flooding
Figure 23. Flood segment units, showing (a) in-channel bedforms. (b) Channel margin accretion and (c) Floodplain depositional sites (Macklin et al., 1992)
Britain’s Post-Glacial Flooding

Moreover, where sediment sheets are deposited at channel margins at various flood stages, the generally finer suspended-sediment units may exhibit textural changes, usually in the form of smaller-scale coarse fine grading marking the transition from flood peak to the waning stage. Unit thickness may relate to not only flood duration and magnitude, but also sediment loadings and to flood sequence sediment-exhaustion.

Dated materials come from a variety of contexts in relation to alluvial units (Fig. 24). They may relate to the termination (a) or onset (b)/(c) of unit formation or mark a change in sedimentation (e.g. in texture) within a unit (d).

Whilst it appears from the literature that researchers have in practice tended to attempt dating at hiatuses of one kind or another, many dates nonetheless ‘float’ within sedimentary bodies which were actively accumulating over long periods of time (e in Fig.24.). It is interesting to note that in the present Holocene fluvial archive, the proportion of dates recording changes in sedimentation style increases from form units A to D.

a)         giving minimum age (may include situ growth)

b)         giving maximum age

c)         at base within the unit (incl. in situ growth and floated and re-eroded timbers)

d)         making changes within the unit

e)         within unit giving ‘floating’ date

Britain’s Post-Glacial Flooding
Figure 24. Alluvial Dating Units (Macklin et al, 1992)
Britain’s Post-Glacial Flooding

Thus, flood basin ‘events’ appear to be relatively well pinpointed, but only a third of lateral accretion deposits convey information other than that channel migration was active at the time—but probably for much longer. However, relatively few form units have multiple dates to allow periods or rates of activity to be precisely determined.

For the recording of out-of-channel extreme events and finer sediment deposition, this is not the case. The relative absence of sandy sediments in many U.K. rivers is also something of a disadvantage because most overbank deposited materials are derived from eroded soils, and these get widely deposited from turbid waters whatever the magnitude of flood involved. Some geological materials in Britain yield a diagnostic range of sediment sizes (e.g. catchments underlain by mixed Carboniferous rock types – Macklin et al., 1992b). Still, unfortunately for flood-power recording, many do not.

It should also be borne in mind that flooding is not the only way in which heterolithic sediments are formed; thus, Thomas et al. (1987) list many types of inclined heterolithic sedimentation.  Migrating in-channel sand and gravel sheets,  for example, may leave their signature and some care has to be exercised in distinguishing autogenic (derived from a variety of continuing rhythmic sedimentation processes) and allogenic signals (marking externally generated hydrological events) for purposes of building up a flood event history.

Palaeochannel River channels (dry river valleys) may become abandoned by avulsion and cut-off processes in a variety of channel patterns; channel sediments may accumulate to ‘seal’ either or both ends of the abandoned reach which subsequently may be infilled over an extended time period by flood deposits and organic accumulation. Such processes have been assessed in some detail for contemporary meandering rivers (see, for example, Johnson and Paynter, 1967; Lewis and Lewin, 1983; Hooke, 1995), but also for braided (Leddy et al., 1993) and anastomosing systems (Smith et al., 1989) together with avulsions involving extended-reach abandonment (Jones and Harper, 1998).

Abandoned Palaeochannels may constitute around 15% of the active sedimentation surface in braided rivers (Bristow, 1987) and 10% in meandering ones (Lewis and Lewin, 1983). Relict channels are often found defining outer terrace margins (Lewin and Macklin, 2003) where they may be readily sampled for purposes of dating and environmental reconstruction.

Additional complexity is provided by systems changes in which more extensive channel networks (as in braided rivers) are replaced by a less extensive one (as in a single thread meandering channel). This, for example, has been suggested for the early Holocene in lowland Britain, where the infilling of redundant channel branches over a timespan of millennia has been proposed (Brown et al., 1994). In such situations, channel fills may considerably post-date the formation of the channels they occupy. The actual record of sites directly showing phased channel contraction is, however, rather sparse.

Britain’s Post-Glacial Flooding
Figure 25. One Hundred and Forty-seven Recorded Flood frequencies in Britain during the Holocene (Lewin and Macklin, 2003)
Britain’s Post-Glacial Flooding

This indicates that a majority of Palaeochannel units (147 in the Lewin and Macklin, 2003 study) were active during the Holocene due to the rise in the water table up to just 1000 years ago.  Moreover, as pointed out within the paper. Constant holocene sedimentation might be expected to produce straight-line cumulative plots and even probability levels, with deviations representing episodic or increasing/decreasing trends inactivity.

However, the uneven preservation of alluvial units (Lewin and Macklin, 2003) biases the ‘recorded’ alluvial archive in different ways, especially but not exclusively towards later Holocene sediments. Furthermore, 14C dated materials are also likely to appear bunched in relation to 14C production variability, which may or may not coincide with flood production, so that to an extent the spikiness of the illustrated plots represents more complex factors than episodic alluviation alone. These factors need to be borne in mind when interpreting the data presented.”

Figure 26. Lidar data mapping of a typical river system over time (Britain’s Post-Glacial Flooding)

Figure 26. Lidar data mapping of a typical river system over time (Britain’s Post-Glacial Flooding)

Further Reading

For information about British Prehistory, visit www.prehistoric-britain.co.uk for the most extensive archaeology blogs and investigations collection, including modern LiDAR reports.  This site also includes extracts and articles from the Robert John Langdon Trilogy about Britain in the Prehistoric period, including titles such as The Stonehenge Enigma, Dawn of the Lost Civilisation and the ultimate proof of Post Glacial Flooding and the landscape we see today.

Robert John Langdon has also created a YouTube web channel with over 100 investigations and video documentaries to support his classic trilogy (Prehistoric Britain). He has also released a collection of strange coincidences that he calls ‘13 Things that Don’t Make Sense in History’ and his recent discovery of a lost Stone Avenue at Avebury in Wiltshire called ‘Silbury Avenue – the Lost Stone Avenue’.

Langdon has also produced a series of ‘shorts’, which are extracts from his main body of books:

The Ancient Mariners

Stonehenge Built 8300 BCE

Old Sarum

Prehistoric Rivers

Dykes ditches and Earthworks

Echoes of Atlantis

Homo Superior

For active discussions on the findings of the TRILOGY and recent LiDAR investigations that are published on our WEBSITE, you can join our and leave a message or join the debate on our Facebook Group.

DLC Chapter 1 – The Ascent of Man

DLC - Ascent of Man
DLC – Ascent of Man

Book

Out of Africa (DLC – Ascent of Man)

“Man is unique not because he does science, and he is unique not because he does art, but because science and art equally are expressions of his marvellous plasticity of mind.” – Jacob Bronowski

Long, long ago, man (Homo Sapiens) walked out of Africa into the middle east on a journey that would eventually take them to the moon. However, this ‘voyage’ is not as straight forward as the anthropologists and archaeologist would have you believe. For on this incredible journey, not all of mankind would walk the same path to the industrialisation and technology that we would consider as natural evolution today. On this journey to mankind’s destiny, there were casualties within societies that fell behind, as they failed to adapt to the rigours of the changes that created our modern society.

Originally, anthropologists had believed that our ancestral journey started 100,000 years ago, when Homo Sapiens (Mankind) ventured ‘Out of Africa’ to inhabit eventually the entire earth’s surface through ‘natural migration’. The dates of these migrations have altered drastically in recent years with the introduction of ‘archaeogenetics’. This science was introduced in the 1990s and allowed us to look deep into our own DNA to find genealogical connections and linkages, which can be joined together with Palaeolithic archaeological findings that indicate that this single migration theory is now incorrect or misunderstood.

- Ascent of Man
DLC – Ascent of Man

We currently believe that there were as many as three migrations of ‘Humanoids’ – from the ‘Homo’ family, who left Africa, which is commonly termed as the ‘cradle of humanity’. The first migration was about 1.75 million years ago, when Homo Erectus left East Africa, then spread wide for over a million years, and found as far away as China and South America. Homo Erectus was primitive in many aspects compared to the later migration species such as Homo Sapiens, but it represented a benchmark of change to a recognisable humanoid from his great ape origins. Erectus brain size was much larger, with a face including projecting nasal bones, small teeth, a human-like posture for the skull and a body frame of human proportions. Erectus disappeared at the time of second migration, whether this disappearance is a connection or a coincidence is unclear at present (as the fossil record is scant), but as we will see, this may not be the only time that a humanoid species disappears quite mysteriously after an African migration.

The Second migration happened at a somewhat closer date of around 500,000 years ago, when Homo Neanderthal left Africa and moved north into Western Asia. Neanderthals had an elongated superior pubic and rounder femora and ramus bones (in the Pelvic region) like Erectus. A larger brain volume like ours; a high and arched temporal bone (in the skull); reduced interorbital breadth (distance between the eyes); reduced total facial projection (front profile); a lightly built tympanic (middle ear bone) and in many Neanderthals, simplification and shrinkage of tooth crowns like ourselves and weak or absent iliac pillar (in the hip).

There were more distinctive features than Erectus such as body shape, rib cage and limb proportions, but the clearest difference was in the skull; double-arched but small occipital torus with centre pit (the suprainiac fossa at the back of the skull); a spherical vault shape in rear view; distinctive shape of the semi-circular canals of the inner ear; strong mid-facial projection and cheekbones that are inflated and retreat at the sides; a high, wide and projecting nose, large and near circular orbits; a high but relatively narrow face and enlarged front teeth (incisors), which are hollow in the inside surfaces of the upper centrals, but most distinctive than all was the strong brow ridge.

DLC – Ascent of Man

Neanderthals were separated as a species for 700,000 years from Sapiens and a million years from Erectus. Similarly, Coyotes and Wolves have been isolated for about 1 million years and far more generations. Interestingly, they can still produce fertile offspring by ‘interbreeding’; similar findings existed between lions and tigers that can interbreed even after 5 million years of separation. These examples clearly show that Sapiens and Neanderthals and even Erectus were capable of interbreeding when given the right circumstances.

The reason I have mentioned interbreeding is because any discussion of our evolution has to explain how these humanoid cousins come into being. Most people have heard of Darwin and his famous book ‘On the Origins of Species’ – but few have gone on to understand what he was trying to tell us within this famous book. Most online encyclopaedias will tell you that: “Darwin’s book introduced the scientific theory that populations evolve over the course of generations through a process of natural selection. It presented a body of evidence that the diversity of life arose by common descent through a branching pattern of evolution. Darwin included evidence that he had gathered on the Beagle expedition in the 1830s and his subsequent findings from research, correspondence, and experimentation.” All very nice but missing the main point of Evolution.

So what is ‘natural selection’ or as some put it ‘survival of the fittest’?

DLC - Ascent of Man
DLC – Ascent of Man

Quite simply it’s the ‘mutation’ of the species. The classic case is the neck of a giraffe, which started history as being no bigger than a horse’s neck.  The giraffe’s neck does not get longer over time; it’s fixed in length, but an off-spring that has genetically mutated may have a neck an inch or two longer than one of their siblings. This sibling will therefore be able to feed more successfully as they will have access to the higher food sources – and this is what is meant by the term ‘survival of the fittest’. Consequently, when this sibling mates the genetic probability is that at least one if not more of its children will have the same neck size and so through inbreeding (with giraffes with this larger neck size over the

course of time) the longer necked giraffe will now become the norm for this genetic branch of the giraffe’s family tree and will be better adapted to surviving in times of shortage. This mutational process continues for many hundreds of generations until the giraffe’s neck is the size we see today.

It is thought that six million years ago this kind of mutation created the first humanoid (Homo) as a branch of the primate tree. Moreover, what we need to understand is that this mutation of the species is ‘ongoing’ and from this humanoid genetic tree created Homo Erectus, Homo Neanderthal and us Homo Sapiens. Even so, this is not an exclusive club as there will be many ‘sub-species’ of humanoids as these cousins can effectively interbred with each other producing other kinds of humanoids, which are currently being found in the fossil records, confusing Anthropologists because of their diversity.

When Sapiens left Africa, they had two distinctive routes they could have taken. The best and fastest route would have been over the Red Sea to the Middle East, yet the archaeological evidence shows that they took the ‘foot route’ instead through present Egypt into Palestine. This was the same route taken by the two former Homo migrations by Erectus and Neanderthal, as both species have now been found in this area through archaeological record, which leads us to conclude that these first two humanoids species were unwilling or unable to swim and so were completely land based. 

It is an interesting and relevant fact that most native Africans are poor swimmers, which is surprising for people who are surrounded by lakes and rivers. A little-known fact is that non-Africans have an extra layer of fat in their skin, known as ‘subcutaneous tissue’, as do most aquatic mammals – this difference in the body type can best be seen in the death rates from drowning, where African people are twice as likely to drown than white people, even in swimming modern pools.

Where did Homo Sapiens get the ability to swim and use boats in our evolutionary history?

DLC – Ascent of Man

Further information on Prehistoric Britain can be found: www.prehistoric-britain.co.uk

Further Reading

For information about British Prehistory, visit www.prehistoric-britain.co.uk for the most extensive archaeology blogs and investigations collection, including modern LiDAR reports.  This site also includes extracts and articles from the Robert John Langdon Trilogy about Britain in the Prehistoric period, including titles such as The Stonehenge Enigma, Dawn of the Lost Civilisation and the ultimate proof of Post Glacial Flooding and the landscape we see today.

Robert John Langdon has also created a YouTube web channel with over 100 investigations and video documentaries to support his classic trilogy (Prehistoric Britain). He has also released a collection of strange coincidences that he calls ‘13 Things that Don’t Make Sense in History’ and his recent discovery of a lost Stone Avenue at Avebury in Wiltshire called ‘Silbury Avenue – the Lost Stone Avenue’.

Langdon has also produced a series of ‘shorts’, which are extracts from his main body of books:

The Ancient Mariners

Stonehenge Built 8300 BCE

Old Sarum

Prehistoric Rivers

Dykes ditches and Earthworks

Echoes of Atlantis

Homo Superior

For active discussions on the findings of the TRILOGY and recent LiDAR investigations that are published on our WEBSITE, you can join our and leave a message or join the debate on our Facebook Group.

Ten thousand year old boats found on Northern Europe’s Hillsides

– 7,000 years before they were ‘supposedly’ invented. (Ten thousand year old boats)

The exact time and circumstances of when our ancestors took to the waters of Britain is unclear to both Archaeologists and Historians alike, although they are aware that the materials used to build the earliest boats, such as wood and reed, have been about since the dawn of time.  However, until the experts’ dig up physical proof in the form of a complete ship, they will resist the temptation to accept that ten thousand year old boats existed and accept an earlier date, than the oldest partially constructed boat, dated 4,000 years old, found along the banks of the Humber at Ferriby near Hull in 1937.

In recent years, some more enlightened archaeologists have started to accept earlier dates for boat construction, as they recognise that the ‘dating’ for ancient sites in Ireland and the Scottish Isles are far older than the remains found in Hull and therefore, some kind of boat must have existed at an earlier time with the remains having yet to be discovered.  If the radiocarbon dating evidence used in Ireland is correct, it will show conclusively that sea travel must have been invented a further four thousand years earlier than the Ferriby discovery in a period called the Mesolithic dated around 6,000 BCE if not before. 

As a compromise, historians now imagine that these earliest boats were probably not constructed of wood or reed but a design consisting of an oval shape similar to half a walnut shell, with the structure made of a framework of split and interwoven willow rods tied with willow bark. The outer layer was originally an animal skin such as horse or bullock hides with a thin layer of tar to make it thoroughly waterproof.  This type of boat is called a ‘Coracle’ and is still used in parts of Ireland and Wales to travel over small rivers and placid lakes.

Coracle would not get across the Irish Sea - Ten thousand year old boats
Coracle would not get across the Irish Sea – Ten thousand year old boats

The problem with this mad idea is that no respectable seafarer would attempt to paddle’ across such harsh waterways such as the Irish Sea with twenty-foot waves (on a good day) in such a flimsy craft unless they were either insane or had decided to set sail on their final voyage!

Another oversight by archaeologists is the fact that the first mariners did not have maps or any idea what anything existed over the horizon, especially when you realise that Dublin (the nearest point to Anglesey from Wales) is 55 nautical miles away and way beyond ‘naked eye’ visibility.  The only other route to Ireland would be to ‘hop scotch’ 85 miles along with the Scottish Islands on the West Coast, which will still leave you with a 12-mile paddle across the Irish Sea.  The other dilemma for historians and archaeologists is that most prehistoric remains in Ireland are not where you would expect them in the North East or East – the closest shoreline to Scotland and Wales.  But in the SW region, over 250 miles further away from where the first Irish settlers are supposed to have landed, with little to no sites showing historical movement in-between.

Seriously ?? - Ten thousand year old boats
Seriously ?? – Ten thousand year old boats

But most importantly, what was the motivation to set sail to an unknown point over the horizon in the first place?

Anthropologists estimate that in 6 000 BCE Britain was occupied by bands of simple ‚hunter gatherers’ armed with spears chasing wild pigs and picking berries.  This population was estimated to be a mere 50,000 people on an island of 120,000 sq. miles – giving every man, woman and child on average the freedom to roam 2.5 sq. miles each to hunt and pick fruit and roots their heart’s content. Remembering everything in those days was free, and land ownership was another four thousand years time.

So why risk your life to travel to another place when you have no idea if it even exists or is habitable?

The reality is that the first mariners were exploring our seas and shorelines in a more substantial and suitably designed craft, long before historians are leading us to believe. Any mariner ‘worth his salt’ can see this reflected in the hills of Britain with ancient monuments called a ‘Long Barrow’ if he knows what to look for – they are over 100m long, 20m wide and had a chamber covered with chalk or soil, so it sat some 4m – 5m high.  It has two moats on either side of a ‘wedge shaped’ sloping mound, with the larger end to the rear and the chamber entrance.  Long Barrows has always been the archaeologist’s greatest mystery and appear in abundance on most ordinance survey maps, denoted by a small oval black star.  The first thing we should note about these Long Barrows is that they are unique and only built-in in Northern Europe, unlike Round Barrows, which are found worldwide.

West Kennet Long Barrow - original construction - Ten thousand year old boats
West Kennet Long Barrow – original construction – Ten thousand year old boats

Archaeologists all agree that the Long Barrows are the oldest monuments to exist in our landscape. 

This belief originates from the fact that the structure is very elaborate and includes huge ‚megalithic’ stones in their construction, as seen in the best-preserved Long Barrows at Avebury called West Kennet and Belas Knap in Gloucestershire, which were found with human bone remains inside its stone chambers.  It is believed that these remains have been collected rather than buried (as only the larger bones have been found), probably from a process called ‚excarnation’ where the bodies of the dead are laid out to rot naturally, and the bones are then collected for burial inside the tomb.  This process is very different from the individual graves and cremations that are seen at a later date in history.

These objects are connected to boats and a marine society because of their size and shape.  The Long Barrows mound originally had two deep ditches built on either side of the exterior; this ditch would have flooded with water giving the impression that the mound was surrounded by water.  We know that these ditches would have become moats is because, at the time of construction, the waterways of Britain and Northern Europe were much higher than today; this rise in ‚groundwater’ levels was due to ‘post-glacial flooding’ a by-product of the process our last ice cap undertook when it melted on the landscape some fifteen thousand years earlier.

Furthermore, the shapes of these mounds are not square, round or oblong – they are boat-shaped!

If these Long Barrows existed in Egypt, archaeologists would have no problem in identifying what these objects were or represented, as they look like the giant boats used by the Egyptians and are depicted on their temple walls.  Moreover, the act of placing bones inside the Long Barrows would then make perfect sense as it was recreating the person’s last voyage to the afterlife.  Consequently, Long Barrows prove a marine society (a civilisation that lives and trades upon water) in existence directly after the last ice age in Northern Europe, who lived in boats and later chose to be buried within a boat. Even today, there still is an old Celtic custom of placing money over a dead person’s eyes to ‘pay the ferryman’, and we lay out our loved ones in strange, unnecessary eight-sided coffin ns tapered at the shoulders that look remarkably like boats – to take them on their last voyage to the afterlife.

But it also gives us a fantastic insight into the design of the boats used in this period of ancient history, which has not survived the ravages of time. 

Long Barrows look more like barges than canoes, with the stern (back end) being where the boat was steered, and the cabin was placed. The particular size and shape of Long Barrows (similar to Thor Heyerdahl’s reed boat ‘Ra’ that successfully sailed across the Atlantic in 1970) indicates that these vessels had sails and were not rowed or paddled.  Moreover, a sailed boat would have a greater range than a canoe as the boat’s front is round, like an archer’s bow – hence the name?  Not flat or wedged, this is a design constructed for manoeuvrability, speed and distance, clearly indicating these ancient mariners’ knowledge of advanced boat design.

Design of a Long Barrow is the same as a Barge Boat- Ten thousand year old boats

The other noteworthy aspect of Long Barrows is the size and construction of the monument. At West Kennet and other Long Barrows, giant megaliths were used to highlight the entrance of the chamber; these boulders are over 15 tonnes in weight and four to five metres in height.  They are an unnecessary addition to the construction, but they are visible even a couple of miles away on a clear day.  Long Barrows, when first constructed, would have been covered not with grass as today, but with the sub-soil that came from the ditches they dug that surrounded the monument; in the case of West Kennet, it would be bright white chalk.  The massive size of these monuments must also be taken into consideration as they are over 100m in length – five times longer than the chambers they hide within them, and they are tapered from the helm 4m high to the bow, just 1m tall. Making them (from a distance on the waters) look like a gigantic direction indicator.

The appearance of the bright white Long Barrow would act as a directing indicator from a great distance against a green grass background.

Long Barrows are built halfway up a hill to show direction - Ten thousand year old boats
Long Barrows are built halfway up a hill to show direction – Ten thousand year old boats

Another remarkable aspect of Long Barrows is its location and position on the landscape.  If we look at the extensive river ways after the last ice age, we notice that these monuments are built parallel to significant rivers and appear at junctions where rivers converge. Moreover, they don’t occur on the top of the hills surrounding the rivers but appear just over halfway up – so that they cannot be seen over the top of the hill on the opposite side.  Because of their size and construction materials, these ‘markers’ are visible for miles like white pointers in daylight, but because they are pure white, they can also be seen at night with ‚moonshine’.

However, these objects are not in Egypt; they are in Northern Europe, and within the Mesolithic period, our ancestors are supposed to have been primitive‚ hunter gathers’ that lived in temporary shelters.  The concept of boats (according to the experts) would not become common for another four thousand years.

If this was a marine civilisation that lived so long ago, who were they, and why have we not found any evidence of them?   

Astonishingly, we have, and it’s in the form of myths, wooden planking and wall paintings.  As we have already shown, the voyage to the afterlife is a well-known myth and practised belief. Even today, yet another tale connecting us to our marine ancestry and ritual of death is moonlight as well as headstones and raising spirits.  Stonehenge is a ‘world heritage site’ made of stone, and when it was first constructed, our ancestors surrounded it with a circle of 58 (four tonnes) ‘Bluestones’ dug into round chalk holes (called Aubrey Holes, named after their discoverer).  With these stones, you can flawlessly track the moon’s seasons (like a calendar), connecting a link between the Stones and the moon.

Voyage to the Afterlife as seen by the Egyptians - Ten thousand year old boats
Voyage to the Afterlife as seen by the Egyptians – Ten thousand year old boats

 But where did the body lay before the bones were collected?

Archaeologists have found that originally, in the centre of Stonehenge lay two rows of stone holes (Q & R) two metres apart in a crescent shape open to the NW segment of the monument. These holes held stone slabs for the dead, on which they laid in a ceremony known as an ‘Excarnation’, where the dead are left to rot naturally. Stonehenge is surrounded by no less than ten Long Barrows, which would have taken the dead bodies over two thousand years.  Each of the Long Barrows are built on the shorelines of the Mesolithic waterways (which were 30m higher than today), and at least two barrows have had ‘canals’ created from the shorelines to the entrance of the barrow. 

These constructions show that the ceremony of taking the bones by boat from Stonehenge to the Long Barrows for final burial probably undertaken at sunset or in the dead of the night under a full moon,  where the bones and spirit of the departed rise for the last time and go on their final voyage?

Further Reading

For information about British Prehistory, visit www.prehistoric-britain.co.uk for the most extensive archaeology blogs and investigations collection, including modern LiDAR reports.  This site also includes extracts and articles from the Robert John Langdon Trilogy about Britain in the Prehistoric period, including titles such as The Stonehenge Enigma, Dawn of the Lost Civilisation and the ultimate proof of Post Glacial Flooding and the landscape we see today.

Robert John Langdon has also created a YouTube web channel with over 100 investigations and video documentaries to support his classic trilogy (Prehistoric Britain). He has also released a collection of strange coincidences that he calls ‘13 Things that Don’t Make Sense in History’ and his recent discovery of a lost Stone Avenue at Avebury in Wiltshire called ‘Silbury Avenue – the Lost Stone Avenue’.

Langdon has also produced a series of ‘shorts’, which are extracts from his main body of books:

The Ancient Mariners

Stonehenge Built 8300 BCE

Old Sarum

Prehistoric Rivers

Dykes ditches and Earthworks

Echoes of Atlantis

Homo Superior

For active discussions on the findings of the TRILOGY and recent LiDAR investigations that are published on our WEBSITE, you can join our and leave a message or join the debate on our Facebook Group.

Brain capacity (Cro-Magnon Man)

Neanderthals

Past genetic studies have set out to verify whether interbreeding between Sapiens and Neanderthals took place. These findings showed that the genetic makeup of ‘Modern Humans’ (Homo Sapien Sapiens) is 4% inherited from this Neanderthal interbreeding, with just one exception – the Sub-Saharan African population, who because of many complex reasons did not travel ‘out of Africa’ with their relations some 50,000 years ago. Their genetic makeup varies from between 0 to just 1% of Neanderthal DNA (probably due to recent intermigration) – Brain capacity (Cro-Magnon Man).

However, the above studies are in conflict with recent findings reported in Nature Magazine in 2015. These findings appear to indicate an even greater percentage of our genes belong to our Neanderthal cousins. Qiaomei Fu, a palaeogenomicist at Harvard Medical School in Boston, Massachusetts, told meeting members how she and her colleagues had sequenced DNA from a 40,000-year-old jawbone that represents some of the earliest modern-human remains in Europe. They estimate that 5 –11 percent of the bone’s genome is Neanderthal. Interestingly, the Neanderthal elements of the genome structure contained large chunks of several chromosomes. Further genetic analysis showed that the individual was a man. Using the theory that lengths of DNA inherited from any one ancestor shorten with each generation; the team estimated that the man had a Neanderthal ancestor in the previous four to six generations.

Sapien v Neanderthal - Brain capacity (Cro-Magnon Man)
Sapien v Neanderthal – Brain capacity (Cro-Magnon Man)

The interbreeding between Sapiens and Neanderthals probably led to descendants carrying a ‘Mitochondrial DNA’ (mtDNA) inherited exclusively from the mother. Therefore (in theory) we should be able to find in the population today this Neanderthal (mtDNA) group. Sadly, this (mtDNA) group, to date, has never been found. Consequently, the natural conclusion to this lack of evidence is to suggest that the hybrids must only have come from Sapien Mothers with Neanderthal fathers. However, this theory is not without complications. If this is the case it seems to contradict the existing perceived history of the two species meeting and only the Sapiens surviving as they could ‘out think’ their Neanderthal cousins, to obtain sufficient limited food supplies (due to the ice age) for survival.

If the Neanderthal males were taking Homo Sapien women by creating relationships (or gang raping against their will, as some suggest) this would lead us to conclude that the Neanderthals were more assertive and dominating that their Sapien counterparts – they clearly were physically larger (nearly twice as large) so if they were aggressive enough to take Sapien women, could they not also take their food? – The harsh reality is that the Neanderthals died out and Sapiens and moreover, their interbred off-spring the Homo Superior (Cro-Magnons) survived. 

So is there another explanation or is this perception of history completely unbalanced?

If we look at the probabilities and how (mtDNA) lines can disappear, we find that it’s not only because of ‘natural selection’ or that the people carrying the (mtDNA) lines don’t reproduce – but because of a random statistical effect. If a Neanderthal female and a Sapien male mate, she could, in time, have fifty living descendants, all carrying a fraction of her DNA. However, her (mtDNA) can disappear completely as it carries through the female line. Consider this example. If a Neanderthal female who carries the (mtDNA) line has five sons and two daughters, but those two daughters have only sons and no daughters this would result in the end of the (mtDNA) line. In a stable population, one where each reproducing female leaves exactly two reproducing children, 90% of the original (mtDNA) lines will be broken in just 34 generations, as some of these families will have just boys, and that’s in less than 1,000 years. So if you start with 1,000 female Neanderthals in a mixed population, less than 100 Neanderthal (mtDNA) lines will survive after 1.000 years – after another 1.000 years, less than 10 – after yet another 1.000 years… gone forever. This is then further influenced by the belief that ancient civilisations will favour the male species and commit infanticide in order to reduce the female heirs when community resources are limited and hunting is a matter of survival.

DNA Human Tree - Brain capacity (Cro-Magnon Man)
DNA Human Tree – Brain capacity (Cro-Magnon Man)

Moreover, you can do the same type of calculation regarding Neanderthal Y chromosome lines. If Neanderthals were a small minority of our common ancestors, it is extremely unlikely that any two Neanderthal genes would survive after 30,000 years. In effect, (mtDNA) and the Y chromosome are inherited as just one gene, since they’re inherited in one piece, therefore, we don’t have to construct intricate theories of marriage customs or patterns of reproduction in order to explain the lack of Neanderthal (mtDNA) or Neanderthal Y chromosomes today; we only have to do some reasonable maths and realise that single sex children in families break the linkage.

However, it is far more probable that ‘Modern Humans’ are the product of the Homo Superior hybrids, as we all have our origin in an individual female hybrid. Their descendants were so exceptionably endowed that they managed to eliminate not only the Neanderthal population, but also the other ‘Out of Africa’ Sapiens, by assimilating all those in the Europe, leaving only the ‘pure’ Sapiens still simply living in sub-Saharan Africa. This hypothesis gives us an opportunity to compare the rise of Homo Superior to native African Sapiens, and will give us an understanding of how close we are to our Homo cousins, so we need to compare the ‘genome’ of both Neanderthals and Homo Superior.

The comparison

At roughly 3.2 billion base pairs, the Neanderthal genome is about the size of the modern human genome. According to preliminary sequences, 99.84% of the base pairs of the modern human and Neanderthal genomes are identical, compared to humans sharing around 94% of base pairs with the chimpanzee. The researchers recovered ancient DNA of Neanderthals by extracting the DNA from the femur bones of three 38,000-year-old female Neanderthal specimens from Vindija Cave, Croatia, and other bones found in Spain, Russia, and Germany. The project faced many difficulties, including the contamination of the samples by the bacteria that had colonised the Neanderthal’s body, the humans who handled the bones at the excavation site and also at the laboratory.  So, we must be realistic in the outcomes given and acknowledge that future samples may vary in regards to investigations into cro-magnon man’s ancestors.

Another comparison is in the cranial capacities of this species. Within the human population, studies have been conducted to determine whether there is a relationship between brain size and a number of cognitive measures. Early anthropologists and psychometricians found these correlations and even modern studies (which began with Van Valen 1974) also suggested a similar correlation with Jensen & Johnson 1994, in ‘Race and Sex differences in Head Size and IQ’.  They wrote

“In all of the 25 independent studies we have found in the literature, nonzero positive correlations between head measurements and intelligence measurements to be found, all but five with correlations significant beyond the 0.5 confidence level. The average correlation between various external head size and IQ is close to 0.15.  But external head size is rather weak proxy for brain size. Two recent studies have measured brain size per se by means of magnetic resonance imaging (MRI) and found correlations with IQ in the 0.3 to 0.4 range (Andreasen et al.,1993 Willerman, Schulz, Rutledge, & Bigler, 1991).”

Therefore, just how intelligent was Homo Superior in comparison to us and other groups in prehistory?

Cro-magnon man's brain capacity - Brain capacity (Cro-Magnon Man)
Cro-magnon man’s brain capacity – Brain capacity (Cro-Magnon Man)

Today’s human Brain (Modern Man) is on average 1380cm3, while the Homo Superior’s brain averaged 1660cm3, so they are (on average) 20% more intelligent than us. On the IQ scale that would mean that ‘Modern Man’ has an IQ of between 90 and 110 points (Stanford–Binet Intelligence Scale). While Homo Superior, would have an IQ between 108 and 132 (classified as High Average to Superior held by the top 7% of the present population) – hence my new Homo Superior (cro-magnon man) classification.

We can see the same correlation in other animals such as the size of Wolfs and Dogs – the dog’s brain is a deterioration of the animal it used to be in the wild. It does not mean that they are stupid, or their lives are poor; in fact, one would suggest (if you were a dog) that their lives today are much more progressive than the life they once lived. But if man was wiped out by disease tomorrow, how many dogs would survive in the long term – It would not be beyond thinking that dogs would become extinct without man to look after them?

Can we not use this same analogy on Modern Man in comparison to Homo Superior (cro-magnon man)? 

The Ascent of Mankind - Brain capacity (Cro-Magnon Man)
The Ascent of Mankind – Brain capacity (Cro-Magnon Man)

For if the sun’s electromagnetic radiation increased through our Van Allen magnetic belt that surrounds the earth, our power stations would go into ‘melt-down’ and would work no longer, leaving the world without electricity – how many ‘modern day’ advanced, sophisticated and cultured people would survive, long term, without electricity, gas and petrol?

Dogs need man to help to survive their ‘luxury’ lifestyles and man needs technology for the same reason.  Wolves and Homo Superiors (cro-magnon man) are naturally ‘wild’ animals of superior intelligence that allow them to adapt to ‘any’ environment and not to simply survive but moreover, grow and thrive within the environment, without fear of extinction. The other interesting comparison with brain capacity and IQ can be found in the fact that the further north you travel, the higher the IQ of a species. This includes both man and wolf. If we take this fact, we have to think about the reasons for this occurrence. Is this growth a product of the environment and weather, or does the higher intelligence allows a species to travel further, as its adaptability can overcome the environment better than someone with a lesser capacity?

In our last chapter, we theorised that the last Homo migration ‘Out of Africa’ by Sapiens 50,000 years ago, led to an  exodus from southern Asia about 30,000 years ago to Europe as a consequence of multiple mutations. This interbreeding brought an unknown kind of humanoid – Homo Superior. With a new kind of thinking as they had much larger brains with immense IQ, thus allowing them to move to fresh and greener pastures, following the ample food supply through their natural migration patterns. This increase in food allowed for an increased brain capacity, and the growth of imagination led them to develop and create brand new forms of transportation allowing them and their families to travel faster and for longer than before, through dangerous forests full of deadly animals. 

Village happily living on Water even today - Brain capacity (Cro-Magnon Man)
Village happily living on Water even today – Brain capacity (Cro-Magnon Man)

For a species that had a natural ability to both swim and walk on land, with the vast waterways that became Palaeolithic Europe spreading out for thousands of miles in all directions (let alone the sea routes within shoreline visibility), the boat would have been the method of choice. The environment was full of marsh lands, lakes and forests from the last ice age and water reeds would have grown with abundance. The simplest way to make a boat is to gather dried reeds into bundles and then tie them together. Almost instantly and without extensive effort, you have a floating reed boat. Over the space of a day you the tied and twisted fell bundles would produce a large boat that can travel many thousands of miles and allow you to fish in safety in the middle of a landscape full of lions, tigers, wolves and bears.

Further information on Cro-Magnon man can be found: https://youtu.be/V825KgfDDeM

Further Reading

For information about British Prehistory, visit www.prehistoric-britain.co.uk for the most extensive archaeology blogs and investigations collection, including modern LiDAR reports.  This site also includes extracts and articles from the Robert John Langdon Trilogy about Britain in the Prehistoric period, including titles such as The Stonehenge Enigma, Dawn of the Lost Civilisation and the ultimate proof of Post Glacial Flooding and the landscape we see today.

Robert John Langdon has also created a YouTube web channel with over 100 investigations and video documentaries to support his classic trilogy (Prehistoric Britain). He has also released a collection of strange coincidences that he calls ‘13 Things that Don’t Make Sense in History’ and his recent discovery of a lost Stone Avenue at Avebury in Wiltshire called ‘Silbury Avenue – the Lost Stone Avenue’.

Langdon has also produced a series of ‘shorts’, which are extracts from his main body of books:

The Ancient Mariners

Stonehenge Built 8300 BCE

Old Sarum

Prehistoric Rivers

Dykes ditches and Earthworks

Echoes of Atlantis

Homo Superior

For active discussions on the findings of the TRILOGY and recent LiDAR investigations that are published on our WEBSITE, you can join our and leave a message or join the debate on our Facebook Group.