Case Study – Historic River Avon (from the book ‘Post-Glacial Flooding Hypothesis’)
The Quaternary deposits within the Avon Valley encompass a range of geological constituents, including clay-with-flints, head, gravelly head, river terrace deposits, brick earth, alluvium, and sporadic peat. Clay-with-flint deposits, being of residual nature, have resulted from the alteration of Palaeogene sediments and the dissolution of the underlying chalk, with their formation predating that of river terrace deposits. While the precise age remains uncertain, it is likely that clay-with-flint deposits in the southwest of England date back to the Pleistocene epoch (Gallois, 2009).
Head deposits, often found on the upper slopes of the valley, are closely associated with clay-with-flint sediments and are believed to have formed through processes such as solifluction and the dissolution of underlying bedrock. Moving downstream within the valley, deposits like ‘head gravel,’ ‘gravelly head,’ and ‘head’ are deposited through various mechanisms, including fluvial transport, hill wash, hill creep, and solifluction (Barton et al., 2003; Hopson et al., 2007).
Fluvial deposits in the region comprise a series of 14 river terraces, with the highest terraces situated approximately 100 meters above the Avon Valley floor, extending up to 12 kilometres in width from the present-day river axis. In contrast, the lower terraces within the Avon catchment have widths ranging from 3 to 6 kilometres and are located alongside and below the current river. The extensive coverage and limited altitudinal variation of the highest terraces suggest their deposition as draped layers over the landscape (Clarke and Green, 1987).
These terraces maintain relatively consistent thicknesses along the valley, a characteristic often observed in systems where sediment overloading from upstream and input from tributaries to the central valley play a role. Lateral erosion and the redeposition of fluvial sediments are likely contributing factors (Brown et al., 2009a, b). This mechanism could account for the progressive reduction in floodplain width observed between successive erosion-aggradation phases (Brown et al., 2010).
The presence of a substantial number of terraces in the Avon Valley raises questions regarding their direct linkage to Marine Isotope Stage (MIS) cycles, as suggested by some terrace formation models (Bridgland, 2000).
In discussing the Avon terraces and pre-Quaternary geology, a publication titled ‘Crustal uplift in Southern England: evidence from a river terrace records’ has highlighted several terraces from the River Avon still visible in the Hampshire basin, designated as T5 to T10.
‘Little has been done to determine the age of either the terrace sequence or the older River Gravels in the Avon Valley’
However, the age of these terrace sequences and the older River Gravels in the Avon Valley remains relatively understudied. There have been some indications of interglacial sediments within the two lowest terraces of the Solent, assigned to OIS 7 and OIS5e, with organic remains of probable Ipswichian (OIS 5e) and probable early Devensian age described from sediments beneath low-level terraces in the Avon Valley. However, no organic remains have been reported at higher elevations in the valleys of the Avon and its tributaries (Allen et al., 1996; Barber and Brown, 1987; Green et al., 1983).
Recent research, specifically ‘Pleistocene landscape evolution in the Avon Valley, southern Britain: Optical dating of terrace formation and Palaeolithic Archaeology’ by Egberts et al. (2019), has generated results challenging previous geological dating methodologies for river terraces. Optical Stimulated Luminescence (OSL) dating results for T10-7 suggest deposition during or prior to MIS10/9, which includes the Last Glacial Maximum (LGM). These findings, while broadly aligned with prior relative chronologies, potentially offer refinements for dating the archaeological record of T7 and for calculating regional uplift and incision rates (Egberts et al., 2019).
In summary, the Avon Valley’s geological formations, including river terraces, exhibit complexity and have been the subject of ongoing research, especially regarding their formation processes and chronological interpretation.The Quaternary deposits in the Avon Valley encompass a variety of geological formations, including clay-with-flints, head, gravelly head, river terrace deposits, brick earth, alluvium, and occasional peat (Gallego-Sala et al., 2016). Clay-with-flint deposits are residual and have formed through the alteration of Palaeogene sediments and the dissolution of the underlying chalk, with similar deposits in southwest England likely attributed to the Pleistocene epoch (Gallois, 2009).
The diagram in Fig.62 presents the OSL results per terrace and in relationship to the MIS stages. The schematic valley cross-section shown in Fig. 63 is also based on the 3D model of the superficial geology of the Avon Valley, built-in Rock works based on BGS borehole data. The OSL ages for T10-7 suggest deposit during or before MIS10/9 (Fig. 5 – including the LGM). They broadly agree with, but potentially offer a refinement of, previously proposed relative chronologies used for dating the archaeological record of T7 and the calculation of regional uplift and incision rates.
The initial analysis of these results reveals a somewhat perplexing pattern characterised by inconsistencies and, in some cases, what appears to be a near-random sequence. These findings have surprised our research team as they deviate from the expected chronological order. For instance, the terrace labelled T10, positioned at the highest elevation 102 meters above Ordnance Datum (OD), was determined through Optical Stimulated Luminescence (OSL) dating to have formed over more than 200,000 years. This is a significant departure from the anticipated sequence.
Further complicating is the revelation that T7, situated at a lower elevation of 58 meters OD, has been dated as older than T10. Such findings challenge the previously held hypothesis regarding the age sequence of these terraces. However, perhaps the most compelling evidence highlighting the inadequacies of the older dated terrace hypothesis is the Loess Terrace, positioned at an elevation of 77 meters OD and classified as ‘Undifferentiated T.’ According to OSL dating, this terrace was formed during the Last Glacial Maximum (LGM), a period associated with extreme cold conditions. In a similar vein, T4, another terrace, also yields the youngest dates among the samples.
These findings underscore the complexity and intricacies involved in deciphering the history of these terraces. The results defy conventional expectations and challenge assumptions about their formation and chronology.
The authors attempted to account for the intriguing results by proposing possible explanations. They suggested, “Therefore, more plausible explanations for this discrepancy between the age estimate of T4 at Fisherton and that at Bickton are either that T4 at Bickton includes sediments ‘reworked’ during more recent fluvial processes or that T4 is a ‘compound’ terrace exhibiting differing depositional behaviour in the upper and lower catchments.”
However, it’s important to note that the reliability of the Optical Stimulated Luminescence (OSL) dating method used in this study raises some questions. Notably, there are instances of questionable dates, particularly within the same soil level. For example, sediment sample GL 14039 was dated as 70ka +/- 8, while sediment sample GL14041 at the same level was dated 58ka +/- 4. Similarly, sample GL14038 was dated 86ka +/- 6, and sample GL14040 was dated 70ka +/- 4, both at the same soil level. Such inconsistencies raise doubts about the accuracy of OSL dating.
These uncertainties in dating are reminiscent of the historical challenges faced by radiocarbon dating, which has seen improvements over time. It is possible that, as with radiocarbon dating, OSL dating methods may become more precise and reliable over the next few decades.
Additionally, a 14C vs. OSL dating paper (Gaigalas, 2000) revealed discrepancies between OSL and carbon dating, with OSL dates being significantly older, suggesting that OSL may overestimate ages by 30% to 40%. This observation is consistent with the dating range presented in Fig.50, indicating potential inaccuracies in OSL dating.
Furthermore, it is essential to consider the impact of the Holocene river floods on the deposition of sediments and terraces. The study identified over one hundred such floods, some lasting hundreds of years, which would have contributed to the erosion and sedimentation dynamics in the region. These floods, driven by intense precipitation and the flow of rivers, played a significant role in reshaping the landscape.
This may explain the apparent absence of sufficient alluvium or colluvium at Stonehenge Bottom during the Mesolithic and Neolithic periods.
In conclusion, while the study’s findings present challenges and inconsistencies, they underscore the need for a more comprehensive approach that combines multiple dating methods, accurate modelling of deposit thickness, and a nuanced understanding of landscape evolution to unravel the system’s and diachronic evolution complexities.
UPDATE
More Empirical Evidence of Post-Glacial Flooding and a Flooded Stonehenge
Prehistoric Levels and Widths for the River Avon
Take a close look at this illustration. It is not speculation, it is empirical science — mapped and measured river terraces from the Avon Valley, published in Egberts (2016), Pleistocene terrace formation and the Quaternary evolution of the Hampshire Basin, Bournemouth University.
What are we looking at?
These are the terrace steps cut by the River Avon over multiple glacial–interglacial cycles.
Each “T-level” marks a former stable floodplain where the river held its height for centuries, often millennia.
The heights are measured in metres OD (Ordnance Datum) and tied to known quarry and pit sites (e.g. Hatchet Gate Farm, Woodgreen, Somerley, Ashley).
How much bigger was the Avon?
Today, the river meanders with a width of just ~50 m near Salisbury.
At its maximum (T11), the Avon floodplain stretched ~12 km across.
That is ~240 times wider than the river today.
What does this mean for Stonehenge?
Phase 1 of Stonehenge (Car Park Postholes) sits on T9 (~90 m OD).
Phase 2 (ditch, Aubrey Holes, bluestones) cuts into T8 (~75 m OD).
The terraces show that the palaeochannel not only flooded up to the old car park, but at times overtopped the entire Stonehenge site.
Why this matters:
Terraces are not theory — they are empirical geomorphological evidence.
They prove that the Avon has flooded to multiple levels, sometimes far higher than the monument itself.
This is not about “if” water could reach those heights — the terraces prove it already has, repeatedly, over many Ice Age cycles.
So when critics dismiss the role of high water tables or argue “the site couldn’t have been wet,” they are ignoring the most basic geological record in front of us. The terraces are the diary of the river — written in gravel, chalk, and silt — showing that water rose and fell, over and over again.
The real question is not if Stonehenge was surrounded by water. It is when, and how many times it happened during its long prehistory.
The Post Glacial Flooding Hypothesis – Robert John Langdon
In the context of “The Post-Glacial Flooding Hypothesis,” an investigation was undertaken into novel mathematical models to quantify water release events that occurred during and after the Last Glacial Maximum, approximately 10,000 years ago. Should it be postulated that the Dykes of Britain functioned as conduits for water rather than solely as demarcation or defensive structures, it would necessitate empirical evidence that the historical water table was situated at higher elevations than at present. Absent such evidence, these structures would perpetually remain inundated. (Post Glacial Flooding Hypothesis)
The computational models embedded within the Post-Glacial Flooding Hypothesis yielded an astounding result, revealing a minimum discharge of 8.42 quadrillion metric tonnes of water onto the United Kingdom at the conclusion of the last ice age. This volume is akin to the hypothetical scenario of 98,425.2 inches of precipitation evenly distributed over every square inch of the British landmass, or the conceptualisation of an unbroken, incremental descent of one inch of rainfall each day for 270 consecutive years. (Post Glacial Flooding Hypothesis)
Within the annals of British meteorological history, the most notable inundation is encapsulated in the deluge of 1947. This catastrophic event unfolded due to a trifling six inches of rainfall, equivalent to 149 millimetres, combined with the progressive thaw of up to 12 inches of snow, culminating in an absolute liquid accumulation not exceeding 15 inches over three months. This inundation, characterized by its expansive geographical impact, affected nearly all major river systems in England’s South, Midlands, and Northeast regions, earning distinction for its origins, extensive reach, and prolonged duration.
Over a fortnight, this calamity extended its grasp to encompass thirty of the forty English counties, submerging approximately 700,000 acres of land. Consequently, tens of thousands of individuals were temporarily displaced from their homes, and thousands of acres of crops suffered irreparable losses. It is noteworthy that this event, despite its monumental scale, represents only a fraction—precisely, a mere 15 inches—of the estimated equivalent of 98,425 inches of water that the British landscape bore witness to following the conclusion of the last Ice Age. The enduring ramifications of this ancient deluge persistently shape the contemporary geographical and hydrological landscape. (Post Glacial Flooding Hypothesis)
Raised Water Table
According to William Donn (Donn et al., 1962). The Fennoscandian and Great Britain ice sheet covered 4.7 106 km2, which is equivalent to:
• 8.42 106 Gigatonnes of water / 4.7 106 km2, which gives us 1.79 Gt per km2
• 1.79 Gt of water at a penetration rate of 43%, give us 0.77 Gt of water per km2
• 0.77 Gigatonnes of water by UK landmass 242,495 km² gives us 186,804 Gt of groundwater
The gradual release of this groundwater is anticipated to occur within a range of 1 to 12 millimetres per annum and conceivably originates from depths of up to 75 kilometres beneath the Earth’s surface. Consequently, to effectuate groundwater drainage from a depth of 75 kilometres at an average annual rate of 6 millimetres, a protracted temporal span of 12,500 years is deemed necessary. This extended duration significantly exceeds the previously held belief, which posited a mere 1,200 years for the dissipation of surface water from the final stages of meltwater.
This protracted release of groundwater from subterranean aquifers is a salient factor sustaining the flow of rivers, such as the Thames, even during extended periods of arid conditions. The continuous groundwater leakage into these river systems is a testament to the intricate hydrological dynamics. Notably, this groundwater flux is believed to have reached its zenith at the onset of the Mesolithic era, shortly after the momentous meltwater deluge that marked the conclusion of the last Ice Age. (Post Glacial Flooding Hypothesis)
Sea-Level Changes
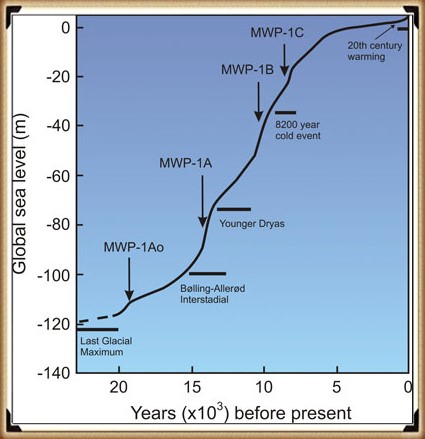
Should this model prove accurate, its veracity can be corroborated by examining additional empirical evidence that explicitly affects sea level fluctuations over the past 12,500 years. This approach seeks to determine whether the rate of sea-level change has remained consistent over this extended time frame.
Traditionally, discussions in geology and palaeoclimatology concerning the end of the last Ice Age often centre on the ‘Meltwater Pulse.’ This event represents a swift and substantial elevation in sea levels, encompassing a rise of 20 meters, which transpired between 13,500 and 14,700 years before the present day, unfolding throughout approximately 400 to 500 years. While this ‘pulse’ undoubtedly constitutes a remarkable and dramatic rise in sea level, it is crucial to acknowledge that this particular episode constitutes only a fraction, specifically 16%, of the total sea level increase observed since the termination of the last Ice Age. (Post Glacial Flooding Hypothesis)
Figure 58- Historical Sea Level Change – Post Glacial Flooding
(Post Glacial Flooding Hypothesis)
In scrutinising the full range of sea-level variations over this protracted interval, one can glean insights into broader patterns of change and continuity, thereby contributing to the validation or refinement of the model mentioned above, which posits groundwater release over 12,500 years as a driving force behind hydrological and geological phenomena.
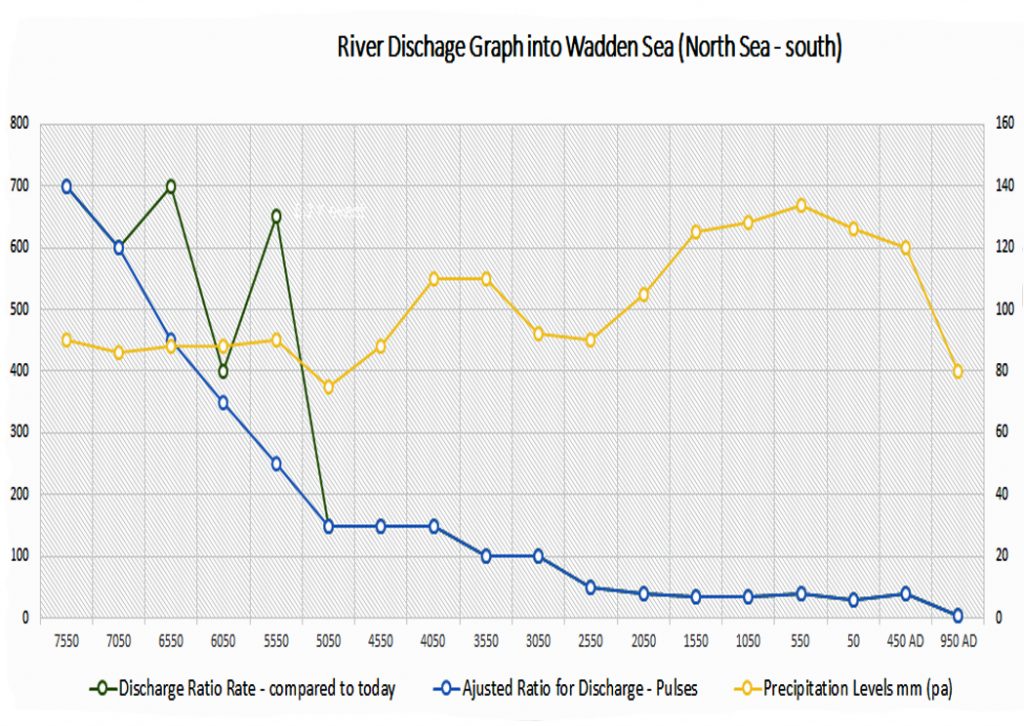
We have constructed a model of sea-level changes by combining both the Wadden Sea model (Vermeersen et al., 2018) and the NASA sea-level model to calculate the rise in sea level in the North Sea area and the discharge levels from the Rivers that flow into the area over the last 10,000 years since the Last Ice Age (Fig. 59). (Post Glacial Flooding Hypothesis)
Landscape Transformation
A comprehensive analysis of Holocene data, considering factors such as substantial meltwater inflows, periodic ice-melt pulses, elevated water tables, and heightened precipitation, collectively points to increased hydrological activity and amplified water volumes during this epoch. This convergence of factors underscores the existence and sustainability of significant river systems in the Holocene. (Post Glacial Flooding Hypothesis)
Throughout this epoch, climate fluctuations led to the release of substantial meltwater as ice sheets and glaciers retreated, while periodic pulses of ice melt and elevated water tables further contributed to the formation and expansion of rivers. Augmented precipitation levels also bolstered the overall volume of water flowing through these river networks.
These Holocene rivers have served as vital agents of environmental change, influencing ecosystems, facilitating transportation, and shaping the distribution of life forms. The synthesis of this empirical evidence sheds light on the intricate relationship between climate dynamics and the development of extensive river systems during the Holocene, deepening our comprehension of this geological epoch’s hydrological evolution. (Post Glacial Flooding Hypothesis)
Figure 59, in the context of the provided table, offers an insightful depiction of the Wadden Sea region, situated within the North Sea, and its relationship to rising sea levels in relation to river discharge and river size.
The blue line labelled ‘discharge’ on the graph represents river discharge volume, thereby reflecting river size and elevation over the past ten thousand years. In this visualisation, the chart uses the discharge rate observed in 950 AD as the baseline, setting it to 1 unit. This approach enables a straightforward visual comparison with previous years by presenting the data as a size ratio.
The graphical representation thus illustrates that as far back as 8050 BCE, the rivers in this region were markedly more prominent, measuring approximately 140 times their contemporary size. This striking contrast in river dimensions over time underscores the profound changes in the Wadden Sea area and highlights the significance of historical river dynamics in shaping the region’s hydrological and geological evolution.
Figure 59 – Discharges Rates from the Wadden Sea – the yellow graph is precipitation and the green is the water pulses above the estimated steady blue discharge from the water table
(Post Glacial Flooding Hypothesis)
Other Post-Glacial Flooding around the world
Indeed, the post-Last Glacial Maximum (LGM) flooding was not limited to the British Isles alone. The comprehensive examination presented in the trilogy’s first volume, “The Post-Glacial Hypothesis,” has illuminated the widespread nature of these inundations, extending their impact to various regions, including North America.
The empirical data showcased the substantial surge in river discharge following the LGM, with notable examples such as the Mississippi River experiencing an astounding increase from its contemporary rate of 16,790 cubic meters per second (m³/s) to a staggering 160,000 m³/s. This monumental rise, an 853% increase, clearly signifies a significant increase in river height and discharge.
Similar observations of heightened river levels and discharge rates are also evident in regions such as Germany. The cascading consequences of these amplified discharge rates and elevated water levels have historically manifested, notably in the Black Sea. Situated approximately 2000 miles from the glacial ice sheet, the Black Sea witnessed the impact of rising sea levels, culminating in a historic flood.
This inundation event, in which freshwater from the Black Sea overflowed into the Mediterranean, led to the transformation of the Black Sea from a freshwater body into a saltwater lake. These instances collectively underscore the far-reaching and interconnected implications of post-LGM flooding, which extended well beyond the immediate vicinity of the glacial ice sheets and left a profound imprint on global hydrological and geological dynamics. (Post Glacial Flooding Hypothesis)
Britain’s Post-Glacial Flooding
Lewin and Macklin’s 2003 study is a pivotal contribution to our understanding of Holocene river dynamics. They identified a remarkable 147 channel floods that occurred during the Holocene, primarily attributable to a rising water table, a phenomenon that persisted until approximately 1000 years ago. Their work also highlighted the expected trends in sedimentation, theoretically yielding straight-line cumulative plots and uniform probability levels, with deviations indicating episodic or fluctuating trends in sediment activity.
However, the uneven preservation of alluvial units, as noted in Lewin and Macklin’s study, complicates the interpretation of the Holocene sedimentary record. This variance in preservation primarily affects later Holocene sediments and can result in the spikiness observed in the illustrated plots. Additionally, radiocarbon-dated materials can exhibit clustering due to variability in 14C production, which may or may not align with flood events. Thus, the complexity of the data presented underscores the need for a nuanced interpretation of episodic alluviation.
Subsequently, the study investigated the Thames River as a case study to elucidate how Britain’s most prominent river was impacted during the Mesolithic and Neolithic periods. A discharge model was constructed based on sedimentary data from the British Geological Society’s superficial maps and borehole core samples. The findings of this study revealed a striking increase in the current average discharge of the Thames River, indicating a 3723% increase within the watershed. This, in turn, allowed an estimate that, at its peak, the Thames River discharged approximately 2450 m³/s (0.0025 gigatonnes per second or 1314 gigatonnes per annum), a rate akin to that of some smaller rivers in North America during the same period.
This raises a pertinent question about the Thames River’s historical behaviour and potential relationship with the meltwater from the last ice age. To delve deeper into this inquiry, a meticulous excavation at the edge of the BGS superficial Alluvium flood map was undertaken to provide tangible evidence regarding the nature of the sediments observed in the geological record. The cross-section profile of the Thames revealed an expansion of the Holocene superficial sediment area by at least one mile, terminating at Boreholes TQ47NE344 and TQ58NW141. These boreholes demonstrated significant sediment thickness before reaching underlying geological strata.
The implications of these findings are profound, as they substantially augment the Thames Flood Model, projecting a discharge of 12,250 m³/s. This revised estimate aligns more closely with the North American Discharge Model, prompting a reevaluation of the Thames River’s historical behaviour and the influence of post-glacial meltwater dynamics on its hydrological profile. (Post Glacial Flooding Hypothesis)
Peat (Ultimate Evidence of Holocene Flooding).
The formation of bogs in the UK began around 10,000 years ago, coinciding with the end of the last ice age, when glaciers withdrew northwards, leaving behind terrain characterised by shallow meltwater lakes and waterlogged depressions. A substantial portion of the UK’s land area, approximately 2.3 million hectares or 9.5%, is now covered by bog peatlands.
Peat, commonly known as turf, is an accumulation of partially decomposed organic matter, with Sphagnum moss being a predominant contributor. Soils primarily composed of peat are referred to as histosols. Peat formation occurs in wetland environments where atmospheric oxygen supply is impeded by flooding, resulting in reduced decomposition rates.
While bogs represent a prominent source of peat, other less common wetland types, including fens, pocosins, and peat swamp forests, also contribute to peat deposition. Various terms describe lands dominated by peat, such as moors, muskeg, or mires. These landscapes support specific plant species, notably Sphagnum moss, Ericaceous shrubs, and sedges. Since organic matter accumulates over millennia, peat deposits offer valuable records of past vegetation and climates preserved in plant remains, particularly pollen. Consequently, they facilitate the reconstruction of historical environments and the analysis of changes in land use.
Peat develops where plant material, typically in marshy areas, undergoes incomplete decay due to acidic and anaerobic (oxygen-deprived) conditions. It primarily consists of organic remains from marshland vegetation, including trees, grasses, fungi, insects, and animal remains. Under specific requirements, the decomposition of these materials is constrained, making peat layers valuable for archaeological investigations.
The growth of peat layers and the extent of decomposition depend primarily on factors such as composition and waterlogging. Peat formed in very wet conditions accumulates more rapidly and experiences less decomposition than in drier environments, making it a valuable indicator of climatic change for climatologists.
Unlike subsoils like head and alluvium, peat bogs can often be precisely carbon-dated, a crucial aspect of understanding post-glacial flooding. The flooded regions of Britain are prime candidates for the development of marshes and swamps, contributing to the formation of contemporary peat subsoils.
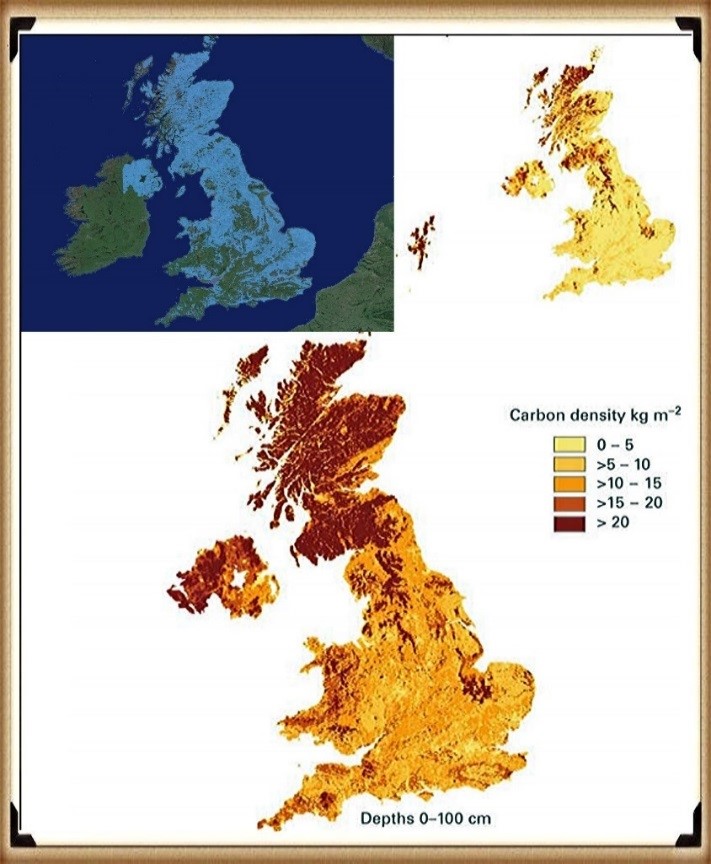
Peat not only aids in identifying Holocene wet areas and elevated river levels but also helps determine river size and flow during the Mesolithic and Neolithic periods. Blanket bog, which occupies approximately 6% of the UK’s current land area, has historically been attributed to Neolithic forest clearance. However, recent predictive models, such as PeatStash, which use summer temperature and moisture index thresholds, provide accurate predictions of the current distribution of blanket bog in Great Britain. Additionally, these models explain the global distribution of blanket bog ecosystems. (Post Glacial Flooding Hypothesis)
Figure 60- Peat growth – reflecting the post-glacial flooding of Britain (blue map)
(Post Glacial Flooding Hypothesis)
The discovery made by Gallego-Sala and colleagues in 2016 suggests that climate factors predominantly control the distribution of blanket bogs in the UK and globally rather than being primarily influenced by historical land-use practices. (Post Glacial Flooding Hypothesis)
Interestingly, the maximum rate of peat production doesn’t coincide with the immediate post-meltwater-flooding period following the Last Glacial Maximum. If one were to anticipate a direct correlation, the peak peat growth would logically occur in the early Holocene period, shortly after the rapid recession of floodwaters. However, as exemplified in Scotland (Figure 61), empirical observations reveal a 4000 to 6000-year lag between the post-glacial period and the peak peat growth.
This delay can be attributed to the hydrological dynamics of the early Holocene, characterised by the highest and most rapid river flows. During this phase, the environmental conditions were unfavourable for the establishment and growth of marshes and bogs. It is only as the rivers gradually receded that suitable conditions for peat formation began to emerge. This process of peat formation was occasionally disrupted by flooding events triggered by precipitation towards the end of the Neolithic period, coinciding with the advent of farming practices.
In essence, this temporal discrepancy underscores the intricate relationship between river behaviour, climate, and the development of peatlands during the Holocene. It challenges the assumption that post-glacial flooding directly leads to peat growth and emphasises the role of evolving hydrological conditions in shaping the timing and extent of peatland formation. (Post Glacial Flooding Hypothesis)
This is a new interactive 3D Old Sarum LiDAR Map survey with full mouse control of view angle and zoom features.
We are able to offer LiDAR maps of any area of the UK for just £19.95 per data tile. These 25 sq. km tiles (as used on this website) are fully formatted and ready to publish or view using the FREE 3D viewing software provided worth over £100. All we need is the coordinates of the area you require and we will send you the Data tile that covers that area – for more information, click HERE or on the LiDAR picture above.
Use mouse and Left hand click to PAN – Mouse and RIGHT hand Click to move UP and Down – and Wheel to zoom in the 3D Image BELOW! Its 125Mb file so may take a minute to download…. please be patient!
We have given the most advanced AI intelligence engine a chance to read the above book and condense it from 70K to just 5k words to simplify it for the common reader – what do you think?
1. Ten thousand year old boats found on Britain’s hillsides – 7,000 years before they were invented – (13 things that don’t make sense book).
ten thousand year old boat found on Britain’s hillsides – AI (GPT4)View
A small body of determined spirits fired by an unquenchable faith in their mission can alter the course of history.– Mahatma Gandhi
Ancient Boats in Britain
The discovery of ten thousand-year-old boats in Britain challenges current assumptions about the history of boat construction. Furthermore, radiocarbon dating evidence suggests that sea travel may have been invented much earlier than previously thought. The article discusses coracles, a type of boat made of willow rods and animal skin, in Ireland and Wales. It also questions the feasibility of early mariners using such flimsy crafts to cross the Irish Sea and explores the motivations behind early sea exploration.
Long Barrows
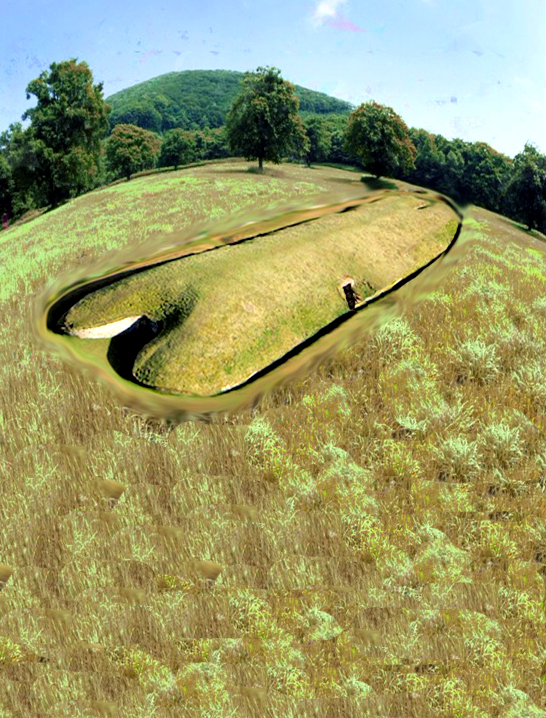
Long Barrows are unique and the oldest monuments in Northern Europe. They are boat-shaped mounds and are only found in the region. The bones inside suggest a marine society that lived and traded upon water existed during that time. Long Barrows were ancient boats with sails, and advanced designs built parallel to significant rivers. They were visible for miles due to their size and construction materials and were covered in bright white chalk. These were created by a marine civilisation, evidenced by myths, wooden planking, and wall paintings.
Stonehenge
Stonehenge was built using Bluestones from the Preseli Mountains in Wales, transported by boat, indicating a connection between the monument and a water-based funeral ritual. Excarnation ceremonies were held within Stonehenge’s crescent-shaped stone holes before the bones were taken by boat to Long Barrows for final burial.
Submerged Mesolithic Sites
Submerged Mesolithic sites near Yarmouth in the Isle of Wight suggest that our ancestors constructed boats there. The site is 5,000 years older than the current construction date of Stonehenge. Archaeological discoveries in Wales suggest that the Welsh may have built double-hulled catamarans 4,000 years before the Greeks and may have used them to transport Bluestones from Wales to Stonehenge. The true history of Britain is still being discovered.
2. Gigantic Canals – that are technically superior to even Victorian engineering.
prehistoric Canals – AI (GPT4)View
A scientific truth does not triumph by convincing its opponents and making them see the light, but rather because its opponents eventually die and a new generation grows up that is familiar with it. – Max Planck
Dykes
Dykes were initially built in The Netherlands in the 12th century to prevent flooding, but similar earthworks in Britain have no clear purpose unless considering their water connection. Offa’s Dyke, attributed to a Saxon King, could have been constructed by the Romans.
Offa’s Dyke and Wansdyke Earthworks
The origins of Wansdyke are uncertain, but archaeological data suggests it was built in the 5th or 6th century as a defence against West Saxons. Scholars have questioned descriptions of its size and attributed purpose. It was likely a political boundary marker facing post-Roman Britons. The
Wansdyke defence/boundary has a gap in the middle with no explanation. Excavations suggest the eastern half of the dyke passed through a pasture and nearby woodland. Empirical evidence indicates dykes date before the
Roman invasion.
Wansdyke Earthwork as Trading Network
Wansdyke, an ancient ditch in England, has puzzled archaeologists as it doesn’t seem to be a defensive structure. It is a prehistoric waterway, close to a possible the Kennet and Avon Canal. The ditch’s construction suggests it was not a defensive feature. The ancient canal ditch discovered in Wansdyke earthwork is twice as big as the Victorian canal and is believed to have been built over 6,000 years ago, indicating a more excellent knowledge of hydrology and engineering. It was likely made for boat travel for trade and relied on natural groundwater table levels. The Wansdyke earthwork was not built as a defensive boundary but as a complex trading network, with a canal connecting two ends and evidence of prehistoric groundwater rivers.
3. Roman ports miles away from the coast – when sea levels are apparently rising.
Roman ports miles form the water – AI (GPT4)View
The difference between science and the fuzzy subjects is that science requires reasoning, while those other subjects merely require scholarship– Robert A Heinlein
Roman Ports and Sea Level Changes
Some Roman ports are located far from the coast, possibly due to tidal havens. The history of Brading, a natural harbour on the Isle of Wight, includes evidence of settlement by Mesolithic, Neolithic, Bronze, and Iron Age peoples and Roman influence. The harbour silted up, and the town changed due to land reclamation. Lewes, a town in England, was once a major port due to its sheltered location but is now inland due to rising sea levels. It has a rich history, including prehistoric dwellers,
Roman settlements and a Saxon castle. The River Ouse, which runs through the town, was once a tidal inlet, but drainage issues caused flooding and the conversion of meadowland into a permanent fishery. The article discusses the history of the Ouse Valley, including draining the Levels and creating a canal to access the harbour at Newhaven. The article also questions whether the Lewes harbour was fed by freshwater rather than seawater in the past.
Ephesus
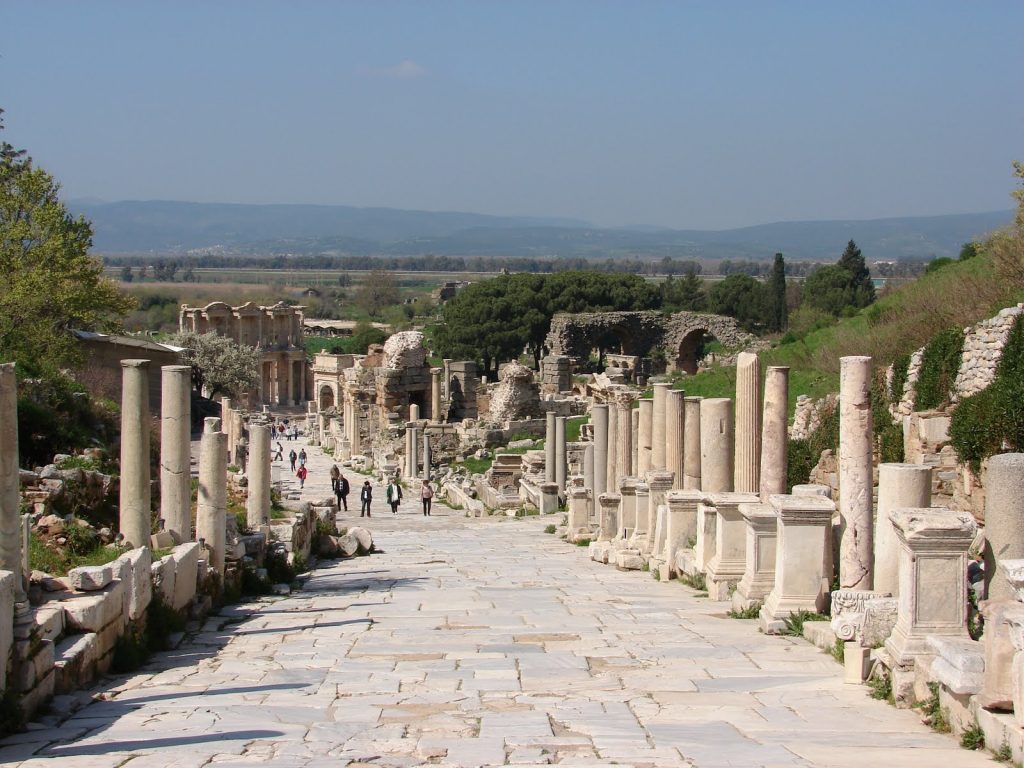
Ephesus in Turkey was once a major Roman city with a famous temple, but its harbour is far inland due to a slow siltation process. However, this phenomenon is not unique to Ephesus, as other ports in freshwater locations experience similar changes.
Mesolithic Period
The sea level was much lower during the Mesolithic period, allowing ancient harbours to exist farther from the shore. Post-glacial flooding caused by the last Ice Age affected river levels and freshwater shorelines, leading to the development of trading sites and ports. Groundwater reduction due to agriculture and drainage has contributed to rising sea levels, while population growth has led to groundwater depletion and the loss of rivers and streams.
4. Raised Beaches – that have never met the sea.
Science is a way of thinking much more than a body of knowledge. – Carl Sagan
Raised Beaches and Isostasy
Raised beaches, marine terraces, and perched coastlines are emergent coastal landforms formed by rising sea levels. Theories explain their presence in hill sediments, with the best-represented terrace worldwide being correlated to the last interglacial maximum (MISS 5e). Geologists have come up with a complex explanation for raised beaches, but a more straightforward reason is that they form when sea levels fall, leaving beaches exposed and stranded above the new sea level. The process of post-glacial rebound, or isostasy, has caused Scottish raised beaches to be 60m lower than previously thought, and this rebound will continue for another 10,000 years. Glacial isostatic adjustment involves more than just upward rebound, including downward land movement, horizontal crustal motion, sea level changes, gravity field alterations, induced earthquakes, and rotational changes.
Tsunami Theory
Only one beach at a certain level contradicts the hypothesis of shoreline washing. The Tsunami Theory proposes that a tsunami created the beach as alternative explanation. Tsunamis caused by events like the Storegga slide has occurred in Scotland in the past. Doggerland, a low-lying land bridge connecting Denmark and The Netherlands, was considered a prime hunting and fishing ground until a tsunami hit. However, geologists now believe that deposits found 20m above sea level cannot be attributed to the tsunami but result from post-glacial flooding.
Brighton Raised Beach
The Brighton Raised Beach provides a record of changing environments over millennia. It is thought to date back 250,000 years, but modern geologists struggle to understand what happened that long ago. The discovery of ice age archaeology in the cliffs at Brighton Marina has confused the dating of the raised beaches. The article discusses the scientific research conducted by UCL’s Archaeological South East division on the Black Rock area, which dates the Brighton-Norton formation to around 200,000 years BP and suggests Neanderthals and cold-climate mammals occupied it. The article also raises questions about peculiar chalk formations and deposits of sand, silt, and pebbles in Sussex. Post-glacial flooding affected Britain, creating aquifers and rising beaches, including the Cliffs of Brighton.
5. Giant skeletons – found by French archaeologists now dismissed by today’s scientists.
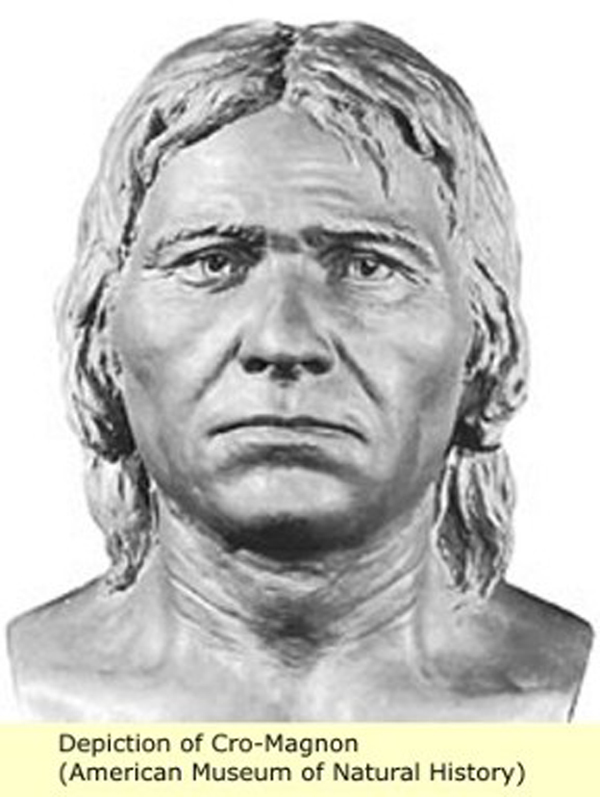
Cro-Magnon – AI (GPT4)View
Your theory is crazy, but it’s not crazy enough to be true.– Niels Bohr
Giant Skeletons
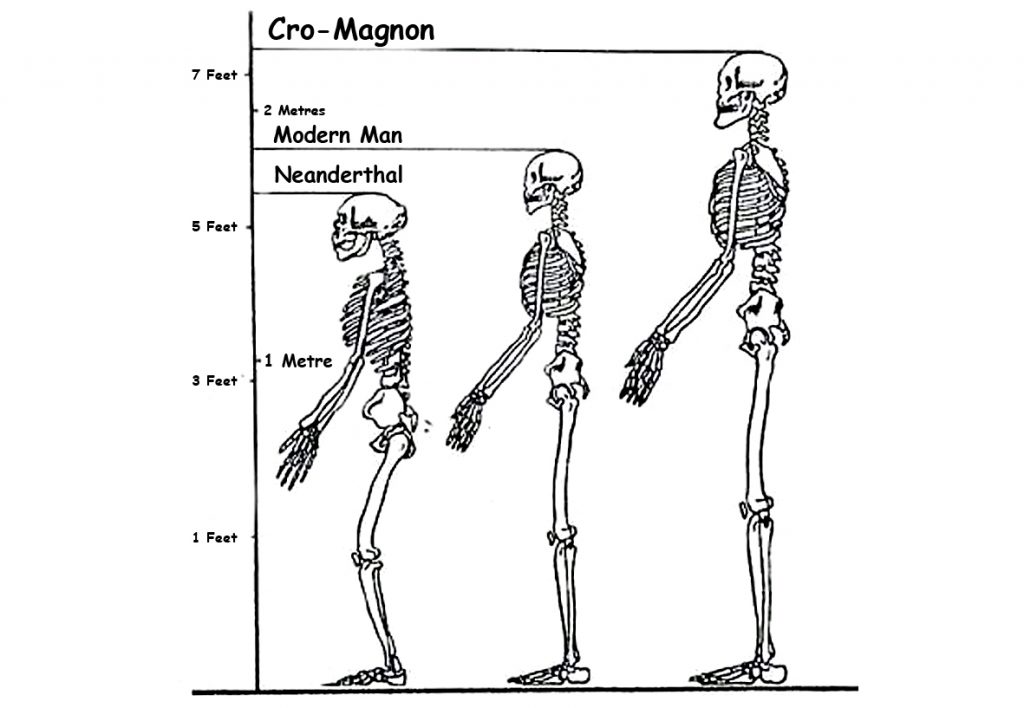
The discovery of giant skeletons was believed in the Victorian era but dismissed by modern historians. Cro-Magnon is the name given to the first early modern humans of the European Upper Paleolithic, who had brains 15% larger than their discoverers and lived in complex societies. They were robustly built and lived in a rock shelter 28,000 years ago, where three prehistoric skeletons were found showing signs of illness and injury and had cared for each other. They were not significantly different from modern humans, and the term ‘cavemen’ does not help us understand their complex societies.
Misinterpretations of Prehistoric Remains
DNA mapping of a 7,000-year-old skeleton in Spain revealed blue eyes and disease-resistance genes in ancient hunter-gatherers. Blue eyes originated
Ten thousand years ago, in the region near the Black Sea, due to a genetic mutation.
A study found that all blue-eyed people share a single ancestor. Prehistoric Spaniards had genes linked to immunity and musculoskeletal ailments. A genetic mutation affecting the OCA2 gene creates a “switch” that limits the production of melanin, causing the brown colour of the eye to be diluted to blue. All blue-eyed individuals are linked to the same ancestor, and the mutation has no adverse effect on the human body. Blue eyes are familiar in Germany, the Netherlands, Scandinavia, and the Baltic States. Blue-eye colour shows a mutational impact on Homo sapiens.
Neanderthals
Neanderthals are an extinct species of human closely related to modern humans, with remains found in Europe and Central Asia. Their cranial capacity and physical features differ from modern humans, and genetic evidence suggests interbreeding between Neanderthals and modern humans. Neanderthal genes makeup 1-4% of modern humans’ genome and may make up around 20% of non-African human genes. Cro-Magnons may have been crossbreeds with Neanderthals, and a cave discovery in Romania gives an approximate date of 35,000 years ago. Cro-Magnon’s physical characteristics include a large brain, a long head, and tall stature.
Crossbreeding between Neanderthals & Cro-Magnons
Cro-Magnon man, humanoids genetically mutated to create Haplogroups
M173 and M343, about 50,000 years ago, had notable differences between the Eastern and Western types, including physical appearance, toolkits, and artistic abilities. Crossbreeding between migrating Sapiens from Africa and Neanderthals took place on many occasions and locations before their travels into Europe from Siberia. The context discusses the prevalence of infanticide in some societies, the possible reasons for the extinction of
Neanderthals, and the positive attributes of crossbreeding between Neanderthals and Cro-Magnons. Neanderthals had well-developed temporal lobes responsible for emotions, love, and religious experiences.
They lacked complex language but communicated on a fundamental level. They buried their dead with flowers, while their offspring were intellectual giants with impressive skills.
Early Human Art & Creativity
Early humans used fire and tools to create pottery, bread, and other art forms for ritual, spiritual, aesthetic, and practical purposes, revealing a direct link between art, structure, creativity, and society. They also created the first musical instruments, weaved baskets, and sewed clothes. Cro-Magnons were skilled artists who created elaborate paintings and designs on their clothes, tools, and weapons. They utilised the natural contours of cave walls and created 3-dimensional effects, including realistic and life-like movements of animals. They used natural earth pigments to create multiple hues and colours and employed various lubricants to mix the paints. Their paintings depicted different everyday life scenes, including the hunting and mating of animals.
6. Quantum of Solstice – Pythagorean maths put to use four thousand years before he was born
Stonehenge plan reconstruction – AI (GPT4)View
If an elderly but distinguished scientist says that something is possible, he is almost certainly right, but if he says that it is impossible, he is very probably wrong. – Arthur C. Clarke
Cro-Magnon Artists and Mathematics
Cro-Magnon artists demonstrated an artistic mastery that rivals modern masters like Picasso, utilising abstract impressionism, geometric forms, and concentric shapes. Additionally, advanced mathematics and trigonometry were employed in designing Stonehenge, a construction that dates back
10,000 years. Stonehenge’s original ditch, built in 8,500 BCE, was used with
Bluestones to bathe infections, while the diameter of the moat was precisely 360 ft, and it served as a very accurate moon and eclipse calendar. The ancient calendars were 12 x 30 = 360 days long, and the monument also shows an understanding of mathematics with the discovery of the number 3.14, PI. The context discusses using a symbol for Pi and the importance of the number 360 for circles. It also explores the construction and significance of Stonehenge, including its connection to a 360-day lunar calendar and the alignment of its entrance causeway with the Summer
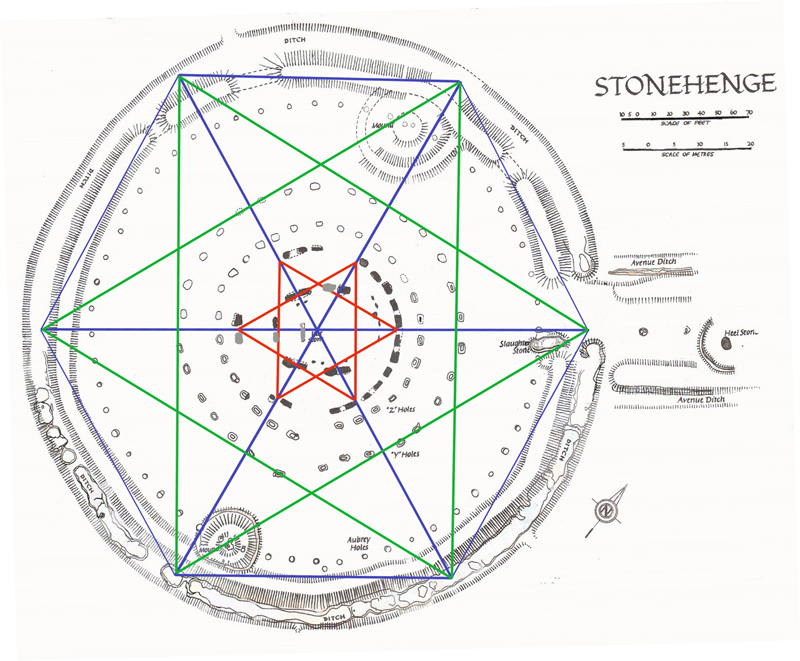
Solstice. Stonehenge, built around Doggerland’s demise in 4,200 BCE, may have been constructed with a mandala symbol, satkona yantra, representing the balance between Man and God. The monument was also built using a hexagram design and was later adapted by the Druids.
Foot as a Unit of Measurement
The history of the foot as a unit of measurement is explored, with its origin believed to be from the physical attributes of early humans. The size varied among different countries, and it is proposed that the Cro-Magnon man may have been the source of the oldest measurement scale. Neanderthals existed before Homo Sapiens and were more robust and more intelligent. The chance meeting of the two species led to the creation of the first Cro-Magnon, who were vastly intelligent and built boats to sail to Europe. They settled, communicated, and made the first monuments of this world, including Atlantis. The lost city of Atlantis flooded during the last Ice Age, and remnants of this civilisation integrated with local Homo Sapiens to create today’s society.
7. Recent Landscape Flooding & Storms – the secret our ancestors knew about Britain’s weather
Tornado Extreme Weather – AI (GPT4)View
UK Media’s Reporting
Historical measurements such as the foot and inch have confused current historians. UK media reporting extreme weather often refers to false “record-busting” events due to limited meteorological records. The UK’s wettest Summer in 2007 does not prove man-made climate change; rainfall has fluctuated for centuries. Severe weather events, like the “Grote Mandrenke” in 1362, have occurred throughout history.
Geological Evidence
The landscape of the UK bears evidence of more severe weather conditions during the Mesolithic period. The context discusses how ancient rivers created flood plains that we see today, including in areas where monuments like Stonehenge were built. Geologists study the dry river valleys left behind and theorise how and when they were formed, which has implications for archaeologists studying these locations. For example, geological evidence suggests massive flooding occurred at the end of the last ice age, cutting dry river valleys in the South Downs. Evidence of flooding can also be seen in the construction of ancient monuments. However, the dating of prehistoric riverbeds and dry river valleys is debated.
Magnetometer Surveys
Magnetometer surveys reveal a ditch under the surface on the eastern side of Durrington Walls that don’t match the original specifications. Archaeologists believe it was a settlement, but the site’s terrain suggests it may have been a natural harbour with a receding shoreline over 5,000 years. Woodhenge has two entrances that lead to Durrington Walls camp and its ancient shoreline. Excavations in Durrington Walls revealed post holes for mooring boats, indicating a landing area for visitors to Stonehenge and Old
Sarum.
Avebury Monument
Avebury monument, built over centuries, sits on a low chalk ridge with a large freshwater river running to the West. Historians remain uncertain about the site’s construction and working hours. The article discusses the construction of a chalk bank near the ditch and offers possible reasons for its creation.
Souterrains
It also provides information on “souterrains” and their associations with the Atlantic Iron Age. Souterrains were underground galleries associated with settlements, possibly used as food stores or hiding places during strife. They do not have a clear purpose and are categorised differently in different locations, making it difficult to understand why they were built. The article discusses the structure and purpose of underground subterranean tunnels, called fogous, which are found in Cornwall, Wales, Scotland, and Ireland. The author questions their usage and reclassification by archaeologists and speculates on their historical significance.
Severe Storms
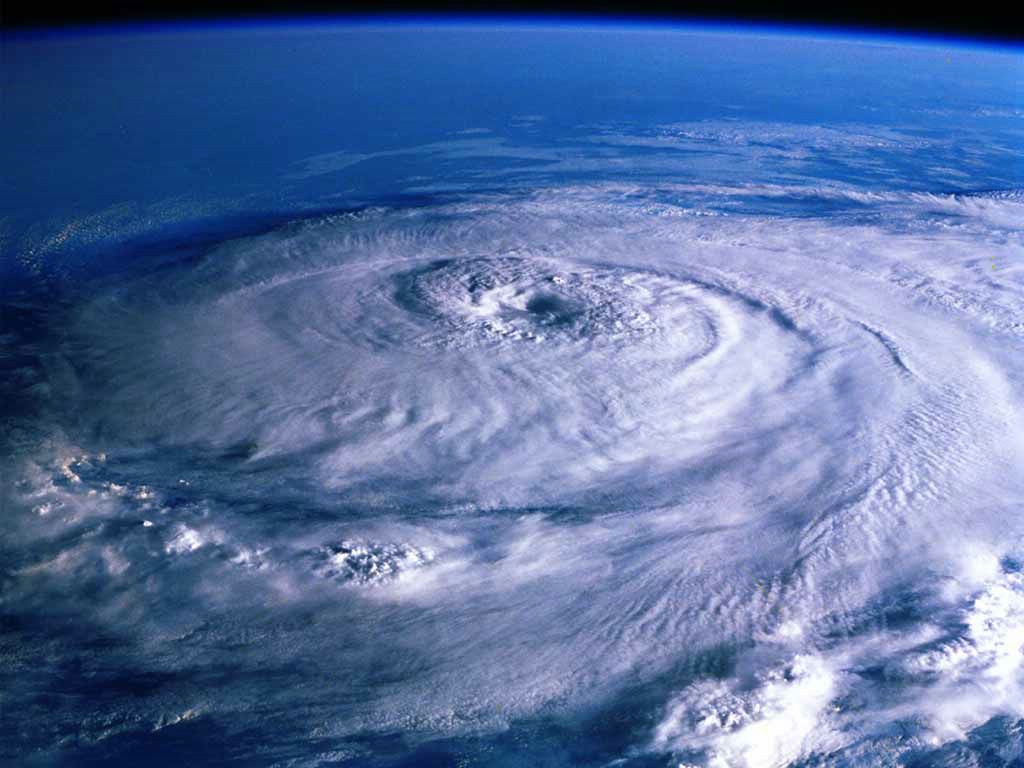
The context discusses the construction of subterranean shelters in response to intense storms and tornadoes, with evidence of such events occurring in prehistoric Britain and historical records of a severe tornado in
1091 in London.
8. Mythological Dragons – a non-existent animal that is shared by the world.
Look deep into nature and then you will understand everything better. – Albert Einstein
Mythological Dragons
The context also delves into the topic of mythological dragons and their presence in various cultures across the globe. Dragons are mythical beasts on every continent and are depicted differently in multiple cultures. They have spiritual significance and often involve being killed by a hero. The article explores the origins and descriptions of dragons across continents, questioning if they are real or mythological creatures. It includes information on their historical and modern depictions and their cultural significance.
Dragons appear in various cultures and religions, like Zmey Gorynych in Russia, Vritra in India, and Long in China. They symbolise different things and have multiple characteristics. Diverse cultures worldwide have myths and legends about dragons that symbolise power, prosperity, and nature, often associated with water or wind deities. Dragons are depicted as winged serpents with different numbers of claws and feathers, and are considered the most powerful beings, often deified and celebrated with sacrifices and festivals.
Feathered Serpent Deity
Quetzalcoatl was one of the most significant gods within the Aztec pantheon, with origins traced back to the first century BCE/CE in
Teotihuacan. Feathered serpent iconography was prominent in Maya and Aztec cultures, with the cult of the feathered serpent spreading to various religious and political centres in central Mexico.
African Dragons
African dragons have two or four legs, notably larger than dragons from other continents. Unfortunately, no remains exist, leading theories to suggest that dragons may be based on natural phenomena like tornadoes. Tornadoes are visible funnels of air that touch the ground and can occur on any continent but mainly occur in the United States. Other natural phenomena resembling tornadoes include waterspouts, dust devils, and fire whirls. The Great Kanto Earthquake displayed a dangerous phenomenon known as a “dragon twist” tornado of fire which caused many deaths.
9. On Sunken land of the North Sea – was this the world’s oldest and greatest civilisation?
“The sea, once it casts its spell, holds one in its net of wonder forever”. – Jacques Yves Cousteau
Doggerland and Atlantis
Doggerland, a lost continent in the North Sea, is revealing a glimpse into prehistoric habitats and climate through archaeological finds. Plato’s account of Atlantis is debated due to its potential connection to the flooded land of Doggerland. The location and size of Atlantis, as described by Plato, are still discussed concerning the “pillars of Hercules”, suggesting it was in the Atlantic. The search for Atlantis has failed due to the lack of evidence for a sunken landmass. A new theory suggests that Atlantis was the North
European Peninsula (NEP), which connected to islands such as Iceland and
Greenland. This could account for ancient skeletons in North America with European features and stone tool kits.
Plato’s Account of Atlantis
Plato’s account of a civilisation known as Atlantis in the North, home to mountains, abundant flora and fauna, including elephants and meadows, suggests that this lost civilisation could have been Britain. Stonehenge was built to commemorate a great flood, and the crescent shape and the altar stone have symbolic meanings related to death and rebirth. Laser technology has shown that the stone was carved with contours depicting the mythical land of Atlantis. The connection between
Stonehenge’s Slaughter Stone and Avenue may point to the location of Atlantis in Doggerland.
Time Frame of Plato’s Accounts
Plato’s accounts of Atlantis suggest two different times, confusing the original Atlanteans. Plato’s description of the Atlanteans in “Timaeus” means they were Nordic and had a written language. They established Greek and Egyptian civilisations 9,000 and 10,000 years ago, respectively. Atlantis sinking and the invasion of Greece and Egypt are separate events. The time frame is unclear, but geologists suggest it could be around 4,000 BCE.
Other Ancient Civilisations
The article discusses other ancient civilisations and myths, including Hyperborea. Some clues in ancient writings suggest these lands could have been located in what is now Britain. Hyperborea was a mythical land in the far North, described as a wondrous realm of eternal spring, inhabited by a blessed, long-lived race. Some believe it was the original ‘Garden of Eden’, the home of the original Man and the beginning of civilisation’s terrestrial and celestial existence. The memory or imagination of a Golden Age is significant in various ancient traditions and myths, primarily in cultures that cover the area from India to Northern Europe.
10. Alexander the Great sailed into India – where no rivers now exist.
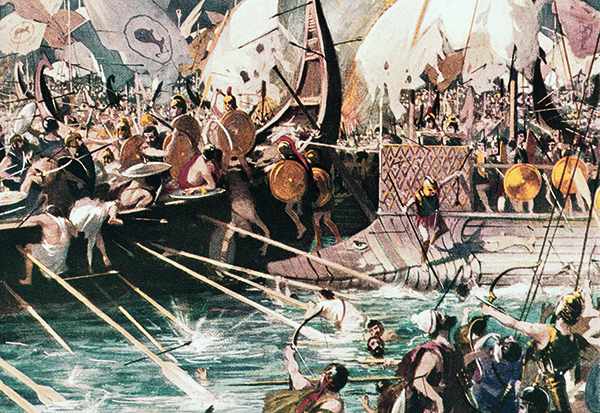
(Original Caption) Salamis, Greece: Greek Sea Battle. Battle of Salamis, 480 B. C. in which Greece gained an uncontested victory over the Persian fleet. Painting based on ancient sources.
I came, I saw, I conquered – Julius Caesar
Alexander The Great
The Indian campaign of Alexander the Great is discussed briefly. He faced war elephants in India and did not continue to conquer the headwaters of the Indus River. Instead, he founded Alexandria Nikaia and Alexandria Bucephalus, but his army mutinied at the Hyphasis River. In addition, the Macedonians were hesitant to cross the Ganges River, fearing the massive Indian troops with elephants. Traditionally, Alexander’s route was seen as a march over barren land, but a photojournalist suggests he used waterways that were larger in the past.
Alexander’s Lost World
David Adams embarks on a journey through Alexander’s Lost World to find the mysterious River Oxus and Alexander’s fabled Central Asian Capital, uncovering evidence of a different climate and early civilisations. He also discovers a surprising connection between Jason and the Argonauts. The Ice Age influenced the Greek and Roman periods, making the Oxus River deep and accessible. Alexander the Great used this route to access India, with conquered towns along the way named Alexandria. Alexander also founded the city of Alexandria at a strategic junction in Afghanistan, populated it with Macedonians and locals, and built forts in the area.
11. Antler Picks that built ancient monuments – although only one has been found at the largest stone circle in the world.
Antler picks – AI (GPT4)View
Science never solves problems without creating ten more – George Bernard Shaw
Use of Antler Picks
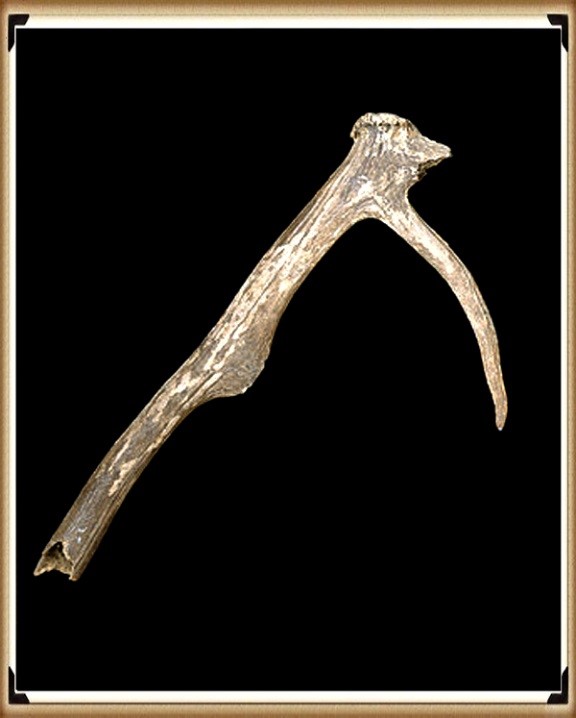
Antler picks were used by prehistoric people more as levers than pickaxes. There is confusion among archaeologists about the use of antler picks. Antler picks were believed to be the main tool used to construct prehistoric monuments in Britain. However, recent findings from Stonehenge suggest previous interpretations were oversimplified and varied forms of picks and modifications were used.
Antler Picks at Stonehenge
Antler picks were used to construct the Avebury monument, with the average size being 190mm and the largest being 410mm. Excavations suggest that red deer antlers were the primary digging tool, although evidence shows that only minimal antlers were found. This offers a challenge in collecting and selecting them and questions the current archaeological theories and dates EH supports regarding Stonehenge.
Carbonised Wood Findings
Recent findings on carbonised wood suggest the site is thousands of years older than previously thought. This could mean that metal axes may have been used much earlier than believed, potentially before the Mediterranean, challenging cultural immigration theories.
12. Columbus was the first Western Man to reach America – Yet bones and tools suggest that Europeans sail there ten thousand years earlier.
“We would like to live as we once lived, but history will not permit it”– John F. Kennedy
Contested First European to Reach America
The first European to reach America is contested. Inherited antigenic substances on the surface of red blood cells determine blood type. The two most important blood group systems are ABO and RhD. Maternal antibodies against fetal RBCs can cause erythroblastosis fetalis. However, the origin of A Rh neg blood groups in North America is a mystery.
Indigenous Peoples in the Americas
Indigenous peoples in the Americas have diverse cultural practices and languages, with some still living in relative isolation. The migration of human populations to the Americas and the origins of indigenous peoples are still debated. Sea levels were lower, allowing for easy passage across the
Atlantic to America. Reed boats were used for sea travel, as demonstrated by Thor Heyerdahl, using a Sunstone device for navigation.
Origin of Europeans in America
Who were the first Europeans to find America? The idea that Neanderthal morphed into Cro-Magnon and modern humans is flawed. Cro-Magnon man was different from other modern humans and likely originated from the West. They were skilled toolmakers, hunters, and artists known for their cave paintings. Cro-Magnons were virtually identical to modern humans but slightly more robust. They also had a high cranial capacity and were as tall as 6 feet. There are theories that they originated in Sub-Saharan Africa and spread to South America, where a Cro-Magnon skeleton was found. Neanderthal Man was likely the proto-European.
Archaeological Evidence for Human Migration
The Poverty Point culture of the eastern US worked with non-local raw materials and showed distinct material cultures with clear indications of European Cro-Magnon influence. Archaeological evidence suggests that humans may have arrived in the Southern Hemisphere at least 15,000 years ago, and there are indications of a human presence in North and South America earlier than previously thought.
Archaeological sites in South America, specifically the Säo Raimundo Nonato region, have revealed human occupation dating back at least 32,000 years, with numerous cave paintings and over 300 sites discovered. The traditional theory of North American human migration is no longer supported. Recent discoveries suggest that the Solutrean culture may have entered America from the Atlantic earlier than the Clovis culture, with artefacts found bridging the chronological gap. These discoveries challenge traditional theories about the first humans in North America. New archaeological findings, including the Gault site, suggest human populations have lived in the Americas for at least 40,000 years. Some ancient skulls found exhibit European-like features. The origin of these people remains debated.
Cro-Magnon People
The Cro-Magnon people were innovative hunters and inventors who created tools, marked time, practised elaborate death rituals and were the first to domesticate animals and leave extensive works of art, including cave paintings. Upper Paleolithic cave art and sudden advancements in human culture and technology challenge the understanding of evolution. The emergence of Cro-Magnon man suggests a “second biological event,” but the lack of incremental developments in the archaeological record complicates this theory. The emergence of culture in Upper Paleolithic times was thought to be due to a neurological event, but this theory is unsupported. Neanderthals did not have art or technology and did not trade goods, while Cro-Magnon man did, likely using boats and ships. Their legs were also longer than expected, according to evolutionary biology.
Influence of Habitat Temperature on Body Extremities in Mammals
Cro-Magnons seem to contradict this rule, with their appearance possibly related to megaliths in Europe and their DNA growth suggesting potential issues with archaeological dating.
Crossing Oceans During the Ice Age
The possibility of ice-age humans crossing oceans raises questions about their technology and logistics. The article suggests the presence of a mid-Atlantic mainland during the ice age that could explain the origin of Upper Palaeolithic cultures.
13. Was Troy really located in Turkey – if so why did it take Odysseus ten years to travel 200 miles get home to Greece.
Debunked-troy – AI (GPT4)View
The very ink with which history is written is merely fluid prejudice.– Mark Twain
Mutation of the Human Species
It also discusses the human species’ mutation and Troy’s location. Wilkens believes that the Trojan War and Troy’s location was in England and that the Celts were the participants. He uses etymological and archaeological evidence to support his theory. However, professional scholars have criticised his work.
Havana Harbour & Homer’s Odyssey
The topography of Havana’s harbour resembles the description of Telepylos in the Odyssey, leading some to believe that the Trojan War may have occurred in a different location, possibly in northwest Europe. Geoffrey of Monmouth’s Historia Regum Britanniae traced the foundation of Britain back to the Trojans.
Baltic Origins of Homer’s Epic Tales
The Baltic Origins of Homer’s Epic Tales proposes a revolutionary idea about the Iliad and Odyssey’s origins. Felice Vinci suggests that Homer’s tales of the Achaeans and the Trojan War took place in Northern Europe and the Baltic and Northern Atlantic seas. He supports his theory with evidence such as Mycenaean graves containing Baltic products and the incongruence between Homer’s description of the geography and
Mediterranean lands. The article proposes that locations in Homer’s
Odyssey, such as Scheria and Aeaea, could be identified with areas in
Norway, and suggests an ancient counterclockwise circumnavigation of Scandinavia may have occurred. The climate described in the story also fits better with the Baltic region than the Aegean. Similarities between Nordic and Homeric cultures include references to the midnight sun in battle, shared traditions, mythology, literature, and comparisons of Achaean and Viking ships and mythological figures.
Contradictions Found in Geography
Contradictions are found in the geographic location of events in Homer’s works.
Plato & Aristotle on Atlantis
Plato’s writings about Atlantis are the oldest known source of information and must be considered credible evidence of an ancient civilisation that existed, though its location is still debated among scholars. Aristotle believed that Atlantis and Troy might have been connected, while other ancient philosophers thought the story of Atlantis to be factual. The story of Atlantis was supposedly told to Solon by Egyptian priests who had access to secret records about the lost civilisation. The city of Sais in Egypt survived a supposed deluge that destroyed Athens and other Greek cities.
Location & Size of Atlantis
The location and size of Atlantis, as described by Plato’s writings, have caused much debate. Some theories suggest it was a Greek island, while others point to the Atlantic Ocean. The mention of “Asia” likely refers to Asia Minor. The search for the lost city of Atlantis failed due to the belief that it was located in the middle of the Atlantic Ocean.
New Hypothesis on Location
However, a new hypothesis suggests that Atlantis was a peninsula that included the British Isles, Scandinavia, and Northern European countries that were once connected during the Ice Age.
Causewayed Enclosures
Whitehawk Camp is one of England’s most important Neolithic sites, featuring a causewayed enclosure with evidence of newborn and human bones, flint tools, pot shards, and animal bones. This gave rise to the local legend of Troy Town and the three surviving historic turf mazes in England with “Troy” names.
Greek Mythology
Evidence suggests that Troy was located in a much colder climate than Greece, and the Achaeans were generally blond, while the Trojans were dark-haired. Scholars debate the hair colour of crucial characters in The Iliad and The Odyssey, including Achilles, Agamemnon, Odysseus, Menelaus, Idomeneus, and Helen. Other characters like Briseis, Meleager, and Agamede are also described. Additionally, Aphrodite, Apollo, Athena, Hera, and Zeus are described with physical attributes and roles attributed to them. Blonde or blue-eyed features are also noted for several of these figures.
Atlantis
Plato’s dialogues mention the advanced nation of Atlantis, which reportedly had over 1,200 warships, an unseen number for any other country in history.
Scientific Sources
The context includes various sources discussing archaeological surveys, environmental change, and geological research. It specifically explores floodplains, river terraces, and carbon storage in Southeast Europe, the Lower Thames Valley, and Somerset Levels. The context is a collection of scientific papers and field guides covering topics such as climate change, the Pleistocene era, and several archaeological surveys and excavations in the UK. It also contains a list of sources related to geological and archaeological topics, including Holocene river activity, Pleistocene deposits, and submerged forests. Finally, it provides references for studying past environments, such as archaeological landscapes, sedimentation patterns, peatlands, glaciations, and alluvial systems.
River Alluviation
Studies have found that rivers in the UK are subject to alluviation due to climate change. This process affects both the physical structure of the river and the sediment it contains.
Contamination Assessment
The contamination of rivers in the UK is a growing concern due to climate change and other environmental factors. As a result, scientists have conducted studies to assess the extent of contamination in the rivers and identify potential sources of contamination.
Holocene River Instability
The Holocene period has seen significant changes in the stability of rivers in the UK. These changes have had a significant impact on the environment, including changes to sedimentation patterns, erosion rates, and flooding patterns.
Ancient Metalwork
Archaeological studies have identified ancient metalworking sites in various parts of the UK. These sites provide essential evidence about ancient metalworking practices and technologies and insight into the broader cultural context of metalworking during this period.
Alluvial Archaeology
Alluvial archaeology is a field of study dedicated to understanding the archaeological record preserved in river sediments. This includes examining artefacts such as pottery fragments, tools, and other materials rivers have deposited over time.
Sea-Level Changes
Recent studies have shown that sea levels in the UK have risen due to climate change. This has significantly impacted coastal areas, including changes to landforms, erosion patterns, and flooding patterns.
Climate Reconstructions
Climate reconstructions are a field of study dedicated to understanding past climate conditions in various parts of the world. Scientists use multiple methods, such as ice core and tree ring analyses, to reconstruct past climate conditions and predict future trends.
Ice Sheet Melt
Ice sheets worldwide are melting at an unprecedented rate due to climate change. This has led to increased sea levels and changes to weather patterns, ocean currents, and other natural phenomena.
Peatland Development
Peatlands are essential ecosystems for storing carbon and providing habitat for various species. In recent years, there has been an increased focus on restoring and conserving peatlands in the UK due to their importance in combating climate change.
These are the synopsis from the Book ’13 Ancient Things that don’t make sense in History’ for further extracts from the book go to our dedicated WEBSITE or if you wish to purchase the book either in softback FULL COLOUR or HARDBACK black and white from Amazon. For further information about our work on Prehistoric Britain visit our WEBSITE or VIDEO CHANNEL.
Offa’s Dyke is seen as one of the two significant Linear Earthworks (of Britain) as it is supposed to be over 200 miles from Coast to coast dividing England from Wales and, consequently, was once one of the greatest battle grounds in history with this massive defence required to tame the barbaric hordes (like the Picts in Scotland) from the home of civilisation.
The problem with this flight of fancy is its complete nonsense, which this book can now testify. Sir Cyril Fox, in the 1950s, was most famous for producing his classic book ‘Offa’s Dyke – A field survey of the Western-Works of Mercia in the Seventh and Eight Centuries A.D.”, which detailed his field walking and observations on this most historic of Earth Battlements, which we have now seen from more scientific evidence available from LiDAR was nothing more than misinterpretations of the landscape to justify hypotheses that ‘didn’t hold water’ – but sadly for him, it did!
The harsh reality is that this ‘swiss cheese’ hypothesis was, as suggested, full of holes – over 200 of them, to be more exact, covering nearly 60% of this supposed Mercia defensive barrier with gaps large enough for people to walk through with ease.
Later archaeologists have attempted to remedy this false claim, yet it still is quoted by the likes of English Heritage, Historic Britain and CADW to fill the void of ignorance and lack of study. Consequently, this FIRST LiDAR study of Offa’s Dyke in detail has revealed many new truths which should progress our understanding of the past.
History
According to Historic England – Offa’s Dyke is the longest linear earthwork in Britain, approximately 220km, running from Treuddyn, near Mold, to Sedbury on the Severn estuary.
It was constructed towards the end of the eighth century AD by the Mercian king Offa, and is believed to have formed a long-lived territorial, and possibly defensive, boundary between the Saxon kingdom of Mercia and the Welsh kingdoms. The Dyke is not continuous and consists of a number of discrete lengths separated by gaps of up to 23km.
It is clear from the nature of certain sections that differences in the scale and character of adjoining portions were the result of separate gangs being employed on different lengths. Where possible, natural topographic features such as slopes or rivers were utilised, and the form of Offa’s Dyke is therefore clearly related to the topography. Along most of its length it consists of a bank with a ditch to the west.
Excavation has indicated that at least some lengths of the bank had a vertical outer face of either laid stonework or turf revetment. The ditch generally seems to have been used to provide most of the bank material, although there is also evidence in some locations of shallow quarries. In places, a berm divides the bank and ditch, and a counterscarp bank may be present on the lip of the ditch. Offa’s Dyke now survives in various states of preservation in the form of earthworks and, where sections have been levelled and infilled, as buried features.
Although some sections of the frontier system no longer survive visibly, sufficient evidence does exist for its position to be accurately identified throughout most of its length. In view of its contribution towards the study of early medieval territorial patterns, all sections of Offa’s Dyke exhibiting significant archaeological remains are considered worthy of protection.
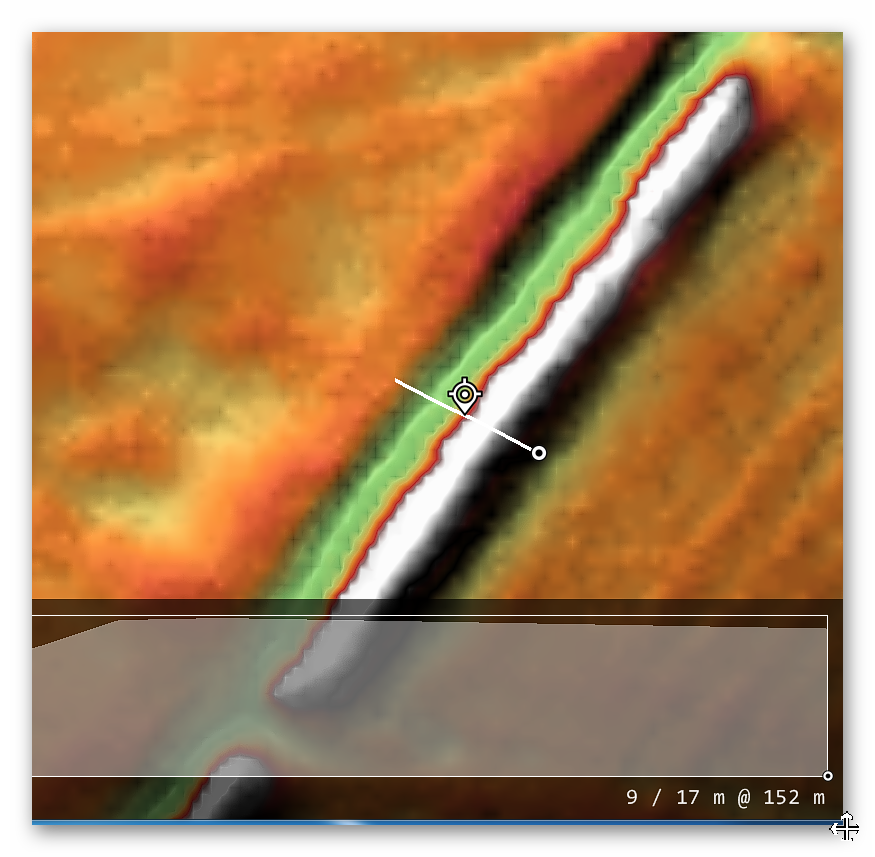
The reality is that Offa’s Dyke is a complete mystery to archaeologists and historians as it is incomplete and varies from section to section. This is the first LiDAR survey of this ‘Earthwork’ undertaken for its entire length and every metre that’s supposedly marked in the Landscape.
The consequences of this survey changes the nature and understanding of this ‘Dyke’ to such an extent that it re-invents the history of this Scheduled Monument, which will have repercussions for decades to come.
But first, we must lay the ground to allow readers to understand what we are seeing in Offa’s Dyke, and so the following three chapters have been written to give the reader this background of understanding.
Chapter 4 – Offa’s Dyke
To survey this Offa’s Dyke successfully, we need to link to other historic providers’ information and maps. To do this with relevant accuracy, we need to establish a grid system that looks at all the LiDAR, Satellite photography, Old OS maps and excavation evidence to draw new conclusions about the construction of Offa’s Dyke.
Therefore, we have subdivided Offa’s Dyke into five sections and named them A to E – each Section is not equally divided but edited by the breaks within the Dyke. We have named these sections from South to North, which is a bit different from the norm, but in archaeology, information is the best way to approach Offa’s Dyke as you will find when you get to Section E.
These grid sections include the OS 1800 Map edition (for historical accurately, as new developments are not included), Google Earth Maps (showing Historic England Scheduled Areas and References) and our LiDAR (hi-resolution) maps, which are unique in their clarity and ease of landscape interpretation.
We will also give you a complete overview of the Dyke by section before the detailed analysis within the appendices. This will provide you with an understanding of the Dykes construction phases and function, allowing you to understand better how we came to our conclusions about Offa’s Dyke and when it was constructed.
Offa’s Dyke – Sections
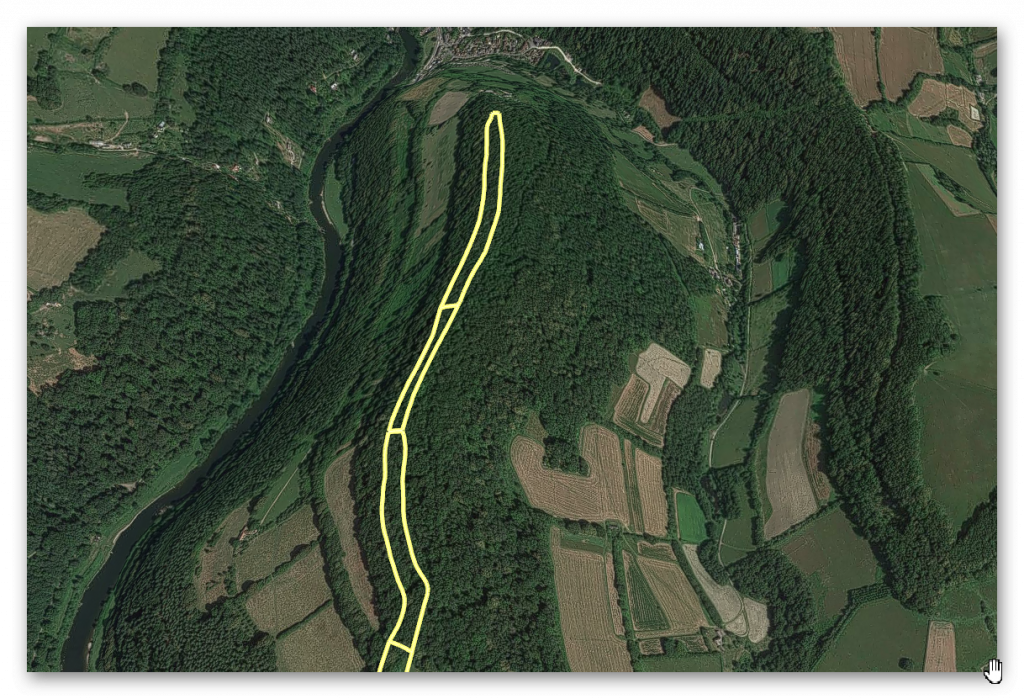
Offa’s Dyke Lidar Survey Sections – Offa’s Dyke (End of Section A)
Our Findings and Conclusion
Before we reflect on our findings section by section, it may be beneficial to look at the total statistics for some aspects of Offa’s Dyke, as such details have not been found in our research on this subject.
To illustrate the confusion over Offa’s Dyke and its interpretation, the length of the Dyke is now open to speculation as it has so many gaps. However, English Heritage has it as 82 miles (132 km) from Prestatyn in the north to Sedbury in the South and The Offa’s Footpath Trust – the charity set-up to promote the Dykes footpath suggests 176 miles (283 km) – slightly longer than Scheduled listing route.
While Historic England sits firmly in the middle with 137 miles (220 km) – We will look at Offa’s Dyke as it is commonly portrayed as a coast-to-coasts landscape feature covering 283 km (176 miles) from Sedbury Cliffs nr Chepstow to Prestatyn.
Sedbury Cliffs to Monmouth – 17.5 miles (28 Km)
Monmouth to Pandy – 16.75 miles (27 Km)
Pandy to Hay-on-Wye – 17.5 miles (28.2 Km)
Hay to Kington – 14.75 miles (23.3 Km)
Kington to Knighton – 13.5 miles (21.7 Km)
Knighton to Brompton Crossroads – 15 miles (24 Km)
Brompton Cross to Buttington Bridge – 12.3 miles (20 Km)
Buttington Bridge to Llanymynech – 10.5 miles (17 Km)
Llanymynech to Chirk Mill – 14 miles (22.5 Km)
Chirk Mill to Llandegla – 15.5 miles (25.7 Km)
Llandegla to Bodfari – 17.5 miles (28 Km)
Bodfari – Prestatyn – 12 miles (19 Km)
Offa’s Dyke
The Total length of Offa’s Dyke (including gaps and missing sections) 279,745m (173.8 miles)
Total length Found (by LiDAR): 95,044m (59.2 miles) – 34% of the entire length
Total length Missing (by LiDAR): 185,476m (114.6 miles) – 66% of the entire length
Total number of Gaps in the Offa’s Dyke – 70
Total number of Scheduled Monuments in Listing: 237
Features
Within the 59.2 miles of Offa’s Dyke, we have identified – within 200m of the construction:
118 (33 Natural Springs)/Wells/Ponds (as specified by the 1800 OS maps series – Wells and Ponds included to show high water table)
303 Quarries/Bell Pits (Bell Pits Ancient Quarry Holes) ave of 5 Quarries per mile of Dyke
12 Prehistoric Ancient Sites
4 Barrows
7 Roman Sites
52% of Sections are linked to each other
20% of Sections are connected to existing rivers
28% of Sections join Paleochannels
Summary
Section A – Total 20,201m. 14 Gaps – 6,758m missing (34%)
Section B – Total 110,545m. 10 Gaps – 106,768 missing (97%)
Section C – Total 55,905m. 17 Gaps – 7,990 missing (14%)
Section D – Total 56,369m. 22 Gaps – 29,848 missing (53%)
Section E –Total 36,725m. 7 Gaps – 33,101 missing (90%)
Our findings concluded that these landscape features are much more interesting and complex than the archaeologists currently imagine, as each Section has its individual interest that finally gives us a solution to the construction and functionality of the Dyke.
Section A – Runs around the hills surrounding Chepstow and the River Wye. This Dyke is no boundary or marker as the river would be a better solution to both causes. But what it does show is the connection to Quarries and Roman Roads that would have probably linked to the canal system it inherited from the ancient Dyke builders. These ‘linear earthworks’ were created to assist in trade during both prehistory and later Roman era until the canals dried up when the roads built upon the banks of these Dykes replaced the method of transport.
Section B – Shows why the Dyke is not interconnected, as 97% of it is missing, and there is not functionality or design that links together the small portions of Dyke that is in this section.
Section C – Has the least missing sections, yet it still has 14% missing with 17 gaps, indicating that these Dykes are a series of individual trading canals and not a single entity. This trading can be seen in the extensive quarries in this area which have been mined for their mineral wealth for thousands of years.
Each hill has a different design form the last when it comes to width and Depth of the Ditch. What we are seeing is a degree of uniformity in access to quarries and water sources and natural springs along the Dyke.
Section D – This is a 50/50 series of Dyke to gap ratio, again showing that it is connected to Quarries and Mining, particularly Coal Mining, which was widely used by the Romans. These are some of the largest coal mines in Britain and the Dyke does not just come close – it in some cases the alignment goes through the middle of these quarries, with on average four quarries per section which makes any suggestion that these Dykes were not used in conjunction with the minerals being extracted (as we see also in The Vallum at Hadrian’s Wall) and were constructed for another purpose as completely absurd.
Section E – Even archaeologists (including Fox) now admit that this is a different series of Dykes (Whitford Dyke) and not part of Offa’s Dyke as its too dysfunctional.
So, our conclusion about Offa’s Dyke is that we are looking at a series of working Dykes – originally, built in prehistoric times and then utilised (as again we found in The Vallum) by the Romans to service the same Quarries for trading purposes.
In particular we see this Roman influence in Section D as these are Coal minerals which we know they used to heat the hypocaust underfloor furnaces of their Bath and home houses, which to date archaeologist have failed to investigate the sources of this coal and how it was transported.
Appendices
End of Section A
Name (Section)
Highbury Plains, 370m west of Birt’s Barn: (A37)
1020479
Width(m)
Hght/Dth(m)
Length(m)
Bank
10
1.0 – 2.5
360
Ditch (facing)
8
0.4
ESE – ENE
Gap/Spring/Quarry
0
1
1
“In this section, the Dyke is visible as a bank with quarry pits. The bank is about 10m wide at its base and stands to a maximum height of 2.5m on its western face and 1m on its eastern face. To the east of the bank are a series of quarry pits which are up to 8m wide and 0.4m deep.
Deliberately laid stonework has been exposed at intervals along the western face of the bank, and may be interpreted as the remains of a dry stone revetment acting as a near vertical, and highly visible, facing to the western side of the Dyke.
The lime kiln shown by the Ordnance Survey to the east of the line of the Dyke is in a ruinous condition and is thought to date to the 19th century. The line of the Dyke is interrupted by a track which is now called Coxbury Lane and is thought to be an ancient routeway leading to Wyegate, an early medieval manor about 2km to the south of the point where the lane crosses the Dyke at Highbury.” – Historic England
Name (Section)
Highbury Plains, 770m South West of Glyn Farm (A38)
1020478
Width(m)
Hght/Dth(m)
Length(m)
Bank
4 – 12
0.8 – 2.0
284
Ditch (facing)
4 – 8
1.0
East
Gap/Spring/Quarry
0
0
0
“In this section the Dyke runs for some 284m and is visible as a bank with quarry ditches to the east.
The bank runs along the edge of a steep slope and is between 4m and 12m wide at its base, standing to a maximum height of 2m on its western face and 0.8m on its eastern face.
The quarries, from which material was excavated during construction of the monument, are between 4m and 8m wide and up to 1m deep. The narrowness of the bank in places may be due to later quarrying, which appears to have taken place throughout this area.” – Historic England.
“In this section, the Dyke runs for some 579m, and is visible as a terrace with a berm to the west and quarry pits to the east.
The hillside across which the Dyke runs is exceptionally steep, and the berm marks an artificial break in the slope, allowing the terrace to form a false crest to the slope. The berm is between 4m and 6m wide, and the terrace stands approximately 4m above it.
To the east of the terrace and berm, the quarry pits have been dug into the crest of the hill and are up to 1m deep, and between 4m and 8m wide.” – Historic England.
GE Map (all three sections)
1020478 – GE – Offa’s Dyke (End of Section A)
OS Map (First Section)
1020479 – OS – 1020478 – Offa’s Dyke (End of Section A)
LiDAR Map
1020479 – lidar 1020479 – Offa’s Dyke (End of Section A)
1800 Map
1020479 – 1800s – Offa’s Dyke (End of Section A)
Conclusion
What should be noted is that the Dyke seems to come to an end at the top of the hill and then seems to swing down to the East with a bank and ditch at a later date not identified by archaeologists – but strangely it has not turned into a modern trackway using the Dykes bank as we have seen previously.
Coxbury Lane is made from a natural prehistoric ‘hollow’ and is very deep in places (much more profound than Offa’s Dyke), which would lead us to believe that this Paleochannel would have been flowing with water and effectively meet the Dyke, either terminating Offa’s Dyke of supplying it with water.
This section of Offa’s Dyke officially ends in the hills above the River Wye. But the Dyke at the top of the Hill is extremely ‘thin’ on features. What is of interest on top of this hill is another quarry and maybe the reason for the Dykes original construction.
Figure 63 – Even More quarry pits at the start of this section on top of the hill – Section AFigure 62 – end of Offa’s Dyke on top of the hill with a large Quarry immediately to the right – Offa’s Dyke (Section A)
Section A is the most southernly 11 miles from Offa’s Dyke, and from the new statistics, we can now make some assumptions about the Dyke and its PROBABLE function. The traditional view of Offa’s Dyke (and hence his name) is a defensive earthwork to keep out the Welsh to the West.
The statistics do not support this hypothesis. The most obvious problem is that only 5% of Section A of the Dyke, faces only West; in fact, a higher percentage, 15% faces the utterly wrong way (East), and the majority (38%) has ditches on BOTH sides of the bank.
Figure 64 – 11-mile section showing it was never a continuous feature – with banks on both East and Wes side and gaps in River Valleys – which fit the shoreline of prehistoric times – Offa’s Dyke (End of Section A)
If the Earthwork were defensive, you would also expect the Counterscarp (which traps people in the ditch in theory) would be seen throughout – yet only 19% of this section has this feature. Moreover, the 14 Gaps open up a third (31%) of Section A for the enemy to walk through without difficulty.
This is the same as the idea of a political border marker. For this to be acceptable, the only feature you require is the Bank – which we do have. But again, there is no reason that 31% of the Boarder Marker is missing – especially when the Dyke follows the contours of the River Wye just some 500 metres to the East.
It is somewhat remarkable that archaeologists could imagine that the medieval cultures would not use the river as a marker (and/or a defensive barrier) rather than an earthwork which has a third missing (6,115m in this section) and as we will also see to a greater extent in Section B another 115,765m missing on top, to disqualify this irrational theory.
Offa’s Dyke book on Amazon
This was an extracts from the NEW Book Ancient Prehistoric Canals (Dykes) – Wansdyke available on Amazon as a FULL COLOUR HARD BACK (£49.95) or a ECONOMY (£9.99) SOFTBACK black and white VERSION– it is also available as aKINDLE (£2.99) book. For further information about our work on Prehistoric Britain visit our WEBSITE or VIDEO CHANNEL.
Product details
ASIN : B0BQG7G6CJ
Publisher : Independently published (24 Nov. 2022)


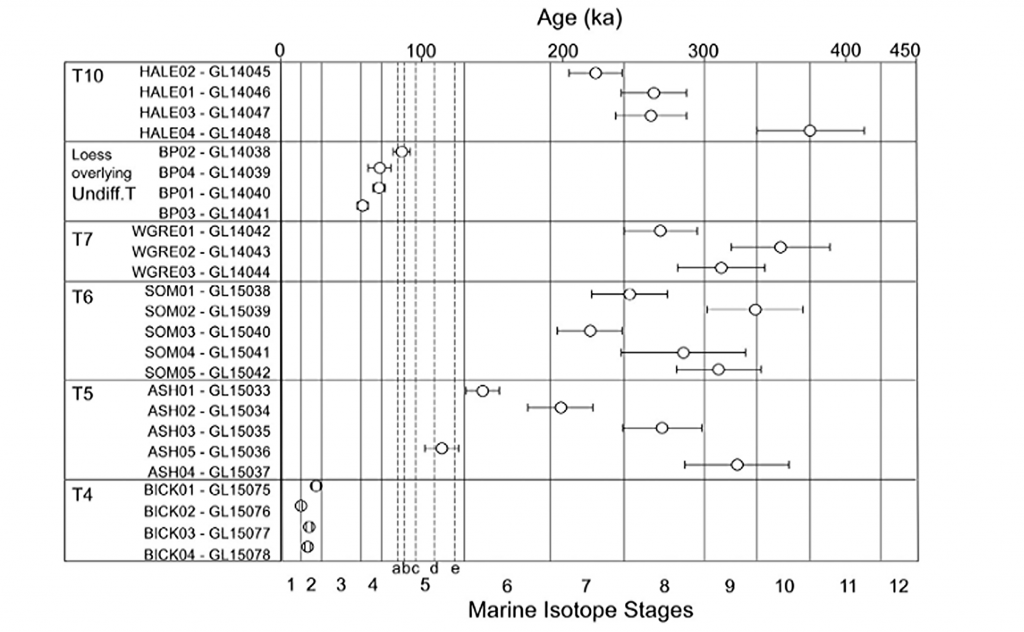
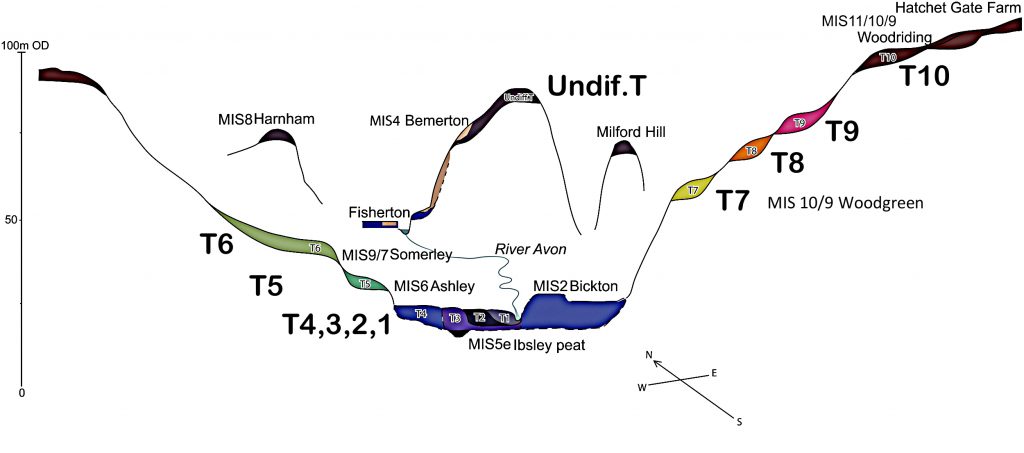
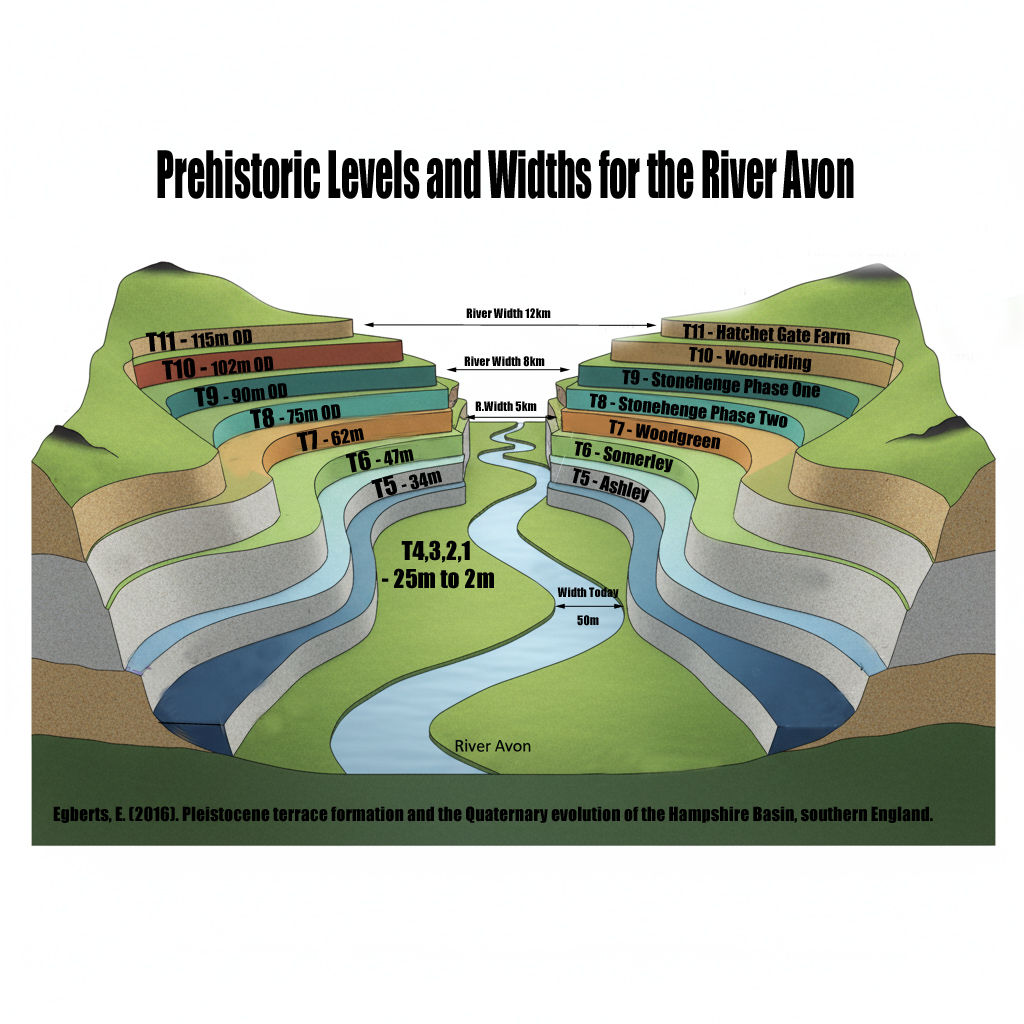
 How much bigger was the Avon?
 What does this mean for Stonehenge?
 Why this matters:
 The real question is not if Stonehenge was surrounded by water. It is when, and how many times it happened during its long prehistory.